Evaluating hydraulic parameters in clays based on in situ tests
-
 ,
,

Abstract
The permeability of soil is an important factor controlling the flow of water through the subsoil. The article presents the results of studies of hydraulic parameters for overconsolidated clays using in situ tests. Using the excess pore pressure normalization technique, both in the case of monotonic and dilatory dissipation tests, and the time at which 50% dissipation of excess pore water pressure takes place, as well as taking into account the rigidity index of the analyzed soil, it was possible to estimate the permeability and consolidation coefficients for the analyzed clays. Based on these studies, simple relationships between the permeability coefficient and the soil behavior-type index are proposed. Proposed formulas may be applied for overconsolidated cohesive soils with soil behavior-type index values within the range of 2.05–3.30 and described in Robertson’s chart as overconsolidated silty clays, clays and heavily overconsolidated and cemented fine-grained soils. Although our proposal of determining flow parameters has been calibrated only for two analyzed cases, its utility for wider use in other overconsolidated fine-grained soils may also be taken into account.
1 Introduction
The properties of fine-grained soils are of interest to many researchers involved in the study of the influence of factors related to the properties of the flowing fluid (e.g., viscosity and density) and the soil medium (e.g., void ratio, effective stress, and degree of water saturation) on hydraulic permeability. Hydraulic parameters of the soil medium are used in environmental and geotechnical studies [1,2,3], to assess the impermeability of filtration diaphragms in hydrotechnical structures [4,5], and the prediction of ground settlement under engineering structures [6]. Thus, the evaluation of the hydraulic parameters and the assessment of the speed of water flow in the soil medium in many cases are crucial.
Soil permeability may be obtained from direct methods, such as field studies [5,7,8,9] and laboratory investigations [10,11], as well as indirect ones. The latter include, e.g., determining hydraulic permeability from grain size distribution curves [12,13,14], consolidation tests [15], based on the analysis of the dissipation time of excess pore water pressure [16,17,18,19,20] and dissipation time of the A or C readings in Marchetti’s dilatometer tests [21,22,23].
One of the commonly used methods to evaluate hydraulic parameters is the CPTU test (cone penetration test with pore pressure measurements – general information on the design and methodology of the CPTU tests is widely reported in the literature [16,17,18] and is briefly described in Section 2.3). Large values of excess pore pressures (Δu) are generated during this test. The soil hydraulic parameters can be determined from peak fluid pressure recorded on-the-fly [24] or by measuring the time at which the excess pore water pressure is dissipated [16,17,18].
The results of dissipation tests from CPTU analysis are presented in the form of a relationship between the logarithm or square root of time and normalized pore pressure. Dissipation curves obtained during the investigations may be standard (monotonic), when the excess pore pressure disappears from the moment when the probe stops. The coefficient of permeability can be determined based on time t 50 directly from Parez and Faureil equation [25] or with measured time for each degree of consolidation and the corresponding time factor (T) derived from the two main analytical approaches: cavity expansion theory and strain path method, if the observed dissipation curve matches the theoretical models [26,27,28].
Non-standard dissipation curves are characterized by further increase of the excess pore pressure to a maximal value (Δu 2max), followed by its decrease [16,17,29,30,31]. This type of dilatory response is observed, e.g., in heavily overconsolidated soils, and as has been already described and discussed by Ha et al. [32], in soils in higher over consolidation ratio (OCR) values, a higher excess pore pressure is expected to propagate and dissipate. In the case of dilatory dissipation, the standard approach for interpreting dissipation results in normally consolidated soils cannot be applied, since dissipation does not follow the theoretical response, i.e., monotonic reduction with time. To approximately assess coefficient of consolidation (c h) from the dilatory dissipation curve, empirical data modification techniques, such as the offset method and the square root of the time plot correction method, have been suggested [30,33,34]. Chai et al. [34] carried out a numerical simulation of piezocone penetration and dissipation employing the theory of contact mechanics and proposed an empirical equation for correcting the value of t 50 to interpret the dilatory dissipation curve as used in the calculations in this article.
Performing dissipation analysis during CPTU tests and interpretation of the obtained results are linked with numerous issues. They include correct air removal from the measurement system of the cone [28,35], restricted test duration [36], assessment and interpretation method of the dissipation results – e.g., incomplete dissipation curves [19,20] or correct determination of time t 50 from non-standard curves [20,34].
There are very few solutions for determining the permeability coefficient based on CPTU tests presented in the literature omitting parameters obtained from dissipation tests. These on-the-fly methods offer an alternative approach in which hydraulic parameters are directly linked to CPTU penetration measurements. Examples of such solutions are empirical relationships [35,37] for assessing the permeability coefficient based on soil behavior-type index, normalized cone resistance and normalized friction ratio which are calculated as follows:
where Q
t is the normalized cone resistance (−), F
r is the normalized friction ratio (%), q
t is the corrected cone resistance (MPa),
One of the methods that allows us to calculate the permeability is based on combining dislocation and cavity expansion analysis [24,38] (further developed by Shen et al. [39] and Monforte et al. [40]). Elsworth and Lee proposed the following relation:
where Δu is the excess water pressure at u 2 position (MPa), v is the rate of cone advance (m/s), r is the radius of the cone (m), γ w is the water unit weight (MN/m3), k is the coefficient of permeability (m/s), and K D is the dimensionless permeability (−).
The dimensionless permeability can be determined directly from the CPTU metrics: normalized cone resistance and pore pressure ratio according to:
where B q is the pore pressure ratio (−).
Elsworth and Lee’s proposal to use on-the-fly method based on K D ratio according to some researchers [24], does not allow us to estimate the coefficient of permeability in overconsolidated cohesive soils which are the subject of this research.
This article focuses on the evaluation of the consolidation and permeability coefficients of soils based on monotonic and dilatory dissipation results of piezocone tests in overconsolidated clays as well as those cemented. The calculations were based on various empirical relationships proposed by Torstensson [26], Teh and Houlsby [27], Parez and Faureil [25], and Robertson and Cabal [41]. Non-standard dissipation curves have been corrected according to the recommendations of Sully et al. [30] and Chai et al. [34]. Due to the difference between the various approaches, the authors proposed to evaluate the permeability directly from the CPTU metrics. First to be proposed is a formula for determining the coefficient of permeability based on the soil behavior-type index I c. Results of CPTU tests were verified using data from the BAT groundwater monitoring system. Values of the permeability coefficient obtained from BAT soundings were treated as reference ones.
2 Methods
2.1 Location and characteristics of the test sites
The first test site – SGGW Campus – is located in the southern part of Warsaw, Poland (Figure 1). It covers the margin of a denudated moraine plateau in the marginal zone of the Vistula River valley. In the Ursynów district, its deposits form a continuous, distinct layer, consisting mostly of fine sands. Above the fluvioglacial sediments occur glacial deposits from the Odranian Glaciation, represented by grey boulder clays. The thickness of the clay layer is from several to tens of meters and in the case of the SGGW Campus it is between 6 and 10 m. In some places, the Odranian boulder clays are covered by fluvioglacial sands and gravels and/or ice-dammed silts. Above them or directly on the boulder clays, occur glacial tills from the Wartanian Glaciation (the last glaciation in this area).
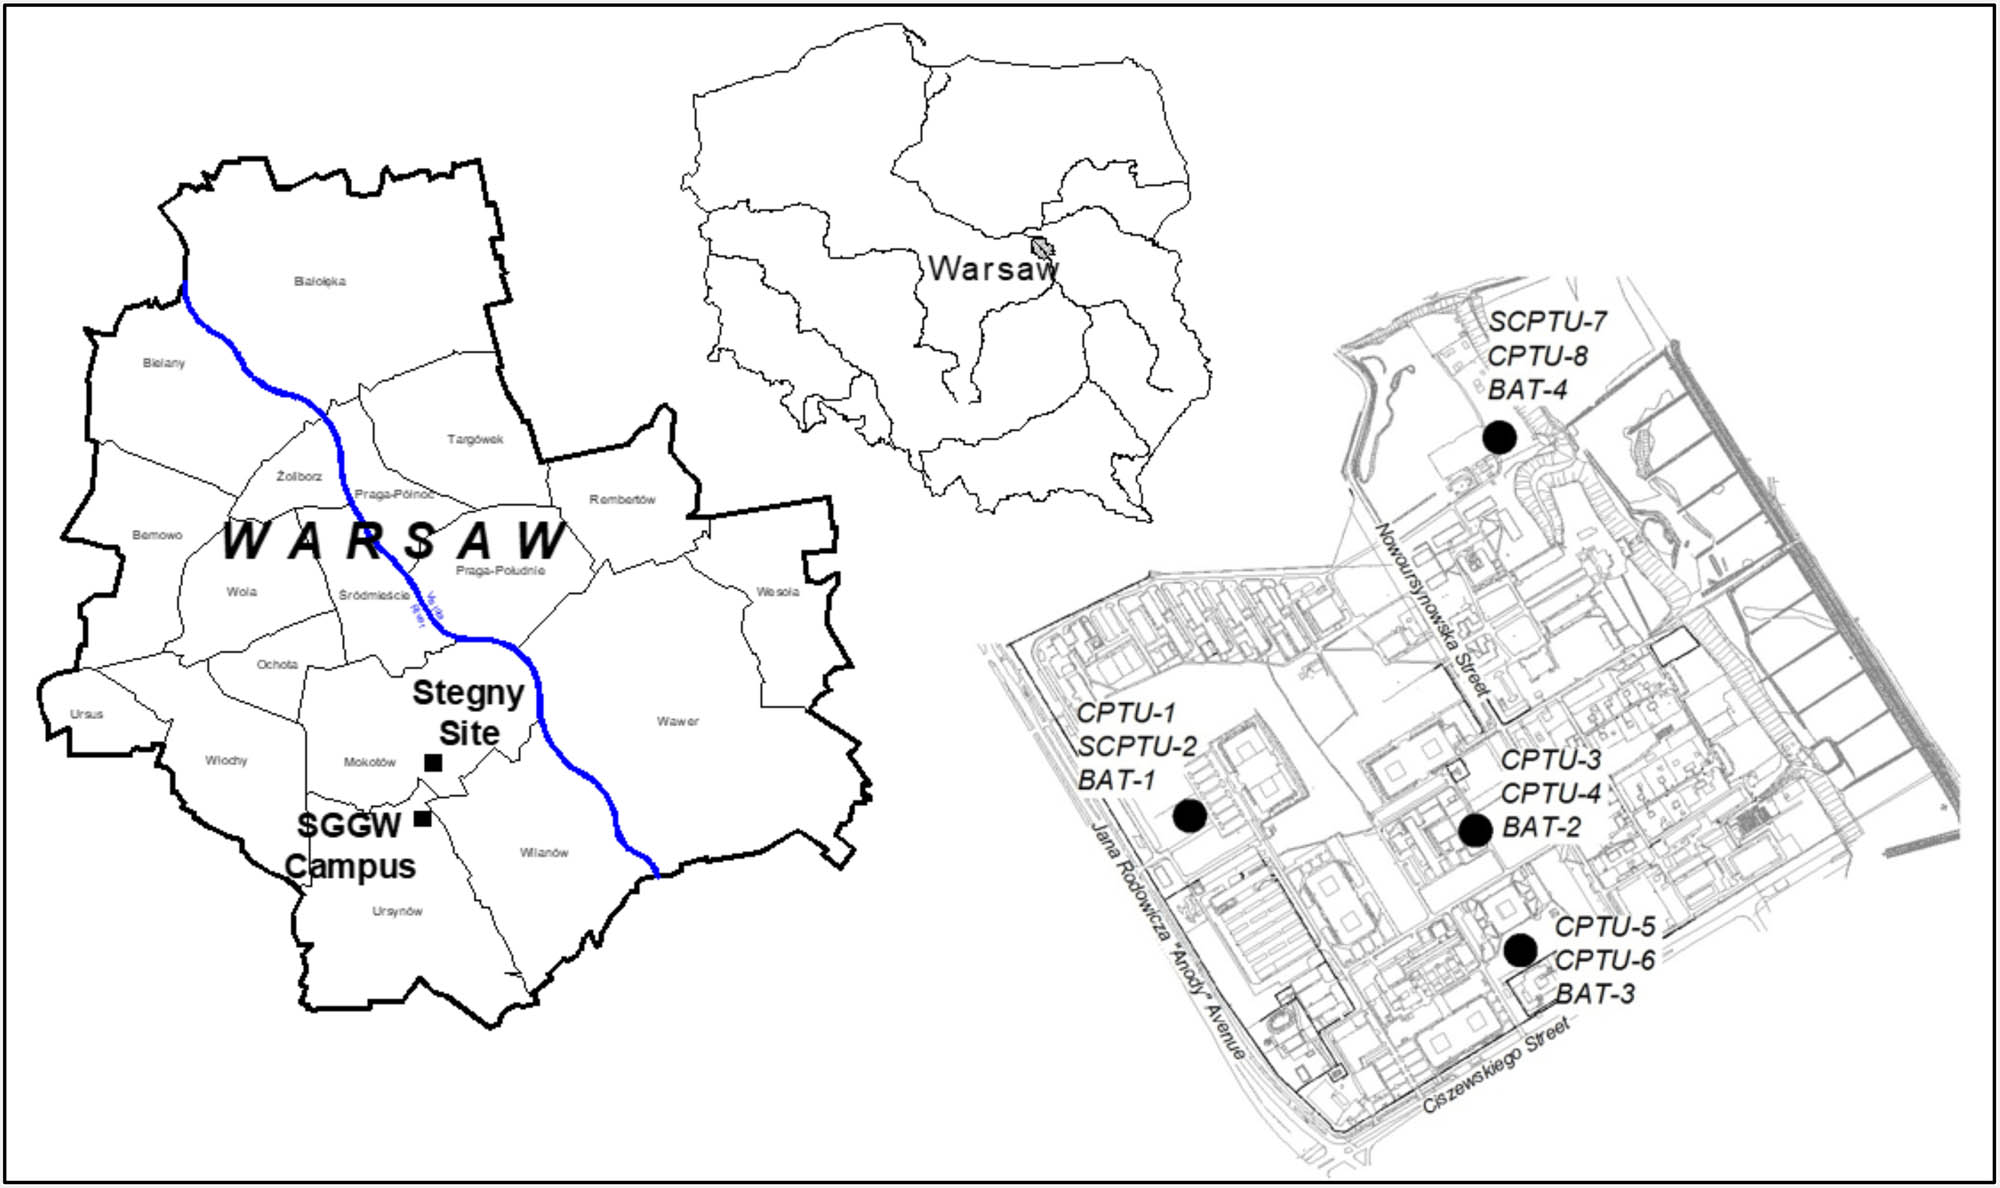
Location of the SGGW campus and the Stegny site.
Considering the physical and mechanical soil properties in the SGGW Campus test site, there are four geotechnical layers. The first layer, with a thickness of about 3 m, consists of fluvioglacial sediments of the Wartanian Glaciation: medium and fine sands (MSa, FSa), with a relative density D r = 0.35–0.55. The second layer (about 3 m thick) comprises brown glacial boulder clays (sisaCl) of the Wartanian Glaciation and sandy clays (saCl), with a consistency index I c = 0.9–1.0. The third layer (about 4 m thick) includes grey glacial boulder clays (sisaCl) of the Odranian Glaciation and saCl with boulders, with a consistency index I c = 0.88–1.0. The last layer underlies the fluvial deposits of the Mazovian Interglacial: fine and medium-grained sands in the top of a very dense layer with relative density D r = 0.8–0.9.
In situ investigations were conducted at four localities on the SGGW Campus site and included CPTU, SCPT (seismic cone penetration test), and BAT (groundwater monitoring system [7]) tests. The position of these localities and the survey points is shown in Figure 1. Moreover, the chart proposed by Robertson based on CPTU test results was used to verify the soil types obtained in the profile. This nomogram clearly illustrates the differences between the brown and grey boulder clays. It indicates significant overconsolidation and cementation of the brown clay (Figure 2).
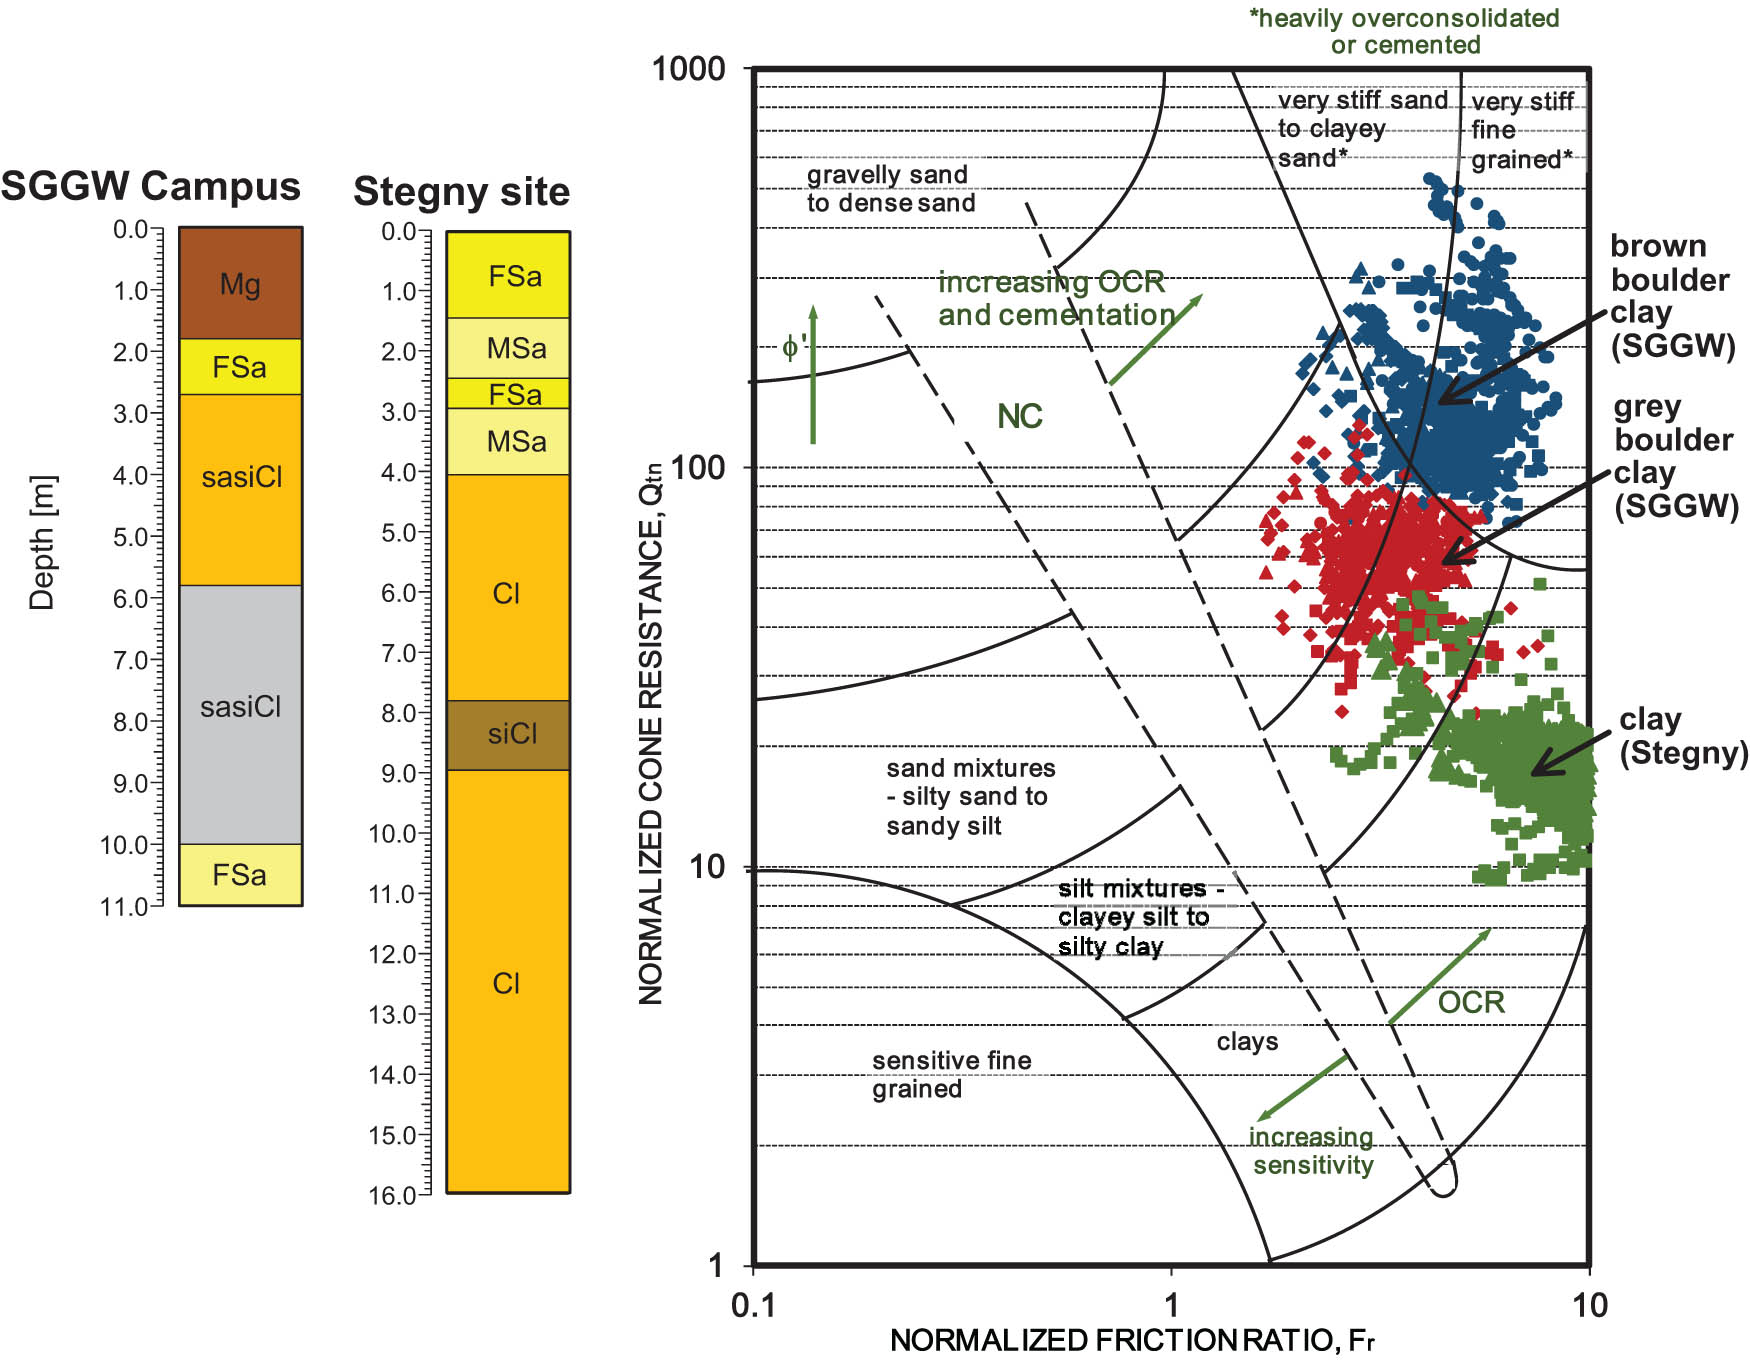
Typical borehole profiles and the chart of Robertson based on CPTU tests.
The second test site – the Stegny site – is located northeast of SGGW campus in a Vistula River (Figure 1). For several years, an extensive research program has been carried out here by the Warsaw University of Life Sciences and other research institutions. The main purpose of this study was to evaluate the clay parameters and to protect the water intake located at the site. The stratigraphy consists of Quaternary deposits developed as fine and medium dense sand up to a depth of 4.5 m. The underlying layers consist of high plasticity clays with random traces of silt.
The three CPTU tests and the closest BAT measurements were used to interpret the data. The Robertson’s chart (Figure 2) indicates that the investigated cohesive soils are overconsolidated clays (Cl) and silty clays (siCl).
2.2 Site investigation methods
CPTU soundings are commonly applied in engineering practice for many years. The methodology and interpretation of the results, including assessment of hydraulic parameters, have been widely discussed in numerous reports [17,29,41,42]. Data from dissipation tests in CPTU analysis are interpreted using empirical relationships and nomograms commonly applied in engineering practice and based on the correlation between data measured in the field and data from laboratory investigations. BAT tests, as opposed to dissipation of excess pore water pressure, are based on actual measurements of the volume of water flowing into the medium. Analysis of hydraulic permeability includes injecting water from the measurement unit to the surrounding soil through a filtering gage (outflow test) or by groundwater uptake from the surrounding soil (inflow test). Pressure change in the measurement device allows us to calculate the permeability coefficient according to the formula proposed by Torstensson [7].
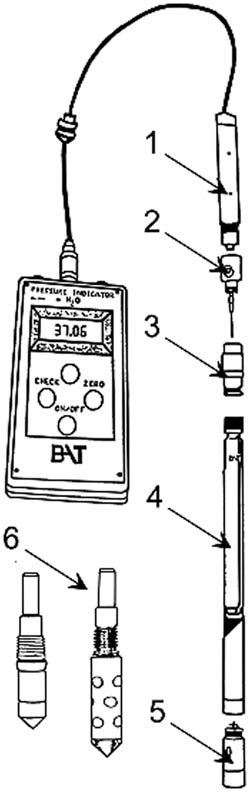
Table 1 presents the schemes, description, and application of the described probes, whereas Table 2 lists the relationships allowing us to calculate the consolidation and permeability coefficients based on CPTU and BAT tests.
Schemes of geotechnical probes used in the tests
| Scheme | Description | Application |
|---|---|---|

|
CPTU | Identification of the soil type
|
| 1 – Friction sleeve | ||
| 2 – Filter | ||
| 3 – Cone | ||
| CPTU sounding consists in pushing the cone penetrometer into subsoil at the rate of penetration about 20 mm/s. The standard cone installed at the end of the rods has an apex angle of 60° and a 10 or 15 cm2 base area | ||
| relative density (D r), consistency index (I c), undrained shear strength (s u = τ fu), effective vertical stress (σ v0′), OCR, coefficient of earth pressure at rest (K 0), constrained deformation modulus (M), Young’s modulus (E), initial shear modulus (G 0), coefficient of permeability (k), coefficient of consolidation (c h), shear wave velocity measurements (V s), electrical resistivity measurements (SCPTU and RCPTU cones) | ||
| During the CPTU test, the following data are recorded: depth, cone resistance (q c), sleeve friction resistance (f s), and pore pressure behind the cone (u 2) | ||
|
BAT System |
|
| 1 – Pressure transducer | ||
| 2 – Transfer nipple with hypodermic needle | ||
| 3 – Extension adapter | ||
| 4 – Test container | ||
| 5 – Quick coupling sleeve | ||
| 6 – Filter tips – with a diameter of 30 mm and a height of 100 mm | ||
| The BAT system enables the monitoring of the water-soil environment and the determination of the parameters of water flow in in situ conditions. The measuring unit is a set of membranes, needles, glass test containers and a pressure transducer. Installation of the BAT groundwater monitoring system is similar to a CPTU cone and uses rods of very similar size (rods differ only in internal diameter) |
Relationships determining the hydraulic parameters used in the calculations
| Empirical relationship | Author | Explanations of symbols | |
|---|---|---|---|
| CPTU |
|
Torstensson [26] | c h – coefficient of consolidation (m2/s) |
| k – coefficient of permeability (m/s) | |||
| t 50 – measured time for 50% dissipation (s) | |||
| T 50 – theoretical time factor (−), (u 2 − T 50 = 1.2) | |||
|
|
Parez and Fauriel [25] | ||
| T* – modified time factor (−), (T* = 0.245) | |||
| I r – rigidity index (I r = G/s u) | |||
|
|
Teh and Houlsby [27] | ||
| r 0 – penetrometer radius (m), (r 0 = 0.0178) | |||
|
|
Robertson [43] | ||
| BAT |
|
k – coefficient of permeability (m/s) | |
| P 0 – initial container pressure (m) | |||
| Torstensson [7] | |||
| t – time (s) | |||
| u 0 – hydraulic pore pressure (m) | |||
| P t – container pressure in time (m) | |||
| F – filter constant (−) | |||
2.3 Saturation of piezocones
Measurement of correct pore pressure values requires appropriate preparation of all elements of the measuring system. To achieve good pore pressure response during a piezocone test, it is necessary to have a very rigid pore pressure measuring system and a fully saturated system. The fluids used to saturate usually include de-aired water, silicone oil, or glycerine.
Historically, de-aired water was a commonly used saturating fluid, although water presents problems at low temperatures; maintaining saturation before penetration below the groundwater level may also be difficult [28]. It may also lead to loss of filter saturation, especially when testing heavily overconsolidated soils. In contrast, silicone oil and glycerine are characterized by high density and high surface tension, which makes them less susceptible to being sucked out of the filter during testing. However, these characteristics may also pose issues to the equipment and personnel.
A commonly used procedure for saturation of the filter element is to place it in the saturation fluid in an airtight container and then subject it to high vacuum for about 2 h [28]. A glycerine was used as the saturation fluid, following the procedures proposed by Robertson and Campanella [44] and Larsson [45], with some modifications.
The method used herein has been tested many times and has already been patented [46]. The filter saturation process consists of two stages. In the first stage, filters immersed in warm glycerine (60°C) are vibrated (at a frequency of about 38 kHz) in an ultrasonic cleaner for 60 min (Figure 3a). In the second stage, the filters and glycerine are placed in a container and vibrated at 50 Hz on a vibrating table for 45 min. The next stage, according to the procedure described by Larsson, consists of placing the filter and cone in a rubber funnel, pouring glycerine over the whole object (Figure 3b and c), assembling the cone and securing it with a protective rubber sleeve (Figure 3d).
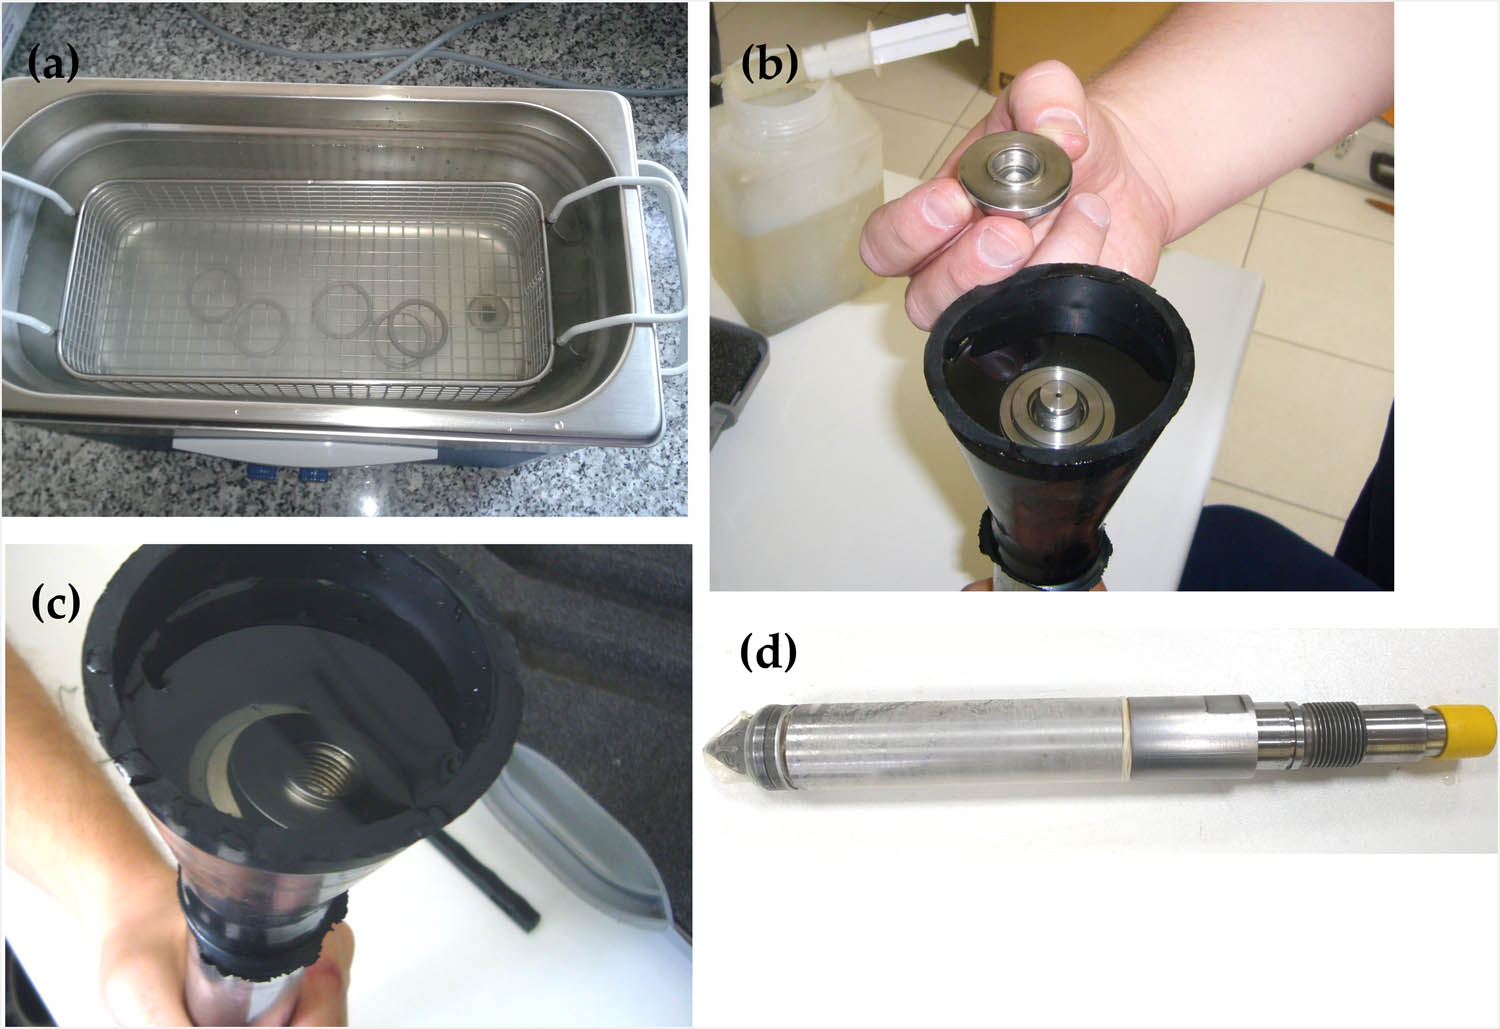
De-airing (a), mounting filter element (b and c) and protecting the cone (d) when using glicerine.
3 Results and discussion
Results of CPTU and SCPTU tests carried out at SGGW Campus are presented in Figure 4, i.e., normalized cone resistance – Q tn, sleeve friction resistance – f s, friction ratio – R f, pore pressure – u 2, normalized soil behavior type index I c, and shear wave velocity V s. The results obtained from four different localities in the SGGW Campus test site do not differ significantly, and the values of index I c and the shear wave velocity V s indicate the presence of identical soils in the analyzed profile (depth interval 4–10 m) within the entire object. Shear resistance of the brown clay attains values s u = 250–350 kPa, and of the grey clays s u = 200–300 kPa. The rigidity index of the analyzed soils oscillates at about I r ≈ 175 and I r ≈ 150.
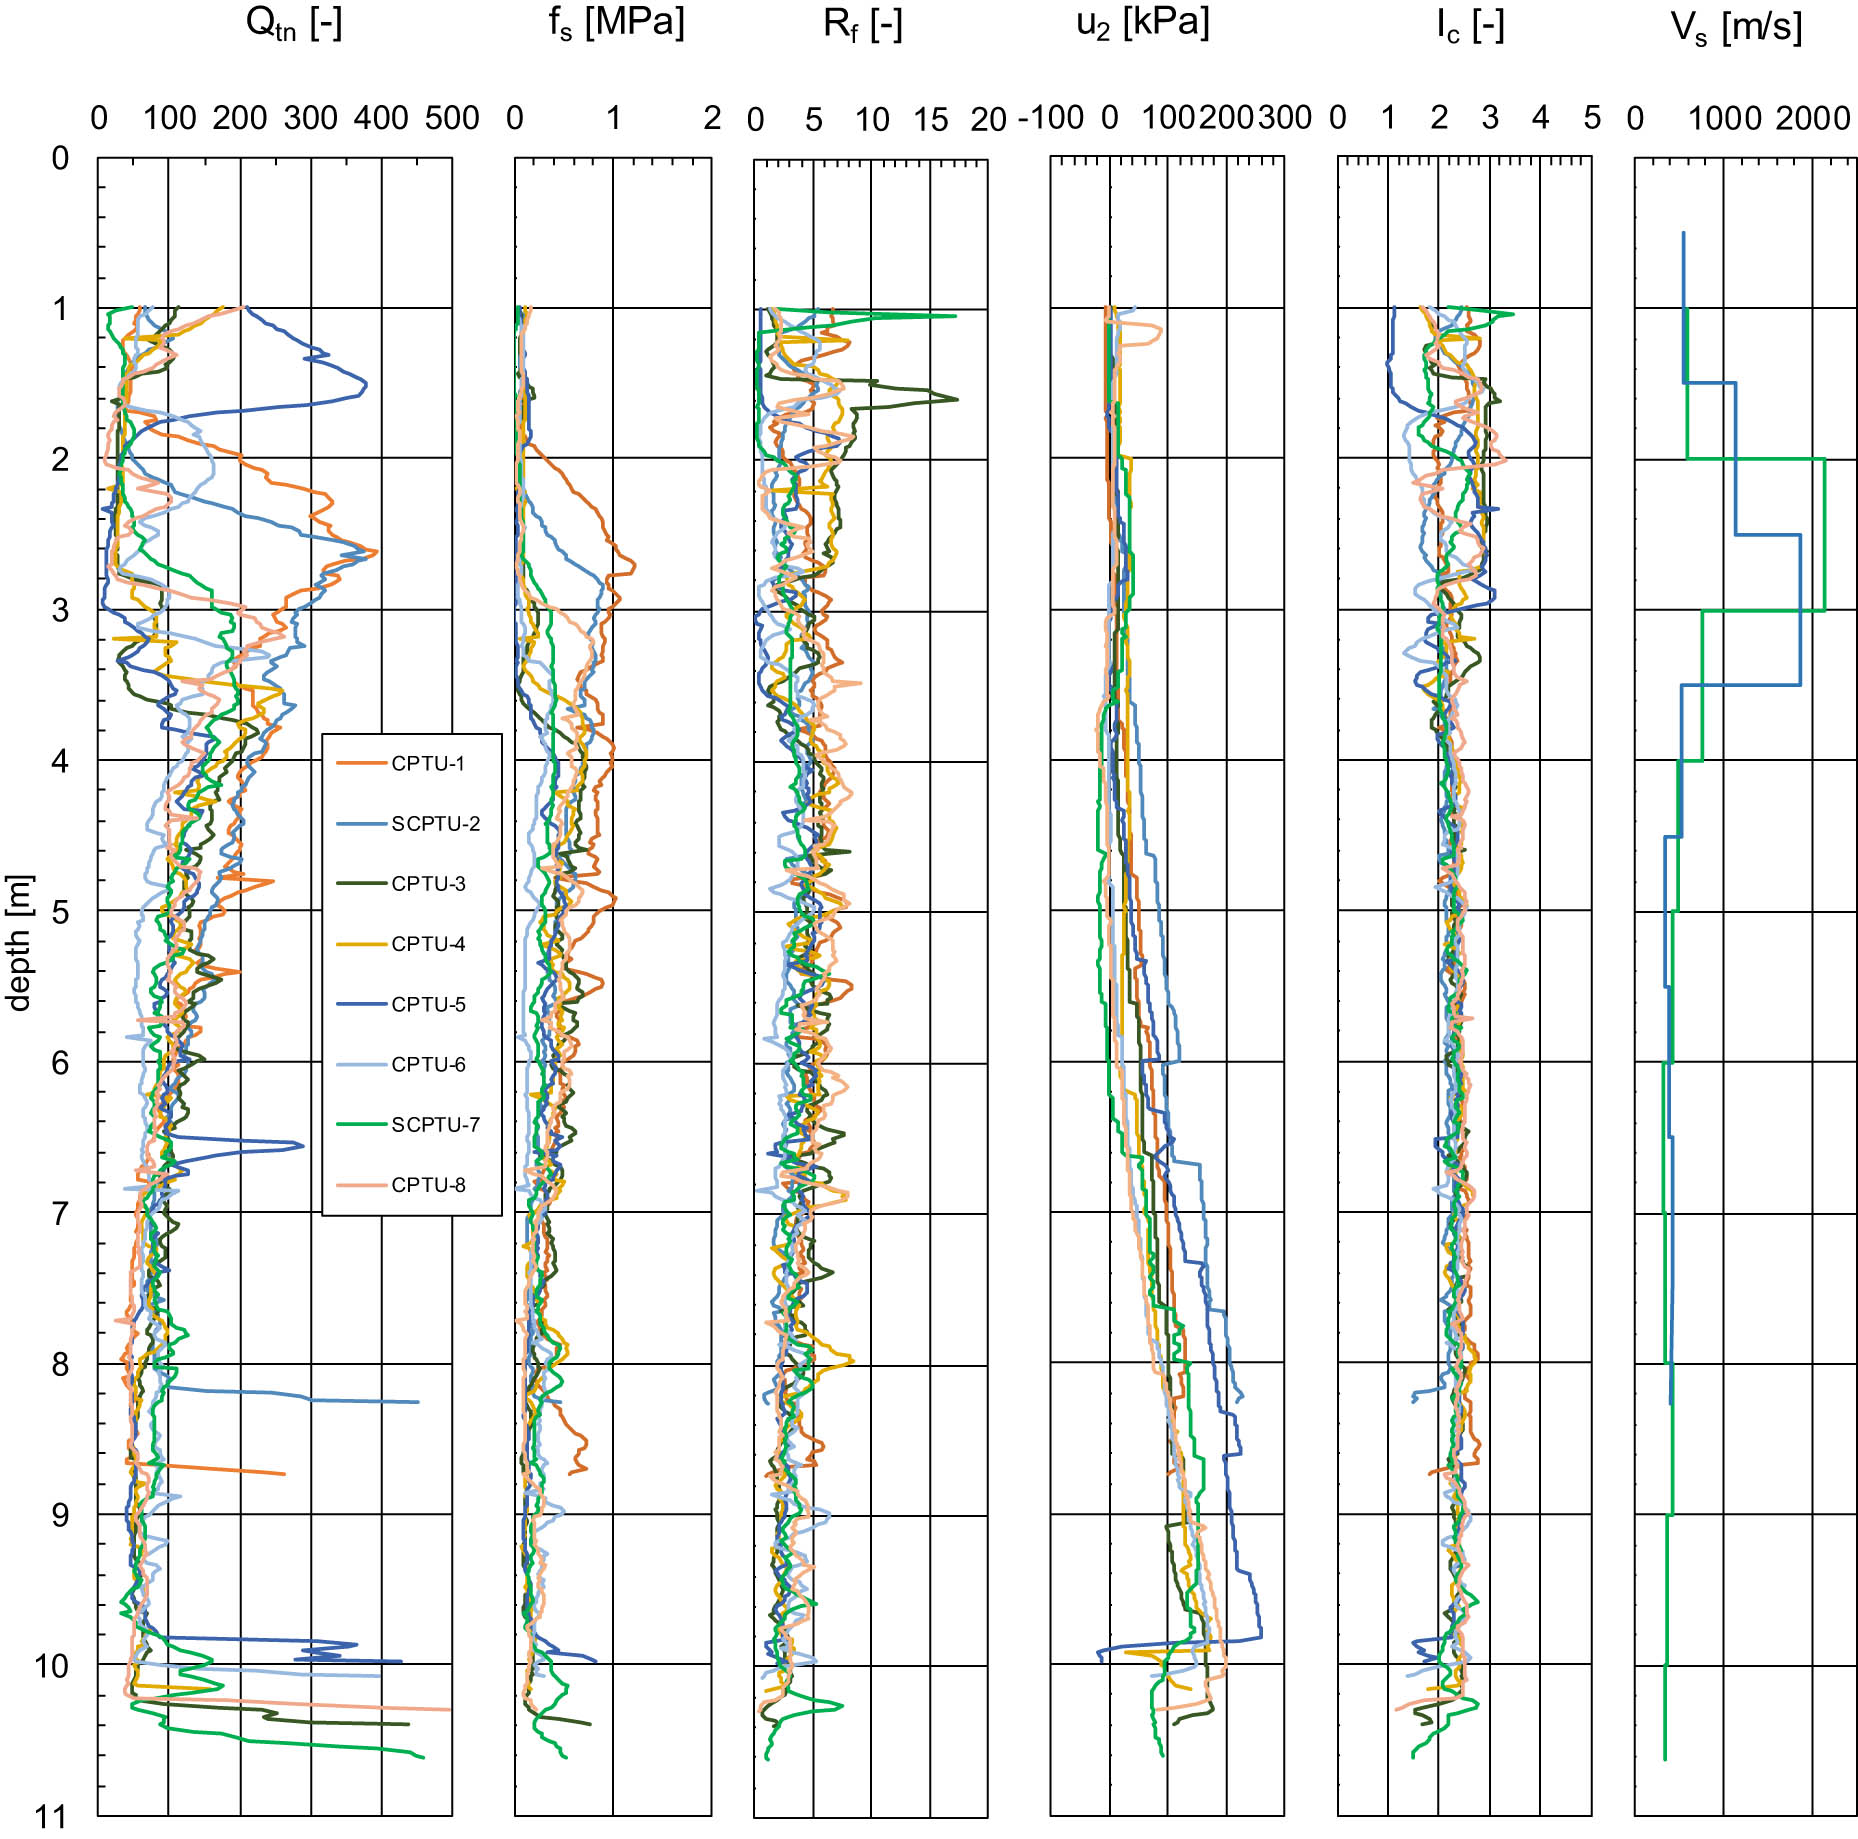
CPTU test results – SGGW Campus.
Dissipation results of excess pore water pressure obtained from the SGGW Campus clays are presented as normalized curves in Figure 5. Dissipation curves of excess pore water pressure in grey boulder clay from depth levels 8.60, 8.62, 8.74, 9.06, and 10.08 m are standard curves. The time required to dissipate 50% of excess pore water pressure was estimated to be 108–198 s (Figure 6).
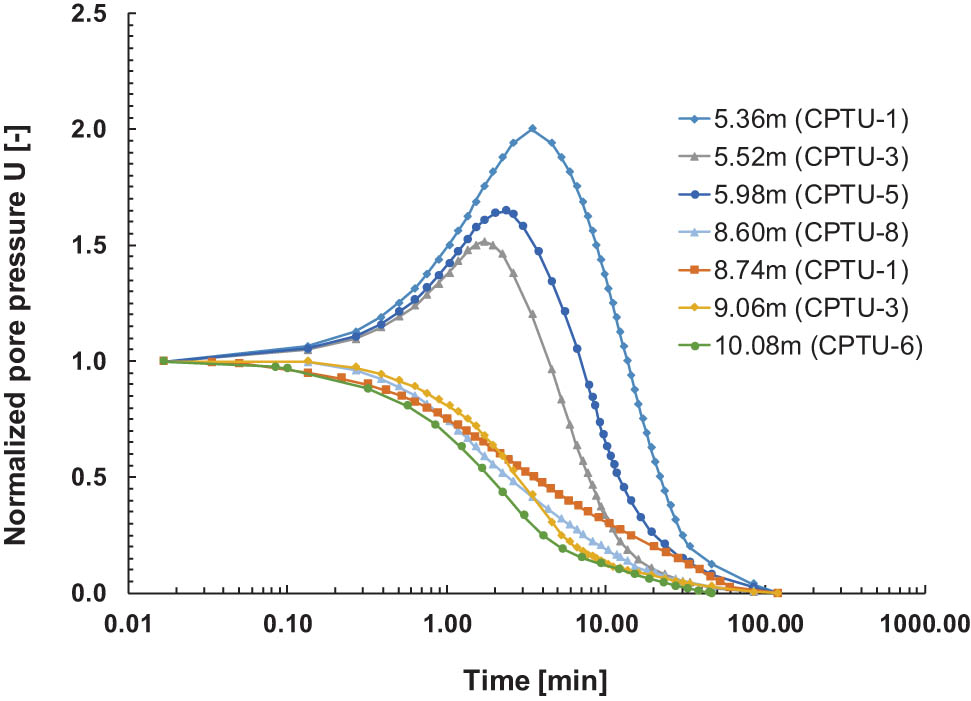
Dissipation curves for clays from the SGGW Campus test site.

Interpretation of standard curves – grey boulder clay (SGGW Campus).
Dissipation curves for brown boulder clay from depth levels 5.36, 5.52, and 5.98 m are non-standard curves. Sully et al. [30] and Chai et al. [34] suggested three methods of correcting dilation curves. The method proposed by Chai et al. includes the determination of a point on the normalized time curve (t Nmax), after which excess pressure attains the maximal value (u max); from this moment the time (t 50) required for dissipation of 50% of the maximal pressure is measured (Figure 7). Based on numerical analysis, the authors of this solution have proposed a formula correcting the obtained t 50 value.
where t 50m is the corrected time for 50% excess pore pressure dissipation (s), t 50 is the time for 50% excess pore pressure dissipation (s), t Nmax is the time for the measured excess pore pressure to reach its maximum value (s), and I r – rigidity index (−).
![Figure 7
Interpretation of non-standard curves after Chai et al. [34] – brown boulder clay (SGGW Campus).](/document/doi/10.1515/eng-2022-0483/asset/graphic/j_eng-2022-0483_fig_007.jpg)
Interpretation of non-standard curves after Chai et al. [34] – brown boulder clay (SGGW Campus).
Moreover, numerical analyses performed by the authors of the formula presented above have indicated that soil rigidity does not essentially influence the value of t Nmax, but has impact on time t 50m, which decreases with increase in rigidity index I r. In the case when non-standard curves are interpreted, the t 50m value may be successfully substituted into the equation proposed by Teh and Houlsby [27].
Figure 8 presents the interpretation of dissipation curves proposed by Sully et al. [30]. Values of excess pore water pressure are presented as a square root of time and the interpretation of 50% of pressure dissipation includes setting a tangent to the falling curve and determining the maximal value on the pressure axis – u max. Based on the u max and u 0 values, time t 50 is determined.
![Figure 8
Interpretation of non-standard curves after Sully et al. [30] – brown boulder clay (SGGW Campus).](/document/doi/10.1515/eng-2022-0483/asset/graphic/j_eng-2022-0483_fig_008.jpg)
Interpretation of non-standard curves after Sully et al. [30] – brown boulder clay (SGGW Campus).
The third method of interpreting non-standard curves consists in drawing a normalized dissipation curve only in the range from the maximal value to the complete dissipation of excess pore water pressure. This method allows for determining time t 50, and the result does not differ significantly from that obtained using the method of Chai et al. [34], the only exception being the lack of t 50 correction.
Results of calculating the consolidation and permeability coefficients for clays from the SGGW Campus site are presented in Table 3 (standard dissipation) and Table 4 (non-standard dissipation).
Results of calculating the consolidation and permeability coefficients based on standard dissipation curves
| Depth (m) | Author | Parameters | c h (m2/s) | k h (m/s) |
|---|---|---|---|---|
| 8.60 | Torstensson | t 50 = 138 (s) | 2.75 × 10⁻⁶ | 2.30 × 10⁻¹⁰ |
| Parez and Fauriel | — | 2.12 × 10⁻⁸ | ||
| I r = 148 (−) | ||||
| Teh and Houlsby | 6.85 × 10⁻⁶ | 5.71 × 10⁻¹⁰ | ||
| M = 120 (MPa) | ||||
| Robertson | 7.26 × 10⁻⁶ | 6.05 × 10⁻¹⁰ | ||
| 8.62 | Torstensson | t 50 = 186 (s) | 2.04 × 10⁻⁶ | 1.76 × 10⁻¹⁰ |
| Parez and Fauriel | — | 1.46 × 10⁻⁸ | ||
| I r = 143 (−) | ||||
| Teh and Houlsby | 4.99 × 10⁻⁶ | 4.31 × 10⁻¹⁰ | ||
| Robertson | 5.39 × 10⁻⁶ | 4.64 × 10⁻¹⁰ | ||
| M = 116 (MPa) | ||||
| 8.74 | Torstensson | t 50 = 198 (s) | 1.92 × 10⁻⁶ | 1.54 × 10⁻¹⁰ |
| Parez and Fauriel | — | 1.35 × 10⁻⁸ | ||
| I r = 154 (−) | ||||
| Teh and Houlsby | 4.87 × 10⁻⁶ | 3.90 × 10⁻¹⁰ | ||
| M = 125 (MPa) | ||||
| Robertson | 5.76 × 10⁻⁶ | 5.48 × 10⁻¹⁰ | ||
| 9.06 | Torstensson | t 50 = 174 (s) | 2.19 × 10⁻⁶ | 2.08 × 10⁻¹⁰ |
| Parez and Fauriel | — | 1.58 × 10⁻⁸ | ||
| I r = 130 (−) | ||||
| Teh and Houlsby | 5.07 × 10⁻⁶ | 4.84 × 10⁻¹⁰ | ||
| M = 105 (MPa) | ||||
| Robertson | 5.76 × 10⁻⁶ | 5.48 × 10⁻¹⁰ | ||
| 10.08 | Torstensson | t 50 = 108 (s) | 3.52 × 10⁻⁶ | 3.59 × 10⁻¹⁰ |
| Parez and Fauriel | — | 2.87 × 10⁻⁸ | ||
| I r = 170 (−) | ||||
| Teh and Houlsby | 7.91 × 10⁻⁶ | 6.47 × 10⁻¹⁰ | ||
| M = 142 (MPa) | ||||
| Robertson | 9.28 × 10⁻⁶ | 6.53 × 10⁻¹⁰ |
Results of calculating the consolidation and permeability coefficients based on non-standard dissipation curves
| Depth (m) | Author | Parameters | According to Sully et al. [30] | According to Chai et al. [34] | ||
|---|---|---|---|---|---|---|
| c h (m2/s) | k h (m/s) | c h (m2/s) | k h (m/s) | |||
| 5.36 | I r = 171 (−) | t 50 = 450 (s) | t 50 = 610 (s) | |||
| t Nmax = 205 (s) | ||||||
| t 50m = 64.2 (s) | ||||||
| Torstensson | 9.39 × 10⁻⁷ | 5.07 × 10⁻¹¹ | 5.92 × 10⁻⁶ | 3.20 × 10⁻¹⁰ | ||
| Parez and Fauriel | M = 185 (MPa) | 5.51 × 10⁻⁹ | — | 5.51 × 10⁻⁸ | ||
| Teh and Houlsby | 2.51 × 10⁻⁶ | 1.36 × 10⁻¹⁰ | 1.58 × 10⁻⁶ | 8.56 × 10⁻¹⁰ | ||
| Robertson | 2.47 × 10⁻⁶ | 1.33 × 10⁻¹⁰ | 1.56 × 10⁻⁶ | 8.43 × 10⁻¹⁰ | ||
| 5.52 | I r = 176 (−) | t 50 = 154 (s) | t 50 = 255 (s) | |||
| t Nmax = 105 (s) | ||||||
| t 50m = 23.6 (s) | ||||||
| Torstensson | 2.47 × 10⁻⁶ | 1.30 × 10⁻¹⁰ | 1.61 × 10⁻⁵ | 8.49 × 10⁻¹⁰ | ||
| Parez and Fauriel | M = 190 (MPa) | 1.85 × 10⁻⁸ | — | 1.93 × 10⁻⁷ | ||
| Teh and Houlsby | 6.69 × 10⁻⁶ | 3.52 × 10⁻¹⁰ | 4.37 × 10⁻⁵ | 2.30 × 10⁻⁹ | ||
| Robertson | 6.51 × 10⁻⁶ | 3.42 × 10⁻¹⁰ | 4.25 × 10⁻⁵ | 2.243 × 10⁻⁹ | ||
| 5.98 | I r = 171 (−) | t 50 = 265 (s) | t 50 = 365 (s) | |||
| t Nmax = 140 (s) | ||||||
| t 50m = 35.5 (s) | ||||||
| Torstensson | 1.43 × 10⁻⁶ | 7.76 × 10⁻¹¹ | 1.07 × 10⁻⁵ | 5.80 × 10⁻¹⁰ | ||
| Parez and Fauriel | M = 185 (MPa) | 9.51 × 10⁻⁹ | — | 1.16 × 10⁻⁷ | ||
| Teh and Houlsby | 3.83 × 10⁻⁶ | 2.07 × 10⁻¹⁰ | 2.87 × 10⁻⁵ | 1.55 × 10⁻⁹ | ||
| Robertson | 3.78 × 10⁻⁶ | 2.04 × 10⁻¹⁰ | 2.83 × 10⁻⁵ | 1.53 × 10⁻⁹ | ||
The obtained values of the permeability coefficient are most consistent in the case of the relationships indicated by Teh and Houlsby [27] and Robertson and Cabal [41], both for standard and non-standard curves. Figure 9 illustrates the permeability values calculated according to these relationships and those calculated from the Torstensson [7] relationship against the values determined from the BAT studies. Values of the permeability coefficient vary from 8.43 × 10⁻¹⁰ to 1.55 × 10⁻⁹ m/s for brown clays, and 4.31 × 10⁻¹⁰ to 6.53 × 10⁻¹⁰ m/s for grey clays. Values for brown clays were obtained following interpretation of non-standard curves and correction of time required for 50% dissipation of excess pore water pressure according to the recommendations of Chai et al. [34].
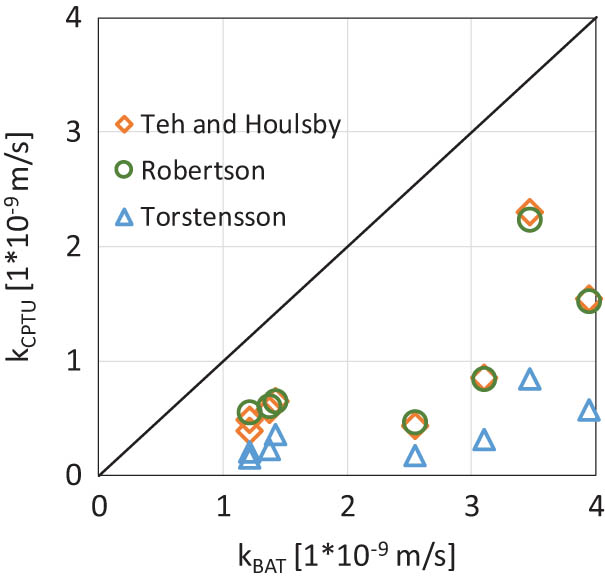
Error plot between permeability values determined from empirical relationship and BAT tests.
Interpretation of the results according to the proposal of Sully et al. [30] gave similar results; this proposal may thus be used to interpret dilation curves. Permeability coefficient values calculated with application of the relationships proposed by Torstensson [26] and Parez and Faureil [25] differ by an order of magnitude in both directions in comparison to the remaining ones. Summing up, it may be concluded that the stiffer brown clays display slightly higher values of the permeability coefficient.
In order to verify the obtained results of the permeability coefficient for the analyzed soils, they were correlated with data from the BAT groundwater monitoring system. The permeability coefficient was measured in all four locations and at three depth levels in each test profile. The BAT results are presented in Figure 10, whereas the calculated permeability coefficient values were assumed as reference values.
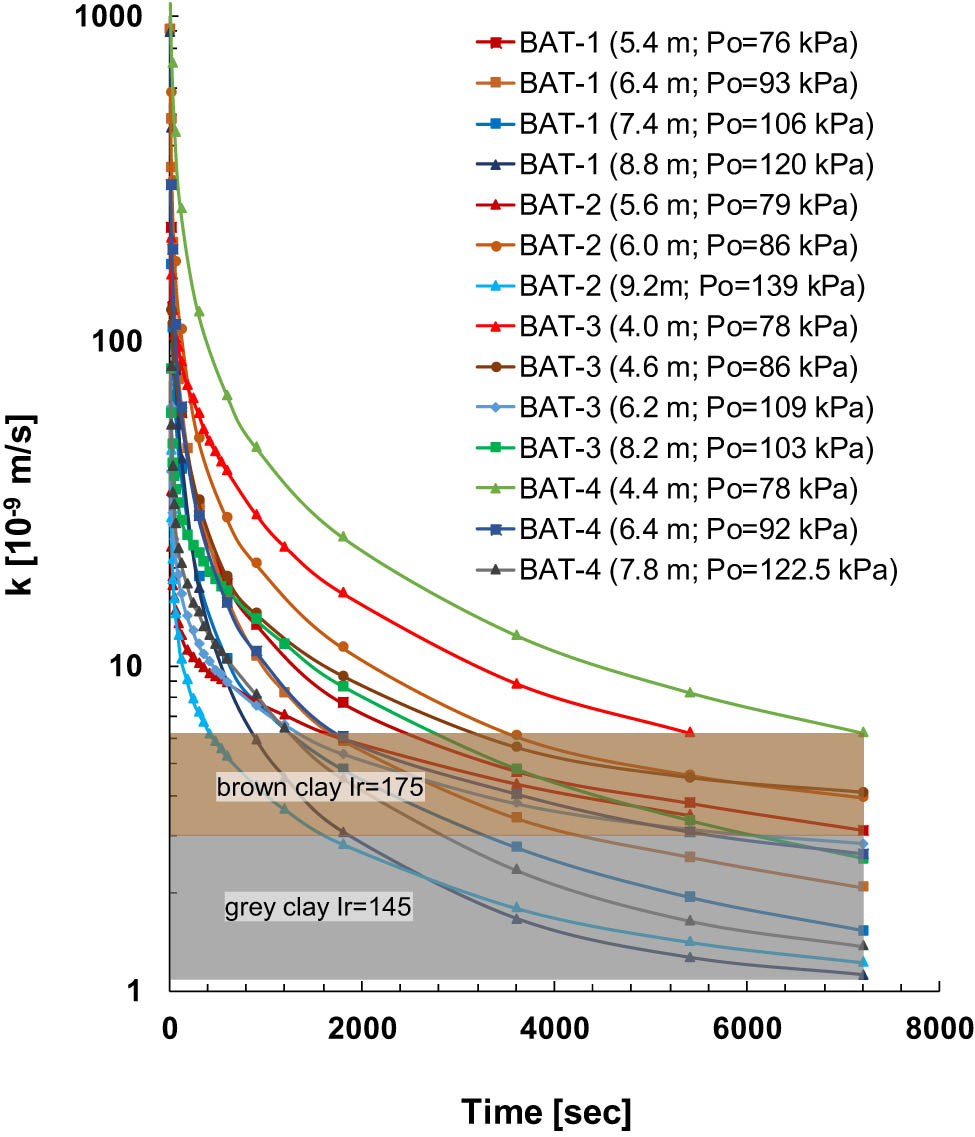
Results of BAT tests – SGGW Campus.
Analysis of the BAT results indicates that the permeability coefficient for clays from the SGGW Campus test site is in the range of 1.17 × 10⁻⁹ and 4.85 × 10⁻⁹ m/s. Similarly, as in the case of the CPTU sounding, higher values were obtained for brown clays.
Investigations on the Stegny site aimed at verification of the obtained relations between the coefficient of permeability and the soil behavior type index I c. Detailed analysis of the CPTU tests has shown that the Pliocene clay layer is interlayered with a layer of silty clay at depths between 12.6 and 14.4 m (Figure 11a). The soil behavior-type index I c in clays attain values between 2.95 and 3.30, while in silty clays the I c values are between 2.60 and 2.95. Both the former and latter ranges of values do not match those determined for boulder clays in the subsoil of the SGGW Campus. The BAT system results (Figure 11b) indicate that the permeability coefficient:
for clays are in the range of 1.5 × 10⁻¹¹ and 4.3 × 10⁻¹¹ m/s,
for silty clays this value is 2.1 × 10⁻¹⁰ m/s.
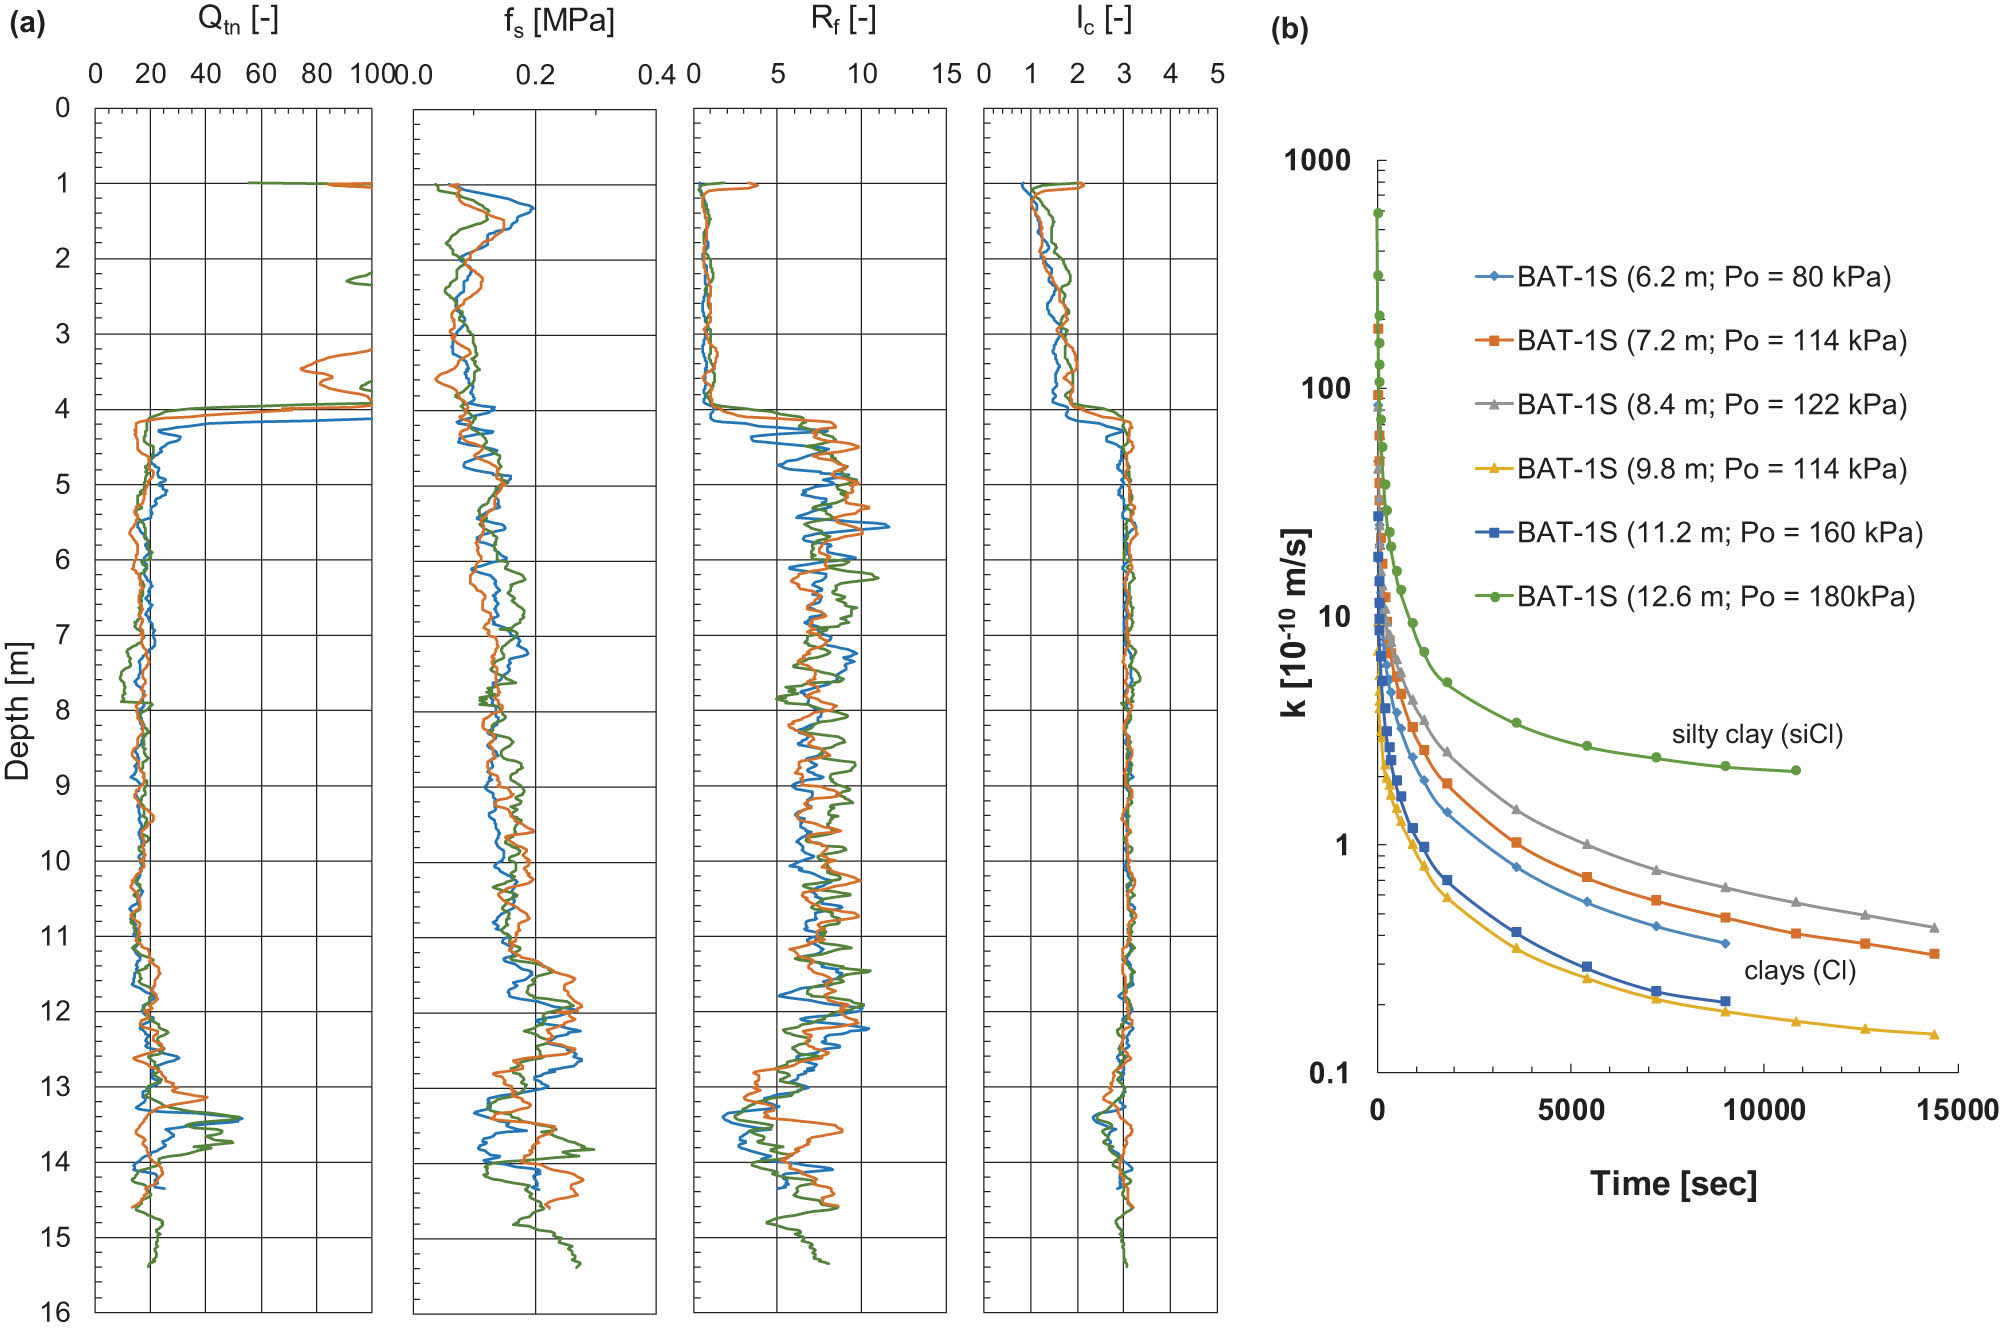
CPTU (a) and BAT (b) test results – the Stegny test site.
3.1 Determination of permeability based on soil behavior-type index I c
Correlation between time (t 50) and consolidation (c h) or permeability (k h) indexes presented above is based on a specific dataset from in situ studies. There are relatively few simple solutions in the literature, which would definitely allow us to assess the hydraulic parameters of cohesive soils. These solutions have a number of restrictions, as for example in the proposal of Ansari et al. [47]. It focuses on standard and non-standard dissipation curves and includes correction of time t 50 taking account of vertical effective strain and rigidity index I r, whereas the permeability coefficient is calculated from a simple relationship. The proposal allows us to assess the permeability coefficient for soft clays but in fact can be applied only to soils with OCR < 1.2. Similar is the problem with on-the-fly method proposed by Elsworth and Lee [24], which is not applicable to overconsolidated and highly dilative materials. Experimental work by Chai and Chanmee [48] with reconsolidated clay samples confirmed this limitation.
The proposed method to assess the permeability coefficient directly from CPTU metrics consists of using index I c according to the concept presented by Robertson and Cabal [41]. According to the calculations, in the analyzed profile of brown and grey boulder clays (depth interval 4 ÷ 10 m), the values of this index vary between 2.1 and 2.5. Values of index I c presented by Robertson [49] exclude, e.g., heavily overconsolidated and cemented fine-grained soils, such as the brown soils from depth interval 4–6 m in the analyzed profile. Nevertheless, we have agreed to relate the permeability coefficient to index I c, because, as indicated, the chart is global in nature and provides only a guide to soil behavior type. The overlap in some zones should be expected and the zones should be adjusted somewhat based on local experience.
As shown in Section 4, the results of the coefficient of permeability calculations gave a large scatter of values. Therefore, the results of BAT system measurements were considered as reference values. Based on these quantities, the following solutions are proposed (Table 5).
Proposed formulas for evaluating clay permeability in experimental fields
| I c | Estimated permeability coefficient (m/s) | Soil description |
|---|---|---|
| 2.05–2.60 |
|
sisaCl, saCl (SGGW) |
| 2.60–2.95 |
|
siCl (Stegny) |
| 2.95–3.30 |
|
Cl (Stegny) |
k is the coefficient of permeability (m/s) and I c is the soil behavior type index (−).
Figure 12 shows the variability of index I c in the analyzed profiles, the reference values of the permeability coefficient from BAT investigations, and predicted values based on the proposed relationship. Predicted values of the permeability coefficient at SGGW Campus are slightly higher in brown clays, which is in accordance with the results obtained from dissipation curves. Higher values of the permeability coefficient, in accordance with other observations [34,47], were observed for brown clays for which the rigidity index attains higher values than for grey clays, at I r ≈ 175. This trend is also observed in the case of BAT data.
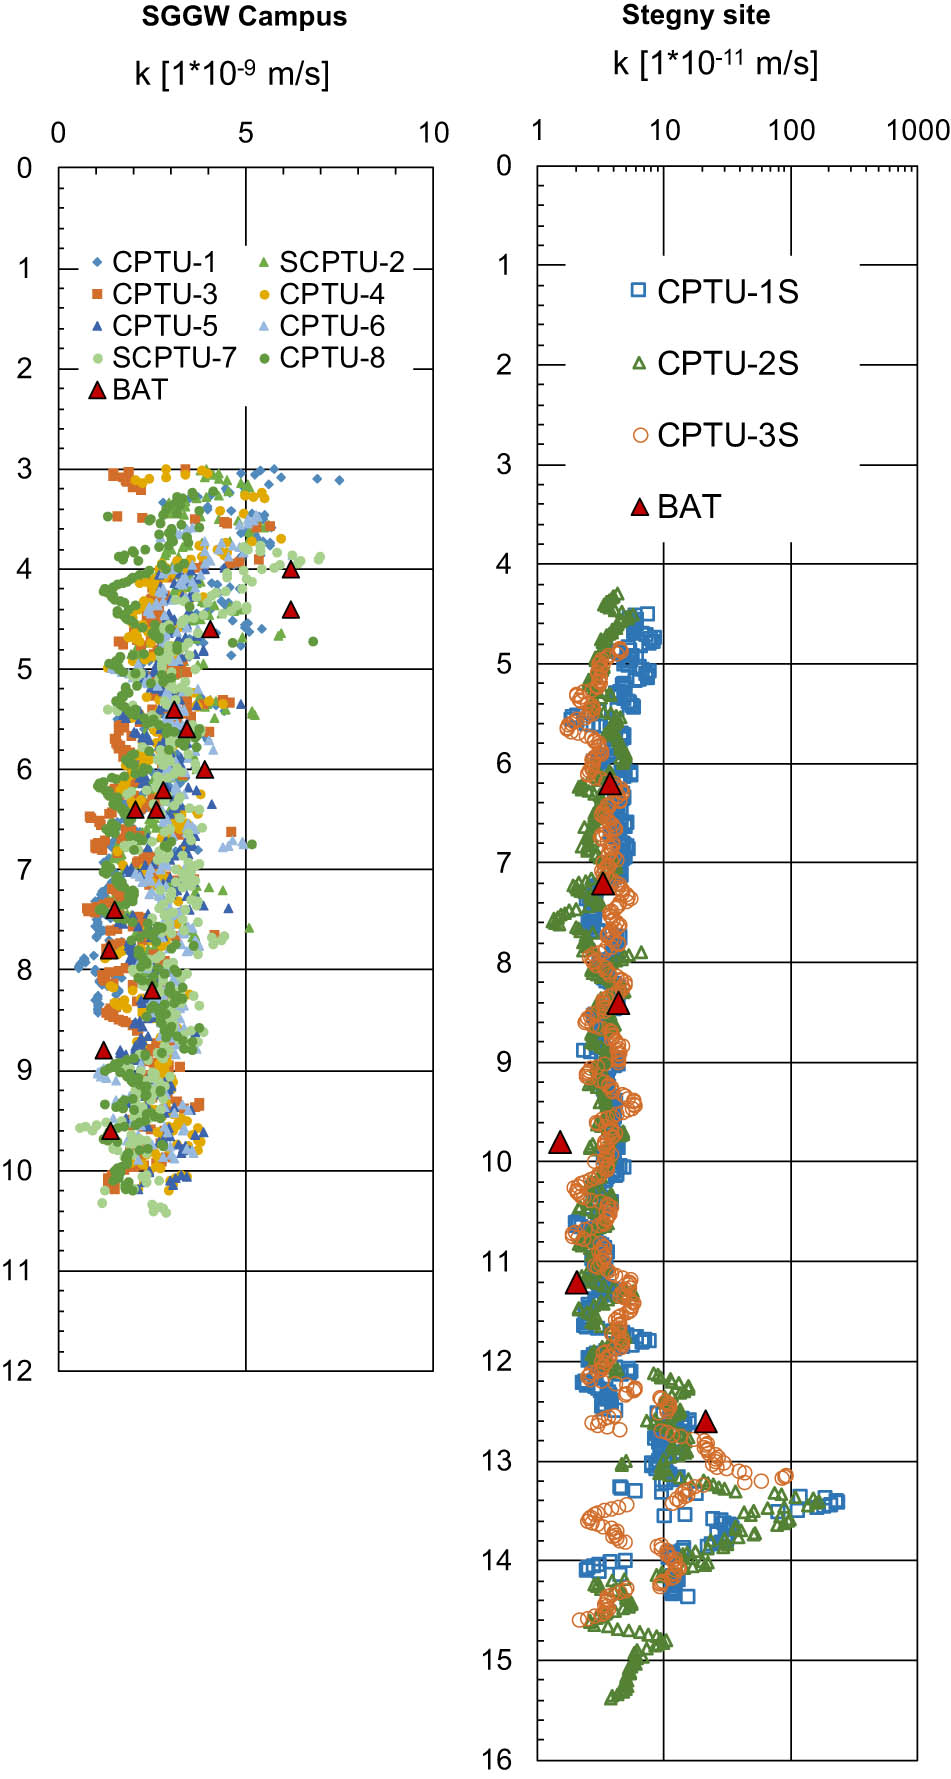
Predicted values of the permeability coefficient in the background of BAT system measurements – SGGW Campus and the Stegny sites.
4 Summary and conclusions
The article assesses the hydraulic parameters of heavily overconsolidated clays based on analysis of dissipation of excess pore water pressure from CPTU tests and BAT groundwater monitoring system data. Dissipation curves from piezocone tests were both monotonic and dilatory in character, expressed by initial momentous increase of pore pressure, followed by its decrease. The empirical relationships between time (t 50) and consolidation (c h) or permeability (k h) indices presented in the article are widely used, but their practical application requires considering other soil parameters that need to be determined, such as rigidity index, deformation parameters, and stress history. Furthermore, if we add the possibility of obtaining a standard or dilatory dissipation curve and the ability to correct the t 50 time, the resulting permeability values may differ. These differences were observed in our studies when adopting different approaches to interpreting the curves and applying various formulas found in the literature. The analysis of pore water pressure dissipation curves has led to the following conclusions:
Brown boulder clays, located on Robertson’s chart in the zone of heavily overconsolidated and cemented soils, have dilatory dissipation of excess pore water pressure, whereas grey boulder clays, located on the chart beyond this zone, are characterized by monotonic dissipation.
With increase of rigidity index I r for the analyzed soils, the time required for the dissipation of excess pressure t 50 (t 50m) decreased and, in consequence, the value of the permeability coefficient of the analyzed clays increased.
Analysis of non-standard dissipation curves confirms that a longer time required to achieve the maximal pore pressure (u max) results in a longer time needed to dissipate its excess.
Similar values of the permeability coefficient were obtained with application of equations proposed by Teh and Houlsby [27] and Robertson and Cabal [41]. These values differ from the reference values obtained from BAT analyses. Values calculated with the use of equations proposed by Torstensson [26] and Parez and Faureil [25] differ by two orders of magnitude compared to the above.
Taking into account these conclusions and based on the performed investigations, three equations were proposed for the calculation of the permeability coefficient (Table 5). The proposed relationships are simple in form and enables quick assess of the permeability of overconsolidated clays based on the CPTU test. It should be emphasized that the proposed formulas may be applied for overconsolidated cohesive soils with index I c values in the range of 2.05 ≤ I c ≤ 3.30 and described in Robertson’s chart as overconsolidated silty clays and heavily overconsolidated and cemented fine-grained soils. For other values of I c, the equation must be adapted to local conditions.
While observing the differences in obtained results, it should be considered whether the use of empirical relationships and the method of pore water pressure dissipation for assessing the permeability coefficient in cohesive soils should be decisive. In crucial cases, direct measurements should be conducted or undisturbed soil samples should be taken and tested in a laboratory under more controlled conditions. In the literature, there are relatively few straightforward solutions available for assessing the hydraulic parameters in cohesive soils. In simple cases, it may be recommended to estimate the hydraulic parameters based on a simple relationship and in an approximate manner. However, it is important to keep in mind the limitations of empirical formulas and requires verification on a larger dataset from other study sites. However, it is important to bear in mind the limitations of empirical formulas and the necessity of verifying their results using a larger dataset from various study sites.
-
Funding information: The authors state no funding involved.
-
Author contributions: ML, MB, SR, and KM-L designed the experiments, ML, MB, and SR carried out in situ investigations, ML, KM-L, and MB made a calculations. ML prepared the manuscript with contributions from all co-authors. The authors applied the SDC approach for the sequence of authors.
-
Conflict of interest: The authors state no conflict of interest.
-
Ethical approval: The conducted research is not related to either human or animal use.
-
Data availability statement: All data generated or analyzed during this study are included in this published article. The measured and analyzed data are presented in the figures that constitute the content of the article.
References
[1] Bear J, Verruijt A. Modeling groundwater flow and pollution. Dordrecht/Boston/Lancaster/Tokyo: D. Reidel Publishing Comp.; 1987.10.1007/978-94-009-3379-8Search in Google Scholar
[2] Koda E, Tkaczyk A, Lech M, Osiński P. Application of electrical resistivity data sets for the evaluation of the pollution concentration level within landfill subsoil. Appl Sci. 2017;7:262.10.3390/app7030262Search in Google Scholar
[3] Fronczyk J, Markowska-Lech K. Treatment efficiency of synthetic urban runoff by low-cost mineral materials under various flow conditions and in the presence of salt: Possibilities and limitations. Sci Total Environ. 2021;770:145199.10.1016/j.scitotenv.2021.145199Search in Google Scholar PubMed
[4] Zhou J, Laumann S, Heimovaara TJ. Applying aluminum-organic matter precipitates to reduce soil permeability in-situ: A field and modeling study. Sci Total Environ. 2019;662:99–109.10.1016/j.scitotenv.2019.01.109Search in Google Scholar PubMed
[5] Skutnik Z, Bajda M, Lech M. The selection of sealing technologies of the subsoil and hydrotechnical structures and quality assurance. Open Eng. 2019;9(1):420–7.10.1515/eng-2019-0050Search in Google Scholar
[6] Lechowicz Z, Garbulewski K, Bąkowski J, Wdowska M, Wrzesiński G, Ramos Fernandes I. Use of staged construction with preloading for improvement of organic subsoil under expressway embankment (in Polish). Acta Sci Pol Archit. 2018;17(2):115–22.10.22630/ASPA.2018.17.2.20Search in Google Scholar
[7] Torstensson BA. A new system for groundwater monitoring. Groundw Monit Rem. 1984;4:131–8.10.1111/j.1745-6592.1984.tb00904.xSearch in Google Scholar
[8] Torstensson BA, Petsonk AM. A device for in-situ measurement of hydraulic conductivity. In Proceedings of the 4th International Seminar Field Instrumentation and In-situ Measurements. Singapore: Nanyang Technological Institute; 1986.Search in Google Scholar
[9] Tremblay M, Eriksson L. Use of piezometers for in situ measurement of permeability. Proc Ninth European Conference on Soil Mechanics and Foundation Engineering, Groundwater Effects in Geotechnical Engineering, Dublin, 31 Aug–3 Sept 1987V1, P 99–102. Publ Rotterdam: A A Balkema, Int J Rock Mech Min Sci Geomech Abstr. 1987;25(3):117.10.1016/0148-9062(88)92405-9Search in Google Scholar
[10] Tavenas F, Jean P, Leblond PF, Leroueil S. The permeability of natural soft clays. Part II: Permeability characteristics: Reply. Can Geotech J. 1983;20:645–60.10.1139/t83-073Search in Google Scholar
[11] Benson CH, Gunter J, Boutwell G, Trautwein S, Berzanskis P. Comparison of four methods to assess hydraulic conductivity. ASCE J Geotech Geoenviron Eng. 1997;123(10):929–37.10.1061/(ASCE)1090-0241(1997)123:10(929)Search in Google Scholar
[12] Shepherd RG. Correlations of permeability and grain size. Groundwater. 1989;27(5):633–8.10.1111/j.1745-6584.1989.tb00476.xSearch in Google Scholar
[13] Rosas J, Lopez O, Missimer T, Coulibaly KM, Dehwah AHA, Sesler K, et al. Determination of hydraulic conductivity from grain-size distribution for different depositional environments. Groundwater. 2013;53(3):399–413.10.1111/gwat.12078Search in Google Scholar PubMed
[14] Ji-Peng W, Pei-Zhi Z, Ji-Yuan L, Tai-Heng L, Yi-Ran T, Jiong Z. Estimation of unsaturated hydraulic conductivity of granular soils from particle size parameters. Water. 2019;11:1826.10.3390/w11091826Search in Google Scholar
[15] Nu Nguyen T, Bui TS, Do MN. Research on horizontal coefficient of consolidation of Vietnam’s soft soil. J Eng. 2020;2020:Article ID 3697689, 13 pages.10.1155/2020/3697689Search in Google Scholar
[16] Burns SE, Mayne PW. Monotonic and dilatory pore-pressure decay during piezocone tests in clay. Can Geotech J. 1998;35(6):1063–73.10.1139/t98-062Search in Google Scholar
[17] Mayne P. Stress-strain-strength-flow parameters from enhanced in situ tests. Proceedings, International Conference on In-Situ Measurement of Soil Properties & Case Histories, Bali, Indonesia; 2001. p. 27–48.Search in Google Scholar
[18] Bałachowski L. Soft soil overconsolidation and CPTU dissipation test. Arch Hydro-Eng Environ Mech. 2006;53(2):155–80.Search in Google Scholar
[19] Krage CP, DeJong JT, Schnaid F. Estimation of the coefficient of consolidation from incomplete cone penetration test dissipation tests. J Geotech Geoenviron Eng. 2015;141(2). 10.1061/(ASCE)GT.1943-5606.0001218.Search in Google Scholar
[20] Lim YX, Tan S, Phoon K. Interpretation of horizontal permeability from piezocone dissipation tests in soft clays. Comput Geotech. 2019;107:189–200.10.1016/j.compgeo.2018.12.001Search in Google Scholar
[21] Marchetti S, Totani G. Ch evaluations from DMTA dissipation curves. In Proceedings of the XII International Conference on Soil Mechanics and Foundation Engineering. Vol. 1. 1989. p. 281–6.Search in Google Scholar
[22] Totani G, Calabrese M, Monaco P. In situ determination of ch by flat dilatometer (DMT). In Proceedings of the 1st International Conference on Site Characterization ISC ’98, Atlanta, GA (USA); 1998. p. 883–8.Search in Google Scholar
[23] Rabarijoely S. A new method for the estimation of hydraulic permeability, coefficient of consolidation, and soil fraction based on the dilatometer tests (DMT). Stud Geotech Mech. 2019;41(4):212–22.10.2478/sgem-2019-0021Search in Google Scholar
[24] Elsworth D, Lee SD. Permeability determination from on-the-fly piezocone sounding. J Geotech Geoenviron Eng. 2005;131(5):643–53.10.1061/(ASCE)1090-0241(2005)131:5(643)Search in Google Scholar
[25] Parez L, Fauriel R. Le piézocône, améliorations apportées á la reconnaissance des sols. Rev Française Géotech. 1988;44:13–27.10.1051/geotech/1988044013Search in Google Scholar
[26] Torstensson BA. The pore pressure probe. Norsk jord- og fjellteknisk forbund. Fjellsprengningsteknikk – bergmekanikk, Oslo 1977, Foredrag, 34.1-34.15, Trondheim, Norway, Tapir; 1977.Search in Google Scholar
[27] Teh CI, Houlsby GT. An analytical study of the cone penetration test in clay. Géotechnique. 1991;41(1):17–34.10.1680/geot.1991.41.1.17Search in Google Scholar
[28] Lunne T, Robertson PK, Powell JJM. Cone penetration testing in geotechnical practice. London: Blackie Academic and Professional; 1997.Search in Google Scholar
[29] Lunne T, Eidsmoen T, Gillespie D, Howland JD. Laboratory and field evaluation on cone penetrometers. In Use of In Situ Tests in Geotechnical Engineering (papers to the Conference, Blacksburg, 23–25 June 1986) P714–729. Publ New York: ASCE, (ASCE Geotechnical Special Publication No 6) 1432 0727. Int J Rock Mech Min Sci Geomech Abstr. 1986;25(5):24.Search in Google Scholar
[30] Sully JP, Robertson PK, Campanella RG, Woeller DJ. An approach to evaluation of field CPTU dissipation data in overconsolidated fine-grained soils. Can Geotech J. 1999;36(2):369–81.10.1139/t98-105Search in Google Scholar
[31] Ha TG, Kim JY, Kim JH, Chung CK. Experimental estimation of distribution of excess pore pressure by cone penetration. In Proceedings of the 2nd International Symposium on Cone Penetration Testing, CA, USA; 2010. p. 2–15.Search in Google Scholar
[32] Ha TG, Jang I,S, Choo YS, Chung CK. Evaluation of coefficient of consolidation for dilatory dissipation in piezocone test in overconsolidated cohesive soils. KSCE J Civ Eng. 2014;18(2):475–87.10.1007/s12205-014-0191-1Search in Google Scholar
[33] Sully JP, Campanella RG. Evaluation of field CPTU dissipation data in overconsolidated fine-grained soils. In Proceedings of the 13th International Conference on Soil Mechanics and Foundation Engineering. Vol. 1. New Delhi; 1994. p. 201–4.Search in Google Scholar
[34] Chai J, Sheng D, Carter JP, Zhu H. Coefficient of consolidation from non-standard piezocone dissipation curves. Comput Geotech. 2012;41:13–22.10.1016/j.compgeo.2011.11.005Search in Google Scholar
[35] Robertson PK. Interpretation of in situ tests – some insights. In Mitchell lecture- geotechnical and geophysical site characterization 4. Porto de Galinhas, Brazil, 18th to 21st September 2012. London: Taylor & Francis Group; p. 3–24.Search in Google Scholar
[36] Imre E, Rózsa P, Bates L, Fityus S. Evaluation of monotonic and non-monotonic dissipation test results. Comput Geotech. 2010;37:885–904.10.1016/j.compgeo.2010.07.008Search in Google Scholar
[37] Bekele BM, Song CR, Jin G, Lindemann M. Estimating hydraulic conductivity of overconsolidated soils based on piezocone penetration test (PCPT). Infrastructures. 2021;6:32.10.3390/infrastructures6030032Search in Google Scholar
[38] Elsworth D, Lee DS. Limits in determining permeability from on-the-fly uCPT sounding. Géotechnique. 2007;57(8):679–85.10.1680/geot.2007.57.8.679Search in Google Scholar
[39] Shen S-L, Wang J-P, Wu H-N, Xu Y-S, Ye G-L, Yin Z-Y. Evaluation of hydraulic conductivity for both marine and deltaic deposits based on piezocone testing. Ocean Eng. 2015;110:174–82.10.1016/j.oceaneng.2015.10.011Search in Google Scholar
[40] Monforte L, Arroyo M, Carbonell JM, Gens A. Hydraulic conductivity from CPTu on-the-fly: A numerical evaluation. Géotech Lett. 2018;8(4):268–77.10.1680/jgele.18.00108Search in Google Scholar
[41] Robertson PK, Cabal KL. Guide to cone penetration testing for geotechnical engineering. Signal Hill, CA: Gregg Drilling & Testing, Inc.; 2012.Search in Google Scholar
[42] Robertson PK, Campanella RG. Interpretation of cone penetration tests. Part II: Clay. Can Geotech J. 1983;20(4):734–45.10.1139/t83-079Search in Google Scholar
[43] Robertson PK. Estimating in-situ soil permeability from CPT and CPTu. 2nd International Symposium on Cone Penetration Testing. Vol. 2. Huntington Beach, CA; 2010. p. 535–42.Search in Google Scholar
[44] Robertson PK, Campanella RG. Design manual for use of CPT and CPTU. Vancover, BC: University of British Columbia; 1989.Search in Google Scholar
[45] Larsson R. CPT-sondering Utrustning – utförande – utvärdering; En in situ method för bestämning av lagerföljd och egenskaper i jord (in Swedish). Linköping: Swedish Geotechnical Institute; 2015. p. 15. Information.Search in Google Scholar
[46] Bajda M, Lech M, Markowska-Lech K. Saturation of piezocones used in geotechnical testing. Polish Patent PL 220711 B1; 2014.Search in Google Scholar
[47] Ansari Y, Merifield M, Sheng D. A piezocone dissipation test interpretation method for hydraulic conductivity of soft clays. Soils Found. 2014;54(6):1104–16.10.1016/j.sandf.2014.11.006Search in Google Scholar
[48] Chai J, Chanmee N. A modified method for estimating permeability of clayey soils based on piezocone sounding results. Can Geotech J. 2017;55(9):1268–81.10.1139/cgj-2017-0058Search in Google Scholar
[49] Robertson PK. Soil behaviour type from the CPT: An update. 2nd International Symposium on Cone Penetration Testing. Vol. 2. Huntington Beach, CA; 2010. p. 575–83.Search in Google Scholar
© 2023 the author(s), published by De Gruyter
This work is licensed under the Creative Commons Attribution 4.0 International License.
Articles in the same Issue
- Regular Articles
- Design optimization of a 4-bar exoskeleton with natural trajectories using unique gait-based synthesis approach
- Technical review of supervised machine learning studies and potential implementation to identify herbal plant dataset
- Effect of ECAP die angle and route type on the experimental evolution, crystallographic texture, and mechanical properties of pure magnesium
- Design and characteristics of two-dimensional piezoelectric nanogenerators
- Hybrid and cognitive digital twins for the process industry
- Discharge predicted in compound channels using adaptive neuro-fuzzy inference system (ANFIS)
- Human factors in aviation: Fatigue management in ramp workers
- LLDPE matrix with LDPE and UV stabilizer additive to evaluate the interface adhesion impact on the thermal and mechanical degradation
- Dislocated time sequences – deep neural network for broken bearing diagnosis
- Estimation method of corrosion current density of RC elements
- A computational iterative design method for bend-twist deformation in composite ship propeller blades for thrusters
- Compressive forces influence on the vibrations of double beams
- Research on dynamical properties of a three-wheeled electric vehicle from the point of view of driving safety
- Risk management based on the best value approach and its application in conditions of the Czech Republic
- Effect of openings on simply supported reinforced concrete skew slabs using finite element method
- Experimental and simulation study on a rooftop vertical-axis wind turbine
- Rehabilitation of overload-damaged reinforced concrete columns using ultra-high-performance fiber-reinforced concrete
- Performance of a horizontal well in a bounded anisotropic reservoir: Part II: Performance analysis of well length and reservoir geometry
- Effect of chloride concentration on the corrosion resistance of pure Zn metal in a 0.0626 M H2SO4 solution
- Numerical and experimental analysis of the heat transfer process in a railway disc brake tested on a dynamometer stand
- Design parameters and mechanical efficiency of jet wind turbine under high wind speed conditions
- Architectural modeling of data warehouse and analytic business intelligence for Bedstead manufacturers
- Influence of nano chromium addition on the corrosion and erosion–corrosion behavior of cupronickel 70/30 alloy in seawater
- Evaluating hydraulic parameters in clays based on in situ tests
- Optimization of railway entry and exit transition curves
- Daily load curve prediction for Jordan based on statistical techniques
- Review Articles
- A review of rutting in asphalt concrete pavement
- Powered education based on Metaverse: Pre- and post-COVID comprehensive review
- A review of safety test methods for new car assessment program in Southeast Asian countries
- Communication
- StarCrete: A starch-based biocomposite for off-world construction
- Special Issue: Transport 2022 - Part I
- Analysis and assessment of the human factor as a cause of occurrence of selected railway accidents and incidents
- Testing the way of driving a vehicle in real road conditions
- Research of dynamic phenomena in a model engine stand
- Testing the relationship between the technical condition of motorcycle shock absorbers determined on the diagnostic line and their characteristics
- Retrospective analysis of the data concerning inspections of vehicles with adaptive devices
- Analysis of the operating parameters of electric, hybrid, and conventional vehicles on different types of roads
- Special Issue: 49th KKBN - Part II
- Influence of a thin dielectric layer on resonance frequencies of square SRR metasurface operating in THz band
- Influence of the presence of a nitrided layer on changes in the ultrasonic wave parameters
- Special Issue: ICRTEEC - 2021 - Part III
- Reverse droop control strategy with virtual resistance for low-voltage microgrid with multiple distributed generation sources
- Special Issue: AESMT-2 - Part II
- Waste ceramic as partial replacement for sand in integral waterproof concrete: The durability against sulfate attack of certain properties
- Assessment of Manning coefficient for Dujila Canal, Wasit/-Iraq
- Special Issue: AESMT-3 - Part I
- Modulation and performance of synchronous demodulation for speech signal detection and dialect intelligibility
- Seismic evaluation cylindrical concrete shells
- Investigating the role of different stabilizers of PVCs by using a torque rheometer
- Investigation of high-turbidity tap water problem in Najaf governorate/middle of Iraq
- Experimental and numerical evaluation of tire rubber powder effectiveness for reducing seepage rate in earth dams
- Enhancement of air conditioning system using direct evaporative cooling: Experimental and theoretical investigation
- Assessment for behavior of axially loaded reinforced concrete columns strengthened by different patterns of steel-framed jacket
- Novel graph for an appropriate cross section and length for cantilever RC beams
- Discharge coefficient and energy dissipation on stepped weir
- Numerical study of the fluid flow and heat transfer in a finned heat sink using Ansys Icepak
- Integration of numerical models to simulate 2D hydrodynamic/water quality model of contaminant concentration in Shatt Al-Arab River with WRDB calibration tools
- Study of the behavior of reactive powder concrete RC deep beams by strengthening shear using near-surface mounted CFRP bars
- The nonlinear analysis of reactive powder concrete effectiveness in shear for reinforced concrete deep beams
- Activated carbon from sugarcane as an efficient adsorbent for phenol from petroleum refinery wastewater: Equilibrium, kinetic, and thermodynamic study
- Structural behavior of concrete filled double-skin PVC tubular columns confined by plain PVC sockets
- Probabilistic derivation of droplet velocity using quadrature method of moments
- A study of characteristics of man-made lightweight aggregate and lightweight concrete made from expanded polystyrene (eps) and cement mortar
- Effect of waste materials on soil properties
- Experimental investigation of electrode wear assessment in the EDM process using image processing technique
- Punching shear of reinforced concrete slabs bonded with reactive powder after exposure to fire
- Deep learning model for intrusion detection system utilizing convolution neural network
- Improvement of CBR of gypsum subgrade soil by cement kiln dust and granulated blast-furnace slag
- Investigation of effect lengths and angles of the control devices below the hydraulic structure
- Finite element analysis for built-up steel beam with extended plate connected by bolts
- Finite element analysis and retrofit of the existing reinforced concrete columns in Iraqi schools by using CFRP as confining technique
- Performing laboratory study of the behavior of reactive powder concrete on the shear of RC deep beams by the drilling core test
- Special Issue: AESMT-4 - Part I
- Depletion zones of groundwater resources in the Southwest Desert of Iraq
- A case study of T-beams with hybrid section shear characteristics of reactive powder concrete
- Feasibility studies and their effects on the success or failure of investment projects. “Najaf governorate as a model”
- Optimizing and coordinating the location of raw material suitable for cement manufacturing in Wasit Governorate, Iraq
- Effect of the 40-PPI copper foam layer height on the solar cooker performance
- Identification and investigation of corrosion behavior of electroless composite coating on steel substrate
- Improvement in the California bearing ratio of subbase soil by recycled asphalt pavement and cement
- Some properties of thermal insulating cement mortar using Ponza aggregate
- Assessment of the impacts of land use/land cover change on water resources in the Diyala River, Iraq
- Effect of varied waste concrete ratios on the mechanical properties of polymer concrete
- Effect of adverse slope on performance of USBR II stilling basin
- Shear capacity of reinforced concrete beams with recycled steel fibers
- Extracting oil from oil shale using internal distillation (in situ retorting)
- Influence of recycling waste hardened mortar and ceramic rubbish on the properties of flowable fill material
- Rehabilitation of reinforced concrete deep beams by near-surface-mounted steel reinforcement
- Impact of waste materials (glass powder and silica fume) on features of high-strength concrete
- Studying pandemic effects and mitigation measures on management of construction projects: Najaf City as a case study
- Design and implementation of a frequency reconfigurable antenna using PIN switch for sub-6 GHz applications
- Average monthly recharge, surface runoff, and actual evapotranspiration estimation using WetSpass-M model in Low Folded Zone, Iraq
- Simple function to find base pressure under triangular and trapezoidal footing with two eccentric loads
- Assessment of ALINEA method performance at different loop detector locations using field data and micro-simulation modeling via AIMSUN
- Special Issue: AESMT-5 - Part I
- Experimental and theoretical investigation of the structural behavior of reinforced glulam wooden members by NSM steel bars and shear reinforcement CFRP sheet
- Improving the fatigue life of composite by using multiwall carbon nanotubes
- A comparative study to solve fractional initial value problems in discrete domain
- Assessing strength properties of stabilized soils using dynamic cone penetrometer test
- Investigating traffic characteristics for merging sections in Iraq
- Enhancement of flexural behavior of hybrid flat slab by using SIFCON
- The main impacts of a managed aquifer recharge using AHP-weighted overlay analysis based on GIS in the eastern Wasit province, Iraq