Assessing strength properties of stabilized soils using dynamic cone penetrometer test
-
Hawraa Hadi Elias
 ,
Alaa M. Shaban
,
Alaa M. Shaban

Abstract
The subgrade soil layer is the most essential part of the pavement system. Many pavement failures can be associated with subgrade weak strength and stiffness qualities. Therefore, it is necessary to strengthen this layer before building the other pavement layers. One of the essential methods utilized to enhance the engineering characteristics of this layer is soil stabilization. Stabilization methods are many and varied, but chemical and mechanical stabilization are the most common. This research aims to evaluate the strength of stabilized soils by using a dynamic cone penetration (DCP) test. To achieve this aim, subgrade soil was provided from a roadway project in Kerbala city and stabilized with 2.5 and 5% of Portland cement by weight of the dry soil. Then, the cemented subgrade soil was reinforced with 6 and 12 mm of polypropylene discrete fiber. The fiber was added to the soil with the following contents: 0.5, 1, and 2%. The characteristics of stabilized soils were evaluated by determining three parameters: dynamic cone penetration index (DCPI), in-situ California bearing ratio (CBR), and bearing capacity obtained from the DCP test. The results showed that when Portland cement was increased from 0 to 2.5% and then to 5% by weight of the dry soil, the DCPI value gradually decreased while increasing both CBR and bearing capacity. However, adding 6 and 12 mm fiber contents (0.5, 1, and 2) to the cement–sand mixture containing 2.5 and 5% cement led to increased DCPI and a gradual decrease in CBR and bearing capacity. Also, the results showed that the DCPI for a 12 mm fiber is lower than that for 6 mm fibers, while the CBR and bearing capacity for a 12 mm fiber are greater than those of 6 mm fibers for all ratios. Accordingly, the results of the DCP tests showed that the most significant support for the soil is obtained when the soil is stabilized using 5% cement with 12 mm of fiber by weight of dry soil.
1 Background
The durability of roadway substances that support the stress put onto the roadway by traffic significantly impacts the sustainability of flexible roadway structures. Due to the quick increase in traffic, strain appears within the pavement layers and gradually develops, which causes cracking stresses to develop [1]. Every load applied to a roadway structure is transferred to the subgrade, which serves as the basis for the structure. Therefore, the indicator qualities of the subgrade upon which the roadway surface is constructed determine to what extent a layer of pavement can withstand the stress placed on it without failure. Problematic soils are those that, without improvement, cannot be economically and safely used for road building. Therefore, suitable strategies have been suggested to improve the general feature of the strength of the soil, either by replacing it directly or stabilizing it, to ensure that road roadway systems never collapse before the end of their planned lifespan [2,3].
The method of improving soils’ mechanical and chemical properties with the goal of achieving a preset, targeted bearing capacity on the soil is known as soil stabilization. Stabilization methods are many and varied, but the most common methods are chemical and mechanical stabilization. Using chemical and mechanical methods to strengthen problematic soil is effective [4,5]. Soil cement stabilization is one of the chemical stabilization techniques most frequently employed to change the characteristics of the soil and enhance its engineering performance. Portland cement serves as a binder and provides the necessary technical qualities for hardening and strengthening. However, using only cement with sandy soil causes the cemented soil to exhibit brittle behavior. This issue can easily be resolved by adding fibers to the cemented soil, which can change the behavior of the cemented soil from brittle to more ductile while also increasing its peak and residual shear strengths. A recent strategy is to use discrete fibers to improve the mechanical properties of soils [6].
The advantages of employing discrete fiber over traditional geosynthetics (strips, geotextile, geogrid, etc.) are as follows: (1) Like when mixing soil with cement, lime, or other additions, the discrete fibers are added and mixed at random with the soil. (2) Potential planes of weakness that could form parallel to the reinforcement’s normal orientation can be stopped by randomly distributed fibers. (3) There is no environmental impact from the addition of fiber; it just modifies the physical characteristics of the soil [7].
Polypropylene fibers are among the most widely used and regarded fibers and offer benefits such as being noncorrosive and resistant to alkalis, chemicals, and chlorides, making them an ideal reinforcement fiber for a variety of applications. It is cost-effective because little volume is needed. High tensile strength and high elastic modulus are simply two of the excellent mechanical characteristics of polypropylene fibers. Polypropylene fibers have the disadvantage of a relatively low density, which can cause them to float in some composite matrices. Furthermore, due to their hydrophobic nature, they exhibit low hydrophilic characteristics, which could potentially hinder their ability to bond with certain matrices [8].
According to a study by Benziane et al. [9], when conducting a direct shear test on sandy soil and adding polypropylene fibers with varying content levels of 0, 0.25, 0.5, and 0.75, the results indicated that the shear strength of the reinforced soil increased as the fiber content increased. Furthermore, the maximum amount of cohesion and friction angle also increased with an increase in fiber content. In a study conducted by Qadir et al. [10], sandy soil was subjected to compaction Proctor and unconfined compression strength (UCS) tests with the inclusion of polypropylene fibers at varying concentrations of 0, 0.5, 1, 1.5, and 2. The results indicated that with an increase in fiber content, the maximum dry density (MDD) decreased while the optimum moisture content (OMC) increased. Moreover, the addition of 1% polypropylene fiber resulted in an increase in UCS from 0.25 to 0.418 MPa.
An experimental work examined the effects of adding polypropylene fibers to sand soils [11]. The fiber was added at varying content levels including 0.1, 0.3, 0.6, and 1.0% by the weight of soil mass. Proctor and UCS tests were carried out, and the findings indicated that the addition of 0.6% polypropylene fibers led to a 24% increase in the soil’s friction angle (ϕ), a 20% increase in shear strength (τ), and a 182.2% increase in California bearing ratio (CBR). Moreover, even with a small amount of only 0.1% polypropylene fiber, the soil’s permeability reduced by 26%. According to a study by Hasrajain [12], a CBR test was conducted on sandy soil with the addition of polypropylene fibers at varying content levels of 0.05, 0.1, 0.15, and 0.2%. The results of the study showed that under unsoaked conditions, the CBR values in reinforced sand increased significantly compared to unreinforced sand. Specifically, the CBR values increased by 60, 73, 100, 106, and 113% with the inclusion of 0.5, 1, 1.5, 2, and 2.5% polypropylene fibers, respectively. Furthermore, under soaked conditions, the CBR values in reinforced sand also showed significant improvement, with improvements of 61.6, 76.9, 96.2, 113.2, and 139% seen with the inclusion of 0.5, 1, 1.5, 2, and 2.5% polypropylene fibers, respectively.
Another study has been conducted to investigate the impact of adding polypropylene fibers to cement–sand mixtures. Sbahieh and Teymur [6] conducted a UCS test on sandy soil by adding Portland cement with contents of 3, 5, and 7%, as well as polypropylene fibers with content levels of 0, 0.1, 0.3, and 0.5%. The study’s results showed that the addition of fiber reinforcement to cemented soil increased its unconfined compressive strength and axial strain at failure while altering its brittle behavior by making it more ductile. Consoli et al. [13] conducted a UCS test on sandy soil by adding Portland cement with content levels of 0 and 7%, as well as 0.5% polypropylene fibers. The study’s findings showed that the inclusion of polypropylene fibers in reinforced cemented sand can significantly increase its ductility by reducing its brittleness. The fibers provide flexibility to the material, altering its failure mode from brittle to ductile, especially for longer fibers. In addition, the addition of fibers can also decrease the stiffness of the cemented sand.
Hamidi and Hooresfand [14] conducted triaxial tests on sandy soil by adding 3% Portland cement, as well as polypropylene fibers with content levels of 0, 0.5, and 1%. The study showed that the addition of fibers resulted in an increase in both peak and residual shear strength while reducing the soil’s initial stiffness and brittleness index. Also, the study showed that the energy absorption capacity of the cemented soil increased by 20–50% with the inclusion of 1% fiber content.
Although many aspects influence the long-term performance of flexible pavements, one primary determining factor is the appropriate assessment of subgrade soil strength [15]. Many soil samples need to be taken from the site and tested in a lab to quantify the soil strength accurately. This procedure is regarded as being exceedingly expensive, arduous, and time-consuming.
Consequently, it is essential to use tests in geotechnical research. Experiments can be used to determine the mechanical characteristics of the subgrade and pavement layers, and some scientists have proposed criteria for doing so. One of these ideas uses a dynamic cone penetration test (DCP) [16,17]. The DCP test determines the strength of compacted or undisturbed materials in situ. Dr. D.J. Van Vauren developed the DCP in South Africa in the 1960s to calculate the ability of subgrade substances and layering of pavement to provide on-site stability. Due to its portability, speed, and convenience, the DCP offers a straightforward test method for determining the subgrade strength. DCP excels at providing test results quickly and is lightweight and easy to use [18,19]. The DCP was first manufactured by Scala (1959) in Australia. Since then, it has been applied to the location assessment of pavement layers and subgrades in South Africa, the UK, Australia, New Zealand, and several US states, including California, Florida, Illinois, Minnesota, Kansas, Mississippi, and Texas [20]. Experimental studies have been conducted to establish correlations between DCP measurements and other laboratory tests. The most popular correlation equations are listed in Table 1.
Summary of correlation DCP with laboratory and field tests
| Reference | Material | Correlation equation |
|---|---|---|
| [21] | Cohesive soil |
|
| [22] | Granular and cohesive soil |
|
| [23] | Granular and cohesive soil |
|
| [24] | Gravel base course |
|
| [25] | Various soils |
|
| [26] | Granular and cohesive soil |
|
| [27] | Natural compacted soil |
|
| [20] | Sandy soil |
|
| [20] | Sandy soil |
|
|
|
||
| [20] | Sandy soil |
|
| [28] | Cohesive soil |
|
| [29] | Various soils |
|
|
|
||
|
|
Note: DCPI denotes dynamic cone penetration index.
This research aims to investigate the feasibility of using the DCP test to evaluate the strength properties of stabilized soils, which can be helpful in geotechnical engineering and construction applications.
2 Materials and methods
2.1 Subgrade soil sample collection
The sample of soil used in this study was supplied from a roadway project location in Kerbala city (32°41′13″N and 43°53′50″E). Figure 1 shows an aerial photo of a specimen site in Kerbala.

Aerial image of the soil collected from the site.
The collected soil was tested in a lab to determine its classification and properties. As shown in Table 2, according to the American Association of State Highway and Transportation Officials and the unified soil classification system, the subgrade was classified as A-3 and the poorly graded sand soil as SP, respectively. Figure 2 depicts the grain size distribution curve. The modified Proctor compaction test was conducted to attain optimum water content and maximum dry unit weight, as shown in Figure 3. The fundamental physical features of the subgrade were then determined using CBR tests that were both soaked and unsoaked.
Fundamental physical and chemical features of the subgrade
| Property | Results | Source |
|---|---|---|
| Classification of soil | A-3 | [30] |
| SP | [30] | |
| Optimum water content (%) | 6.6 | [31] |
| Max. dry unit weight (kN/m3) | 20.59 | [31] |
| Specific gravity (G s) | 2.67 | [32] |
| Curvature coefficient (C c) | 1.52 | [30] |
| Uniformity coefficient (C u) | 3.91 | [30] |
| Gravel fraction (G f) | 2.91% | [30] |
| Fine content | 8.10% | [30] |
| CBR unsoaked (%) | 38 | [33] |
| CBR soaked (%) | 29 | [33] |
| SO3 | 0.9% | [34] |
| Gypsum content | 1.94% | [34] |

Curve representing the soil’s grain size distribution.

Proctor compaction curve of the soil.
2.2 Portland cement
This study uses sulfate-resisting Portland cement to stabilize the subgrade soil and enhance its characteristics. Table 3 summarizes this type of Portland cement’s fundamental chemicals and physical properties.
Fundamental chemical and physical features of Portland cement
| Property | Unit | Specification | Results | Requirement |
|---|---|---|---|---|
| Chemical requirement | ||||
| Loss on ignition (as LOI) | (%) | IQS 5/2019 | 3.61 | <4.0 |
| Non soluble substances | (%) | 0.58 | ≤1.5 | |
| Sulfate Content (as SO3) | (%) | 2.31 | ≤2.5 if C3A ≤3.5 | |
| ≤2.5 if C3A ≥3.5 | ||||
| Tricalcium aluminates (C3A) | (%) | 2.68 | ≤3.5 | |
| Magnesium oxide (MgO) | (%) | 1.79 | ≤5.0 | |
| Chloride content | (%) | 0.04 | ≤0.1 | |
| Physical requirement | ||||
| Finesse (blaine) | (m2/kg) | IQS 5/2019 | 344 | ≥300 |
| Initial setting time | (min) | 149 | ≥45 | |
| Final setting time | (h) | 3:21 | ≤10 | |
| Soundness (expansion)-Le Chatle | (mm) | 0.32 | ≤10 | |
| Compressive strength is not less than (MN/m2) | 2 days | 24.3 | ≥20 | |
| 28 days | 47.5 | ≥42.5 | ||
2.3 Fiber
Polypropylene discrete fiber (PPF) is one of the most essential synthetic fibers to reinforce soil and improve its engineering properties. In this study, 6 and 12 mm PPFs, as shown in Figure 4, were added to the cemented soil mixture as a tensile member to reduce brittleness and cracking and to create a more homogenous and stable variety. The basic properties of PPF used in this research are summarized in Table 4.
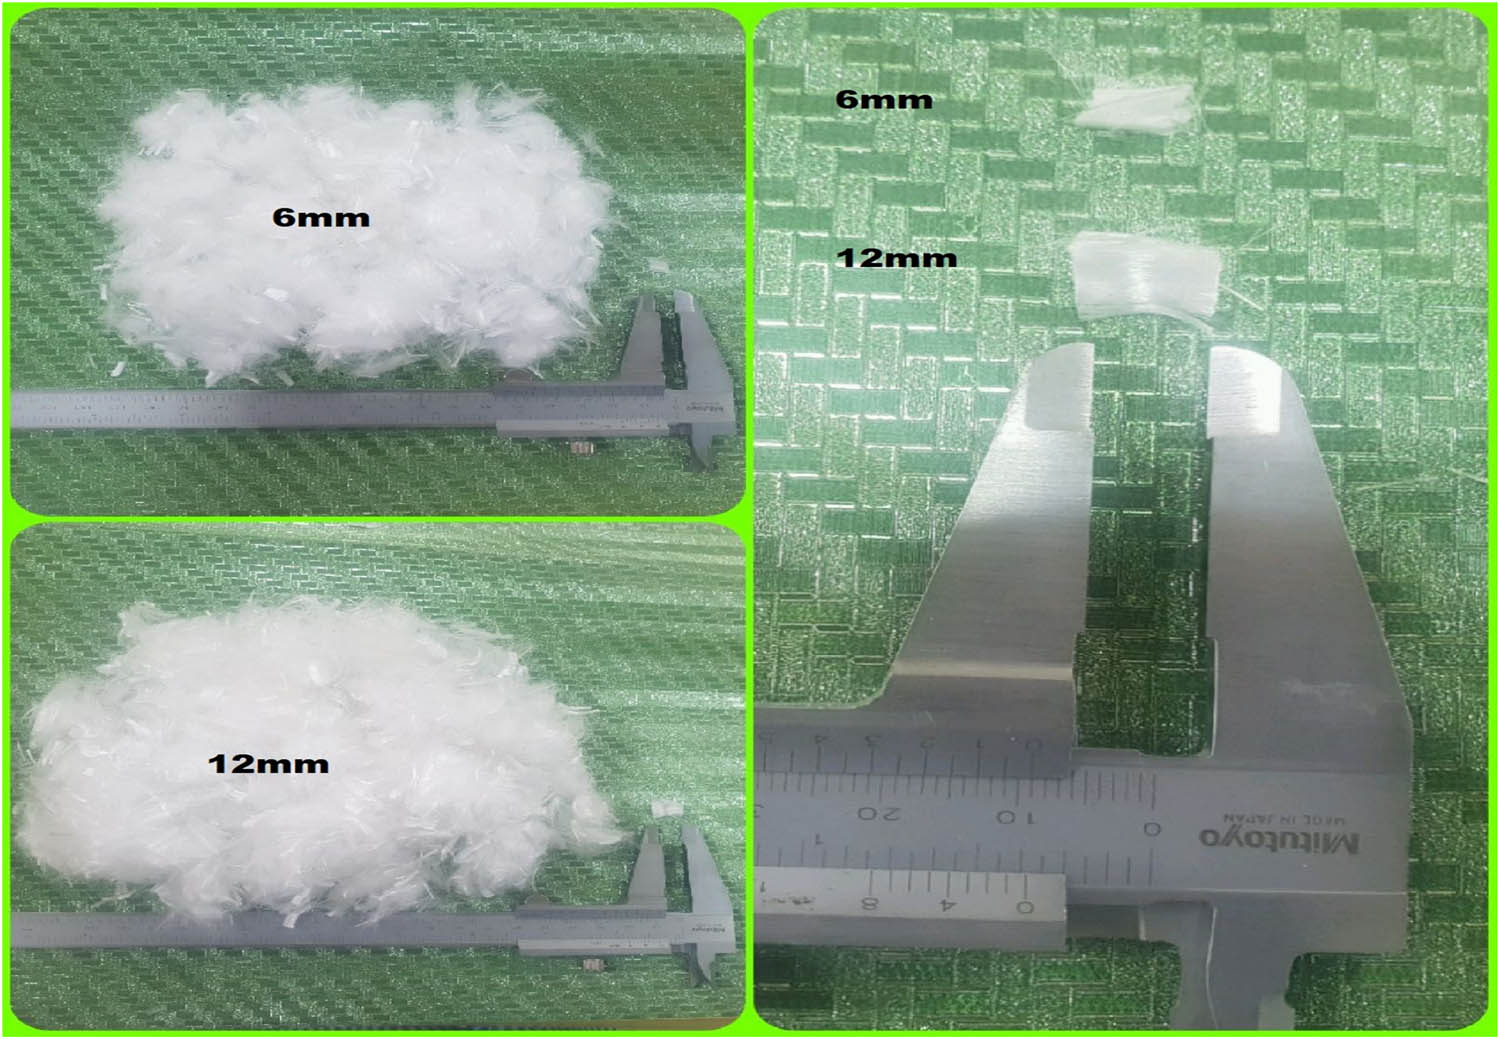
Photos of 6 and 12 mm PPF.
Basic properties of 6 and 12 mm PPF
| Form | 100% Virgin polypropylene fiber |
|---|---|
| Specific gravity | 0.91 g/cm³ |
| Diameter | 0.02–0.052 mm |
| Alkali content | Nil |
| Sulfate content | Nil |
| Chloride content | Nil |
| Elasticity modulus | 3,500–4,800 MPa |
| Tensile strength | 350 N/mm² |
| Melting point | 160–170°C |
| Ignition point | 590°C |
| Cement compatibility | Excellent |
2.4 Cement and fiber stabilization procedure
In this study, the stabilization of the sandy soils with Portland cement and PPF is as follows. First, the soil was stabilized with 2.5 and 5% of Portland cement by weight of dry soil, and then every cemented sand mixture was reinforced with 6 and 12 mm discrete fiber with content levels of 0.5, 1, and 2% by weight of the dry soil, as shown in Table 5. The modified Proctor test is utilized to find the OMC for each mixture. An electric mixer was used for mixing. Figure 5 shows the method to prepare the treated soil mixtures. Each sample and the natural subgrade sample were compacted into a large cylindrical steel mold designed and manufactured with dimensions such as diameter = 70 cm and height = 100 cm to simulate in-situ subgrade conditions. The thickness of each soil layer is 15 cm, whereas the desired height inside the cylindrical steel mold is 60 cm, as shown in Figure 6.
Summary of soil mix proportions
| Soil mixture | Cement (%) | Fiber (%) |
|---|---|---|
| Natural soil (NS) | 0 | 0 |
| SS-2.5% C | 2.5 | — |
| SS-2.5% C + 0.5% 6F | 2.5 | 0.5 |
| SS-2.5% C + 1% 6F | 2.5 | 1 |
| SS-2.5% C + 2% 6F | 2.5 | 2 |
| SS-2.5% C + 0.5% 12F | 2.5 | 0.5 |
| SS-2.5% C + 1% 12F | 2.5 | 1 |
| SS-2.5% C + 2% 12F | 2.5 | 2 |
| SS-5% C | 5 | — |
| SS-5% C + 0.5% 6F | 5 | 0.5 |
| SS-5% C + 1% 6F | 5 | 1 |
| SS-5% C + 2% 6F | 5 | 2 |
| SS-5% C + 0.5% 12F | 5 | 0.5 |
| SS-5% C + 1% 12F | 5 | 1 |
| SS-5% C + 2% 12F | 5 | 2 |
SS is defined as stabilized sand soil. C is defined as Portland cement. F is defined as polypropylene fiber.

Method to prepare a soil sample.

(a) Cylindrical mold. (b) A sketch of the cylindrical mold showing the thickness of the compacted layers.
2.5 DCP test
The DCP test process involves evaluating the rate of penetration of the DCP into compacted materials or undisturbed subgrade soil. The DCP device consists of a top drive assembly, a sliding drop hammer, lower drive rods, and a penetration cone. The drop hammer, an incorporated anvil, and a rod with a handle at the top make up the upper drive assembly. It is connected to the lower driving rod’s 16 mm diameter by a quick-connect pin connection. The bottom driving rod is threaded with hardened steel multi-use penetration cones. Cones have a maximum diameter of 20 mm, with the taper ending in a point at a 60° angle. Regarding blows per millimeter, penetration resistance is tested using a drop hammer with a free fall of 575 mm. Figure 7 displays a schematic diagram of the DCP device [17].
![Figure 7
DCP [17].](/document/doi/10.1515/eng-2022-0489/asset/graphic/j_eng-2022-0489_fig_007.jpg)
DCP [17].
Three parameters, dynamic cone penetration index (DCPI), in-situ CBR, and bearing capacity, were obtained from DCP test data. The DCP penetration distance per drop is the DCPI. The CBR has been determined according to the equation which the US Army Corps of Engineers recommended and used.
where DCPI denotes dynamic cone penetration index (mm/blow).
Over time, a number of relationships for different types of soils’ bearing strength metrics have been found. According to the correlations were used to solve the following equation to determine bearing capacity:
where q denotes the bearing capacity (kPa) and CBR denotes the California bearing ratio (%).
2.6 Sand replacement method (SRM) test
Based on ASTM D1556, the SRM, as shown in Figure 8 is a test technique used to figure out soil’s field density and moisture content (MC). This approach can be used with soils that include no appreciable amounts of rock or coarse substances larger than 1.5 inches (38 mm). This approach is also suitable for organic, saturated, or highly plastic soils.

Sand replacement test.
3 Results and discussion
3.1 Density and MC of stabilized soils
Sand replacement tests were performed as shown in Figure 8 to calculate the natural and stabilized subgrade soils’ MC and dry density (DD). The findings of these tests are summarized in Table 6. The MDD value for the natural subgrade soil increased from 2.01 to 2.07 and 2.13 g/cm3 with the addition of 2.5 and 5% of Portland by weight of dry soil, respectively. The results showed that the MDD of the cemented sand mixture increased with the addition of Portland cement at both ratios. This is consistent with the results of Choobbasti et al. [35], who discovered that Portland cement undergoes the chemical process of hydration when combined with soil and water, creating calcium silicate hydrate (C–S–H) gel. This gel forms a strong link between the soil and cement by filling in the pore spaces and creating solid and stable particles, leading to an increase in the strength and stiffness of the cemented sand mixture.
MDD and water content values of natural and stabilized subgrade
| Cement content (%) | Fiber length (mm) | Fiber content (%) | Water content (%) | MDD (g/cm3) |
|---|---|---|---|---|
| 0 | — | 0 | 6.23 | 2.01 |
| 2.5 | — | 0 | 4.75 | 2.07 |
| 2.5 | 6 | 0.5 | 5.72 | 2.03 |
| 2.5 | 6 | 1 | 6.08 | 2.01 |
| 2.5 | 6 | 2 | 6.56 | 1.85 |
| 2.5 | 12 | 0.5 | 5.62 | 2.05 |
| 2.5 | 12 | 1 | 5.99 | 2.03 |
| 2.5 | 12 | 2 | 6.47 | 1.90 |
| 5 | — | 0 | 4.31 | 2.13 |
| 5 | 6 | 0.5 | 5.27 | 2.08 |
| 5 | 6 | 1 | 5.85 | 2.04 |
| 5 | 6 | 2 | 6.35 | 1.97 |
| 5 | 12 | 0.5 | 4.94 | 2.11 |
| 5 | 12 | 1 | 5.45 | 2.07 |
| 5 | 12 | 2 | 6.22 | 2.01 |
The MDD decreased gradually from 2.07 to 2.03, 2.01, and 1.85 g/cm3 and from 2.13 to 2.08, 2.04, and 1.97 g/cm3 after adding 6 mm PPFs with content levels of 0.5, 1, and 2% by weight of the dry soil to the cemented sand mixture at all ratios. Also, it decreased gradually from 2.07 to 2.05, 2.03, and 1.9 g/cm3 and from 2.13 to 2.11, 2.07, and 2.01 g/cm3 when adding 12 mm PPFs with content levels of 0.5, 1, and 2% by weight of the dry soil to the cemented sand mixture at all ratios. This reduction might be attributed to the reason that polypropylene fiber has an overall unit weight less than the unit weight of the soil. When natural sandy soil was stabilized with 2.5 and 5% of Portland cement by weight of dry soil, the OMC declined continuously from 6.23 to 4.75 and 4.31%. The findings show that as cement content rose, the OMC decreased. This could be because the cement particles combine with the soil’s water to generate solid blocks that bind the soil granules together. As a result, the soil becomes denser and the number of empty areas decreases, and thus the MC that the soil needs to reach the maximum density decreases.
The OMC of the cemented sand mixture with 2.5% Portland cement increased gradually when reinforcing the mixture by adding 6 mm PPF with content levels of 0.5, 1, and 2% by weight of dry soil, and it reached 5.72, 6.08, and 6.56%, respectively, and it reached 5.62, 5.99, and 6.47% when reinforcing cemented sandy soil with 2.5% of cement by adding 12 mm PPF with content levels of 0.5, 1, and 2% by weight of dry soil, respectively. In addition, the OMC reached 5.27, 5.85, and 6.35% for the cemented sand mixture with 5% Portland cement when reinforcing the mixture by adding 6 mm PPF with content levels of 0.5, 1, and 2% by weight of dry soil, and it reached 4.94, 5.45, and 6.22% for the cemented sand mixtures with the same percentage of cement by adding 12 mm discrete fiber with content levels of 0.5, 1, and 2%, respectively.
The findings indicated that the optimum water content of the mixture increases gradually with the increase in PPF content at all ratios. In addition, the results showed that the 12 mm of PPF has a higher density and lower water content than the 6 mm PPF. Figure 9(a) and (b) displays the MDD for the cemented sand mixture using 2.5 and 5% Portland cement with/without 6 and 12 mm of PPF with content levels of 0, 0.5, 1, and 2% by weight of dry soil, respectively.

(a) MDD variations caused by adding 2.5% cement and different percentages of discrete fiber. (b) MDD variations caused by adding 5% cement and different percentages of discrete fiber.
3.2 DCP tests results
The findings of the DCP test are explained in Table 7. The DCP test results indicated that the DCPI value for NS was 9 mm/blow. After adding Portland cement at a rate of 2.5% by the weight of dry soil, the DCPI value decreased to 2.36 mm/blow. The findings showed that Portland cement addition decreases DCPI compared to the NS results. It may be that when Portland cement is added to the soil, it reacts with the water present in the soil and forms a cementitious material. This material fills the voids in the soil and binds the particles together, strengthening the soil. As a result, the DCPI decreases indicating that the soil has become stronger. For soil stabilized using 5% Portland cement content, the value of DCPI is 1.77 mm/blow. The findings indicated that the increase in cement content from 2.5 to 5% led to a decrease in DCPI. It is probably because the density of the mixture increased after the amount of cement was increased. Figure 10(a) displays the continuous blows for the DCP test with depth for NS and cemented sand with 2.5 and 5% Portland cement.
Summary of DCP test results
| Cement content (%) | Fiber length (mm) | Fiber content (%) | DCPI (mm/blow) | CBR (%) | Bearing capacity (kPa) |
|---|---|---|---|---|---|
| 0 | — | 0 | 9 | 25.16 | 222 |
| 2.5 | — | 0 | 2.36 | 119 | 620 |
| 2.5 | 6 | 0.5 | 2.6 | 107 | 578 |
| 2.5 | 6 | 1 | 3.6 | 74 | 456 |
| 2.5 | 6 | 2 | 5.3 | 48 | 342 |
| 2.5 | 12 | 0.5 | 2.5 | 113 | 598 |
| 2.5 | 12 | 1 | 3.2 | 87 | 502 |
| 2.5 | 12 | 2 | 4.5 | 55 | 375 |
| 5 | — | 0 | 1.77 | 187 | 825 |
| 5 | 6 | 0.5 | 1.96 | 154 | 692 |
| 5 | 6 | 1 | 2.5 | 114 | 603 |
| 5 | 6 | 2 | 3.1 | 93 | 523 |
| 5 | 12 | 0.5 | 1.93 | 167 | 766 |
| 5 | 12 | 1 | 2.3 | 121 | 628 |
| 5 | 12 | 2 | 2.70 | 101 | 557 |

Number of blows values variations with depth. (a) NS, SS-2.5&5C, (b) SS-2.5C:6F, (c) SS-2.5C:12F, (d) SS-5C:6F, and (e) SS-5C:12.
The values of DCPI were 2.6, 3.6, and 5.3 mm/blow for subgrade stabilized using 2.5% Portland cement content and 6 mm PPF with content levels of 0.5, 1, and 2%, respectively. Similarly, the study also investigated the effect of using 12 mm PPFs with content levels of 0.5, 1, and 2% in combination with 2.5% Portland cement for soil stabilization, where the findings of DCPI were 2.5, 3.2, and 4.5 mm/blow, respectively. The findings indicated that the values of DCPI increased gradually after reinforcing the cemented sand with polypropylene fiber.
After stabilizing the soil using 5% Portland cement and reinforced with 6 mm PPF with content levels of 0.5, 1, and 2%, the DCPI values were 1.96, 2.5, and 3.1 mm/blow, respectively. Finally, for soil stabilized using 5% Portland cement and reinforced with 12 mm PPF with content levels of 0.5, 1, and 2%, the DCPI values were 1.93, 2.3, and 2.7 mm/blow, respectively. Figure 10(b)–(e) displays the continuous blows for the DCP test with depth for different percentages of cement and discrete fiber.
In addition, two parameters were calculated from DCPI: CBR in situ and bearing capacity. For NS, the results showed that the CBR value was 25.16%, while the bearing capacity was 226 kPa. After stabilizing soils using 2.5% Portland cement by the weight of dry soil, the results showed that the CBR value increased from 25.16 to 119%, while the bearing capacity increased from 222 to 620 kPa. For soil stabilized using 5% Portland cement content, the CBR value was 187%, while the bearing capacity value was 825 kPa. The findings indicated that the increase in cement content from 2.5 to 5% led to increased CBR and bearing capacity. The findings showed that Portland cement addition enhances the soil’s CBR and bearing capacity. These improvements can be attributed to the formation of cementitious compounds that bind the soil particles together, resulting in a stronger and more stable soil matrix.
For subgrade stabilized using 2.5% Portland cement content and a 6 mm PPF with content levels of 0.5, 1, and 2%, the CBR values were 107, 74, and 48%, while the bearing capacity values were 578, 456, and 342 kPa, respectively. For soil stabilized using 2.5% Portland cement content and 12 mm PPF with content levels of 0.5, 1, and 2%, the CBR values were 113, 87, and 55%, while the bearing capacity values were 598, 502, and 375 kPa, respectively. The findings indicated that the values of CBR and bearing capacity decreased gradually after reinforcing the cemented sand with PPF.
In addition, after reinforced soil using 5% Portland cement with 6 mm PPF with content levels of 0.5, 1, and 2%, the CBR values were 154, 114, and 93%, while the bearing capacity values were 692, 603, and 523 kPa, respectively. Finally, for soil stabilized using 5% Portland cement with 12 mm PPF with content levels of 0.5, 1, and 2%, the CBR values were 167, 121, and 101%. In contrast, the bearing capacity values were 766, 628, and 557 kPa, respectively.
It is clear from this that adding PPF to the cemented sand mixture with content levels of 0.5 to 1% and then 2% caused an increase in DCPI and a decrease in CBR and bearing capacity. This may be due to the incomplete bonding of the cement particles with the soil grains due to the irregular distribution of the fibers into the cemented sand mixture. In addition, the results demonstrated that the 12 mm PPF could significantly improve soil qualities compared to the 6 mm PPF. It might be due to the fact that the longer fibers appear to provide the soil with more support than the shorter, discrete fibers. This is because longer fibers can interlock more tightly and stretch greater distances into the cemented sand mixture, resulting in good load distribution. Figure 11(a)–(c) explains the changes in DCPI, CBR, and bearing capacity by adding cement and fiber.

(a) DCPI value variations caused by adding different percentages of cement and discrete fiber. (b) CBR value variations caused by adding different percentages of cement and discrete fiber. (c) Bearing capacity value variations caused by adding different percentages of cement and discrete fiber.
4 Conclusions
The following conclusions were drawn from testing done on cemented sand mixtures with/without discrete fiber for various parameters:
The DCPI value of the natural subgrade soil tends to decrease with the addition of 2.5% Portland cement by weight of the dry ground, and the value continues to decline with increasing cement content until it reaches the minimum value when stabilized soil using 5% of Portland cement by weight of the dry ground.
Adding PPF to the cemented sand mixture gradually leads to an increase in the DCPI value. For sand stabilized using 2.5 and 5.0% Portland cement by weight of dry soil, when 6 and 12 mm PPF content increases from 0.5 to 1 and 2%, the DCPI value increases gradually until it reaches the maximum value at the discrete fiber content of 2%.
CBR increases when natural subgrade soil is stabilized using 2.5% Portland cement by dry soil weight, and when cement content is increased from 2.5 to 5%, the CBR value is approximately increased by 60%.
The addition of PPF to the cemented sand mixture causes a gradual decrease in CBR and bearing capacity values. For sand stabilized using 2.5 and 5.0% Portland cement by weight of dry soil, when 6 and 12 mm PPF content increases from 0.5 to 1 and 2%, the CBR and bearing capacity values decrease gradually until they reach a minimum value at fiber content 2%.
Adding 2.5% of Portland cement by the weight of dry soil to the natural subgrade causes an increase in bearing capacity. When increasing cement content from 2.5 to 5%, the bearing capacity rises approximately 35%.
The DCPI value for a 12 mm fiber is lower than that for 6 mm fibers. At the same time, CBR and bearing capacity for a 12 mm fiber is greater than those for 6 mm fibers for all rates. Therefore, discrete fibers with a length of 12 mm tend to give the soil more support than 6 mm discrete fibers.
The DCP test is a valuable method for assessing the strength properties of stabilized soils.
Acknowledgments
The authors would like to thank the engineers in Kerbala Governorate – the local administration – and Fosroc Company for their assistance in preparing all the materials required to complete this study. The authors would also like to express their gratitude to the staff of civil engineering laboratories at the University of Kerbela for providing the necessary devices and equipment to achieve the aim of this study.
-
Funding information: The authors state no funding involved.
-
Conflict of interest: The authors state no conflict of interest.
-
Data availability statement: Most datasets generated and analyzed in this study are in this submitted manuscript. The other datasets are available on reasonable request from the corresponding author with the attached information.
References
[1] AL Sa’adi AHM, Al-Khafaji FF, Hashim TM, Hussein MLA, Ali YA, Ali AH, et al. Prospect of using geotextile reinforcement within flexible pavement layers to reduce the effects of rutting in the middle and southern parts of Iraq. J Mech Behav Mater. 2022;31(1):323–36.10.1515/jmbm-2022-0040Search in Google Scholar
[2] Irokwe JO, Nwaogazie IL, Sule S. Effects of soil-cement stabilization on the index properties of subgrades of three selected roads in the Niger delta region of Nigeria. Open J Civ Eng. 2022;12(4):630–47.10.4236/ojce.2022.124035Search in Google Scholar
[3] Shaban AM, Alsabbagh A, Wtaife S, Suksawang N. Effect of pavement foundation materials on rigid pavement response. In IOP Conference Series: Materials Science and Engineering. Kerbala, Iraq: IOP Publishing; 2020.10.1088/1757-899X/671/1/012085Search in Google Scholar
[4] Abdila SR, Abdullah M, Ahmad R, Burduhos Nergis DD, Rahim S, Omar MF, et al. Potential of soil stabilization using ground granulated blast furnace slag (GGBFS) and fly ash via geopolymerization method: A review. Materials. 2022;15(1):375.10.3390/ma15010375Search in Google Scholar PubMed PubMed Central
[5] Hameed A, Shaban AM, Almuhanna RR. Performance of lime-treated sandy soils after sustainable reinforcement using waste plastic fibre. In IOP Conference Series: Materials Science and Engineering. Kerbala, Iraq: IOP Publishing; 2021.10.1088/1757-899X/1067/1/012047Search in Google Scholar
[6] Sbahieh S, Teymur B. The effect of fiber reinforcement on the behavior of cemented sand. In Proceedings of the XVII European Conference on Soil Mechanics and Geotechnical Engineering. Reykjavik, Iceland; 2019.Search in Google Scholar
[7] Li J, Tang C, Wang D, Pei X, Shi B. Effect of discrete fibre reinforcement on soil tensile strength. J Rock Mech Geotech Eng. 2014;6(2):133–7.10.1016/j.jrmge.2014.01.003Search in Google Scholar
[8] Mohajerani A, Hui SQ, Mirzababaei M, Arulrajah A, Horpibulsuk S, Abdul Kadir A, et al. Amazing types, properties, and applications of fibres in construction materials. Materials. 2019;12(16):2513.10.3390/ma12162513Search in Google Scholar PubMed PubMed Central
[9] Benziane MM, Della N, Denine S, Sert S, Nouri S. Effect of randomly distributed polypropylene fiber reinforcement on the shear behavior of sandy soil. Stud Geotech Mech. 2019;41(3):151–9.10.2478/sgem-2019-0014Search in Google Scholar
[10] Qadir D, Mohammad S, Paul SR. Fibre reinforcement of sandy soil. Int J Adv Res Sci Eng. 2017;6(4):703–9.Search in Google Scholar
[11] Al-Saray NA, Shafiqu QS, Ibrahim MA. Improvement of strength characteristics for sandy soils by polypropylene fibers (PPF). In Journal of Physics: Conference Series. Al-Qadisiyah, Iraq: IOP Publishing; 2021.10.1088/1742-6596/1895/1/012016Search in Google Scholar
[12] Hasrajain DR, Shah AK, Patel AM, Panchal JP, Alka MS. Effect of polypropylene fiber on CBR value of sand. Gandhinagar Inst Technol. 2015;2:101–10.Search in Google Scholar
[13] Consoli NC, Montardo JP, Donato M, Prietto PD. Effect of material properties on the behaviour of sand – cement – fibre composites. Proc Inst Civ Eng-Ground Improv. 2004;8(2):77–90.10.1680/grim.8.2.77.36370Search in Google Scholar
[14] Hamidi A, Hooresfand M. Effect of fiber reinforcement on triaxial shear behavior of cement treated sand. Geotext Geomembr. 2013;36:1–9.10.1016/j.geotexmem.2012.10.005Search in Google Scholar
[15] Singh D, Jha J, Gill K. Strength evaluation of soil subgrade using in-situ tests. Civ Eng Architecture. 2016;4(6):201–12.10.13189/cea.2016.040601Search in Google Scholar
[16] Cosentino PJ, Shaban AM, Boggs AM. Predicting bearing ratios of granular soils using dynamic cone penetrometer and modified PENCEL pressuremeter tests. In Innovations in geotechnical engineering. Orlando FL, United States: ASCE; 2018. p. 68–86.10.1061/9780784481639.003Search in Google Scholar
[17] Vakili AH, Salimi M, Shamsi M. Application of the dynamic cone penetrometer test for determining the geotechnical characteristics of marl soils treated by lime. Heliyon. 2021;7(9):1–7.10.1016/j.heliyon.2021.e08062Search in Google Scholar PubMed PubMed Central
[18] Encinares ES, Krizzia J, Encela D. Prediction of California Bearing Ratio (CBR) using Dynamic Cone Penetrometer (DCP) for soils from second district in the province of Sorsogon. United Int J Res Technol. 2022;3(5):12–6.Search in Google Scholar
[19] Yousif NA, Shaban AM, Almuhanna RR. Evaluating strength characteristics of unsaturated sand soils using dynamic cone resistance. In AIP Conference Proceedings. Kerbala, Iraq: AIP Publishing; 2023.10.1063/5.0131265Search in Google Scholar
[20] Mohammadi SD, Nikoudel MR, Rahimi H, Khamehchiyan M. Application of the Dynamic Cone Penetrometer (DCP) for determination of the engineering parameters of sandy soils. Eng Geol. 2008;101(3–4):195–203.10.1016/j.enggeo.2008.05.006Search in Google Scholar
[21] McElvaney J, Bundadidjatnika I. Strength evaluation of lime-stabilised pavement foundations using the dynamic cone penetrometer. Aust Road Res. 1991;21(1):40–52.Search in Google Scholar
[22] Livneh M, Ishai I, Livneh N. Automated DCP device versus manual DCP device. Road Transp Res. 1992;1(4):48–61.Search in Google Scholar
[23] Webster SL, Grau RH, Williams TP. Description and application of dual mass dynamic cone penetrometer. Mississippi, United States: US Army Corps of Engineers; 1992.Search in Google Scholar
[24] Ese D, Myre J, Noss P, Vaernes E. The use of dynamic cone penetrometer (DCP) for road strengthening design in Norway. In 4th International Conference, Bearing Capacity of Roads and Airfields FHWA, University of Minnesota, Army Corps of Engineers, NRC Canada, FAA; 1994.Search in Google Scholar
[25] Webster SL, Brown RW, Porter JR. Force projection site evaluation using the electric cone penetrometer (ECP) and the dynamic cone penetrometer (DCP). Mississippi, United States: US Army Corps of Engineers; 1994.Search in Google Scholar
[26] Gabr MA, Hopkins K, Coonse J, Hearne T. DCP criteria for performance evaluation of pavement layers. J Perform Constr Facil. 2000;14(4):141–8.10.1061/(ASCE)0887-3828(2000)14:4(141)Search in Google Scholar
[27] Chen D-H, Lin D-F, Liau P-H, Bilyeu J. A correlation between dynamic cone penetrometer values and pavement layer moduli. Geotech Test J. 2005;28(1):42–9.10.1520/GTJ12312Search in Google Scholar
[28] White DJ, Vennapusa KR, Gieselman HH, Johanson L, Siekmeier J. Alternatives to heavy test rolling for cohesive subgrade assessment. In Bearing capacity of roads, railways and airfields: Proceedings of the 8th International Conference on the Bearing Capacity of Roads, Railways and Airfields, Champaign, Illinois, USA, June 29–July 2, 2009. Champaign IL, United States: CRC Press; 2009.10.1201/9780203865286.ch6Search in Google Scholar
[29] Patel MA, Patel H. Experimental study to correlate the test results of PBT, UCS, and CBR with DCP on various soils in soaked condition. Int J Eng (IJE). 2012;6(5):244.Search in Google Scholar
[30] ASTM D2487. Standard practice for classification of soils for engineering purposes (Unified Soil Classification System). Weat Conshhocken, PA: ASTM International; 2011.Search in Google Scholar
[31] ASTM D1557-12. Standard test methods for laboratory compaction characteristics of soil using modified effort. West Conshohocken, PA: ASTM International; 2021.Search in Google Scholar
[32] ASTM D. Standard test methods for specific gravity of soil solids by water pycnometer D854; 2010.Search in Google Scholar
[33] ASTM D1883-16. Standard test method for California Bearing Ratio (CBR) of laboratory-compacted soils. West Conshohocken, PA: ASTM International; 2016.Search in Google Scholar
[34] BSI. BS 1377: 1990—Methods of Test for Soils for Civil Engineering Purposes. Milton Keynes: British Standards Institute; 1990. p. 32.Search in Google Scholar
[35] Choobbasti AJ, Vafaei A, Kutanaei SS. Mechanical properties of sandy soil improved with cement and nanosilica. Open Eng. 2015;5(1):1–6.10.1515/eng-2015-0011Search in Google Scholar
© 2023 the author(s), published by De Gruyter
This work is licensed under the Creative Commons Attribution 4.0 International License.
Articles in the same Issue
- Regular Articles
- Design optimization of a 4-bar exoskeleton with natural trajectories using unique gait-based synthesis approach
- Technical review of supervised machine learning studies and potential implementation to identify herbal plant dataset
- Effect of ECAP die angle and route type on the experimental evolution, crystallographic texture, and mechanical properties of pure magnesium
- Design and characteristics of two-dimensional piezoelectric nanogenerators
- Hybrid and cognitive digital twins for the process industry
- Discharge predicted in compound channels using adaptive neuro-fuzzy inference system (ANFIS)
- Human factors in aviation: Fatigue management in ramp workers
- LLDPE matrix with LDPE and UV stabilizer additive to evaluate the interface adhesion impact on the thermal and mechanical degradation
- Dislocated time sequences – deep neural network for broken bearing diagnosis
- Estimation method of corrosion current density of RC elements
- A computational iterative design method for bend-twist deformation in composite ship propeller blades for thrusters
- Compressive forces influence on the vibrations of double beams
- Research on dynamical properties of a three-wheeled electric vehicle from the point of view of driving safety
- Risk management based on the best value approach and its application in conditions of the Czech Republic
- Effect of openings on simply supported reinforced concrete skew slabs using finite element method
- Experimental and simulation study on a rooftop vertical-axis wind turbine
- Rehabilitation of overload-damaged reinforced concrete columns using ultra-high-performance fiber-reinforced concrete
- Performance of a horizontal well in a bounded anisotropic reservoir: Part II: Performance analysis of well length and reservoir geometry
- Effect of chloride concentration on the corrosion resistance of pure Zn metal in a 0.0626 M H2SO4 solution
- Numerical and experimental analysis of the heat transfer process in a railway disc brake tested on a dynamometer stand
- Design parameters and mechanical efficiency of jet wind turbine under high wind speed conditions
- Architectural modeling of data warehouse and analytic business intelligence for Bedstead manufacturers
- Influence of nano chromium addition on the corrosion and erosion–corrosion behavior of cupronickel 70/30 alloy in seawater
- Evaluating hydraulic parameters in clays based on in situ tests
- Optimization of railway entry and exit transition curves
- Daily load curve prediction for Jordan based on statistical techniques
- Review Articles
- A review of rutting in asphalt concrete pavement
- Powered education based on Metaverse: Pre- and post-COVID comprehensive review
- A review of safety test methods for new car assessment program in Southeast Asian countries
- Communication
- StarCrete: A starch-based biocomposite for off-world construction
- Special Issue: Transport 2022 - Part I
- Analysis and assessment of the human factor as a cause of occurrence of selected railway accidents and incidents
- Testing the way of driving a vehicle in real road conditions
- Research of dynamic phenomena in a model engine stand
- Testing the relationship between the technical condition of motorcycle shock absorbers determined on the diagnostic line and their characteristics
- Retrospective analysis of the data concerning inspections of vehicles with adaptive devices
- Analysis of the operating parameters of electric, hybrid, and conventional vehicles on different types of roads
- Special Issue: 49th KKBN - Part II
- Influence of a thin dielectric layer on resonance frequencies of square SRR metasurface operating in THz band
- Influence of the presence of a nitrided layer on changes in the ultrasonic wave parameters
- Special Issue: ICRTEEC - 2021 - Part III
- Reverse droop control strategy with virtual resistance for low-voltage microgrid with multiple distributed generation sources
- Special Issue: AESMT-2 - Part II
- Waste ceramic as partial replacement for sand in integral waterproof concrete: The durability against sulfate attack of certain properties
- Assessment of Manning coefficient for Dujila Canal, Wasit/-Iraq
- Special Issue: AESMT-3 - Part I
- Modulation and performance of synchronous demodulation for speech signal detection and dialect intelligibility
- Seismic evaluation cylindrical concrete shells
- Investigating the role of different stabilizers of PVCs by using a torque rheometer
- Investigation of high-turbidity tap water problem in Najaf governorate/middle of Iraq
- Experimental and numerical evaluation of tire rubber powder effectiveness for reducing seepage rate in earth dams
- Enhancement of air conditioning system using direct evaporative cooling: Experimental and theoretical investigation
- Assessment for behavior of axially loaded reinforced concrete columns strengthened by different patterns of steel-framed jacket
- Novel graph for an appropriate cross section and length for cantilever RC beams
- Discharge coefficient and energy dissipation on stepped weir
- Numerical study of the fluid flow and heat transfer in a finned heat sink using Ansys Icepak
- Integration of numerical models to simulate 2D hydrodynamic/water quality model of contaminant concentration in Shatt Al-Arab River with WRDB calibration tools
- Study of the behavior of reactive powder concrete RC deep beams by strengthening shear using near-surface mounted CFRP bars
- The nonlinear analysis of reactive powder concrete effectiveness in shear for reinforced concrete deep beams
- Activated carbon from sugarcane as an efficient adsorbent for phenol from petroleum refinery wastewater: Equilibrium, kinetic, and thermodynamic study
- Structural behavior of concrete filled double-skin PVC tubular columns confined by plain PVC sockets
- Probabilistic derivation of droplet velocity using quadrature method of moments
- A study of characteristics of man-made lightweight aggregate and lightweight concrete made from expanded polystyrene (eps) and cement mortar
- Effect of waste materials on soil properties
- Experimental investigation of electrode wear assessment in the EDM process using image processing technique
- Punching shear of reinforced concrete slabs bonded with reactive powder after exposure to fire
- Deep learning model for intrusion detection system utilizing convolution neural network
- Improvement of CBR of gypsum subgrade soil by cement kiln dust and granulated blast-furnace slag
- Investigation of effect lengths and angles of the control devices below the hydraulic structure
- Finite element analysis for built-up steel beam with extended plate connected by bolts
- Finite element analysis and retrofit of the existing reinforced concrete columns in Iraqi schools by using CFRP as confining technique
- Performing laboratory study of the behavior of reactive powder concrete on the shear of RC deep beams by the drilling core test
- Special Issue: AESMT-4 - Part I
- Depletion zones of groundwater resources in the Southwest Desert of Iraq
- A case study of T-beams with hybrid section shear characteristics of reactive powder concrete
- Feasibility studies and their effects on the success or failure of investment projects. “Najaf governorate as a model”
- Optimizing and coordinating the location of raw material suitable for cement manufacturing in Wasit Governorate, Iraq
- Effect of the 40-PPI copper foam layer height on the solar cooker performance
- Identification and investigation of corrosion behavior of electroless composite coating on steel substrate
- Improvement in the California bearing ratio of subbase soil by recycled asphalt pavement and cement
- Some properties of thermal insulating cement mortar using Ponza aggregate
- Assessment of the impacts of land use/land cover change on water resources in the Diyala River, Iraq
- Effect of varied waste concrete ratios on the mechanical properties of polymer concrete
- Effect of adverse slope on performance of USBR II stilling basin
- Shear capacity of reinforced concrete beams with recycled steel fibers
- Extracting oil from oil shale using internal distillation (in situ retorting)
- Influence of recycling waste hardened mortar and ceramic rubbish on the properties of flowable fill material
- Rehabilitation of reinforced concrete deep beams by near-surface-mounted steel reinforcement
- Impact of waste materials (glass powder and silica fume) on features of high-strength concrete
- Studying pandemic effects and mitigation measures on management of construction projects: Najaf City as a case study
- Design and implementation of a frequency reconfigurable antenna using PIN switch for sub-6 GHz applications
- Average monthly recharge, surface runoff, and actual evapotranspiration estimation using WetSpass-M model in Low Folded Zone, Iraq
- Simple function to find base pressure under triangular and trapezoidal footing with two eccentric loads
- Assessment of ALINEA method performance at different loop detector locations using field data and micro-simulation modeling via AIMSUN
- Special Issue: AESMT-5 - Part I
- Experimental and theoretical investigation of the structural behavior of reinforced glulam wooden members by NSM steel bars and shear reinforcement CFRP sheet
- Improving the fatigue life of composite by using multiwall carbon nanotubes
- A comparative study to solve fractional initial value problems in discrete domain
- Assessing strength properties of stabilized soils using dynamic cone penetrometer test
- Investigating traffic characteristics for merging sections in Iraq
- Enhancement of flexural behavior of hybrid flat slab by using SIFCON
- The main impacts of a managed aquifer recharge using AHP-weighted overlay analysis based on GIS in the eastern Wasit province, Iraq