Average monthly recharge, surface runoff, and actual evapotranspiration estimation using WetSpass-M model in Low Folded Zone, Iraq
-
Noor Q. Sabri

Abstract
The evaluation of the spatial and temporal distribution of groundwater recharge is required to develop the regional groundwater model for more precise simulations of various management scenarios. WetSpass-M (Water and Energy Transfer between Soil, Plants, and Atmosphere under Steady-State Conditions), which is a GIS-based spatially distributed water balance model, is deployed to evaluate monthly groundwater recharge, surface runoff, and actual evapotranspiration in the Low Folded Zone from 2000 to 2019. ArcGIS software prepares the essential relevant input data for the Wetspass-M model as grid maps. They include monthly climatological measurements (precipitation, temperature, and wind speed), land cover distribution, soil map, groundwater depth, topography, and slope. The mean annual groundwater recharge, evapotranspiration, and runoff were found to be 128, 131, and 72 mm, respectively. Accordingly, recharge accounts for 39% of the precipitation, while the rest, 40 and 21%, become evapotranspiration and surface runoff, respectively. WetSpass-M model results are meant to enable integrated groundwater modeling. The study of simulation data demonstrates that the WetSpass-M model accurately simulates the hydrological water budget components of the Low Folded Zone. In addition, a better understanding of the simulated spatial and temporal distribution of water balance components is beneficial for managing and planning the available water resources of the Low Folded Zone in Iraq, which faces water scarcity threats.
1 Introduction
Iraq is located in the fastest-warming area in the world, and temperatures have reached as high as
Groundwater can be restored immediately by precipitation, locally by depressions and streams, and implicitly by rivers and irrigation losses [7], urban recharge, and intermediate recharge [8]. Before or after entering surface water courses, some runoff may lead to groundwater recharge through indirect and intermediate processes [9]. The dynamics of groundwater recharge are important to water resource management techniques. This study focuses on the Low Folded Zone due to the lack of understanding of groundwater recharge dynamics despite many research efforts in the region. Inadequate information about recharge dynamics leads to the unsustainable growth of groundwater resources [10]. A crucial aspect for expanding to fulfill the requirements of domestic and farming usage, the water supply is necessary. Due to the increased demand for irrigation water in the Low Folded Zone and the predicted shifts in water extraction toward groundwater, it is recommended that the spatial and temporal distribution of groundwater recharge dynamics be evaluated for their efficient use. Various techniques have been employed to measure the amount of groundwater recharge [11]. Various techniques are available for assessing groundwater resources, including numerical modeling, physical methods, chemical tracing, water balance approaches, streamflow analysis, and so on [12]. Numerical modeling techniques have gained appreciation from researchers for their ability to provide precise, dependable, and swift estimations of groundwater recharge over space and time [13–19].
The presented study is the first work to evaluate the spatial and temporal distribution of water balance components in the Low Folded Zone, Iraq. The groundwater model will be developed using these data, aquifer geometry, and other boundary constraints.
2 Materials and methods
2.1 Study area
Low Folded Zone comprises approximately 13.6% of Iraq’s total land area and has a total area of
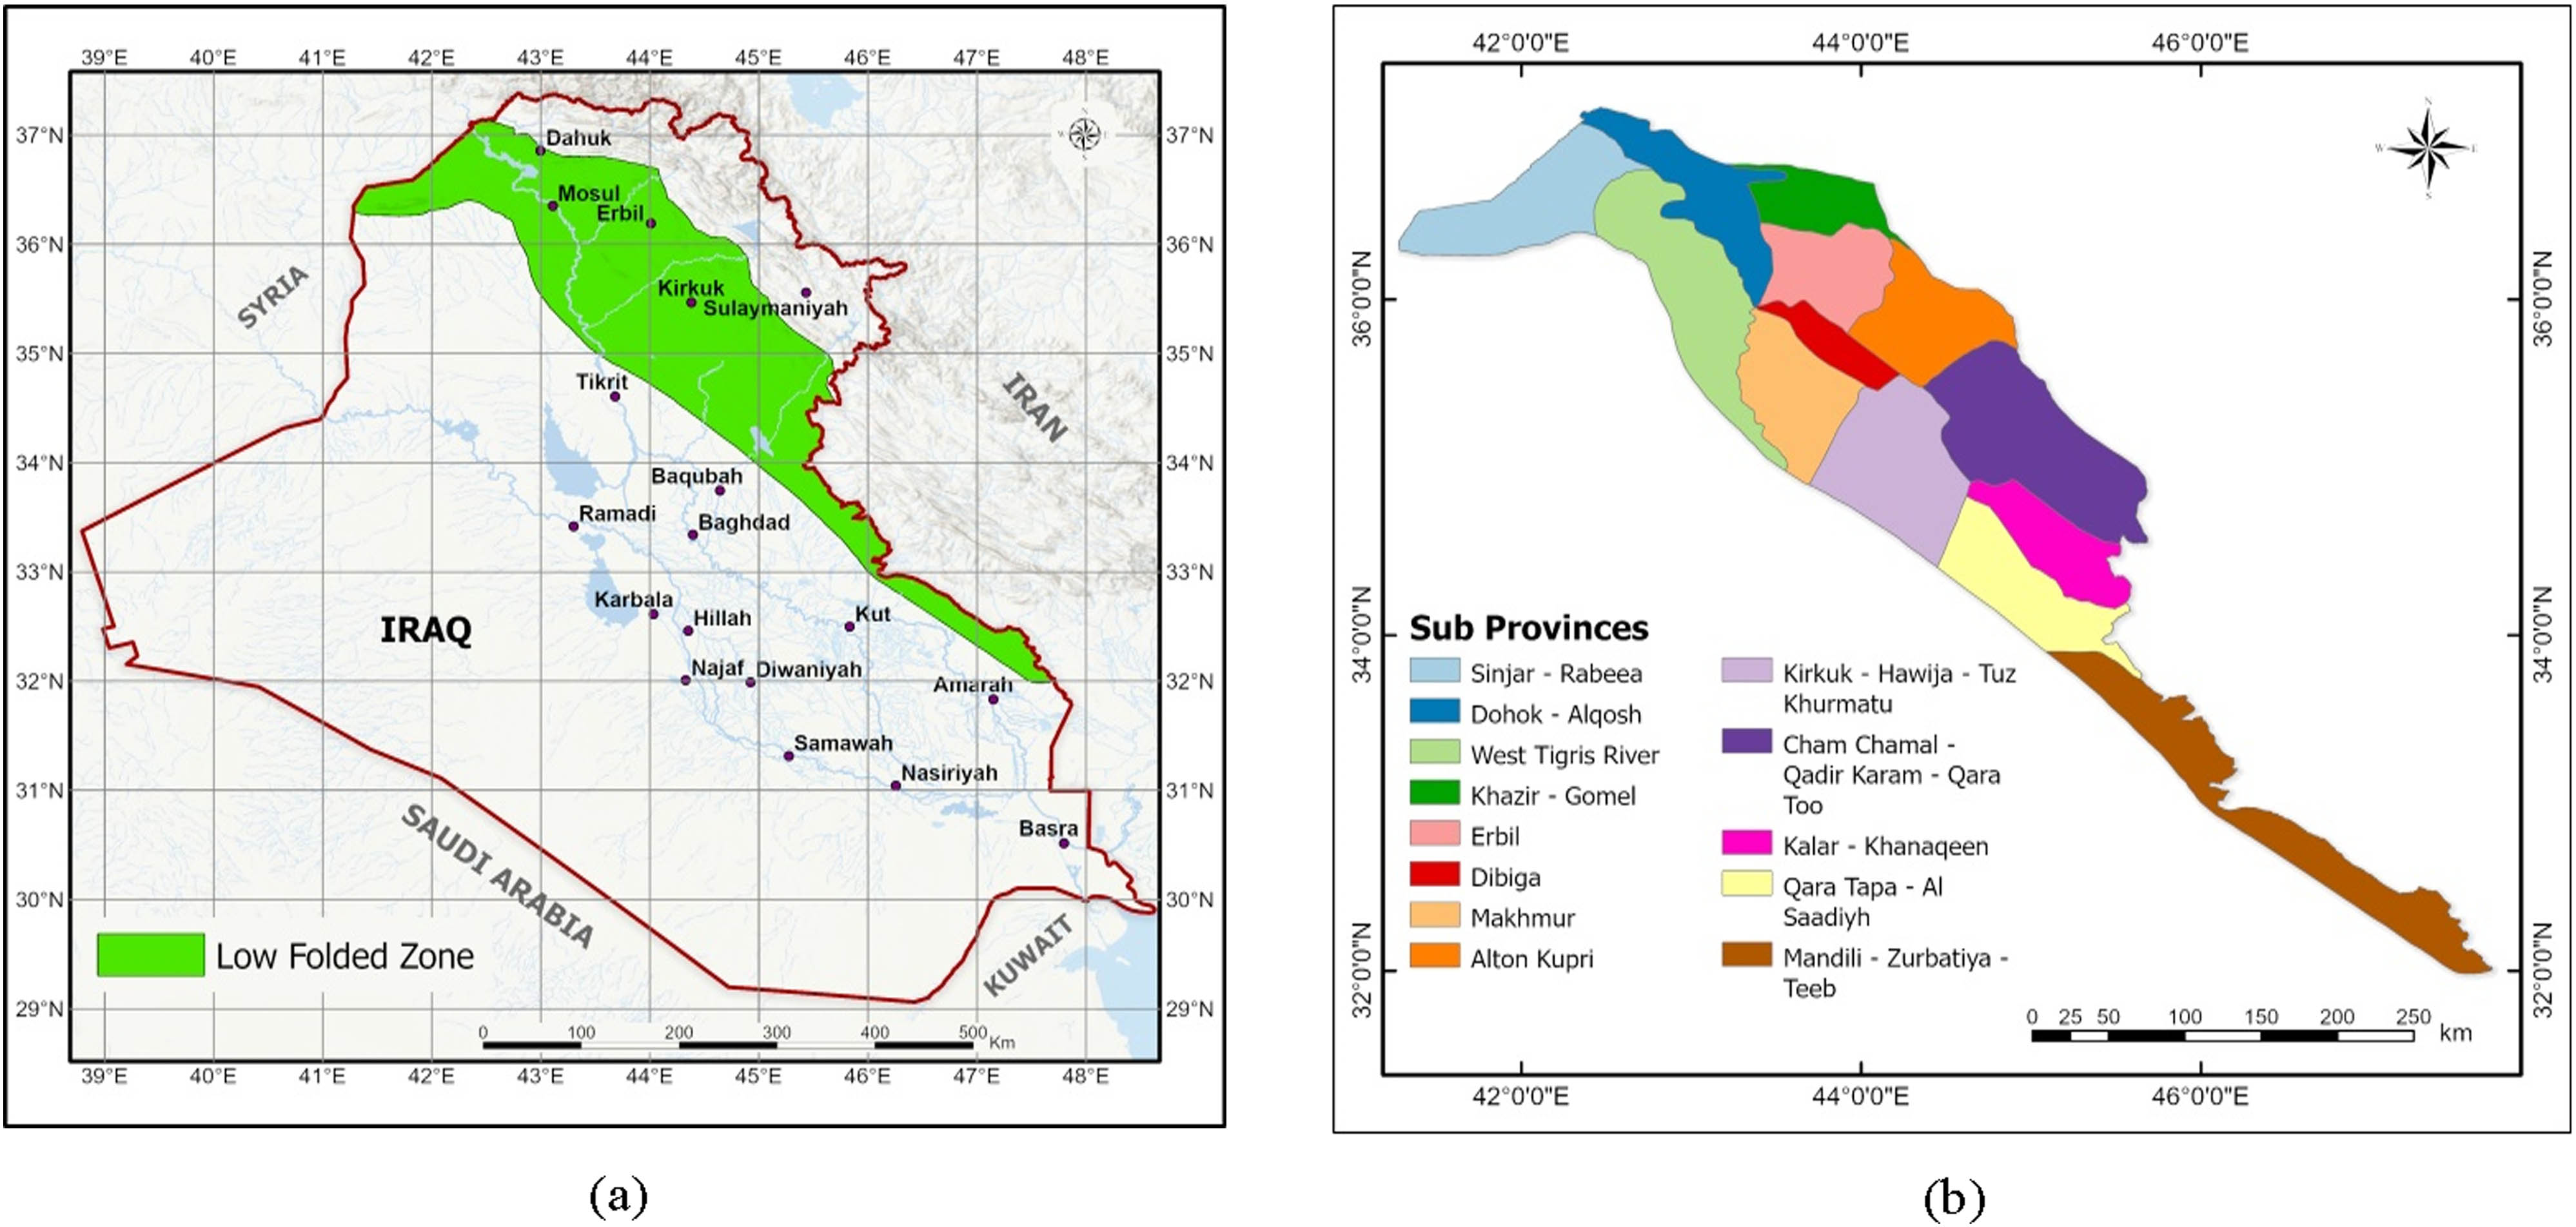
(a) Location map of the study area and (b) sub-provinces of the study area.
2.2 WetSpass model
Hydrological models are widely used to study hydrological processes across various scales, encompassing models ranging from local watersheds to global scales. However, each model has its own unique set of characteristics, limitations, and potential applications. WetSpass-M (Water and Energy Transfer between Soil, Plants, and Atmosphere under Steady-State Conditions) is a free, ArcGIS-based model simulating runoff, groundwater recharge, interception, and evapotranspiration processes. The WetSpass-M model is available for free download from https://github.com/WetSpass. In this study, the WetSpass-M model calculates the water balance of a grid cell by considering the fractions of bare soil, vegetation, impervious area, and open water. The WetSpass-M model offers numerous benefits, particularly in analyzing long-term spatial patterns of groundwater recharge [20]. The WetSpass-M model has been proven effective in accurately estimating groundwater recharge [21–24]. This study uses the WetSpass model to estimate yearly spatial groundwater recharge. The given equations are utilized to determine the “water balance” components of vegetated, bare soil, open water, and impervious fraction in each raster cell [25].
The total evapotranspiration (
2.2.1 Vegetated area
The water balance of the cultivated area is influenced by several factors, including the average monthly precipitation (
2.2.2 Interception
During the simulation period, the fraction value representing interception depends on the vegetation cover and a predetermined percentage of the annual precipitation value. As rainfall increases, the fraction value decreases since the vegetation cover remains constant.
2.2.3 Surface runoff
To calculate surface runoff, various factors such as the amount of precipitation, precipitation intensity, infiltration capacity, and interception are taken into account, with the initial step being the computation of the potential surface runoff (
Several factors, including soil type, slope, and vegetation cover, determine the coefficient for surface runoff in vegetative infiltration areas (
The parameter (
2.2.4 Evapotranspiration
Two factors must be calculated in seasonal computing evapotranspiration: a reference value for transpiration derived from open-water evaporation and a vegetation coefficient [9].
where
Using the Penman–Monteith equation, one can determine the vegetation coefficient as a typical ratio of vegetation transpiration, which estimates the likelihood of evaporation from open water.
where
where k is the constant of Von Karman
Variation in Penman coefficient/values as a function of temperature [25]
| T(oC) |
|
|
0 | 5 | 10 | 15 | 20 | 25 | 30 | 35 | 40 |
|---|---|---|---|---|---|---|---|---|---|---|---|
|
|
5.86 | 2.83 | 1.46 | 1.07 | 0.76 | 0.59 | 0.45 | 0.35 | 0.27 | 0.25 | 0.17 |
In areas where groundwater discharge occurs and is covered by vegetation, the actual transpiration (
where
where
provided
where
2.2.5 Recharge
Groundwater recharge refers to water flowing from the water level surface into a saturated groundwater zone. The model calculates the long-term average recharge as a spatial variable affected by various factors such as soil texture, land use, slope, and meteorological variables [27]. The model estimates recharge as a residual value in the water balance system. This process involves water moving from surface water into groundwater under the plant roots, known as “Vaduz.” In the WetSpass model, the computation of groundwater recharge
where
2.3 The “water balance” of “bare soil, open water,” and impermeable surfaces
Similar to vegetated areas, the water balance for bare soil, open water, and impervious surfaces is estimated using a comparable procedure. The primary contrast is that no vegetation exists in these scenarios, implying no interception or transpiration component. As a result, the ETv is substituted by
2.4 Model inputs
Inputs required for the WetSpass-M model include meteorological data, topographical information, land use/land cover, soil texture, groundwater depth, and leaf area index, which can be prepared in ASCII grid format using GIS software like ArcGIS 10.3.1. The model depends on the water balance principle (Figure 2). The final model grid for this study contains 385 rows, 405 columns, and 15,5925 square raster cells. The raster’s cell size (1,500 m length
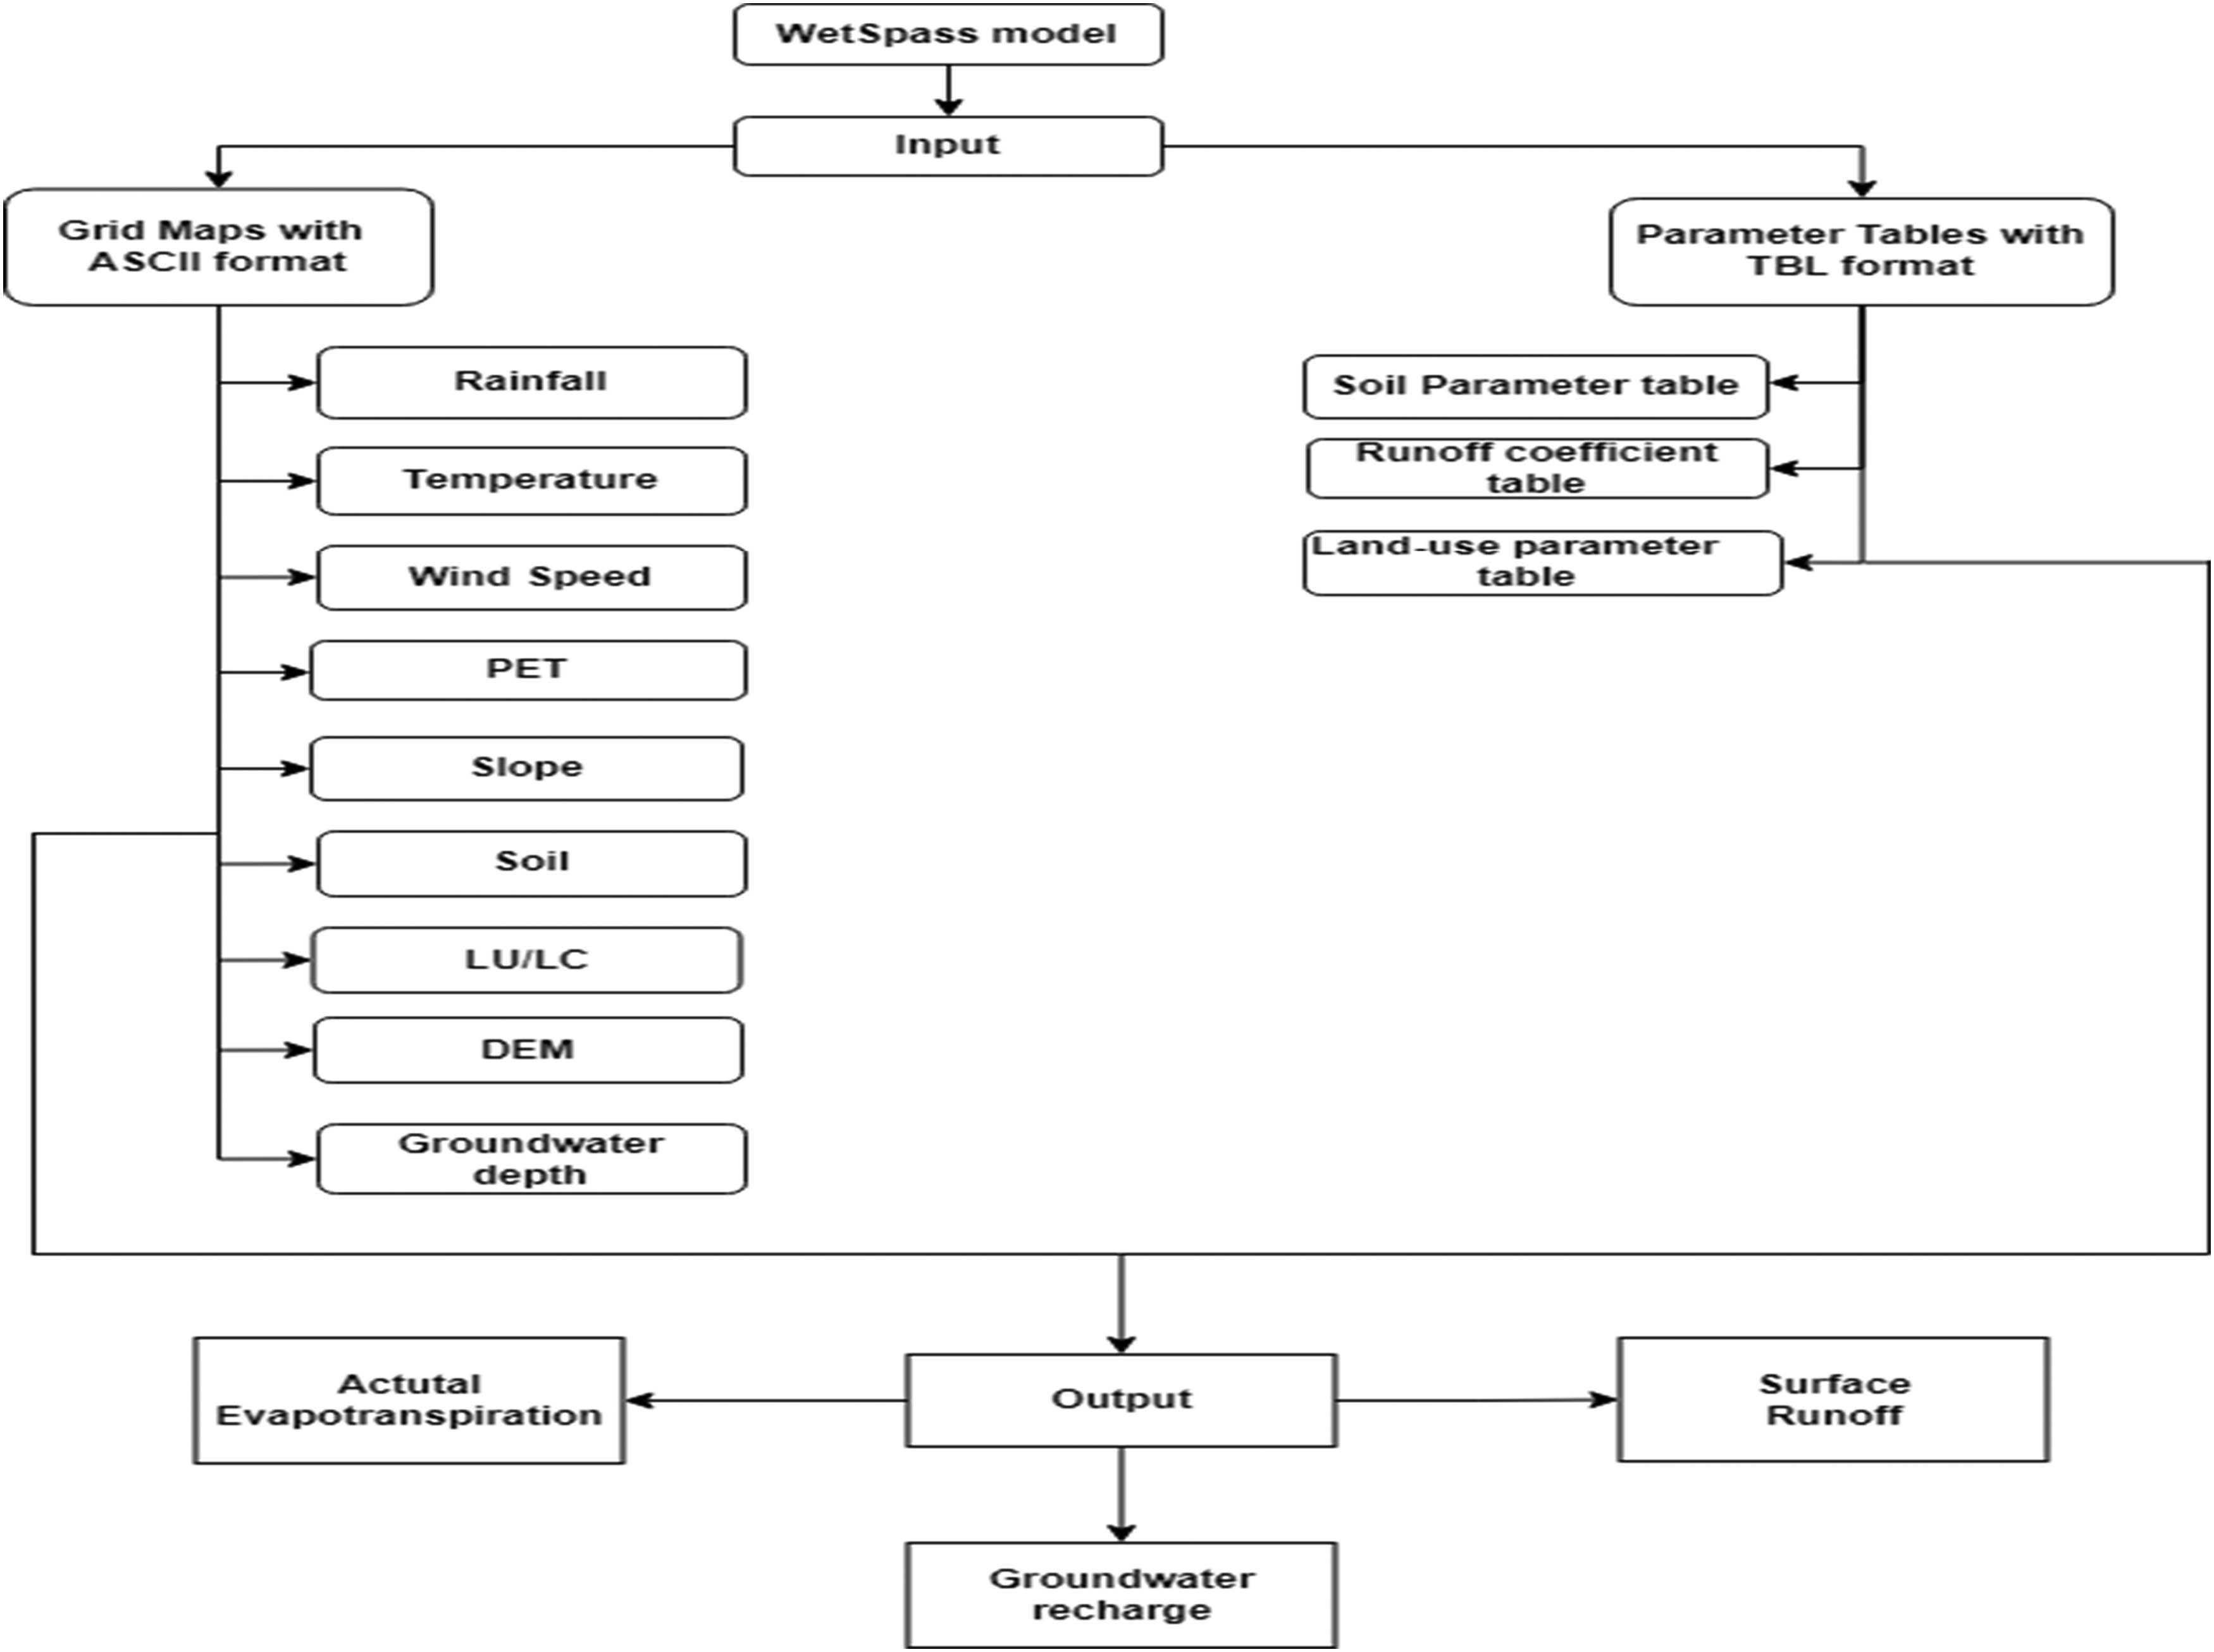
Schematic representation of the modeling process in the WetSpass model.
2.4.1 Topography
A 30 m resolution Digital Elevation Model (DEM) for 2014 is available on the US Geological Survey website (https://earthexplorer.usgs.gov/), obtained from the Aster satellite. The research area’s topographical values vary from 9 to 1,464 m above sea level, with an average elevation of approximately 318.214 m (Figure 3(a)).
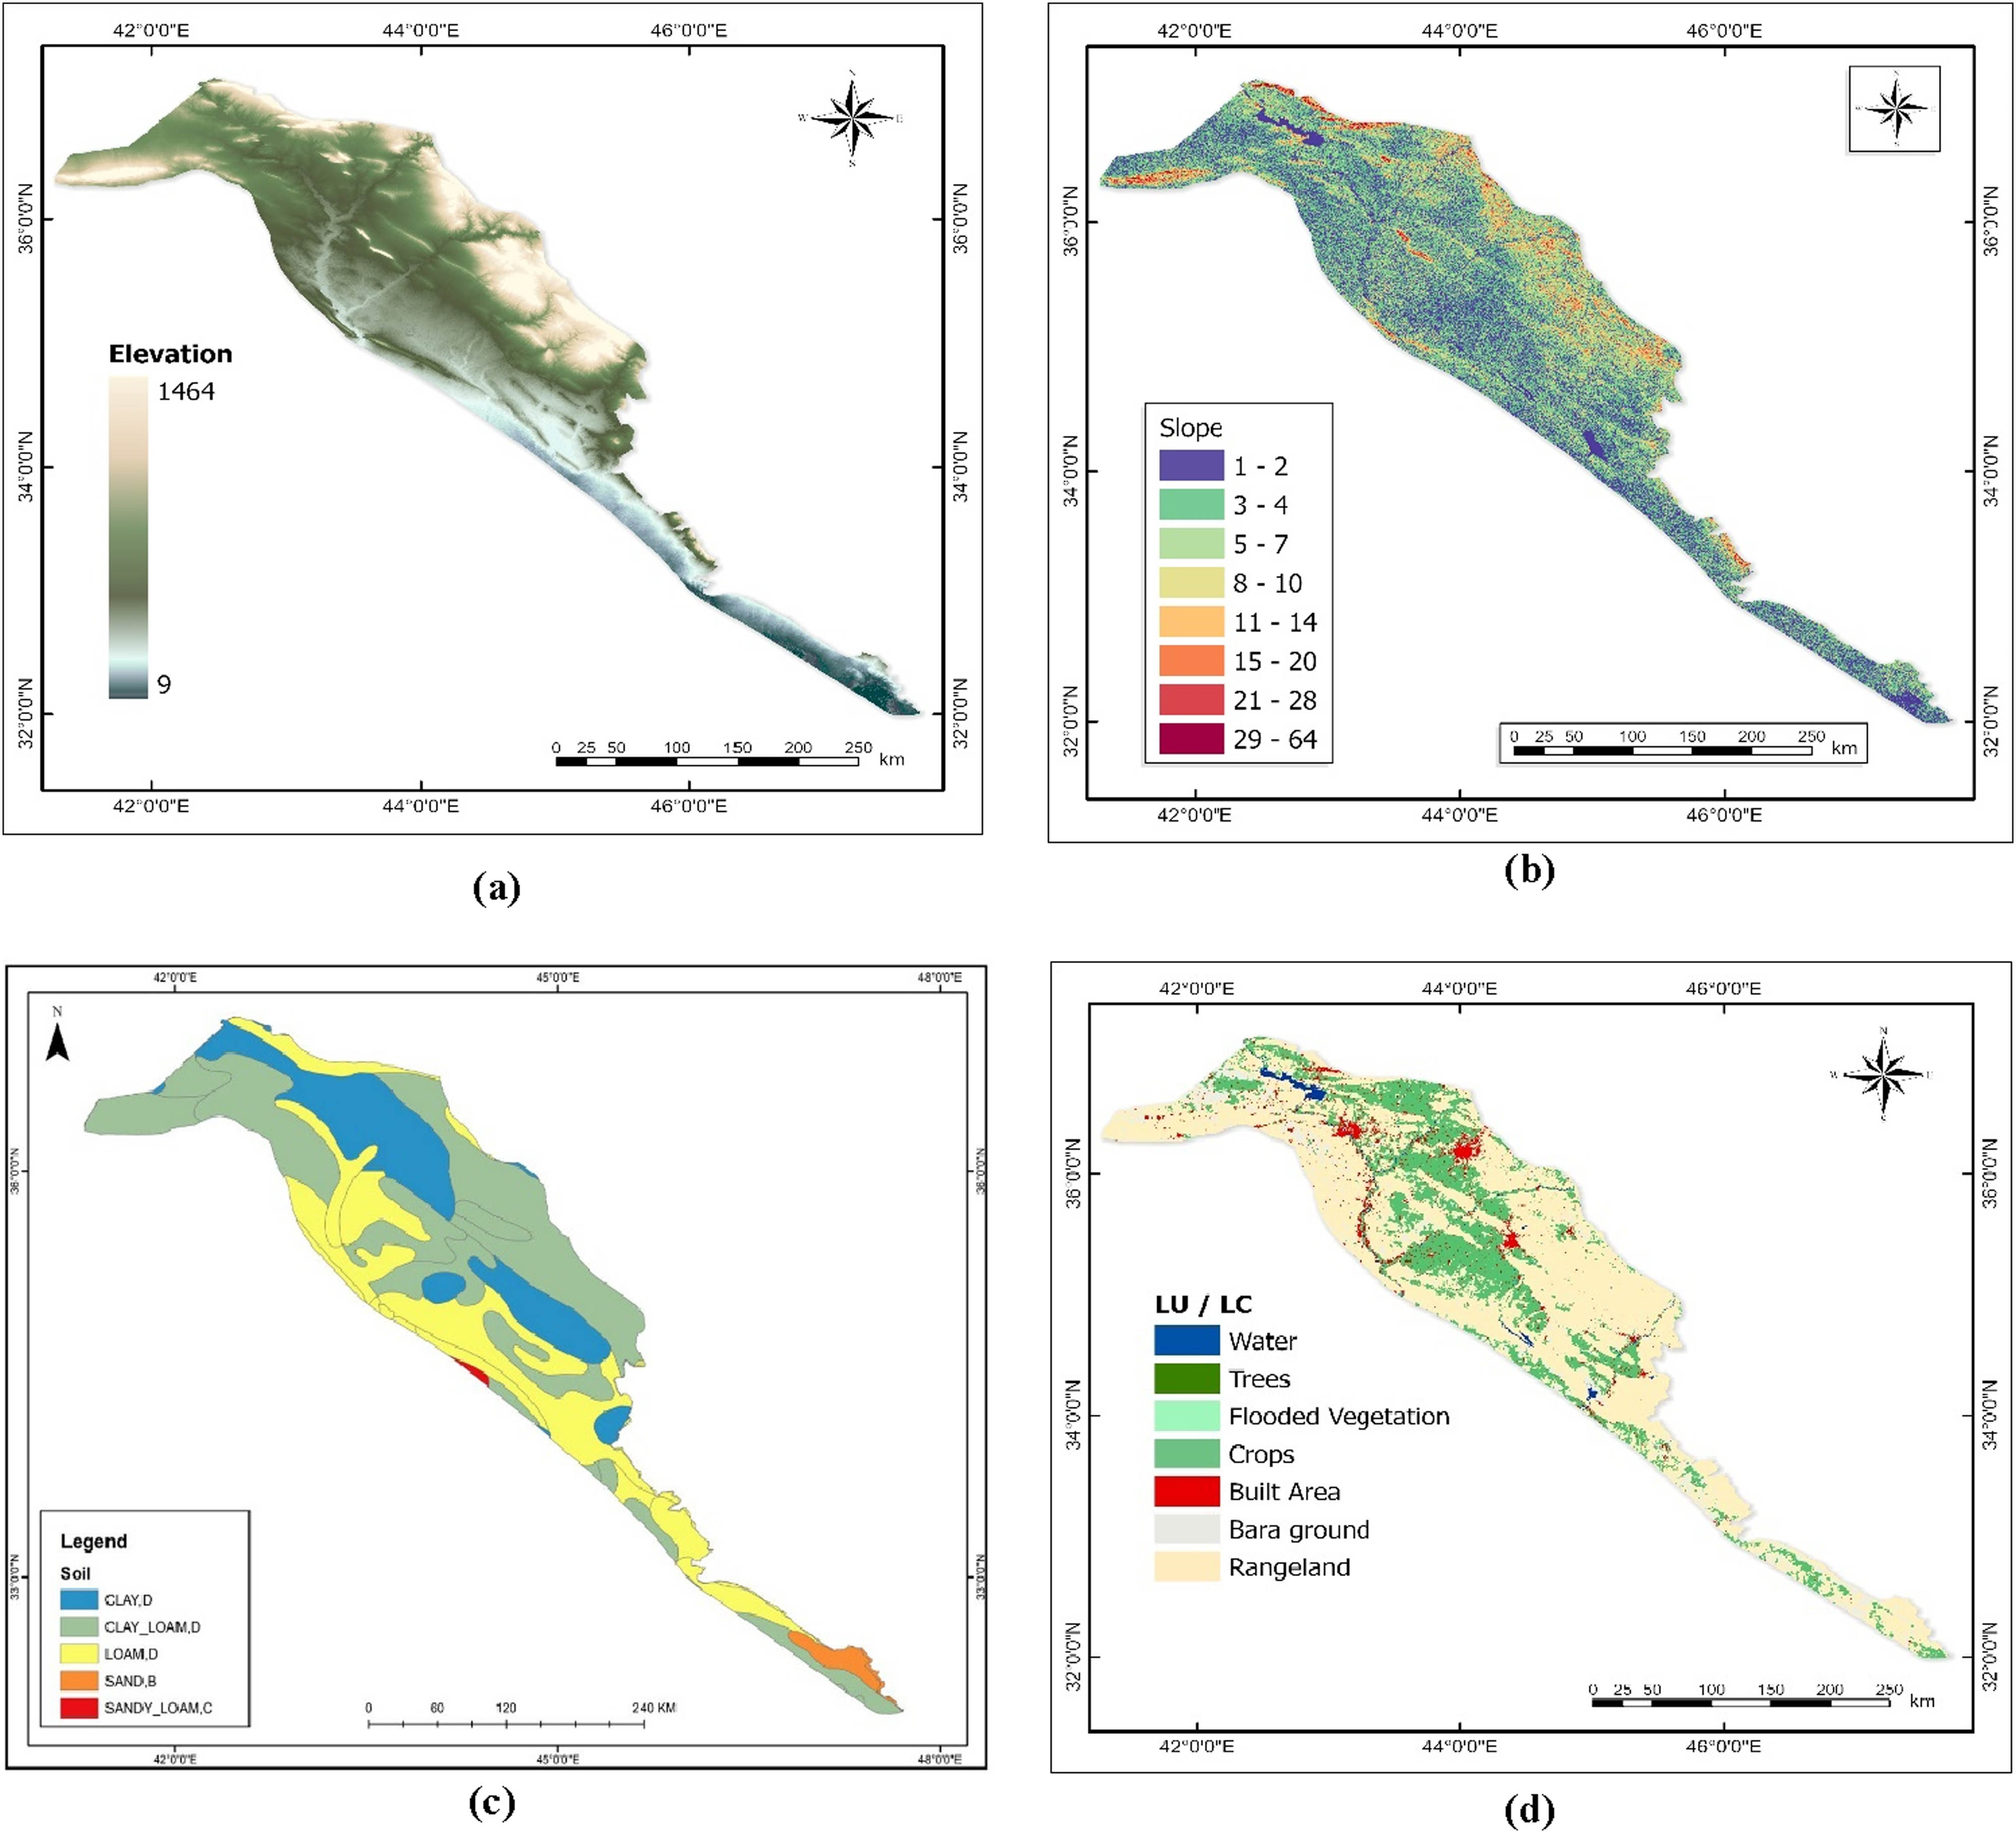
Input grid maps used for the WetSpass model. (a) Topographic map, (b) slope map, (c) soil textural map, and (d) LU/LC map of the Low Folded Zone.
2.4.2 Slope
Using ArcGIS, the slope map is derived from the DEM obtained from the Aster satellite with a 30 m resolution for 2014. The slope map ranges from 1 to 64%, with a mean value of 3.9 and a standard deviation of 4.16. Figure 3(b) shows the slope map of the Low Folded Zone. The area’s topography plays a vital role in determining most of the hydrological processes of the WetSpass spatially distributed hydrological model.
2.4.3 Soil texture
Soil textural information is crucial in the WetSpass model for quantifying recharge. To acquire soil data in this research, the FAOUNESCO (http://www.fao.org) soil map of the world, the soil textural map of the Low Folded Zone, was extracted using ArcGIS software by clipping the digital soil map of the world. A vector dataset at a scale of 1:5,000,000 was digitized and used for this purpose. The case study’s dominant soil textures are clay-D, Clay-loam -D, loam- D, Sand-B, and Sandy-loam-c (Figure 3(c)).
2.4.4 Land use and land cover
Obtaining a land-use/land-cover map is essential for determining the distribution of vegetation and its influence on water balance components from Sentinel-2, 10 m pixel size of raster using the following link: https://www.arcgis.com/apps/instant/media/index. Seven types of land use/land cover are identified in the study area: water, trees, flooded vegetation, crops, built area, bare ground, and rangeland (Figure 3(d)).
2.4.5 Groundwater depth
Classifying the groundwater table’s location is crucial for measuring recharge since shallow groundwater can experience significant evapotranspiration, especially in wetlands dependent on groundwater [20]. To run the WetSpass model, the groundwater table map is one of the necessary inputs.
Therefore, data for Wells have been gathered from The Ministry of Water Resources and the General Commission for Groundwater in Iraq. The groundwater depth for the study area ranges from 1 to 99 m (Figure 4).
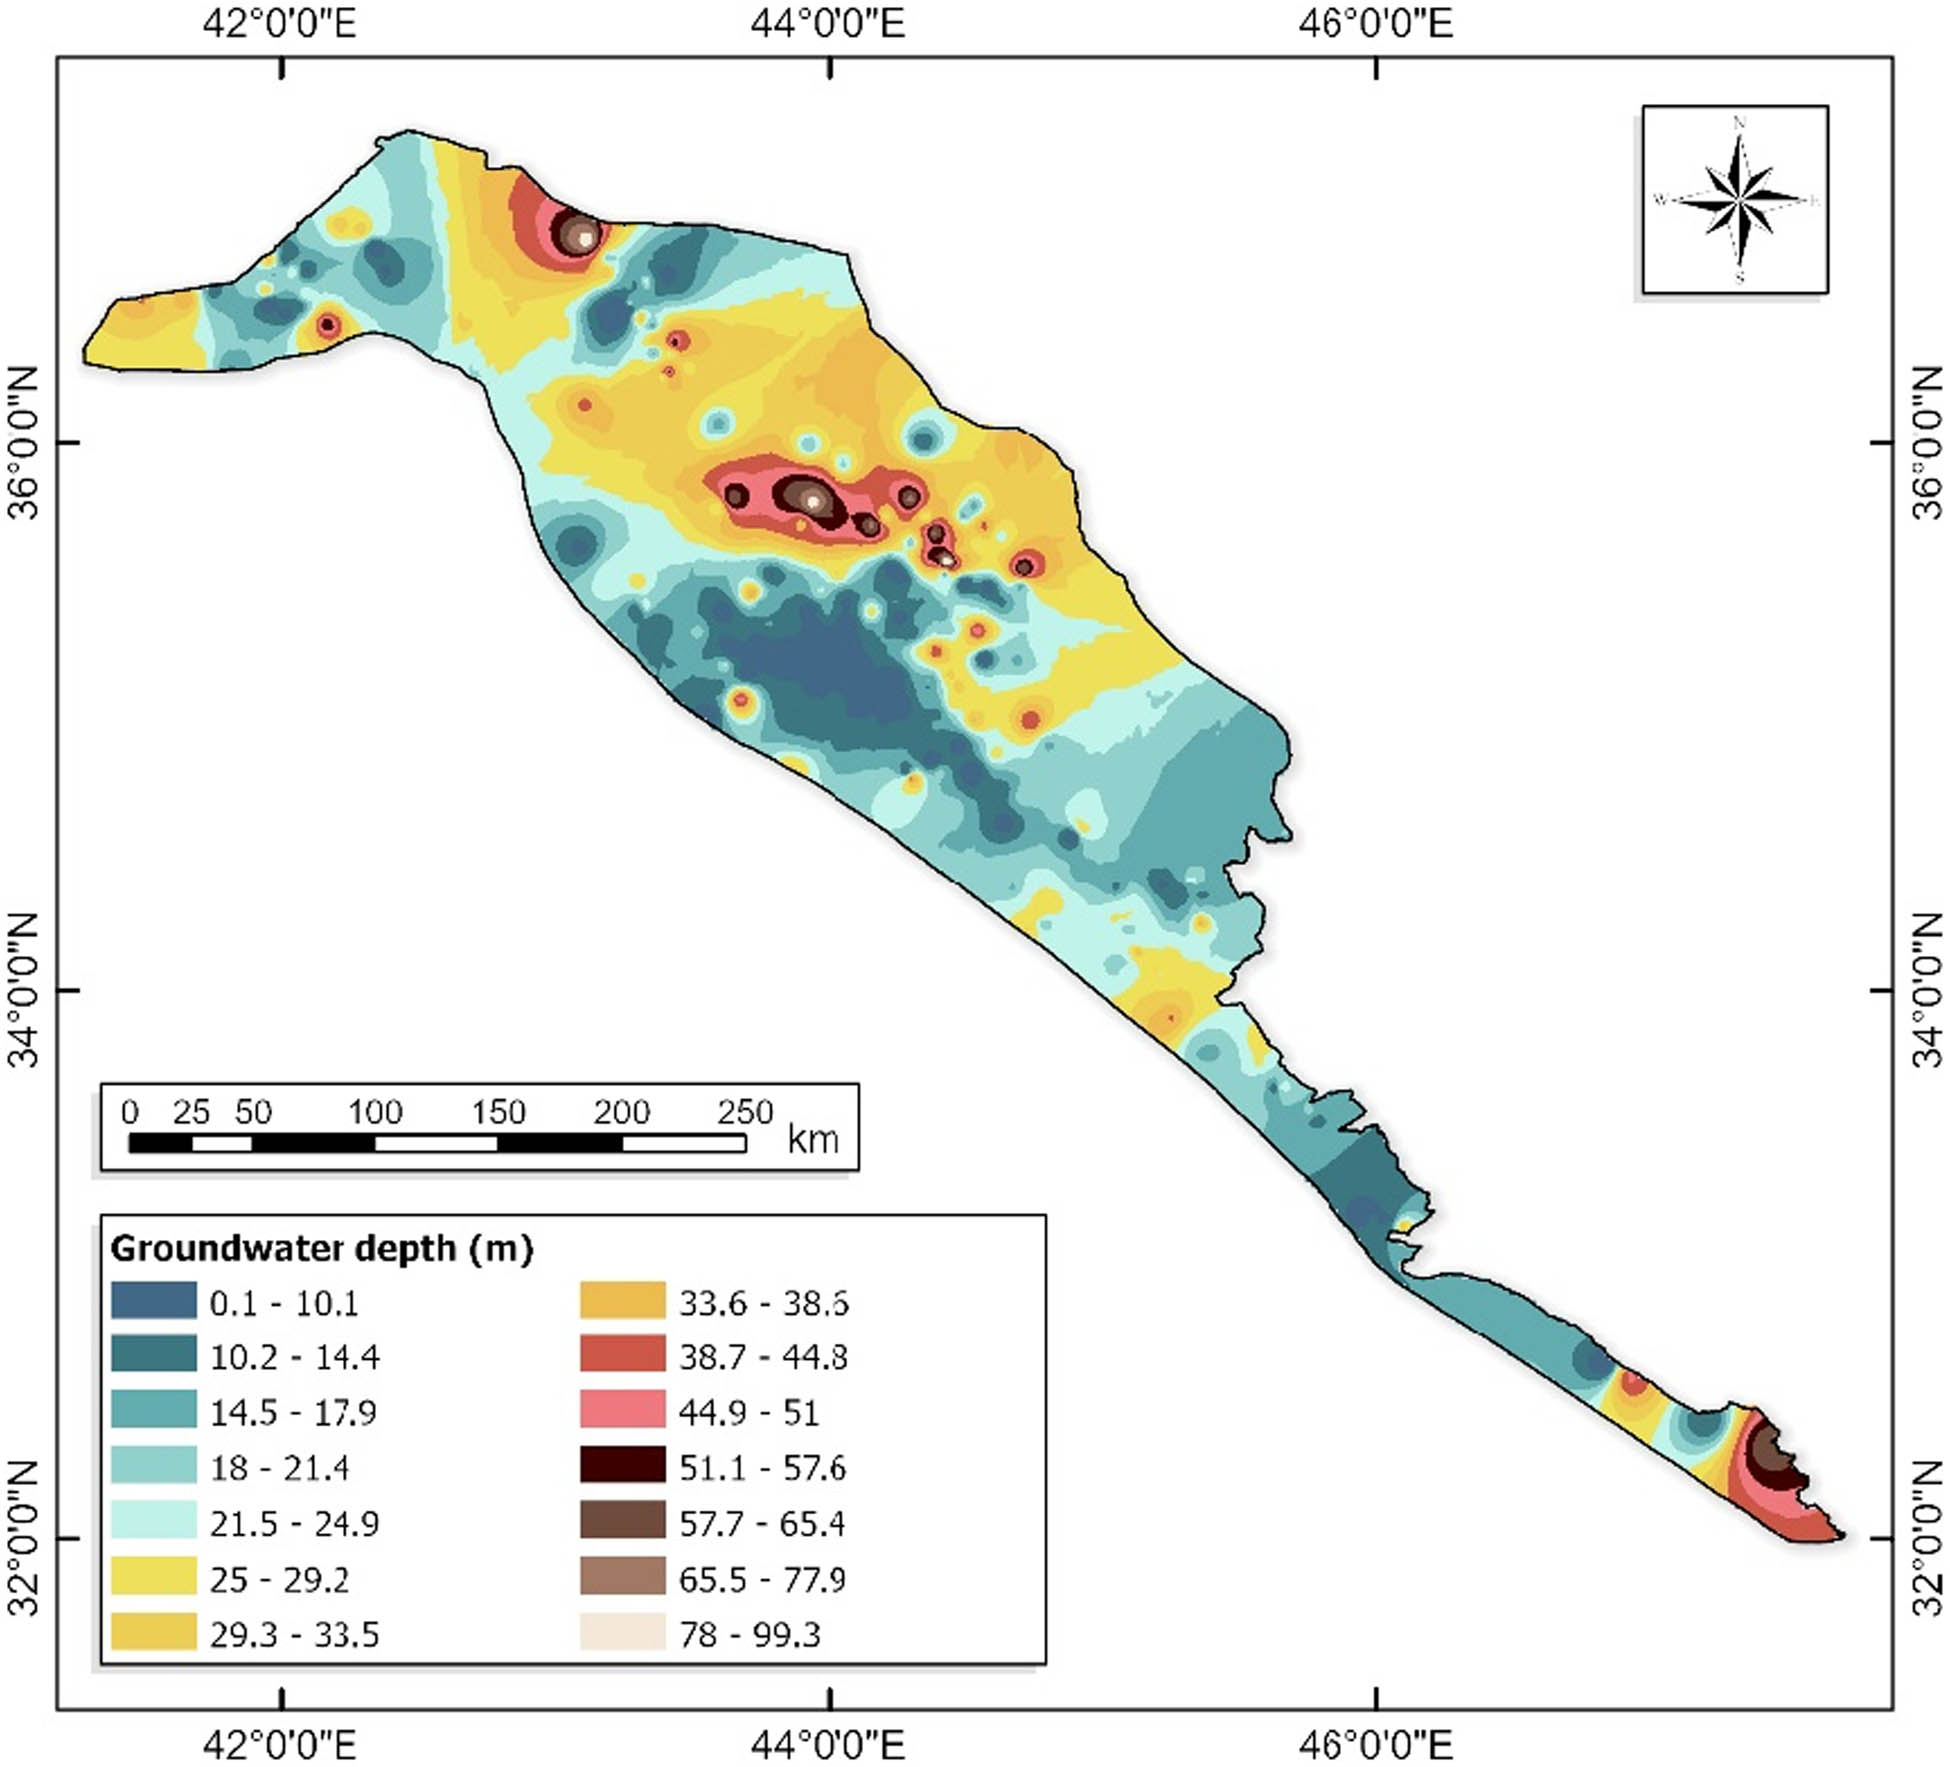
Spatial distribution of groundwater depth.
2.4.6 Precipitation
Figure 5(a) displays the average monthly rainfall (in mm) from 2000 to 2019. In the Low Folded Zone, the rainy season lasts 8 months, beginning in the latter half of October and ending in May. Occasionally, there may be some rainfall in October, but it is generally scarce. Precipitation is a crucial element of the hydrological cycle, serving as the driving force that leads to water availability and eventually recharges groundwater systems. This is particularly important in dry and semiarid regions, where precipitation is a significant source of groundwater recharge [28]. The average total rainfall was 320 mm per year. Precipitation data were obtained from the Iraqi meteorological organization and Seismicity.
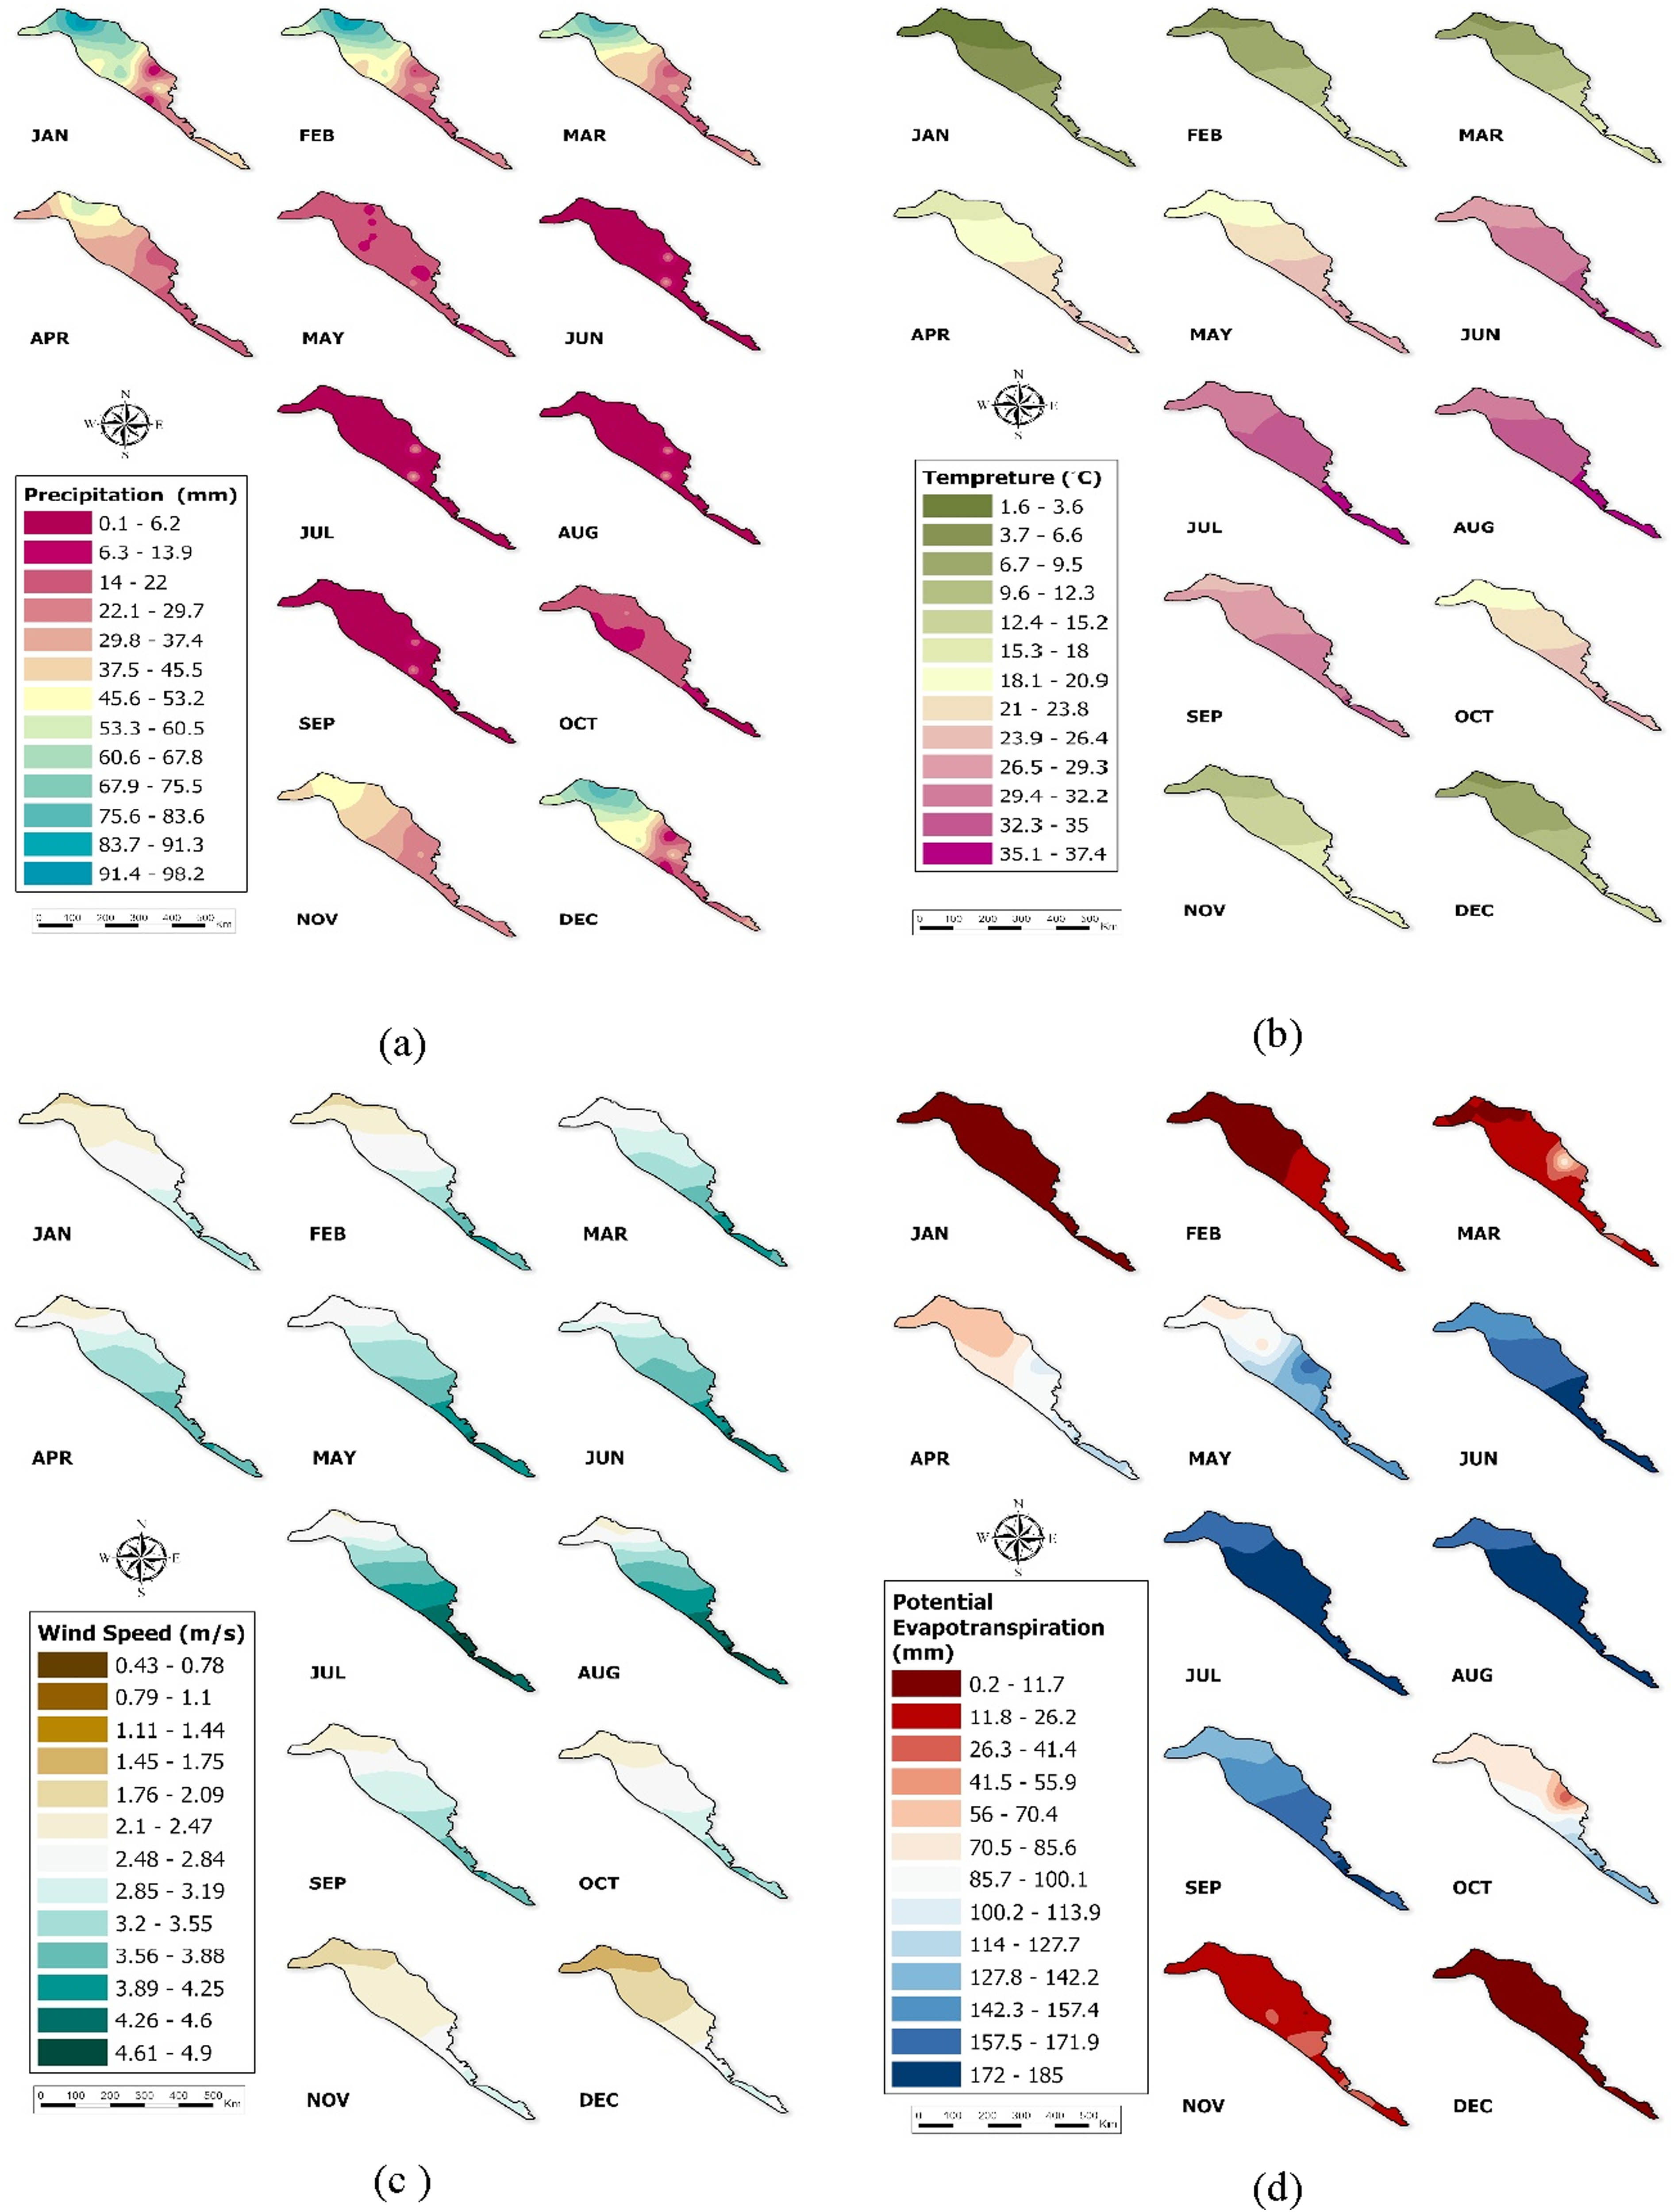
Meteorological data input into the WetSpass model. (a) Precipitation, (b) temperature, (c) wind speed, and (d) potential evapotranspiration.
2.4.7 Temperature
Low Folded Zone climate is characterized by average temperature degrees ranging from 4.5°C in January (the coldest month) to 33°C in July the (hottest). The 12 temperature maps from January to December. for the study area region from 2000–2019 are shown in Figure 5(b). Temperature data were obtained from ERA5-Land monthly averaged data from 2000 to 2019 [29].
2.4.8 Wind speed
The 12 maps of the average wind speed from January to December from 2000 to 2019 are shown in Figure 5(c). Wind velocity is a climatic factor that impacts the potential evaporation amount. It eliminates the air saturated with a moisture layer and replaces it with dry air, thus facilitating continuous evaporation. Wind data were obtained from ERA5-Land monthly averaged data from 2000 to 2019 [29].
2.4.9 Potential evapotranspiration
Thornthwaite’s method (1984) is used to compute potential transpiration evaporation precisely. It considers the monthly average temperatures and the available data for modifying the daytime radiation hours, making it more appropriate for the study area than other methods. The 12 maps of the average potential evapotranspiration from January to December from 2000–2019 (input in WetSpass-M model) are shown in Figure 5(d).
3 Results and discussion
3.1 Validation of WetSpass-M model
The authenticity of results obtained from any hydrological model is a critical aspect that requires validation. In this study, simulated values of the surface runoff components, groundwater recharge, and actual evapotranspiration have been validated against the calculated value of the surface runoff, groundwater recharge, and actual evapotranspiration.
3.1.1 Surface runoff
The soil conservation service – curve number (SCS-CN) method is widely used to calculate the direct surface runoff resulting from a specific rainfall event (Figure 6). Surface runoff ranges as shown in Figure 7.

Flow chart showing methodology to estimate surface runoff by the SCS-CN model.

Average monthly surface runoff, groundwater recharge, and evapotranspiration value estimated in Low Folded Zone, Iraq.
3.1.2 Recharge estimation
The groundwater balance is determined by the water flow entering and exiting an aquifer through a zone budget, such as a drainage basin. The water balance relies on the equivalence of input and output, so any modification to either input or output will change storage (
where
3.1.3 Actual evapotranspiration
According to the following criteria, the actual evapotranspiration (AET) is calculated [32]:
Simulated surface runoff, recharge, and actual evapotranspiration exhibit excellent agreement with validated results by the WetSpass-M model and the calculated surface runoff, recharge, and actual evapotranspiration. The performance evaluation of the WetSpass-M model was made using the statistics indicated in Figures 8, 9, 10, and Tables 2 and 3.
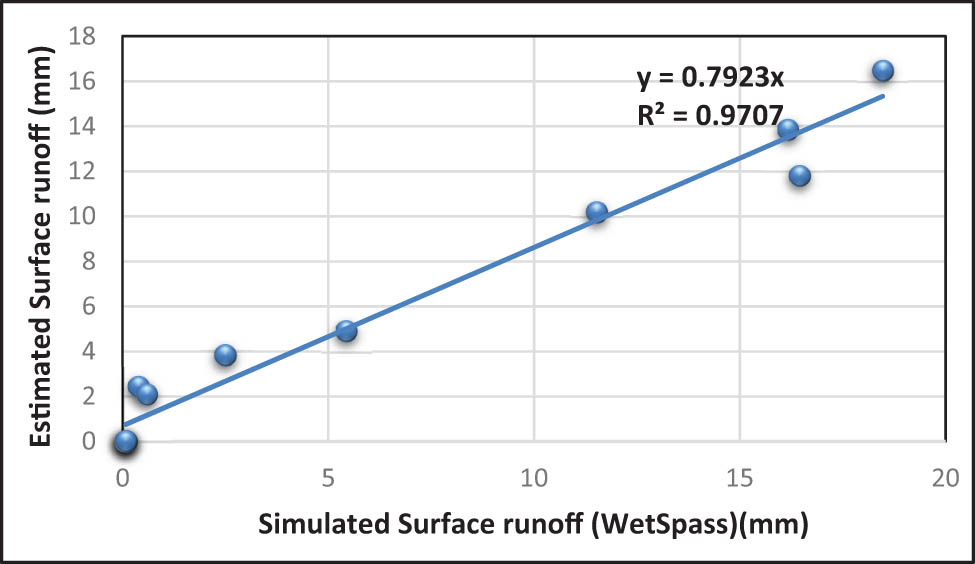
The linear relationship between simulated and estimated surface runoff.
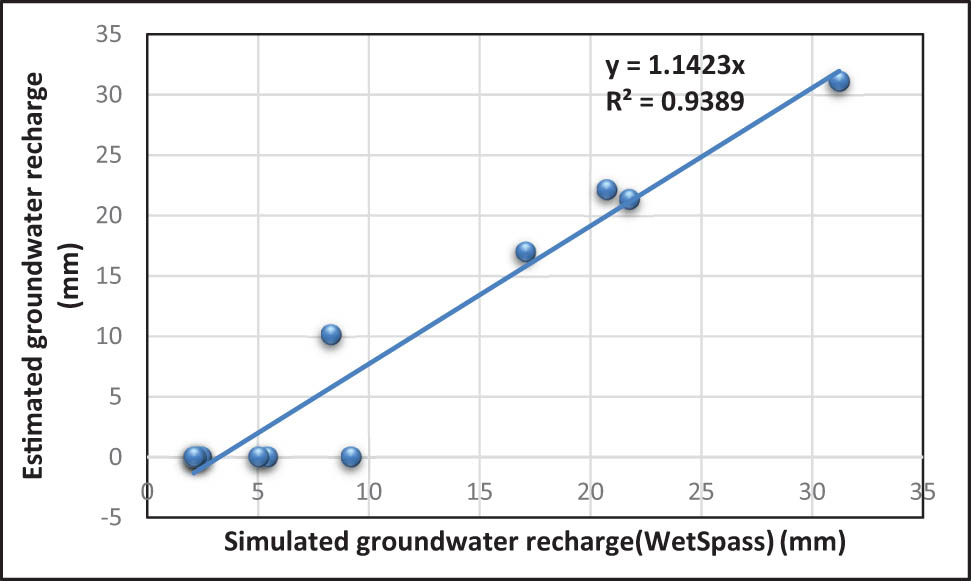
The linear relationship between simulated and estimated groundwater recharge.
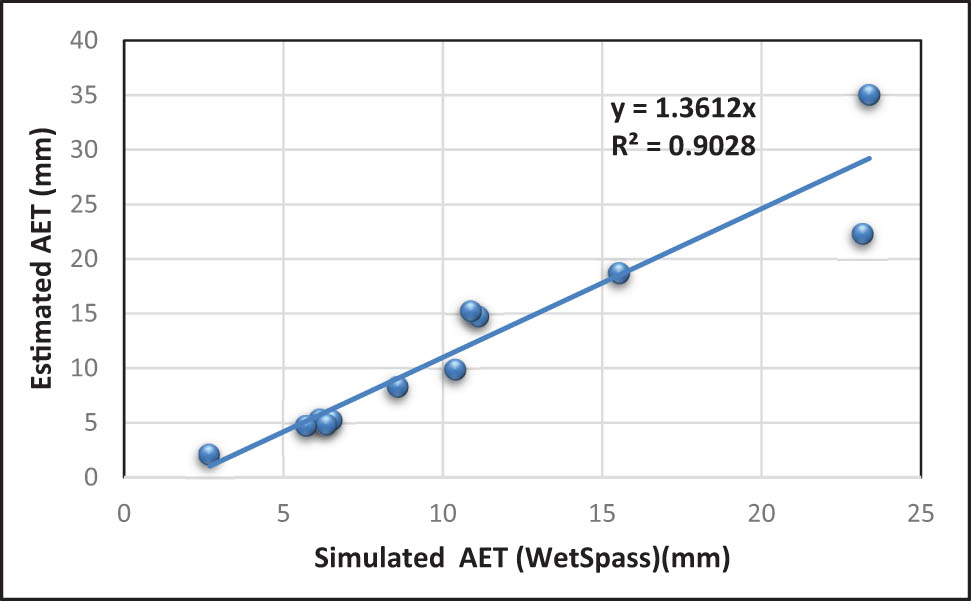
The linear relationship between simulated and estimated actual evapotranspiration.
Model’s performance rating is based on the RSR [30]
| Performance rating | RSR |
|---|---|
| Very good | 0
|
| Good | 0.5
|
| Satisfactory | 0.6
|
| Unsatisfactory | RSR
|
Performance evaluations for the wetspass-model output parameter
| WetSpass-M model |
|
RMSE | RSR | Performance |
|---|---|---|---|---|
| Surface runoff | 0.97 | 1.86 | 0.08 | Very good |
| Groundwater recharge | 0.96 | 3.72 | 0.1 | Very good |
| Actual evapotranspiration | 0.9 | 3.89 | 0.088 | Very good |
3.2 Temporal and spatial distribution of simulated water balance components
WetSpass-M model produces monthly raster maps of surface runoff, actual evapotranspiration, groundwater recharge, and an interception from 2000 to 2019. Each pixel on the map represents a distinct value of the water balance component [23]. This is the first study to assess water balance components’ spatial and temporal distribution in the Low Folded Zone, Iraq. The temporal and spatial monthly surface runoff, recharge, and actual evapotranspiration values, which the WetSpass-M model simulated, are shown in Table 4 and Figures 11, 12, 13.
Monthly simulated water balance components by WetSpass model in Low Folded Zone
| Month | Water balance components (mm) | Min | Max | Range | Mean | STD |
|---|---|---|---|---|---|---|
| Rainfall | 3.06 | 98.21 | 95.15 | 54.55 | 26.69 | |
| Jan | Evapotranspiration | 0.53 | 15.69 | 15.16 | 2.66 | 1.85 |
| Runoff | 0 | 94 | 94 | 18 | 12 | |
| Recharge | 0 | 68.17 | 68.17 | 31.08 | 13.41 | |
| Rainfall | 5.36 | 97.99 | 92.63 | 50.98 | 27.69 | |
| Feb | Evapotranspiration | 5.39 | 26.59 | 21.2 | 10.33 | 2.28 |
| Runoff | 1 | 90 | 89 | 16 | 13 | |
| Recharge | 0 | 54.59 | 54.59 | 21.66 | 12.86 | |
| Rainfall | 10.19 | 84.17 | 73.98 | 45.83 | 22.275 | |
| Mar | Evapotranspiration | 7.8 | 114.13 | 106.33 | 15.31 | 4.4 |
| Runoff | 0 | 79 | 79 | 11 | 11 | |
| Recharge | 0 | 47.12 | 47.12 | 16.96 | 11.368 | |
| Rainfall | 13.43 | 63.04 | 49.61 | 35.2 | 14.14 | |
| Apr | Evapotranspiration | 3 | 202 | 199 | 23 | 15 |
| Runoff | 0 | 57 | 57 | 2 | 5 | |
| Recharge |
|
19.19 |
|
9.15 | 3.67 | |
| Rainfall | 3.73 | 28.09 | 24.36 | 14.71 | 6.89 | |
| May | Evapotranspiration | 2 | 311 | 309 | 11 | 21 |
| Runoff | 0 | 23 | 23 | 0 | 2 | |
| Recharge |
|
12.77 |
|
5.23 | 2.14 | |
| Rainfall | 0.02 | 32.92 | 32.9 | 5.29 | 11.3 | |
| Jun | Evapotranspiration | 0 | 352 | 352 | 5 | 32 |
| Runoff | 0 | 23 | 23 | 0 | 1 | |
| Recharge |
|
12.8 |
|
2.03 | 2.3 | |
| Rainfall | 0 | 34.85 | 34.85 | 5.23 | 12.344 | |
| Jul | Evapotranspiration | 0 | 363 | 363 | 6 | 35 |
| Runoff | 0 | 25 | 25 | 0 | 1 | |
| Recharge |
|
13.28 | ‒201.98 | 2.01 | 2.59 | |
| Rainfall | 0 | 33.04 | 33.04 | 4.83 | 11.76 | |
| Aug | Evapotranspiration | 0 | 356 | 365 | 6 | 36 |
| Runoff | 0 | 23 | 23 | 0 | 1 | |
| Recharge |
|
12.14 | ‒207.92 | 1.84 | 2.59 | |
| Rainfall | 0.0485 | 27.87 | 27.82 | 4.72 | 9.488 | |
| Sep | Evapotranspiration | 0 | 332 | 332 | 5 | 30 |
| Runoff | 0 | 20 | 20 | 0 | 1 | |
| Recharge |
|
10.1 | 167.18 | 1.8 | 2.1 | |
| Rainfall | 3.29 | 25.13 | 21.84 | 15.193 | 5.083 | |
| Oct | Evapotranspiration | 1 | 231 | 230 | 10 | 17 |
| Runoff | 0 | 20 | 20 | 1 | 2 | |
| Recharge |
|
12.68 | 70.12 | 4.866 | 2.22 | |
| Rainfall | 7.61 | 60.73 | 53.12 | 37.305 | 14.966 | |
| Nov | Evapotranspiration | 12 | 56 | 44 | 23 | 4 |
| Runoff | 0 | 50 | 50 | 5 | 5 | |
| Recharge | 0 | 21 | 21 | 8 | 5 | |
| Rainfall | 4.65 | 82.22 | 77.57 | 48.17 | 24.1594 | |
| Dec | Evapotranspiration | 0 | 21 | 21 | 9 | 2 |
| Runoff | 1 | 80 | 79 | 16 | 12 | |
| Recharge | 0 | 47 | 47 | 21 | 10 |
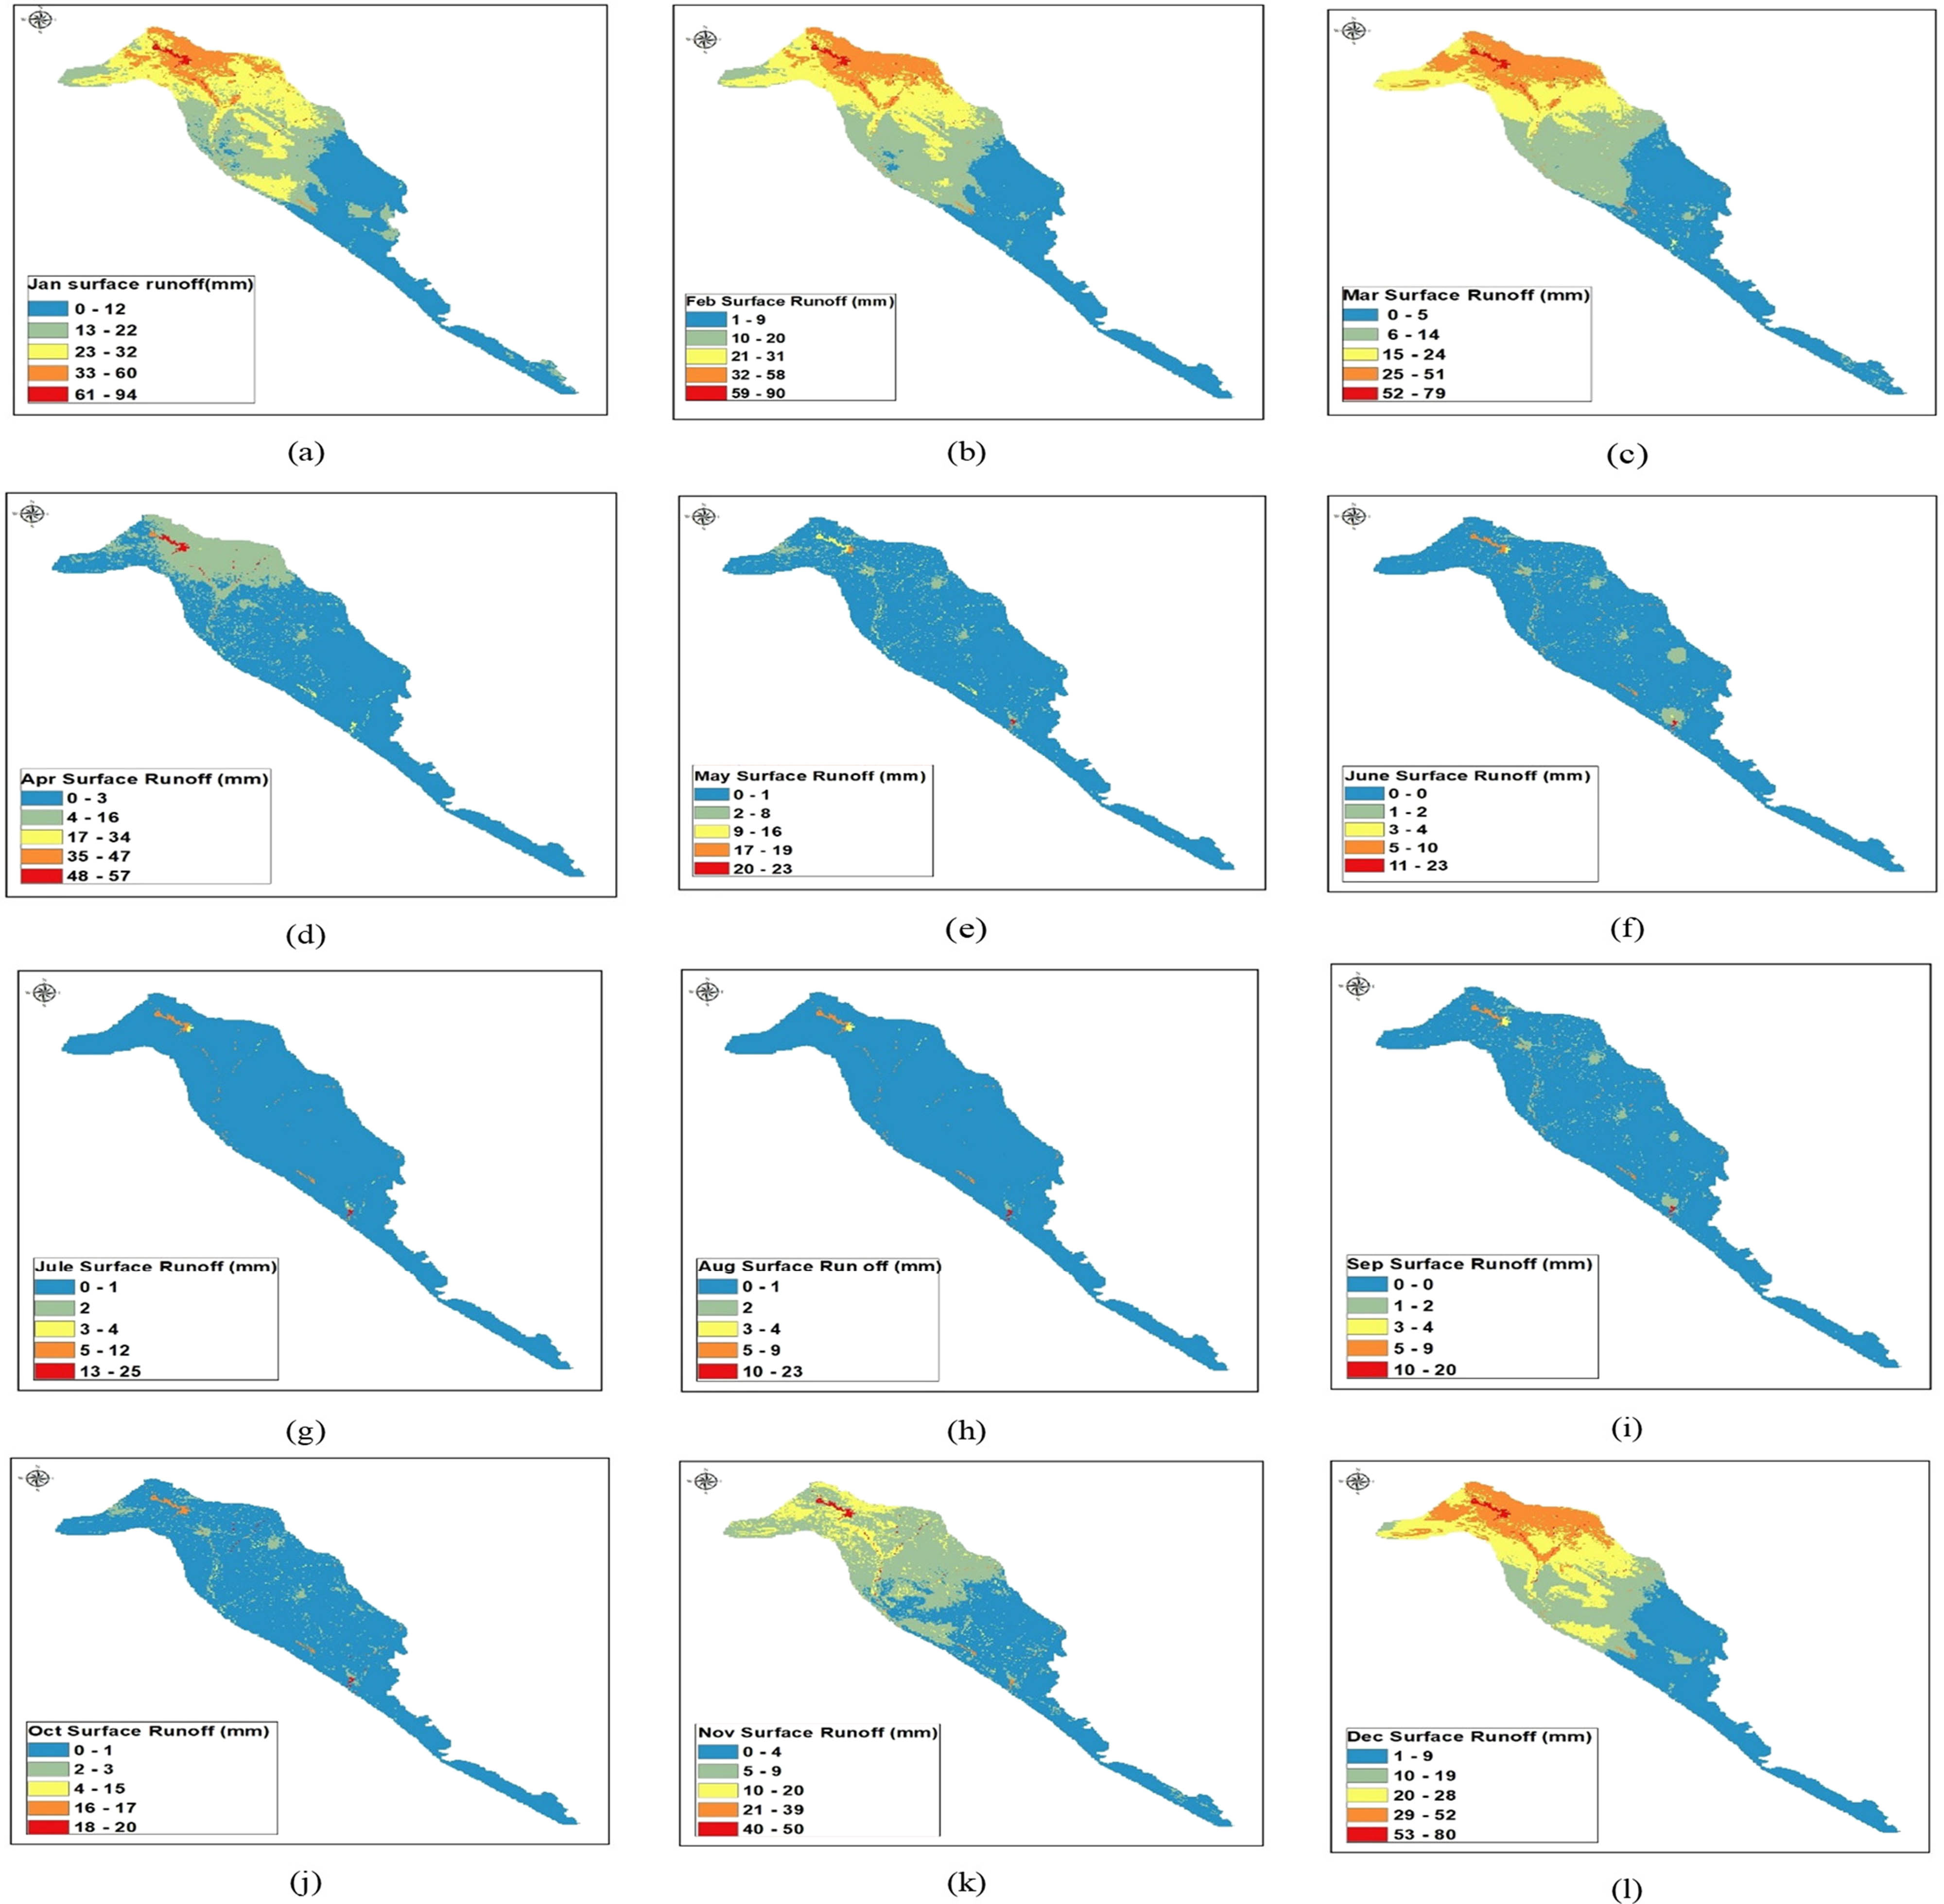
(a–l) Spatial distribution of average monthly Surface runoff simulated by WetSpass model in Low Folded Zone, Iraq.
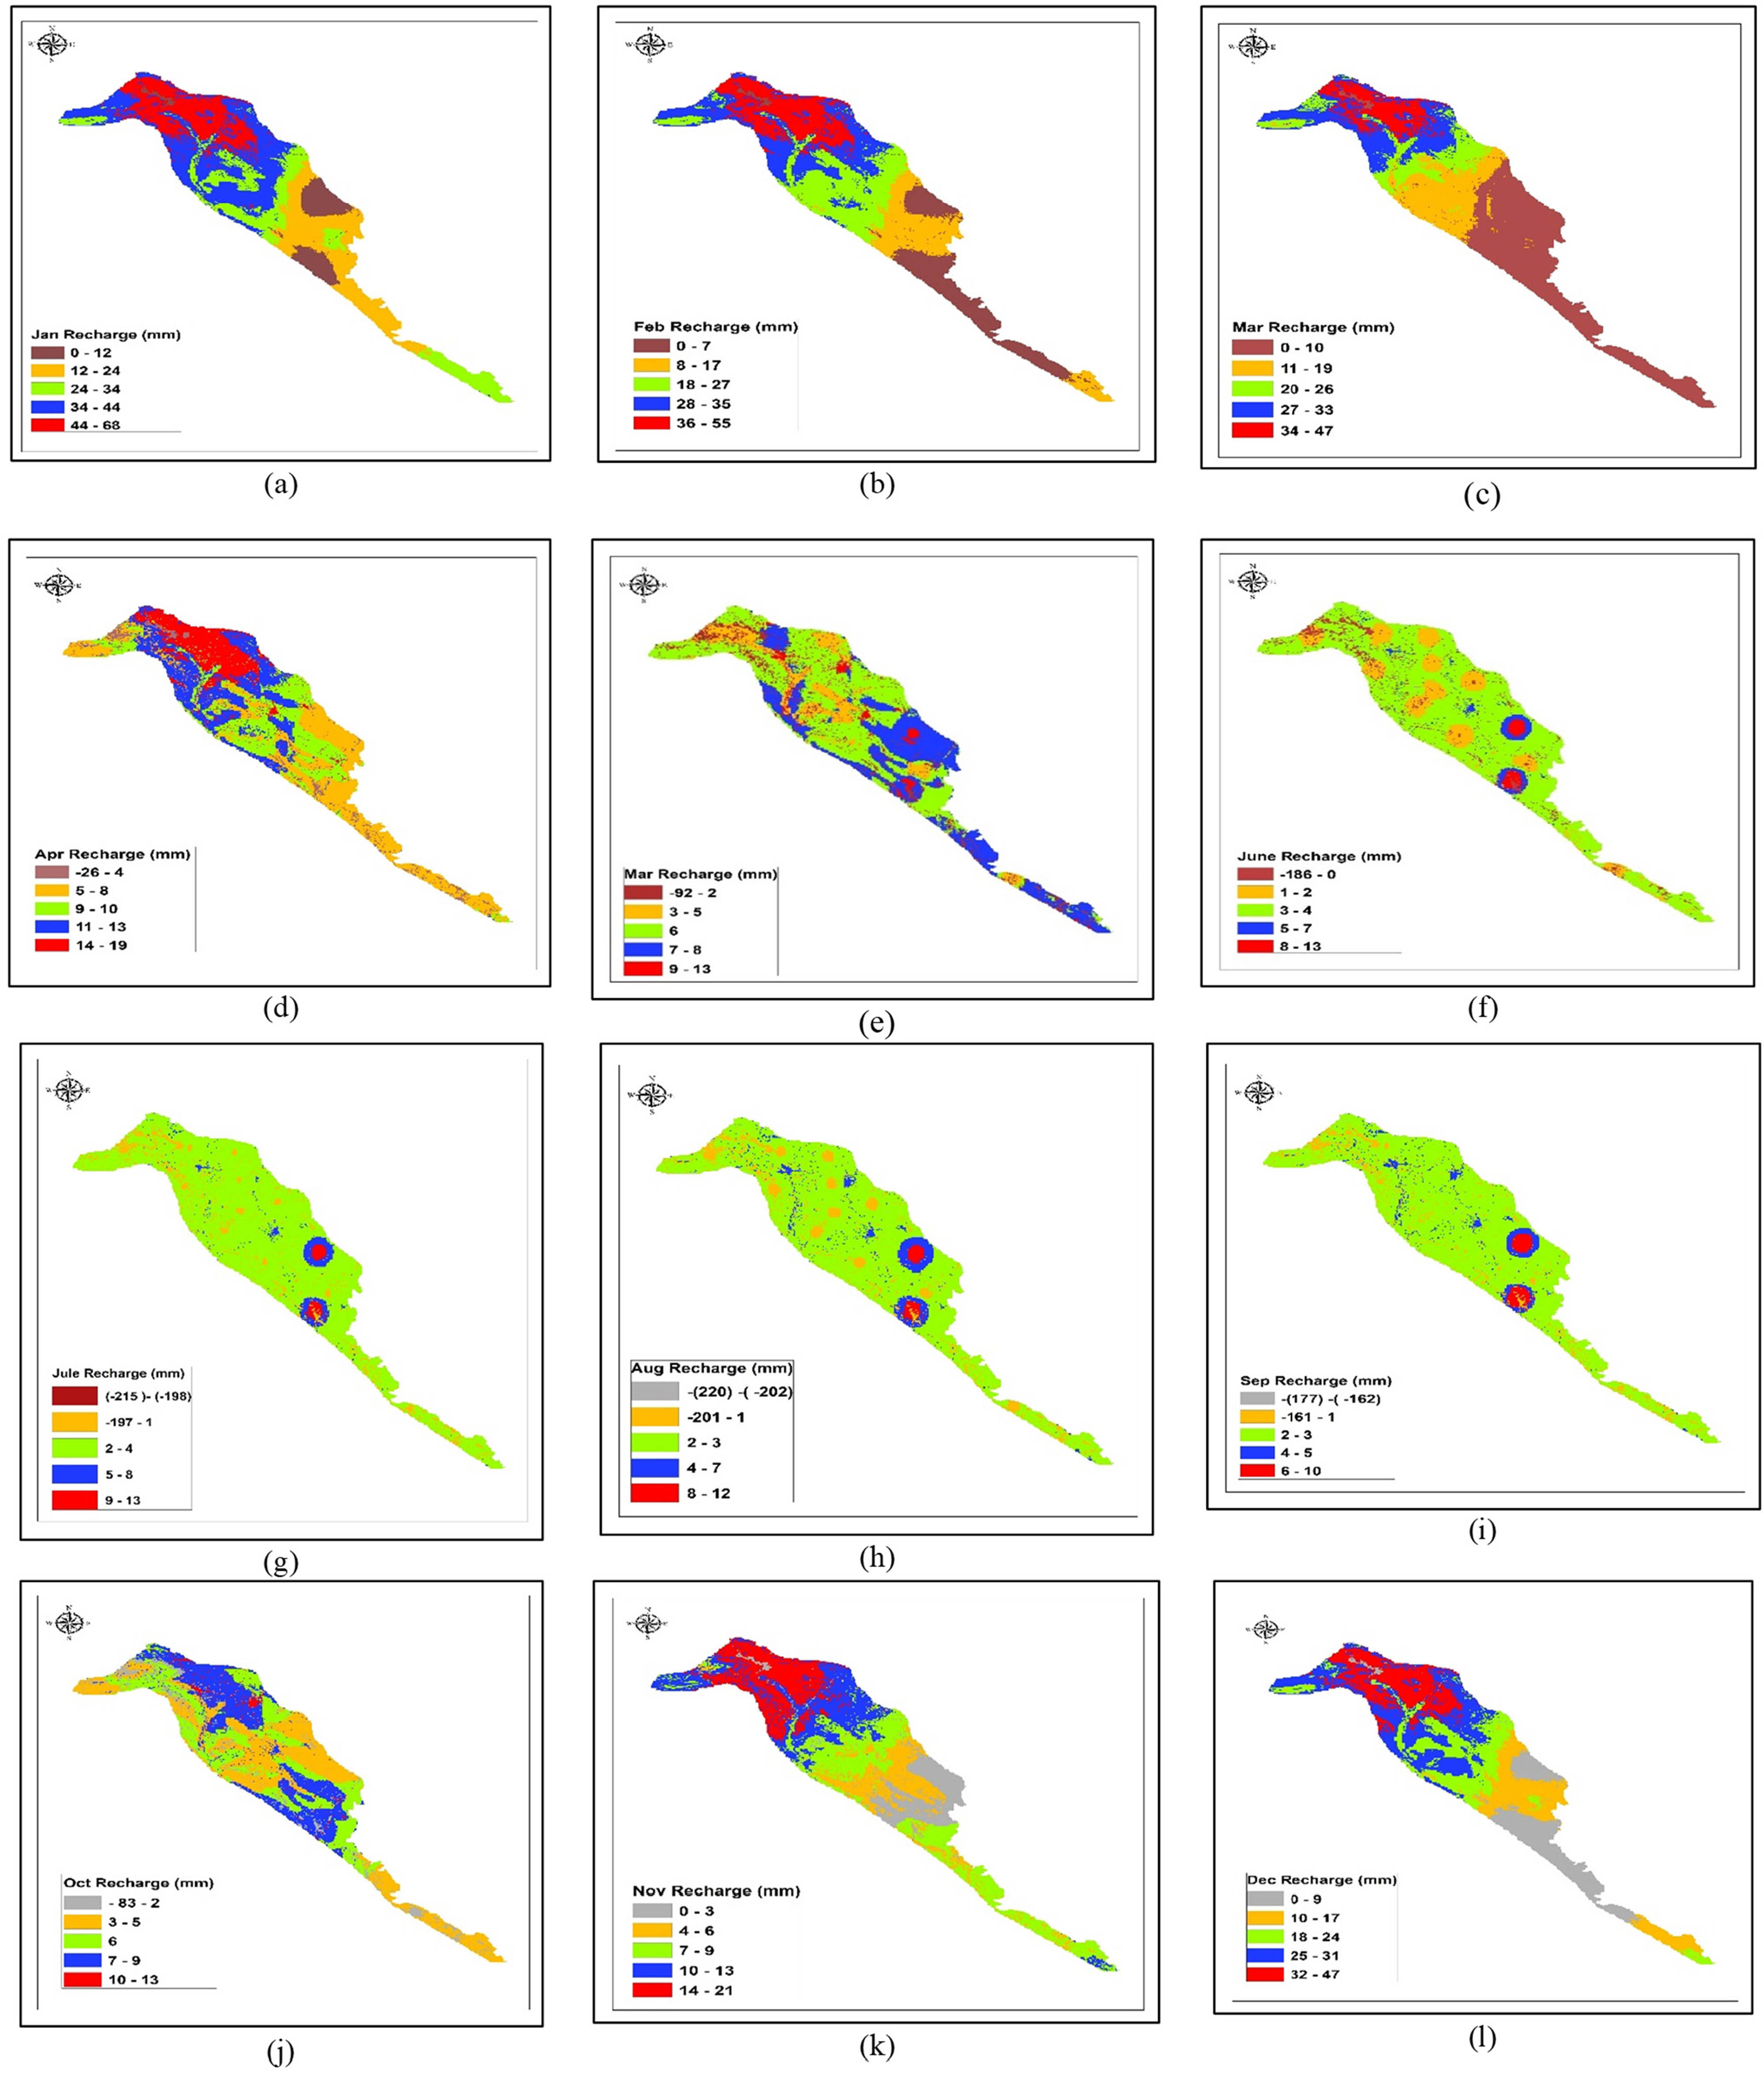
(a–l) Spatial distribution of average monthly groundwater recharge simulated by WetSpass model in Low Folded Zone, Iraq.
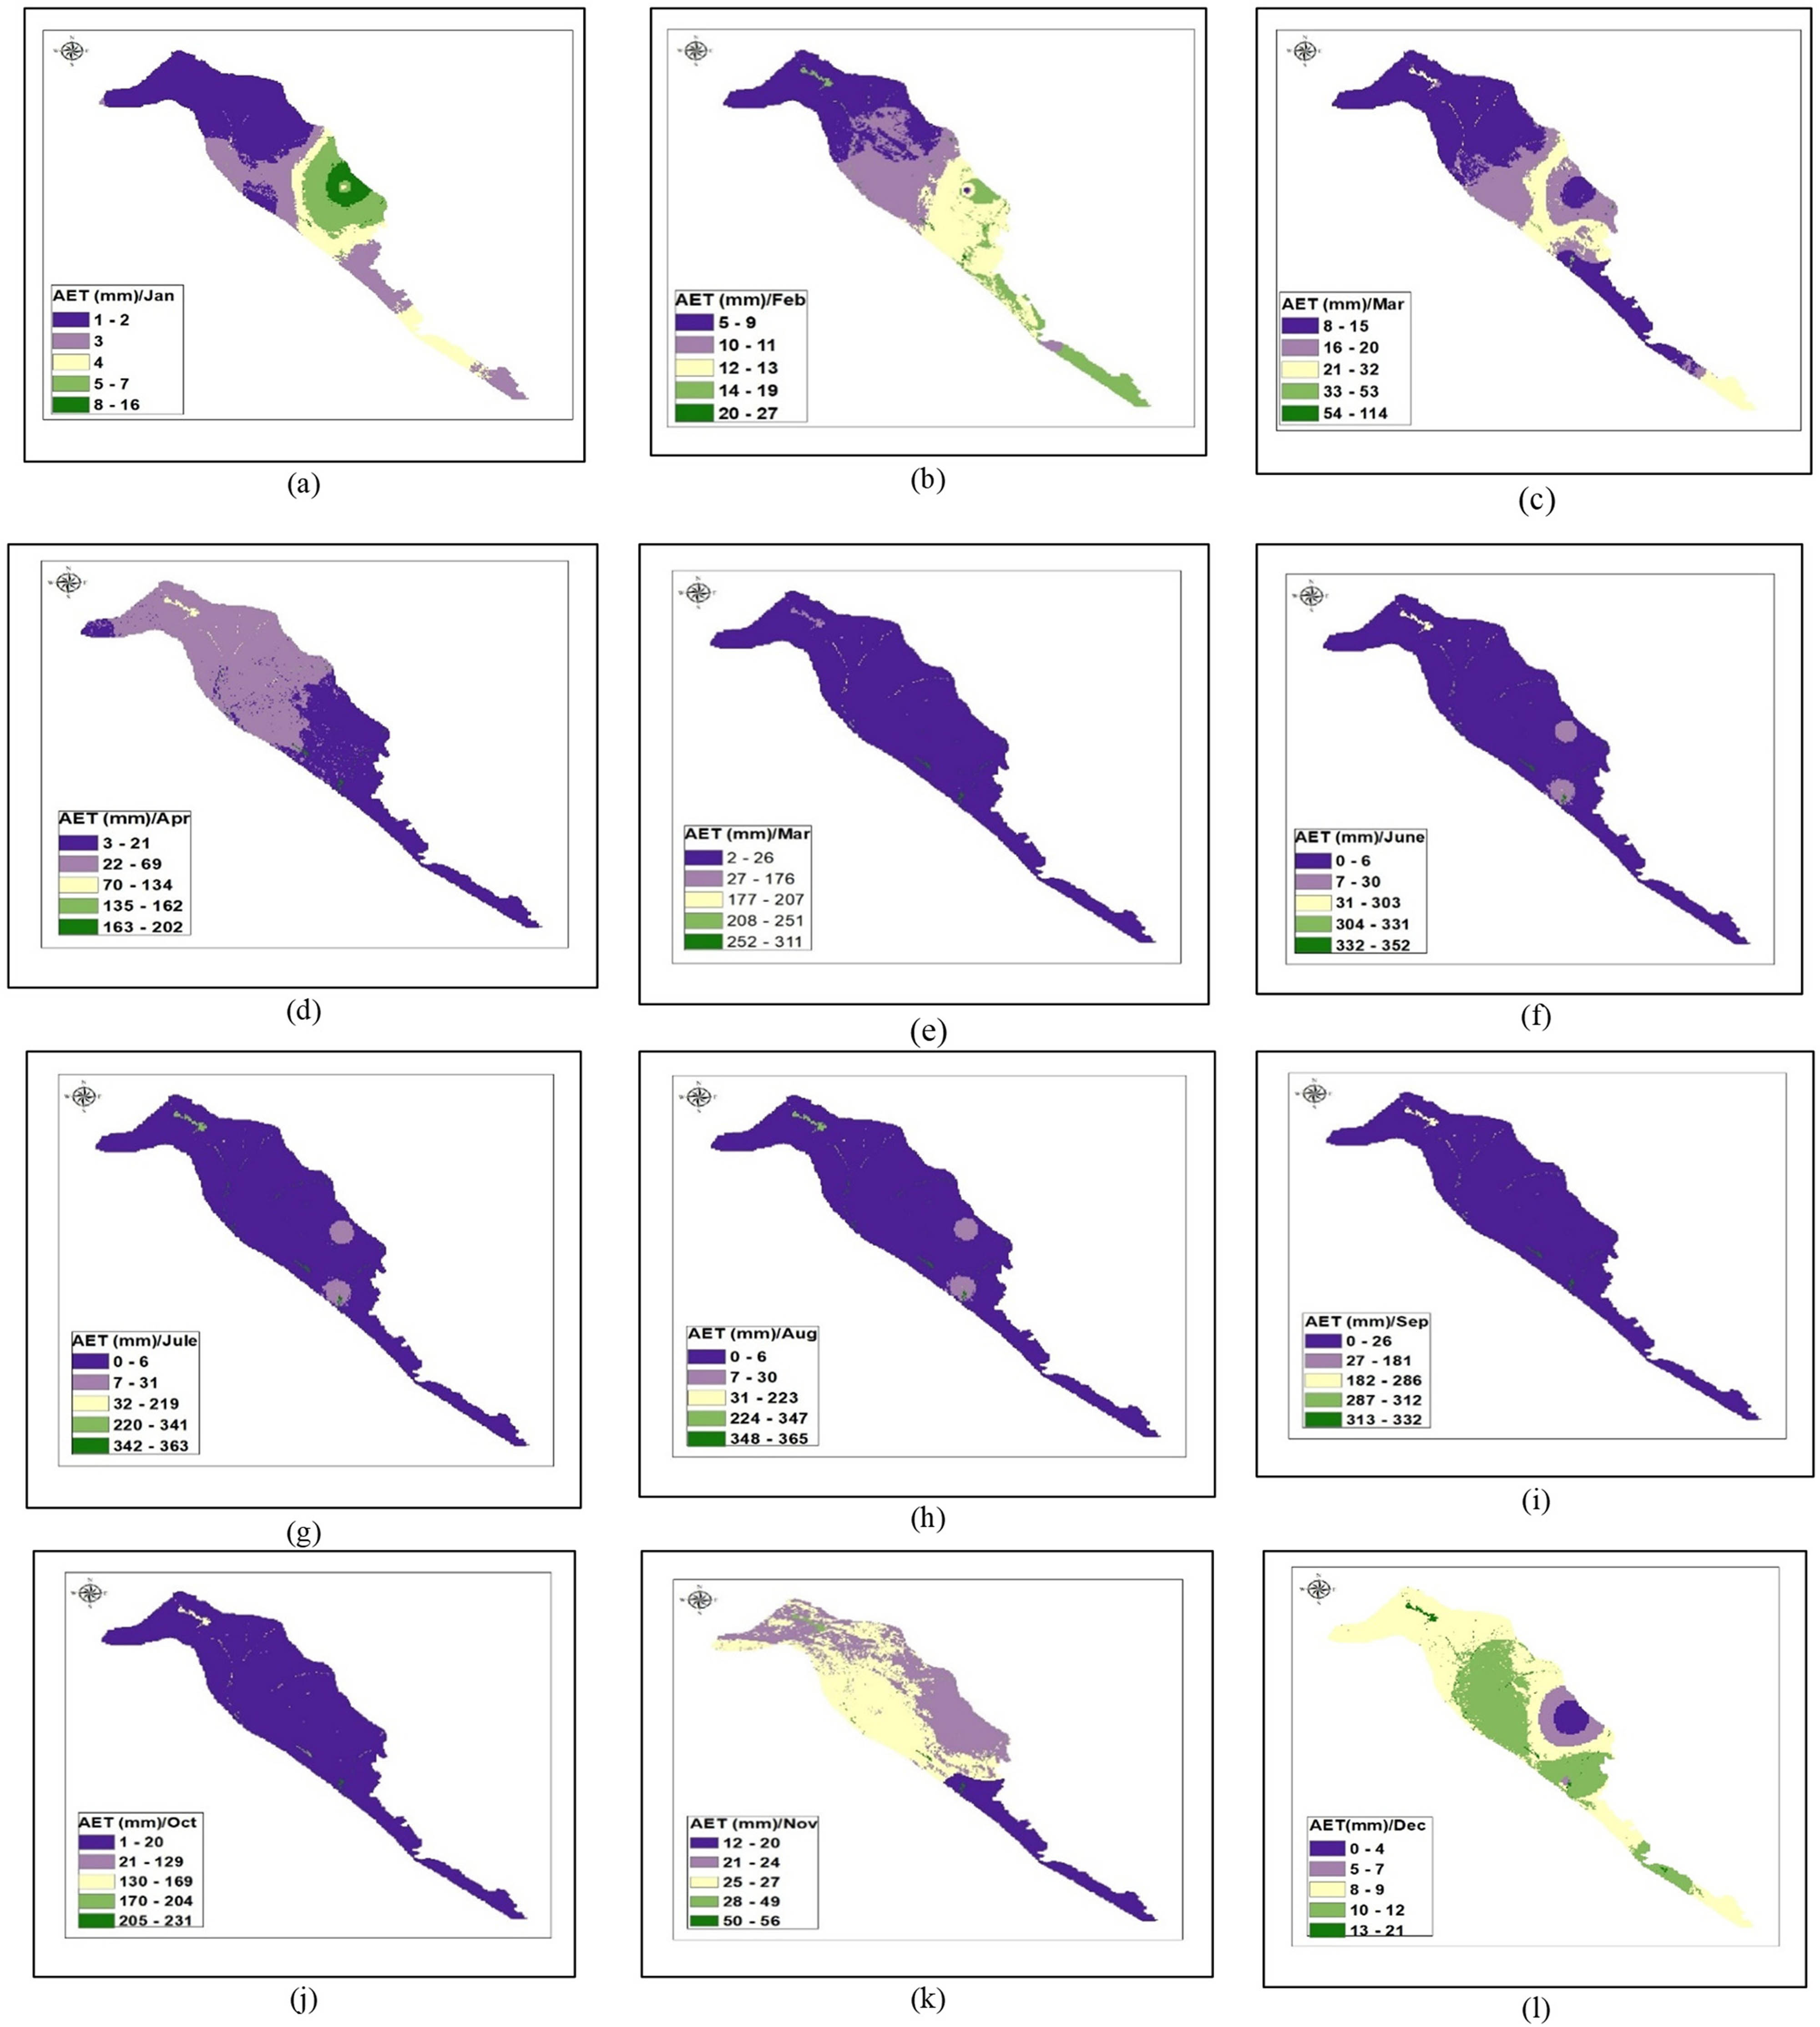
(a–l) Spatial distribution of average monthly actual evapotranspiration simulated by WetSpass model in Low Folded Zone, Iraq.
The monthly surface runoff (mm/month) is estimated using a rational method in the applied WetSpass-M model through an actual surface runoff and soil moisture coefficient. The monthly surface runoff estimation ranges from 0 mm to a maximum of 90 mm, averaging 5.4 mm/month. The average monthly surface runoff ranges from 18.47 mm in January to 0.1 mm in June, July, August, and September. This month they have yielded a small surface runoff value due to the little rainfall. High monthly surface runoff is observed in the northeast locations of the Low Folded Zone because of higher rainfall values. At the same time, the southeast part, which receives less precipitation, has a lower surface runoff, as shown in Figure 11. These locations of the Low Folded Zone hydrogeological sub-provinces are Sinjar–Rabee’a, Kirkuk–Hawija–Tuz Khurmatu, Khazir–Gomel, Dohuk–Alqosh, Altun Kupri, Dibiga, Makhmour, Cham Chamal–Qadir Karam–Qara Too, Erbil, West Tigris River, Kalar–Khanaqeen, Qara Tapa–Al-Sa’adiyah, and Mandali–Zurbatiyah–Teeb.
Simulating the average monthly groundwater recharge from 2000 to 2019 is essential for groundwater management, as shown in Figure 12. Results show that 38% of the total average precipitation is due to average groundwater recharge. The average monthly groundwater recharge ranges from 31.21 mm in January to 2.1–2.43 mm in June, July, August, and September.
Due to seasonal variations, the simulated monthly long-term actual evapotranspiration of the Low Folded Zone varies between 2.69 and 23.38 mm, with a mean value of 10.86 mm (Table 3 and Figure 13).
4 Conclusion
Monitoring groundwater is crucial in the Low Folded Zone as overexploitation is leading to a decrease in its availability. To manage groundwater resources sustainably and improve the flow of rivers and streams, it is important to understand the spatial and temporal variations of groundwater in the region. Accurate simulation and management of the aquifer require studying groundwater balance components. The WetSpass-M model was used to estimate monthly groundwater recharge, actual evapotranspiration, and surface runoff in the Low Folded Zone. Digital maps of specific input data were created using GIS tools, and the WetSpass-M model parameter attribute tables were adjusted to reflect the local environmental conditions.
The monthly surface runoff falls between 0 and 18.5 mm in the study area. Over a long-term period, the yearly surface runoff ranges up to 72 mm. and the percentage of surface runoff is 21% of the average monthly precipitation
The monthly groundwater recharge in the study area varies from 0 to 31.21 mm, representing 39% of the average monthly precipitation, and the annual groundwater recharge ranges up to 128 mm.
The actual evapotranspiration equals 40% of the average monthly rainfall. Over a long-term period, annual evapotranspiration ranges up to 131 mm.
The WetSpass-M model is highly accurate in estimating surface runoff, groundwater recharge, and evapotranspiration, as indicated by both statistical parameters (
The variations in soil type, land use and cover, topography, and meteorological data within the Low Folded Zone of Iraq are responsible for the changes in the water balance elements.
-
Funding information: The authors state no funding involved.
-
Conflict of interest: The authors state no conflict of interest.
-
Data availability statement: Most datasets generated and analyzed in this study are given in this submitted manuscript. The other datasets are available on reasonable request from the corresponding author with the attached information.
References
[1] Salman SA, Shahid S, Ismail T, Ahmed K, Wang XJ. Selection of climate models for projection of spatiotemporal changes in temperature of Iraq with uncertainties. Atmospheric Res. 2018;213:509–22. 10.1016/j.atmosres.2018.07.008Search in Google Scholar
[2] Osman Y, Abdellatif M, Al-Ansari N, Knutsson S, Jawad S. Climate change and future precipitation in an arid environment of the MIDDLE EAST: CASE study of Iraq. J Environ Hydrol. 2017;25(3):1–18. Search in Google Scholar
[3] Ewaid SH, Abed SA, Kadhum SA. Predicting the Tigris River water quality within Baghdad, Iraq by using water quality index and regression analysis. Environ Technol Innovat. 2018;11:390–8. 10.1016/j.eti.2018.06.013Search in Google Scholar
[4] Bhanja SN, Zhang X, Wang J. Estimating long-term groundwater storage and its controlling factors in Alberta. Canada Hydrol Earth Syst Sci. 2018;22(12):6241–55. 10.5194/hess-22-6241-2018Search in Google Scholar
[5] UNESCO O. Category 2 institutes and centres renewals of category 2 institutes and centres. Paris: United Nations Educational, Scientific and Cultural Organization; 2016. p. 200 EX/12. Search in Google Scholar
[6] Joslin P. Groundwater recharge estimation and water resources assessment in a tropical crystalline basement aquifer. Ph.D. thesis. Netherlands: University of Technology International in Delft; 1993. Search in Google Scholar
[7] Vries JJ, Simmers I. JGroundwater Recharge: an overview of processes and challenges. Hydrogeol J. 2002;10:5–17. 10.1007/s10040-001-0171-7Search in Google Scholar
[8] Scanlon BR, Keese KE, Flint AL, Flint LE, Gaye CB, Edmunds WM, et al. Global synthesis of groundwater recharge in semiarid and arid regions. Hydrol Process Int J. 2006;20(15):3335–70. 10.1002/hyp.6335Search in Google Scholar
[9] Wang L, ODochartaigh B, Macdonald D. A literature review of recharge estimation and groundwater resource assessment in Africa. British Geological Survey; 2010. p. 51. https://nora.nerc.ac.uk/id/eprint/14145. Search in Google Scholar
[10] Shah T, Molden D, Sakthivadivel R, Seckler D. The global groundwater situation: overview of opportunities and challenges. IWMI; 2000. 10.5337/2011.0051Search in Google Scholar
[11] Scanlon BR, Healy RW, Cook PG. Choosing appropriate techniques for quantifying groundwater recharge. Hydrogeol J. 2002;10:18–39. 10.1007/s10040-001-0176-2Search in Google Scholar
[12] Huet M, Chesnaux R, Boucher MA, Poirier C. Comparing various approaches for assessing groundwater recharge at a regional scale in the Canadian Shield. Hydrol Sci J. 2016;61(12):2267–83. 10.1080/02626667.2015.1106544Search in Google Scholar
[13] Arshad A, Zhang Z, Zhang W, Dilawar A. Mapping favorable groundwater potential recharge zones using a GIS-based analytical hierarchical process and probability frequency ratio model: a case study from an agro-urban region of Pakistan. Geosci Frontiers. 2020;11(5):1805–19. 10.1016/j.gsf.2019.12.013Search in Google Scholar
[14] Batelaan O, De Smedt F. GIS-based recharge estimation by coupling surface-subsurface water balances. J Hydrol. 2007;337(3–4):337–55. Search in Google Scholar
[15] Kahsay GH, Gebreyohannes T, Gebremedhin MA, Gebrekirstos A, Birhane E, Gebrewahid H, et al. Spatial groundwater recharge estimation in Raya basin, Northern Ethiopia: an approach using GIS based water balance model. Sustainable Water Resour Manag. 2018;5:961–75. 10.1007/s40899-018-0272-2Search in Google Scholar
[16] Kashaigili JJ, McCartney M, Mahoo HF, Lankford BA, Mbilinyi BP, Yawson DK, et al. Use of a hydrological model for environmental management of the Usangu Wetlands, Tanzania. vol. 104. IWMI; 2006. Search in Google Scholar
[17] Maréchal JC, Dewandel B, Ahmed S, Galeazzi L, Zaidi FK. Combined estimation of specific yield and natural recharge in a semi-arid groundwater basin with irrigated agriculture. J Hydrol. 2006;329(1–2):281–93. 10.1016/j.jhydrol.2006.02.022Search in Google Scholar
[18] Meresa E, Taye G. Estimation of groundwater recharge using GIS-based WetSpass model for Birki watershed, the eastern zone of Tigray, Northern Ethiopia, Sustainable Water Resources Management. 2019;5(4):1555–66. 10.1007/s40899-018-0282-0Search in Google Scholar
[19] Wahyuni S, Oishi S, Sunada K. The estimation of the groundwater storage and its distribution in Uzbekistan. Proc Hydraulic Eng. 2008;52:31–6. 10.2208/prohe.52.31Search in Google Scholar
[20] Batelaan O, De Smedt F. GIS-based recharge estimation by coupling surface-subsurface water balances. J Hydrol. 2007;337(3–4):337–55. 10.1016/j.jhydrol.2007.02.001Search in Google Scholar
[21] Ghimire U, Shrestha S, Neupane S, Mohanasundaram S, Lorphensri O. Climate and land-use change impacts on spatiotemporal variations in groundwater recharge: A case study of the Bangkok Area, Thailand. Sci Total Environ. 2021;792:148370. 10.1016/j.scitotenv.2021.148370Search in Google Scholar PubMed
[22] Aish AM, Batelaan O, De Smedt F. Distributed recharge estimation for groundwater modeling using WetSpass model, case study Gaza strip, Palestine. Arabian J Sci Eng. 2010;35(1):155. Search in Google Scholar
[23] Abu-Saleem A, Al-Zu’bi Y, Rimawi O, Al-Zu’bi J, Alouran N, et al. Estimation of water balance components in the Hasa basin with GIS based WetSpass model. J Agronomy. 2010;9(3):119–25. 10.3923/ja.2010.119.125Search in Google Scholar
[24] Graf R, Kajewski I. Forming of the water balance elements in the Mogilnica catchment on the basis of simulating investigations. Nauka Przyroda Technologie. 2013;7(1). Search in Google Scholar
[25] WetSpass: a flexible, GIS based, distributed recharge methodology for regional groundwater modelling. 269. Netherlands: IAHS; 2001. Search in Google Scholar
[26] Abdollahi K, Bashir I, Verbeiren B, Harouna MR, Van Griensven A, Huysmans M, et al. A distributed monthly water balance model: formulation and application on Black Volta Basin. Environ Earth Sci. 2017;76:1–18. 10.1007/s12665-017-6512-1Search in Google Scholar
[27] Batelaan O, De Smedt F, Triest L. Regional groundwater discharge: phreatophyte mapping, groundwater modelling and impact analysis of land-use change. J Hydrol. 2003;275(1–2):86–108. 10.1016/S0022-1694(03)00018-0Search in Google Scholar
[28] Fetter CW. Applied hydrogeology. Waveland Press; 2018. Search in Google Scholar
[29] Munoz Sabater J. ERA5-land monthly averaged data from 1981 to present, Copernicus Climate Change Service (C3S) Climate Data Store (CDS). Earth Syst Sci Data. 2019;55:5679–95. Search in Google Scholar
[30] Moriasi DN, Arnold JG, Van Liew MW, Bingner RL, Harmel RD, Veith TL. Model evaluation guidelines for systematic quantification of accuracy in watershed simulations. Trans ASABE. 2007;50(3):885–900. 10.13031/2013.23153Search in Google Scholar
[31] Al-Muqdadi SW, Merkel BJ. Interpretation of groundwater flow into fractured aquifer. Int J Geosci. 2012;3(2):357–64. 10.4236/ijg.2012.32039Search in Google Scholar
[32] Kareem H. Study of water resources by using 3d groundwater modelling in Al-Najaf Region, Iraq. Ph.D. thesis. Cardiff University; 2018. Search in Google Scholar
© 2023 the author(s), published by De Gruyter
This work is licensed under the Creative Commons Attribution 4.0 International License.
Articles in the same Issue
- Regular Articles
- Design optimization of a 4-bar exoskeleton with natural trajectories using unique gait-based synthesis approach
- Technical review of supervised machine learning studies and potential implementation to identify herbal plant dataset
- Effect of ECAP die angle and route type on the experimental evolution, crystallographic texture, and mechanical properties of pure magnesium
- Design and characteristics of two-dimensional piezoelectric nanogenerators
- Hybrid and cognitive digital twins for the process industry
- Discharge predicted in compound channels using adaptive neuro-fuzzy inference system (ANFIS)
- Human factors in aviation: Fatigue management in ramp workers
- LLDPE matrix with LDPE and UV stabilizer additive to evaluate the interface adhesion impact on the thermal and mechanical degradation
- Dislocated time sequences – deep neural network for broken bearing diagnosis
- Estimation method of corrosion current density of RC elements
- A computational iterative design method for bend-twist deformation in composite ship propeller blades for thrusters
- Compressive forces influence on the vibrations of double beams
- Research on dynamical properties of a three-wheeled electric vehicle from the point of view of driving safety
- Risk management based on the best value approach and its application in conditions of the Czech Republic
- Effect of openings on simply supported reinforced concrete skew slabs using finite element method
- Experimental and simulation study on a rooftop vertical-axis wind turbine
- Rehabilitation of overload-damaged reinforced concrete columns using ultra-high-performance fiber-reinforced concrete
- Performance of a horizontal well in a bounded anisotropic reservoir: Part II: Performance analysis of well length and reservoir geometry
- Effect of chloride concentration on the corrosion resistance of pure Zn metal in a 0.0626 M H2SO4 solution
- Numerical and experimental analysis of the heat transfer process in a railway disc brake tested on a dynamometer stand
- Design parameters and mechanical efficiency of jet wind turbine under high wind speed conditions
- Architectural modeling of data warehouse and analytic business intelligence for Bedstead manufacturers
- Influence of nano chromium addition on the corrosion and erosion–corrosion behavior of cupronickel 70/30 alloy in seawater
- Evaluating hydraulic parameters in clays based on in situ tests
- Optimization of railway entry and exit transition curves
- Daily load curve prediction for Jordan based on statistical techniques
- Review Articles
- A review of rutting in asphalt concrete pavement
- Powered education based on Metaverse: Pre- and post-COVID comprehensive review
- A review of safety test methods for new car assessment program in Southeast Asian countries
- Communication
- StarCrete: A starch-based biocomposite for off-world construction
- Special Issue: Transport 2022 - Part I
- Analysis and assessment of the human factor as a cause of occurrence of selected railway accidents and incidents
- Testing the way of driving a vehicle in real road conditions
- Research of dynamic phenomena in a model engine stand
- Testing the relationship between the technical condition of motorcycle shock absorbers determined on the diagnostic line and their characteristics
- Retrospective analysis of the data concerning inspections of vehicles with adaptive devices
- Analysis of the operating parameters of electric, hybrid, and conventional vehicles on different types of roads
- Special Issue: 49th KKBN - Part II
- Influence of a thin dielectric layer on resonance frequencies of square SRR metasurface operating in THz band
- Influence of the presence of a nitrided layer on changes in the ultrasonic wave parameters
- Special Issue: ICRTEEC - 2021 - Part III
- Reverse droop control strategy with virtual resistance for low-voltage microgrid with multiple distributed generation sources
- Special Issue: AESMT-2 - Part II
- Waste ceramic as partial replacement for sand in integral waterproof concrete: The durability against sulfate attack of certain properties
- Assessment of Manning coefficient for Dujila Canal, Wasit/-Iraq
- Special Issue: AESMT-3 - Part I
- Modulation and performance of synchronous demodulation for speech signal detection and dialect intelligibility
- Seismic evaluation cylindrical concrete shells
- Investigating the role of different stabilizers of PVCs by using a torque rheometer
- Investigation of high-turbidity tap water problem in Najaf governorate/middle of Iraq
- Experimental and numerical evaluation of tire rubber powder effectiveness for reducing seepage rate in earth dams
- Enhancement of air conditioning system using direct evaporative cooling: Experimental and theoretical investigation
- Assessment for behavior of axially loaded reinforced concrete columns strengthened by different patterns of steel-framed jacket
- Novel graph for an appropriate cross section and length for cantilever RC beams
- Discharge coefficient and energy dissipation on stepped weir
- Numerical study of the fluid flow and heat transfer in a finned heat sink using Ansys Icepak
- Integration of numerical models to simulate 2D hydrodynamic/water quality model of contaminant concentration in Shatt Al-Arab River with WRDB calibration tools
- Study of the behavior of reactive powder concrete RC deep beams by strengthening shear using near-surface mounted CFRP bars
- The nonlinear analysis of reactive powder concrete effectiveness in shear for reinforced concrete deep beams
- Activated carbon from sugarcane as an efficient adsorbent for phenol from petroleum refinery wastewater: Equilibrium, kinetic, and thermodynamic study
- Structural behavior of concrete filled double-skin PVC tubular columns confined by plain PVC sockets
- Probabilistic derivation of droplet velocity using quadrature method of moments
- A study of characteristics of man-made lightweight aggregate and lightweight concrete made from expanded polystyrene (eps) and cement mortar
- Effect of waste materials on soil properties
- Experimental investigation of electrode wear assessment in the EDM process using image processing technique
- Punching shear of reinforced concrete slabs bonded with reactive powder after exposure to fire
- Deep learning model for intrusion detection system utilizing convolution neural network
- Improvement of CBR of gypsum subgrade soil by cement kiln dust and granulated blast-furnace slag
- Investigation of effect lengths and angles of the control devices below the hydraulic structure
- Finite element analysis for built-up steel beam with extended plate connected by bolts
- Finite element analysis and retrofit of the existing reinforced concrete columns in Iraqi schools by using CFRP as confining technique
- Performing laboratory study of the behavior of reactive powder concrete on the shear of RC deep beams by the drilling core test
- Special Issue: AESMT-4 - Part I
- Depletion zones of groundwater resources in the Southwest Desert of Iraq
- A case study of T-beams with hybrid section shear characteristics of reactive powder concrete
- Feasibility studies and their effects on the success or failure of investment projects. “Najaf governorate as a model”
- Optimizing and coordinating the location of raw material suitable for cement manufacturing in Wasit Governorate, Iraq
- Effect of the 40-PPI copper foam layer height on the solar cooker performance
- Identification and investigation of corrosion behavior of electroless composite coating on steel substrate
- Improvement in the California bearing ratio of subbase soil by recycled asphalt pavement and cement
- Some properties of thermal insulating cement mortar using Ponza aggregate
- Assessment of the impacts of land use/land cover change on water resources in the Diyala River, Iraq
- Effect of varied waste concrete ratios on the mechanical properties of polymer concrete
- Effect of adverse slope on performance of USBR II stilling basin
- Shear capacity of reinforced concrete beams with recycled steel fibers
- Extracting oil from oil shale using internal distillation (in situ retorting)
- Influence of recycling waste hardened mortar and ceramic rubbish on the properties of flowable fill material
- Rehabilitation of reinforced concrete deep beams by near-surface-mounted steel reinforcement
- Impact of waste materials (glass powder and silica fume) on features of high-strength concrete
- Studying pandemic effects and mitigation measures on management of construction projects: Najaf City as a case study
- Design and implementation of a frequency reconfigurable antenna using PIN switch for sub-6 GHz applications
- Average monthly recharge, surface runoff, and actual evapotranspiration estimation using WetSpass-M model in Low Folded Zone, Iraq
- Simple function to find base pressure under triangular and trapezoidal footing with two eccentric loads
- Assessment of ALINEA method performance at different loop detector locations using field data and micro-simulation modeling via AIMSUN
- Special Issue: AESMT-5 - Part I
- Experimental and theoretical investigation of the structural behavior of reinforced glulam wooden members by NSM steel bars and shear reinforcement CFRP sheet
- Improving the fatigue life of composite by using multiwall carbon nanotubes
- A comparative study to solve fractional initial value problems in discrete domain
- Assessing strength properties of stabilized soils using dynamic cone penetrometer test
- Investigating traffic characteristics for merging sections in Iraq
- Enhancement of flexural behavior of hybrid flat slab by using SIFCON
- The main impacts of a managed aquifer recharge using AHP-weighted overlay analysis based on GIS in the eastern Wasit province, Iraq