Numerical and experimental analysis of the heat transfer process in a railway disc brake tested on a dynamometer stand
-
Andrzej Wolff


Abstract
The effectiveness of railway brakes is highly dependent on the thermal condition of the brake disc and friction linings. An effective research method for the heat transfer process in brakes was computer simulation and experimental tests on a full-size dynamometric test bench. A two-dimensional, axially symmetric numerical model of transient thermal conductivity in a railway brake was presented. Appropriate boundary conditions of the problem were applied, describing the heat generated in the brake and discharged to the environment. The problem was solved using the finite-element method. This article presents exemplary results of the brake temperature calculations obtained using the numerical model and the results of experimental tests carried out on two types of brake discs.
1 Introduction
Braking systems are one of the dominant solutions affecting rail vehicles’ operational reliability and safety. They are used in all types of vehicles. The operation of brake systems in conditions of increased requirements, related to the increase in operating speed, load, and frequency of operation, makes it necessary to consider the effects related to the dynamics of the structure in the design. The increase in driving speed, vehicle weight, and the use of new materials for the elements of friction pairs cause new problems in braking systems. As a result of friction in disc brakes, mechanical energy is converted into thermal energy. In the case of brake systems used in motor vehicles (road and rail), this phenomenon arises due to the frictional interaction of the brake lining with the surface of the brake disc. Brake discs and linings are subjected to intense heat loads, especially on friction surfaces. As a result, high thermal stresses on the friction surface of the disc, surface cracks, and thermal deformations can occur at high-temperature gradients. The effectiveness of both car and rail brakes strongly depends on the brake disc’s thermal condition and friction linings. The heat accumulated in the friction elements of such systems causes thermal disturbances, which result in negative phenomena, e.g., the appearance of hot areas, cracks, etc.
2 Research problem – literature review
Thermal processes inherently accompany the work of railway and car brakes. They are of great practical importance because they significantly affect the brakes’ functioning and the friction elements’ intensity of wear and may cause damage to these elements. The temperature fundamentally influences the course of tribological phenomena on friction surfaces. Along with its increase, the coefficient of friction usually decreases, which reduces braking efficiency [1,2,3,4,5]. The resistance of the friction pair to abrasive wear is also reduced. In extreme cases, the structural and chemical degradation of the friction material may occur [1,6]. The increase in temperature, combined with the phenomenon of thermal expansion, causes deformations and thermal stresses, which cause temporary disturbances in the cooperation of friction pairs. A known effect of cyclically occurring stresses is the cracking of the drum or disc material, starting from the friction surface and progressing into the material [1,7]. An important phenomenon occurring in friction pairs is the so-called thermoelastic instability – the formation of hot areas on the friction surface of brake discs. The heat accumulated in the friction elements of such systems causes thermal disturbances, resulting in negative phenomena. One of them is the development of hot spots on their surfaces [8]. Hot spotting is observed in brakes, clutches, and other braking systems [9,10,11]. The term hot spot is usually used concerning macroscopic phenomena, and all considerations here are limited to this scale. The sliding movement generates heat at the interface between the friction pairs. The heat distribution should be uniform over the entire interface, meaning that the heat load is uniform. Due to the geometrical imperfections of the mating surfaces, deformation of the coupling elements, and other factors, the heat distribution changes depending on the location [12]. The development of hot spots is caused by high thermal gradients, locally inducing high stresses in the surface structure of the friction pairs. High local temperatures may lead to an unacceptable reduction of braking effectiveness, such as the disappearance of brake forces or undesirable low-frequency vibrations [13,14,15]. During braking at high speeds and intense pressures in the brake system, a significant amount of heat is generated in its friction elements. As a negative phenomenon, it affects the softening and melting of materials on the contact surfaces of friction elements. This phenomenon generates an increase in thermal deformation and unit pressure. As a result, clean metal surfaces may be exposed and brought closer to the distance of intermolecular forces.
The consequence is partial gluing and damage of both materials by removing particles from friction surfaces and smearing them on these surfaces in a further stage of braking. As a result, the contact area is limited to local areas commonly referred to as hot spots. Depending on their form, they can be classified as apex, focal, deformation, band, zone, and mixed regions [13]. This type of hot spot, usually found on the friction surface of linings, consists of primary and secondary spots. Primary stains are formed due to less wear on the material components of the friction lining. Weaves of surface strands are formed in the contact area between the brake disc and friction lining. The resulting material fragments move to reduce their size to create secondary hot spots on the previously formed primary spots.
In the study of Sha et al. [16], the transient heat transfer model of the ventilated brake disc for high-speed trains has been created. Considering the control equations of heat generation–heat dissipation and plate–cylinder convection heat transfer, the virtual simulation of the energy change of the ventilated brake disc during the braking process has been carried out. The results show that the heat generated by the ventilated brake disc increases nonlinearly, and the heat dissipated increases linearly. The heat of ventilated brake disc increases with the braking time, but its growth rate decreases continuously.
The study of Yevtushenko et al. [17] proposed a new approach to numerical simulation using the finite-element method (FEM) for the rotational motion of discs for railway brake systems. Three-dimensional models of transient heat transfer due to friction for solid and ventilated discs were developed. The results of performed calculations showed the possibility of simplifying the shape of the ventilated brake disc. In addition, the share of energy dissipated due to convection and radiation to the environment during single brakings was investigated. The maximum temperature values from computer simulations were consistent with the corresponding experimental results.
In a publication [18], based on the uniformly distributed heat source method, a more accurate and efficient method was proposed to predict the braking temperature using a cosine function. After modification, the errors of the predicted maximum temperature are decreased from 5.73–6.72 to 3.47–5.07% at 40–100 km/h, and the temperature curves oscillate with a cosine form. The corresponding frequency perfectly matches the curves from the thermal–mechanical coupling method. The following work [19] involved analyzing and characterizing the heat transfer by conduction between the automotive disc and brake pads. A comparative study of temperature response between the analytical and numerical solutions concerning real braking conditions was conducted.
The study of Wang et al. [20] used a simple experimental model to obtain the convective heat transfer coefficient on a circular track surface on which the wheels pass periodically. The results show that when the heat transfer coefficient is presented regarding the wheel center velocity or angular velocity, it depends on the wheel diameter. The heat transfer coefficient has a parabolic distribution characteristic regarding the wheel center velocity for the same wheel diameter. It means that the heat transfer coefficient increases first and then decreases as the wheel center velocity increases.
In the study of Cati et al. [21], a heat transfer model has been developed using the finite difference method. Realistic time-dependent boundary conditions and different experimental convection correlations with non-uniform time-step size features have been applied. In addition, the effect of temperature-dependent material properties on the thermal behavior of the disc brake has been investigated. The developed numerical model can simulate the conditions experienced by a railway disc brake in a relatively new standard (EN 14535-3). The transient thermal state and axial thermal stresses distribution with relatively low computational time and reasonable accuracy can be analyzed. Also, in this study, valuable insights are obtained on the effect of variable thermal properties of the disc brake and convection correlations on the disc thermal state.
3 Heat transfer model in railway brakes
3.1 Mathematical model of heat conduction
The heat transfer in the brake should be considered a transient process. The reason is that the following are variable in time: heat generated during braking and dissipated to the environment and the temperature field of brake frictional elements. The primary task is to choose a suitable mathematical model of heat transfer in railway brakes (Figure 1). In practice, heat conduction plays a significant role through the brake rotor (here: disc).
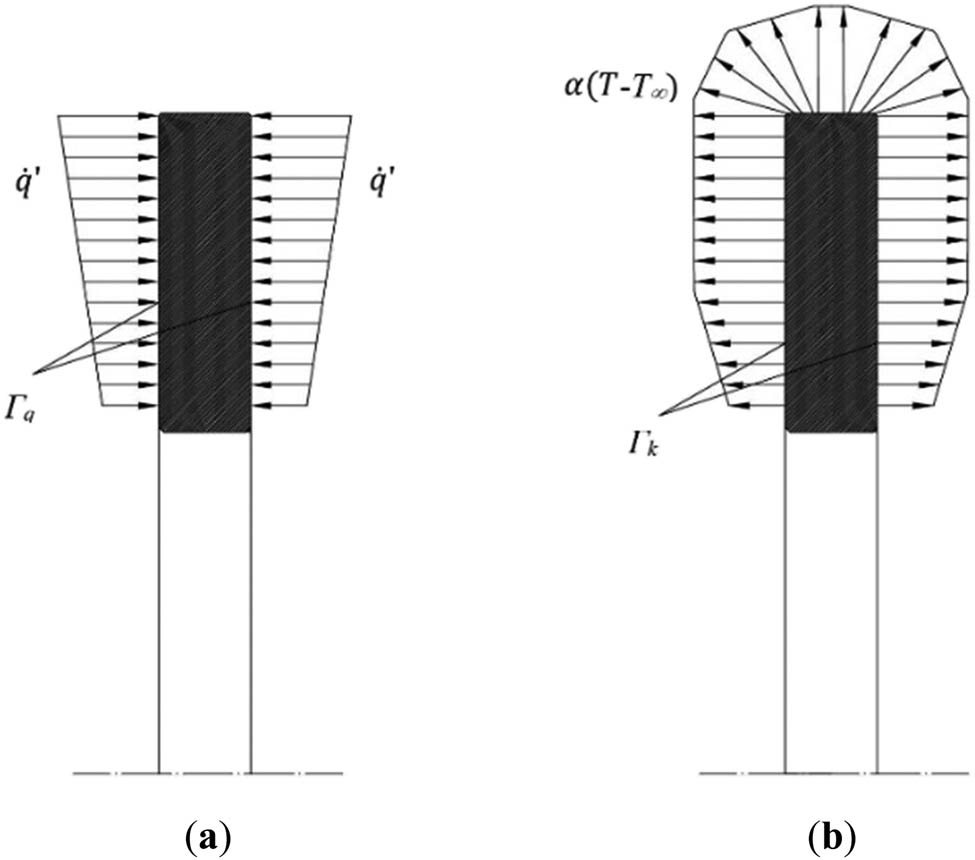
General physical model of heat transfer in a disc brake: (a) heat generated on the frictional surface Γ q of the brake, (b) heat transferred to the environment from rotating surfaces Γ k .
Due to the geometric shapes of solid disc brakes (i.e., without internal vents), we can assume that they are axisymmetric. However, such symmetry does not apply to boundary conditions of the heat transfer problem. It is necessary to note that friction pads under which the heat flux is generated cover only a part of the disc perimeter (brake rotor). Apart from this, the pressure distribution on the disc’s perimeter is uneven, so the heat flux is not uniformly distributed. We need to remember, however, that the rotor moves in relation to linings. For this reason, the assumption of axisymmetry of the heat flux on frictional surfaces means only time-averaged boundary conditions in the period corresponding to one rotation of the disc brake. This kind of simplification ends up with a minor mistake, particularly at the high rotational speeds of the brake rotor. For the reasons above, a two-dimensional, axisymmetric model was chosen for simulation studies of the heat transfer phenomena in railway brakes. In this case, the heat conduction equation will take the following form [22]:
where ρ, c p , λ are the mass density, specific heat, and thermal conductivity of the rotor; r, z are the cylindrical coordinates; T is the temperature; t is the time.
The heat flux q′ is generated on friction surfaces of the rotor Γ q (Figure 1(a)). Here are boundary conditions of the II type, in the form [10,22,23]:
wherein
where ξ is the ratio of heat flux partition between the rotor and friction linings, μ is the friction coefficient, p is the contact pressure at the interface rotor–brake lining, v is the slip velocity.
The heat transfer to the environment occurs on the free surfaces Γ k (Figure 1(b)). It is described by boundary conditions of the III type in the form [10,22,23]:
wherein:
where α k is the convection-based heat transfer coefficient, α r is the radiation-based heat transfer coefficient, and T ∞ is the ambient temperature.
The initial condition for the considered problem is as follows [10,22,23]:
where T 0 is the initial temperature.
3.2 Boundary conditions of the problem
Integral parts of every mathematical model are boundary conditions. First, heat flux distributed between a disc (brake rotor) and friction linings is generated on frictional surfaces. The most significant part of this flux is transferred to the rotor due to the considerable difference between
Values of thermal parameters of friction pair materials,
The heat flux generated in the brake examined on the inertia test bench was established as specified in Section 6.2 (equation (7)). Second, there is a complex heat transfer with the environment on the free surfaces of the brake, based primarily on convection and, to a lesser extent, on radiation. The impact of radiation rises substantially only at very high temperatures (300–500°C). A challenging task is to establish the value of the coefficient of the convection-based heat transfer with the environment. It is mainly due to the complexity of the disc brake outflow conditions by the cooling air and the variability of these conditions. As a rule, the above-stated parameter is determined using criterion formulas of similarity theory [22]. Our computer software for generating boundary conditions of the II and III types, called GENTGV , has been developed (equations (2)–(5)) [10]. Interestingly, in the last couple of years, the flow around brakes and convection-based heat transfer have been modeled using the computational fluid dynamics method [24,25].
3.3 Numerical method used to solve the problem
First, the possibility of solving thermal conductivity in brakes using three numerical methods was studied: the finite difference, finite-element, and boundary element method [26]. As a result of the analysis above, the FEM was chosen. It was primarily due to the following factors: the all-purpose nature of its algorithm and widespread presence and the capability of precisely approximating the edge of the analyzed objects. Elements of axisymmetric shape were used. In their axial sections, these are four-sided, eight-node elements with straight or curved edges (two-order isoparametric elements) [26]. For analysis of the heat transfer in brakes, the relevant computer program of the FEM called FEMHEAT was developed [7,10,23].
4 Experimental research
Experimental tests were carried out on a special inertial brake stand for testing the friction pairs of brakes of rail vehicles of the Railway Research Institute. The stand is International Union of Railways approved for universal brake stands up to a maximum speed of 420 km/h. The construction of the stand enables the testing of friction pairs of air railway brakes for high-speed complex trains, multiple units, locomotives, and rail buses in natural sizes corresponding to real conditions. Figure 2 shows a stationary test stand and a view of the mechanical flywheels.

Stationary test stand: (a) general view, (b) mechanical flywheels (Photo: J. Kukulski).
The basic technical parameters of the inertial test stand are presented in Table 1.
Basic technical parameters of the inertial test stand
| Parameter | Value |
|---|---|
| Range of vehicle speed (for wheel 890 mm) | 3.5 ÷ 420 km/h |
| Maximum rotational speed | 2,500 rpm |
| Driving motor power at 1,150 rpm | 536 kW |
| Torque up to 1,150 rpm | 4,450 Nm |
| Max. braking torque: | |
| – braking to a halt | 3,000 Nm |
| – continuous braking | 4,450 Nm |
| Range of moments of mass inertia with electric simulation | 150 ÷ 3,000 kgm2 |
| Maximum simulated mass per friction pair | 15 t |
| Range of total pressure force adjustment for brake disc | 0 ÷ 60 kN |
| Range of temperatures for the disc brake (rail wheel) | 0 ÷ 1,000°C |
The research procedure included bench tests on a cast steel brake disc without ventilation ducts with dimensions of 640 mm × 45 mm and, for comparative purposes, for a ventilated disc with dimensions of 640 mm × 80 mm.
The first type of disc (Figure 3) was used in the first TGV trains manufactured by Alstom, while the second type of disc (Figure 4) was used in high-speed trains, e.g., in EMU 250 operated by PKP (Polish National Railways) Intercity. The tests used sintered disc brake pads with a total contact area with the brake disc of 400 cm2. Table 2 presents the research programs for the full axle-mounted brake disc (without and with ventilation ducts).
![Figure 3
Brake discs without ventilation ducts mounted on the axis of the bogie of high-speed TGV trains [27].](/document/doi/10.1515/eng-2022-0466/asset/graphic/j_eng-2022-0466_fig_003.jpg)
Brake discs without ventilation ducts mounted on the axis of the bogie of high-speed TGV trains [27].

Brake discs with ventilation ducts mounted on the axle of the EMU 250 bogie (Photo: J. Kukulski).
Test scenarios for solid disc brake mounted on the inertial stand shaft
| Parameters of the test stand during testing | ||||
|---|---|---|---|---|
| v 0 [km/h] | F (kN) (apply force on brake pads) | m (kg) (braking mass) | T a (°C) (the temperature at the outset of braking) | |
| Test no. 8 (brake disc without ventilation channels) | 300 | 25 | 5,000 | 82 |
| Test no. 10 (brake disc without ventilation channels) | 350 | 14/18 | 5,000 | 96 |
| Test no. 8 (brake disc with ventilation channels) | 300 | 25 | 5,000 | 53 |
| Test no. 10 (brake disc with ventilation channels) | 350 | 14/18 | 5,000 | 51 |
A thermal imaging camera (Figure 5) was also applied that used the infrared thermography technique. The measurement method allowed us to characterize the thermal phenomena in the brake elements of rail vehicles, the temperature distribution on the friction surface of the tested objects, and their influence on changes in the properties of the elements. Experimental research is now crucial for detecting and understanding the physical effects of the phenomena mentioned above. The results obtained from such tests can be used to validate theoretical models, which at a later stage allow describing the relationship between complex interactions and thermal, mechanical, and tribological effects in the braking systems under consideration during braking.

Visual and thermal imaging camera installed in the test cabin (Photo: J. Kukulski).
5 Results of experimental research
This section presents selected results of experimental tests performed on a dynamometric stand. The tests were carried out on two different types of brake discs, with and without ventilation ducts. The same test parameters were used to compare the obtained test results. Table 3 presents a summary of selected test braking results.
Results of experimental tests of four cases of braking
| Test no. | v 0 [km/h] | Braking energy (MJ) | Braking power (kW) | Braking distance (m) | Average friction coefficient | Average temperature of friction surface at the end of braking (thermocouples) T max (°C) | Average temperature of friction surface at the end of braking (infra-red camera) T max (°C) |
|---|---|---|---|---|---|---|---|
| Test no. 8 (brake disc without ventilation channels) | 300 | 16.58 | 340 | 4,246 | 0.309 | 327 | 440 |
| Test no. 10 (brake disc without ventilation channels) | 350 | 22.77 | 218 | 8,926 | 0.313 | 418 | 480 |
| Test no. 8 (brake disc with ventilation channels) | 300 | 16.32 | 382 | 3,400 | 0.385 | 303 | 348 |
| Test no. 10 (brake disc with ventilation channels) | 350 | 22.94 | 277 | 7,034 | 0.405 | 352 | 432 |
Figures 6–9 show the recorded parameters such as average temperatures on the surface of the disc from six sliding thermocouples (or embedded under the friction surface of the disc), the pressure force of the linings to the friction surface of the disc, and braking energy in the domain of the linear speed of the rotating object.

Pressure force of linings, an average temperature of the disc surface, and braking energy versus time for braking from the initial speed: (a) v 0 = 300 km/h (test no. 8); (b) v 0 = 350 km/h (test no. 10) – brake disc without ventilation channels.

Pressure force of linings, an average temperature of the disc surface, and braking energy versus time for braking from the initial speed: (a) v 0 = 300 km/h (test no. 8); (b) v 0 = 350 km/h (test no. 10) – brake disc with ventilation channels.

Temperature distribution on the disc brake (and its hub) at the end of braking from the initial speed: (a) v 0 = 300 km/h (test no. 8); (b) v 0 = 350 km/h (test no. 10) – brake disc without ventilation channels.

Temperature distribution on the disc brake (and its hub) at the end of braking from the initial speed: (a) v 0 = 300 km/h (test no. 8); (b) v 0 = 350 km/h (test no. 10) – brake disc with ventilation channels.
When analyzing the graphs, it can be seen that the temperature increases almost linearly to the maximum value throughout the braking process in the case of a brake disc without ventilation ducts (Figure 6). The characteristic effect is that at the end of the braking process (at low speed and the amount of generated heat), the temperature of the friction surface of the disc slightly decreased. It is caused by a measurement imperfection of the sliding thermocouples. In the case of a brake disc with ventilation ducts, the temperature course (Figure 7), where we have thermocouples installed shallowly under the disc friction surface, we can see a characteristic effect of the temperature decrease. The difference in the results obtained between the two types of discs is also worth noting. Namely, the maximum temperatures are lower for the disc with ventilation channels. It is due to the faster heat outflow to ambient air during braking and has an impact on the coefficient of friction and consequently on the braking distance.
Additionally, recording with a thermal imaging camera was used in the research. Examples of thermograms are presented in Figures 8 and 9.
6 Simulation investigations
6.1 Research object
The simulations were run for the disc brake of a high-speed rail vehicle (Figure 10). The basic parameters of this brake are presented in Table 4.

Axial section of a high-speed train brake disc installed on the test stand: (a) overview drawing, (b) adopted finite-element mesh of the brake rotor including additional parts (disc hub, a part of test stand shaft) connected to the brake disc. The location of thermocouples (T 1, T 2, …, T 6) is also shown.
Technical data of railway brake
| General parameters of the brake | ||
|---|---|---|
| External diameter of the disc brake (mm) | 640 | |
| Thickness of the disc brake (mm) | 45 | |
| Frictional area | Brake rotor | Friction linings |
|---|---|---|
| Disc brake (m2) | 0.2099 | 0.0400 |
| Material parameters | Cast steel disc | Friction linings |
| Heat conduction coefficient (W/m K) | 45 | 2.4 |
| Density (kg/m3) | 7,300 | 5,250 |
| Specific heat (J/kg K) | 615 | 1,600 |
The considered disc brake is made of cast steel. For this material, the temperature dependences of the heat conduction coefficient λ and specific heat c p have been examined (equation (1)). The changes of these thermal parameters in the temperature range of interest (approx. 50–500°C) are relatively small. The averaged material properties for the predicted temperature range have therefore been applied. However, it should be noted that the material data have been obtained from thermodynamic tables and not directly from the disc brakes manufacturer.
The fact that one rail vehicle axle wheel applies to two brake discs must be emphasized. For this reason, a symmetry plane can be found on the right side of Figure 10a. Figure 10b shows the adopted mesh of the disc’s finite elements, including additional parts (like the disc hub and a part of the test stand shaft) connected to the disc brake. Figure 10b also distinguishes five mesh nodes where the temperature variations over time have been calculated. These points apply to the center of the frictional surface and two different depths under this surface up to the center of the disc thickness, i.e., 8 and 22.5 mm. Two other points are placed at the inner part of the disc brake and on the disc hub (Figure 10b). Additionally, Figure 10b presents the location of the brake’s slip thermocouples (T 1, T 2, …, T 6) under consideration. It should be noted that all the points of the thermocouple location coincide with the location of corner nodes or nodes in the middle of the edges of finite elements.
6.2 Results of numerical calculations
The purpose of numerical simulations was to reconstruct the heat transfer conditions available during previously described (Sections 4 and 5) experimental tests of the disc brake on the inertial test bench.
The calculations were performed for the two tests (Tables 2 and 3) concerning solid disc brakes (i.e., without internal vents). Figure 11 shows the time courses for forwarding train speed and angular velocity of the disc brake reconstructed on the inertial test bench. In the case of intensive braking until a halt, both values decline almost linearly over braking time. The initial speeds of the rail vehicle are high and equal: 300–350 km/h, which applies to angular velocities of the disc brake ca. 330–350 rad/s. The inertial test bench ensured sufficiently high brake thermal loads, similar to the ones when the rail vehicle brakes in actual conditions, and similar sliding speed of brake friction pairs [10].

Simulated train forward speed and angular velocity of the disc brake tested on the inertial bench versus time. Braking from the initial speed of (a) v 0 = 300 km/h (test no. 8), and (b) v 0 = 350 km/h (test no. 10).
The heat transfer rate generated in the brake Q′(t) was established based on available time courses of braking torque M H (t) and angular velocity ω(t) of the inertial bench shaft, and therefore for the disc brake under consideration:
where F r (t), n(t) is the measured time courses of the force on the reaction arm r r and rotational speed of the test bench shaft.
Then, the time course for the heat flux q′(t) penetrating the disc was calculated. It equals the heat rate Q′(t) divided by the friction surface of the considered disc brake. However, it should be noted that the coefficient ξ (equation (3)), i.e., the ratio of heat flux partition between the rotor and friction linings, is also considered. The coefficient ξ depends on the material properties of the friction pair.
The time courses of Q′(t) and q′(t) are depicted in Figure 12.

Heat transfer rate Q′ (W) generated in the disc brake and heat flux q′ (W/m2) on its frictional surface versus time. Braking from the initial speed of: (a) v 0 = 300 km/h; (b) v 0 = 350 km/h.
At first, after applying the brake, a significant increase in the heat transfer rate generated in the brake can be observed. Then, both Q′(t) and q′(t) drop almost linearly to zero as the braking time passes. The reason for this is the continuous decrease in the sliding speed of the friction pairs during braking.
The heat transfer to the environment occurs on the free surfaces of the brake rotor, including additional parts (disc hub, a part of test stand shaft) connected to the disc brake (Figure 10). Ten heat transfer coefficients α i (due to convection and radiation) on free surfaces (Γ ki , i = 1,…,10) have been applied to this research object (equation (5) and Figure 13).

Free surfaces (Γ ki , i = 1,2,…,10) of heat transfer with the environment concerning the disc brake installed on the test stand.
The relations concerning convective heat transfer coefficients on these surfaces (disc, external and internal cylindrical) were given in previous works [28,29,30]. Figure 14 shows the time courses for the heat transfer coefficients (α i, i = 1,…,10) on free surfaces (Γ ki , i = 1,…,10) of the disc brake (Figure 13). The heat transfer coefficient values (Figure 14) decline along with a drop in rail vehicle speed and decreased brake flow-round intensity. The time courses presented in Figure 14 served as boundary conditions of the III type in the developed heat conduction model (equations (4) and (5)). The free surfaces of the disc brake mounted on the test stand were divided into (1) disc surface, (2) cylindrical, and (3) internal cylindrical. The following coefficients of heat transfer with the environment correspond to these surfaces: (1) α 2, α 4, α 6, α 8, (2) α 1, α 5, α 10, and (3) α 3, α 7, α 9. All these heat transfer coefficients are shown in Figure 14.

Heat transfer coefficients α i (convection + radiation) on free surfaces Γ ki of the disc brake (installed on the test stand) versus time: (a) (Γ ki , i = 1,…,5); (b) (Γ ki , i = 6,…,10). Braking from the initial speed of v 0 = 300 km/h.
Radiation heat transfer is less important than convective one, especially for low surface temperatures. However, it was also considered in the analysis – the averaged radiation heat transfer coefficients α ri for the predicted temperature range were calculated (equation (5)).
Figure 15 shows the time courses for temperatures at five chosen points of the disc section (Figure 10b), including the friction surface. As expected, the temperature courses at all points are nearly monotonous. The fastest growth in temperature is observed on the disc friction surface, where heat is generated. The further from this surface, the milder the temperature increase at this point. The calculated temperatures apply to the center of the frictional surface and 8 and 22.5 mm under this surface. Two other points are placed at the inner part of the disc brake and on the disc hub (Figure 10b). When a small amount of heat is generated in the final braking stage, the temperature on the frictional surface drops slightly. The rise of the heat outflow to other parts of the brake rotor can be noticed. Such a nature of temperature courses in disc brakes has been confirmed in many works [7,10,23].

Temperature T i at five selected points (Figure 14b) of the disc brake versus time. Calculated temperatures concern friction surface, 8 and 22.5 mm under this surface, at the inner part of the disc brake, and on the disc hub. Braking from the initial speed of: (a) v 0 = 300 km/h, (b) v 0 = 350 km/h.
7 Comparison of simulation and experimental test results
Figure 16 presents the time courses for temperatures on two friction surfaces of the disc, measured by six slip thermocouples (Figure 10b). The calculated time course for the temperature in the center of the frictional surface, near the thermocouples T 2 and T 5 (Figure 10b), is illustrated. Simultaneously, the results of experimental tests and simulations were subject to preliminary comparison. Similar values of maximum temperatures at the end of braking were achieved, i.e., ca. 400°C for test number 8 and 480°C for test number 10, respectively. A certain temperature discrepancy in time courses is observed during the process under consideration. It may result from imperfect slip thermocouple measurements. Additional measurements using an infrared camera were therefore applied.

Comparison of measured and calculated temperatures of friction surface of the disc brake during braking. Measured temperatures (T i , i = 1,…,6) apply to the location of thermocouples (Figure 10b), and the calculated temperature T calc applies to the mesh node on the friction surface (Figure 10b). Braking from the initial speed of: (a) v 0 = 300 km/h, (b) v 0 = 350 km/h.
8 Conclusions
The experimental tests and simulations introduce further research and aim to use the authors’ application in testing railway brakes. The tests will be continued to check other variants and assumptions related to friction pairs. Based on the comparison of bench tests and simulations, similar values of maximum temperatures at the end of braking were obtained, i.e., ca. 400°C for test no. 8 and 480°C for test no. 10, respectively. However, a certain discrepancy in the time courses of temperatures during the process under consideration was recorded. It may result from imperfect slip thermocouple measurements or assumptions of material parameters concerning the simulation model.
Experimental investigations have been performed correctly; only the temperature measurement method using sliding thermocouples is imperfect. As a result of friction between the sliding thermocouple and the surface of the disc, additional heat is generated, disturbing the measurement itself.
In addition, the material properties for both the disc brake and brake pads were taken from the literature, because obtaining such information from the manufacturers of friction pairs was impossible.
The results of infrared measurements and numerical simulations are shown in Figures 8, 9 and 15. They have proved that during a single, relatively short-lasting (ca. 100–175 s) railway braking, the additional brake parts (disc hub, a part of test stand shaft) connected to the brake disc heat up to a negligible degree (ca. 50–60°C of temperature increase). Therefore, the thermal capacity of these additional brake parts can be neglected in the case of numerical calculations. The tests on the inertial bench and simulation program can be used to analyze the heat transfer process in railway brakes, assess or forecast braking effectiveness changes due to brakes’ thermal state, and optimize the brake design.
-
Funding information: This paper was financed under the research grant of the Warsaw University of Technology supporting the scientific activity in the discipline of Civil Engineering, Geodesy and Transport.
-
Author contributions: Andrzej Wolff (A.W.) and Jacek Kukulski (J.K.) got the idea for this work. J.K. conducted all the measurements on a dynamometric stand for railway brakes. A.W. developed a specialized computer program of the finite element method and conducted all the numerical calculations. A.W. and J.K. prepared the first version of the manuscript, responses to the reviewers and created the final manuscript. All authors have read and agreed to the final version of the manuscript.
-
Conflict of interest: The authors declare no conflict of interest.
-
Data availability statement: The data used to support the findings of this study are available from the corresponding author upon request.
References
[1] Eriksson M, Filip Bergman F, Jacobson S. On the nature of tribological contact in automotive brakes. Wear. 2002;252:26–36.10.1016/S0043-1648(01)00849-3Search in Google Scholar
[2] Konowrocki R, Kukulski J, Walczak S, Groll W. Distribution of thermal energy in the elements of the braking system of high-speed vehicles. Pojazdy Szynowe. 2014;2:1–14 (Polish).Search in Google Scholar
[3] Kumar M, Boidin X, Desplanques Y, Bijwe J. Influence of various metallic fillers in friction materials on hot-spot appearance during stop braking. Wear. 2011;270(5–6):371–81.10.1016/j.wear.2010.11.009Search in Google Scholar
[4] Nisonger R, Yen C, Antanaitis D. High temperature brake cooling - characterization for brake system modeling in race track and high energy driving conditions. SAE Int J Passeng Cars – Mech Syst. 2011;4(1):384–98. 10.4271/2011-01-0566.Search in Google Scholar
[5] Tonchev A, Hirschberg W, Jagsch S. Investigation of the Thermal Vehicle Brake Behavior During the Vehicle's Development Phase by Co-Simulation, SAE Technical Paper 2007-01-3935; 2007. 10.4271/2007-01-3935.Search in Google Scholar
[6] Mackin TJ, Noe SC, Ball KJ, Bedell BC, Bim-Merle DP, Bingaman MC, et al. Thermal cracking in disc brakes. Eng Fail Anal. 2002;9:63–76.10.1016/S1350-6307(00)00037-6Search in Google Scholar
[7] Lozia Z, Wolff A. Thermal state of automotive brakes after braking on the road and on the roll-stand, SAE Special Publication. 1229/SAE Technical Pap No 971040; 1997:107–15.10.4271/971040Search in Google Scholar
[8] Fischer S, Sardá A, Winner H. Effects of different friction materials on hot judder – an experimental investigation. EuroBrake 2013 –EB2013-TE-005; 2013.Search in Google Scholar
[9] Graf M, Ostermeyer GP. Hot bands and hot spots: some direct solutions of continuous thermoelastic systems with friction. Phys Mesomech. 2012;15(5–6):306–15.10.1134/S1029959912030113Search in Google Scholar
[10] Wolff A, Kukulski J. Numerical and experimental analysis of the heat transfer process in a railway disc brake. Railw Report/Problemy Kolejnictwa. 2019;185:59–69. 10.36137/1857E.Search in Google Scholar
[11] Wolff A. Numerical analysis of heat transfer in cylinder of a marine two-stroke engine. Combust Engines. 2015;3/2015(162):849–57.Search in Google Scholar
[12] Zagrodzki P. Clutches, hot spotting behavior. Encyclopedia of Thermal Stresses. In: Richard B. Hetnarski editors. Springer Dordrecht Heidelberg New York London; 2014. p. 606–14. 10.1007/978-94-007-2739-7.Search in Google Scholar
[13] Eriksson M, Jacobson S. Tribological surfaces of organic brake pads. Tribol Int. 2000;3(12):817–27. 10.1016/S0301-679X(00)00127-4.Search in Google Scholar
[14] Jung SP, Park TW, Chai JB, Chung WS. Thermo-mechanical finite element analysis of hot judder phenomena of a ventilated disc brake system. Int J Precis Eng Manuf. 2011;12:821–8.10.1007/s12541-011-0109-5Search in Google Scholar
[15] Kao T, Richmond JW, Douarre A. Brake disc hot spotting and thermal judder: an experimental and finite element study. Int J Veh Des. 2011;23:276–96.10.1504/IJVD.2000.001896Search in Google Scholar
[16] Sha Z, Lu J, Hao Q, Yin J, Liu Y, Zhang S. Numerical simulation of heat production and dissipation of ventilated brake disc for high-speed trains under the action of the flow field. Appl Sci. 2022;12(21):10739. 10.3390/app122110739.Search in Google Scholar
[17] Yevtushenko AA, Kuciej M, Grzes P, Wasilewski P. Comparative analysis of temperature fields in railway solid and ventilated brake. Materials. 2021;14(24):7804. 10.3390/ma14247804.Search in Google Scholar PubMed PubMed Central
[18] Zewang Y, Chun T, Mengling W, Guozhuang W. A modified uniformly distributed heat source method for predicting braking temperature of railway brake disc. Int J Rail Transp. 2021;10(2):216–29. 10.1080/23248378.2021.1882890.Search in Google Scholar
[19] Maniana M, Azime A, Errchiqui F, Tajmouati A. Analytical and numerical analysis of thermal transfer in disc brake. Heat Technol. 2022;40(3):693–8.10.18280/ijht.400305Search in Google Scholar
[20] Wang LL, Wang L, Gao ZX, Wang LB, Wang Y. The convective heat transfer characteristics of the track surface on which wheels roll over periodically. Int J Therm Sci. 2021;165:106947. 10.1016/j.ijthermalsci.2021.106947.Search in Google Scholar
[21] Cati Y, Wiesche S, Düzgün M. Numerical Model of the Railway Brake Disk for the Temperature and Axial Thermal Stress Analyses. J Therm Sci Eng Appl. 2022;14(10):101014 (11 pages). 10.1115/1.4054213.Search in Google Scholar
[22] Incropera FP, DeWitt DP, Bergman TL, Lavine AS. Fundamentals of heat and mass transfer. United Kingdom: John Wiley & Sons; 2011. https://hyominsite.files.wordpress.com/2015/03/fundamentals-of-heat-and-mass-transfer-6th-edition.pdf.Search in Google Scholar
[23] Wolff A. A method to achieve comparable thermal states of car brakes during braking on the road and on a high-speed roll-stand. Arch Transp. 2010;XXII(2):259–73.10.2478/v10174-010-0016-zSearch in Google Scholar
[24] Palmer E, Mishra R, Fieldhouse J, Layfield J. Analysis of air flow and heat dissipation from a high performance GT car front brake, SAE 2008, Paper No. 2008-01-0820.10.4271/2008-01-0820Search in Google Scholar
[25] Schuetz T. Cooling analysis of a passenger car disc brake. SAE Paper 2009, 2009-01-3049.10.4271/2009-01-3049Search in Google Scholar
[26] Zienkiewicz OC, Morgan K. Finite Elements and Approximation. NY: John Wiley & Sons, Inc; 1983. p. 328.Search in Google Scholar
[27] https://www.researchgate.net/figure/TGV-brake-system-a-TGV-bogie-b-part-of-a-brake-pad_fig1_283206988.Search in Google Scholar
[28] Hartter L, Schwartz H, Rhee S. Evaluating copper alloy brake discs by thermal modeling. SAE Transactions 1974, Paper 740560.10.4271/740560Search in Google Scholar
[29] Kays W, Bjorklund I. Heat transfer from a rotating cylinder with and without crossflow. ASME Trans. 1958;80(1):70–7.10.1115/1.4012253Search in Google Scholar
[30] Saumweber E. Temperaturberechnung in Bremsscheiben fuer ein beliebiges Fahrprogramm, Leichtbau der Verkehrsfahrzeuge; 1969. p. 13.Search in Google Scholar
© 2023 the author(s), published by De Gruyter
This work is licensed under the Creative Commons Attribution 4.0 International License.
Articles in the same Issue
- Regular Articles
- Design optimization of a 4-bar exoskeleton with natural trajectories using unique gait-based synthesis approach
- Technical review of supervised machine learning studies and potential implementation to identify herbal plant dataset
- Effect of ECAP die angle and route type on the experimental evolution, crystallographic texture, and mechanical properties of pure magnesium
- Design and characteristics of two-dimensional piezoelectric nanogenerators
- Hybrid and cognitive digital twins for the process industry
- Discharge predicted in compound channels using adaptive neuro-fuzzy inference system (ANFIS)
- Human factors in aviation: Fatigue management in ramp workers
- LLDPE matrix with LDPE and UV stabilizer additive to evaluate the interface adhesion impact on the thermal and mechanical degradation
- Dislocated time sequences – deep neural network for broken bearing diagnosis
- Estimation method of corrosion current density of RC elements
- A computational iterative design method for bend-twist deformation in composite ship propeller blades for thrusters
- Compressive forces influence on the vibrations of double beams
- Research on dynamical properties of a three-wheeled electric vehicle from the point of view of driving safety
- Risk management based on the best value approach and its application in conditions of the Czech Republic
- Effect of openings on simply supported reinforced concrete skew slabs using finite element method
- Experimental and simulation study on a rooftop vertical-axis wind turbine
- Rehabilitation of overload-damaged reinforced concrete columns using ultra-high-performance fiber-reinforced concrete
- Performance of a horizontal well in a bounded anisotropic reservoir: Part II: Performance analysis of well length and reservoir geometry
- Effect of chloride concentration on the corrosion resistance of pure Zn metal in a 0.0626 M H2SO4 solution
- Numerical and experimental analysis of the heat transfer process in a railway disc brake tested on a dynamometer stand
- Design parameters and mechanical efficiency of jet wind turbine under high wind speed conditions
- Architectural modeling of data warehouse and analytic business intelligence for Bedstead manufacturers
- Influence of nano chromium addition on the corrosion and erosion–corrosion behavior of cupronickel 70/30 alloy in seawater
- Evaluating hydraulic parameters in clays based on in situ tests
- Optimization of railway entry and exit transition curves
- Daily load curve prediction for Jordan based on statistical techniques
- Review Articles
- A review of rutting in asphalt concrete pavement
- Powered education based on Metaverse: Pre- and post-COVID comprehensive review
- A review of safety test methods for new car assessment program in Southeast Asian countries
- Communication
- StarCrete: A starch-based biocomposite for off-world construction
- Special Issue: Transport 2022 - Part I
- Analysis and assessment of the human factor as a cause of occurrence of selected railway accidents and incidents
- Testing the way of driving a vehicle in real road conditions
- Research of dynamic phenomena in a model engine stand
- Testing the relationship between the technical condition of motorcycle shock absorbers determined on the diagnostic line and their characteristics
- Retrospective analysis of the data concerning inspections of vehicles with adaptive devices
- Analysis of the operating parameters of electric, hybrid, and conventional vehicles on different types of roads
- Special Issue: 49th KKBN - Part II
- Influence of a thin dielectric layer on resonance frequencies of square SRR metasurface operating in THz band
- Influence of the presence of a nitrided layer on changes in the ultrasonic wave parameters
- Special Issue: ICRTEEC - 2021 - Part III
- Reverse droop control strategy with virtual resistance for low-voltage microgrid with multiple distributed generation sources
- Special Issue: AESMT-2 - Part II
- Waste ceramic as partial replacement for sand in integral waterproof concrete: The durability against sulfate attack of certain properties
- Assessment of Manning coefficient for Dujila Canal, Wasit/-Iraq
- Special Issue: AESMT-3 - Part I
- Modulation and performance of synchronous demodulation for speech signal detection and dialect intelligibility
- Seismic evaluation cylindrical concrete shells
- Investigating the role of different stabilizers of PVCs by using a torque rheometer
- Investigation of high-turbidity tap water problem in Najaf governorate/middle of Iraq
- Experimental and numerical evaluation of tire rubber powder effectiveness for reducing seepage rate in earth dams
- Enhancement of air conditioning system using direct evaporative cooling: Experimental and theoretical investigation
- Assessment for behavior of axially loaded reinforced concrete columns strengthened by different patterns of steel-framed jacket
- Novel graph for an appropriate cross section and length for cantilever RC beams
- Discharge coefficient and energy dissipation on stepped weir
- Numerical study of the fluid flow and heat transfer in a finned heat sink using Ansys Icepak
- Integration of numerical models to simulate 2D hydrodynamic/water quality model of contaminant concentration in Shatt Al-Arab River with WRDB calibration tools
- Study of the behavior of reactive powder concrete RC deep beams by strengthening shear using near-surface mounted CFRP bars
- The nonlinear analysis of reactive powder concrete effectiveness in shear for reinforced concrete deep beams
- Activated carbon from sugarcane as an efficient adsorbent for phenol from petroleum refinery wastewater: Equilibrium, kinetic, and thermodynamic study
- Structural behavior of concrete filled double-skin PVC tubular columns confined by plain PVC sockets
- Probabilistic derivation of droplet velocity using quadrature method of moments
- A study of characteristics of man-made lightweight aggregate and lightweight concrete made from expanded polystyrene (eps) and cement mortar
- Effect of waste materials on soil properties
- Experimental investigation of electrode wear assessment in the EDM process using image processing technique
- Punching shear of reinforced concrete slabs bonded with reactive powder after exposure to fire
- Deep learning model for intrusion detection system utilizing convolution neural network
- Improvement of CBR of gypsum subgrade soil by cement kiln dust and granulated blast-furnace slag
- Investigation of effect lengths and angles of the control devices below the hydraulic structure
- Finite element analysis for built-up steel beam with extended plate connected by bolts
- Finite element analysis and retrofit of the existing reinforced concrete columns in Iraqi schools by using CFRP as confining technique
- Performing laboratory study of the behavior of reactive powder concrete on the shear of RC deep beams by the drilling core test
- Special Issue: AESMT-4 - Part I
- Depletion zones of groundwater resources in the Southwest Desert of Iraq
- A case study of T-beams with hybrid section shear characteristics of reactive powder concrete
- Feasibility studies and their effects on the success or failure of investment projects. “Najaf governorate as a model”
- Optimizing and coordinating the location of raw material suitable for cement manufacturing in Wasit Governorate, Iraq
- Effect of the 40-PPI copper foam layer height on the solar cooker performance
- Identification and investigation of corrosion behavior of electroless composite coating on steel substrate
- Improvement in the California bearing ratio of subbase soil by recycled asphalt pavement and cement
- Some properties of thermal insulating cement mortar using Ponza aggregate
- Assessment of the impacts of land use/land cover change on water resources in the Diyala River, Iraq
- Effect of varied waste concrete ratios on the mechanical properties of polymer concrete
- Effect of adverse slope on performance of USBR II stilling basin
- Shear capacity of reinforced concrete beams with recycled steel fibers
- Extracting oil from oil shale using internal distillation (in situ retorting)
- Influence of recycling waste hardened mortar and ceramic rubbish on the properties of flowable fill material
- Rehabilitation of reinforced concrete deep beams by near-surface-mounted steel reinforcement
- Impact of waste materials (glass powder and silica fume) on features of high-strength concrete
- Studying pandemic effects and mitigation measures on management of construction projects: Najaf City as a case study
- Design and implementation of a frequency reconfigurable antenna using PIN switch for sub-6 GHz applications
- Average monthly recharge, surface runoff, and actual evapotranspiration estimation using WetSpass-M model in Low Folded Zone, Iraq
- Simple function to find base pressure under triangular and trapezoidal footing with two eccentric loads
- Assessment of ALINEA method performance at different loop detector locations using field data and micro-simulation modeling via AIMSUN
- Special Issue: AESMT-5 - Part I
- Experimental and theoretical investigation of the structural behavior of reinforced glulam wooden members by NSM steel bars and shear reinforcement CFRP sheet
- Improving the fatigue life of composite by using multiwall carbon nanotubes
- A comparative study to solve fractional initial value problems in discrete domain
- Assessing strength properties of stabilized soils using dynamic cone penetrometer test
- Investigating traffic characteristics for merging sections in Iraq
- Enhancement of flexural behavior of hybrid flat slab by using SIFCON
- The main impacts of a managed aquifer recharge using AHP-weighted overlay analysis based on GIS in the eastern Wasit province, Iraq