Daily load curve prediction for Jordan based on statistical techniques
-
Mohammad Awad Momani


Abstract
The article proposes a mathematical prediction model for daily load curves (DLCs) in Jordan from 2023–2050. The historical hourly peak loads based on the growth rate statistical method in 1994–2020 and the annual forecasted peak loads during the morning and evening periods taken from the long-term load forecast (LTLF) study of National Electric Power Company (NEPCO) during 2022–2050 are employed in the prediction model. The results show that the actual hourly growth rates, the annual forecasted growth rates, and the hourly peak loads in the reference year 2022 are the main input variables used in the prediction formula. The LTLF study conducted by NEPCO employs various sophisticated methods depending on the end-user sectorial electricity consumption that imply an econometric approach, market survey, and Gomprtz extrapolation techniques. The peak load in Jordan relies upon several climatic and nonclimatic variables, implying the ambient temperature, gross domestic product, income, demographic, urbanization, electricity tariff, average oil prices, and other factors related to technology and new aspects of energy saving and space heating/cooling systems, the DLC in Jordan is variable and changing from year to year. The proposed model considers a variation in the future DLC and suggests three different scenarios of DLC’s prediction based on the time occurrence of the peak load: the first is the daytime peak occurrence scenario, the second is the evening peak occurrence scenario, and finally is the daytime and evening peaks may be close to each other.
1 Introduction
The electricity consumption pattern is an essential indicator of the development of any country. It is a mixture of climate and nonclimate variables that include gross domestic product (GDP), income per capita, import and export values, electricity prices, population, urbanization, water consumption, technology, and factors related to policy change and environmental factors [1–3]. The positive contribution of urbanization and economic growth to electricity consumption was investigated by many researchers [4–6]. In the study by Ubani [5], factors such as water consumption, electricity price, and distance to the power station were also examined, and they had a relation with consumption despite low meaning. The electricity consumption to environmental degradation due to
The electricity consumption in Jordan during 2018 has steadily increased, where households consume the most significant portion [10]. The current consumption pattern in Jordan during 2022 shows that the households consumed 46% of electricity, industries 22%, water pumping 16%, commercial activities 14%, and street lighting consumes the remaining 2% of total consumption. One of the main problems facing the interconnected power system of Jordan is the abnormal increase in the peak loads due to high and low ambient temperatures during summer and winter, respectively [11–14]. The weather factor was also examined by several researchers elsewhere [15–17]. In the study by Yi-Ling et al. [15], the winter-to-summer peak variations due to the urban residential heating and cooling demand was examined during the period 2003–2007 in Shanghai were examined. The base temperature of electricity enhancement was observed when the daily temperature was below
Load analysis studies are essential planning studies that aim to identify current and future consumption patterns during all periods. Power companies seek an accurate electricity load forecasting model to minimize financial risk, maximize operational efficiency and reliability, and ensure an uninterrupted, reliable, secure, and economical electricity supply. The quality of forecast methods mainly depends on the available historical data and knowledge about the factors influencing the energy demand. The study by Behmiri et al. [18] classified the load forecast into four categories: very short-term (from a few minutes to one hour ahead), short-term (from one hour to a few days ahead), medium-term (from a few days to a year head), and long-term (from one year to several decays a head). Yadav et al. [19] discussed the techniques that are being used in conducting electricity load forecast studies, such as multiple linear regression, exponential smoothing, iterative reweighted least-squares, adaptive load forecasting, stochastic time series, auto-regressive moving average with extra input (ARMAX) models based on genetic algorithms, adaptive neuro-fuzzy inference system (ANFIS), and expert systems [20–22]. The implementation models strongly rely upon selecting of influential external factors affecting the electricity demand. The socio-economic factors are excluded from short-term demand forecasting, where the atmospheric, seasonal, and other short-term dependent variables are considered [23]. The future power profile for countries differs due to demographic and economic factors. The future power demand profile will be completely different from that of today for many reasons, namely, improved building insulation, new comfort levels and management scenarios in dwellings, and possible widespread integration of electrical heating systems that will replace old installed systems using fossil fuels, e.g., photovoltaic modules with battery [24].
Several studies deal with predicting daily load curves (DLCs) [25,26]. For instance, Cho et al. [25] proposed a hybrid approach for the modeling short-term forecasting of DLC curves. Two building blocks of their approach are (1) modeling the overall trend and seasonality by fitting a generalized additive model to the weekly averages of the load and (2) modeling the dependence structure across consecutive daily loads via curve linear regression. Shang et al. [26] proposed a novel model based on data mining and deep learning. Data preprocessing implies normalization of historical load and fuzzification of influencing factors (meteorological factors, data types, and economy) based on the Pearson correlation coefficient, and then kernel fuzzy c-means modified by particle swarm optimization algorithm clusters the DLCs. Caro and Juan [27] proposed a new approach to predict the short-term load variations applied to 10 main Spanish islands based on initial Reg-ARIMA forecasting models. In the study by Alfares and Nazeeruddin [28] proposed a model of the DLC forecast for residential electricity usage based on a time series and stochastic regression framework in which the observed DLC is represented in terms of a set of periodic smoothing-spline basis functions, with the basis function coefficients evolving according to a linear Gaussian state-space model that incorporates level shifts, day of the week and holiday adjustments, and weather effects, as well as the dynamic price-incentive effects mentioned earlier. This article introduces a technique for the DLC forecast up to 2050 in Jordan based on the growth rate (GR) technique. The actual growth rates between 2007 and 2022 were used to forecast the DLCs. The analysis is based on two scenarios of peak occurrence: morning peak in summer and evening peak in winter, as shown in the procedure. Section 2 presents the load development and conversion of peak occurrence in Jordan. Section 3 discusses the long-term electricity demand forecast in Jordan, followed by Section 4, which presents the DLC prediction technique and result discussion followed by conclusions and recommendation in Section 5.
2 Load development and conversion of peak occurrence in Jordan
The peak period occurs when the demand for electric power increases and the loads rise to the highest limit in the Jordanian electrical system. During this period, loads of some subscribers are subject to a special tariff to be applied called the monthly maximum load tariff. The monthly maximum load is the highest load rate per half hour in kilowatts during the peak period. Based on historical data on peak load occurrence in Jordan, the peak load may occur during either morning or evening periods in either summer or winter. The maximum morning peak is usually during 13:00–15:00, whereas the maximum evening peak is during 16:00–18:00 [12]. Figure 1 presents the time series of the raw data of the morning and evening peak load in MW during the 2014–2022 study period. The smoothed peak loads are also held in each sub-plot for better presentation. The data are obtained from the electricity operation and control center of the National Electric Power Company (NEPCO) in Amman; the data in Figure 1 are taken every 1-hour time interval. As shown in Figure 1(a), the seasonality of the morning peak forms a W-shape response with a maximum load most of the time occurring in summer, particularly from June to August every year. Figure 1(b) shows the seasonality of the evening peak that also forms a W-shape response with maximum load occurs in winter, particularly December-to-February every year. The growth of electricity demand from year to year is shown in this figure. The minimum peak in the year is usually seen during the equinox and vernal each year besides summer. In Jordan’s case, the fluctuation of air conditioning load due to seasonal changes can still be the main reason for the seasonal peak and valley load difference.
![Figure 1
The morning and evening peak load variation during the period of study [29].](/document/doi/10.1515/eng-2022-0560/asset/graphic/j_eng-2022-0560_fig_001.jpg)
The morning and evening peak load variation during the period of study [29].
Samples of annual DLCs during 3 years, namely, 1997, 2010, and 2019, respectively, are presented in Figure 2. As shown in the figure, the recorded peak load in 1997 was 971 MW, took place on October 15, while in 2010, the recorded peak load was 2,544 MW, took place on August 3, and in 2019, the recorded peak was 3,260 MW, which took place on February 7. A comparison between the curves indicates a modification in the load response and conversion in peak load occurrence from evening to morning or morning to evening. Based on the historical data of NEPCO during the last three decades, two main conversions were recorded: the first conversion was from evening to morning. It took place in the year 2000, and it continued until 2013. The second conversion was from the morning to evening period, which took place in the year 2013 and maintained until the present.

Jordan’s DLCs in the years 1997, 2010, and 2019, respectively.
Table 1 presents the peak load readings in Jordan during the 1995–2022 period in both morning and evening. As shown in the table, the peak load in Jordan developed from 862 MW in 1995 to 4,010 MW in 2022. Before the year 2000, the evening peak was dominant and usually occurred during the August to October months. During the 2000–2012 periods, a conversion from evening to morning peak was observed and took place during the July to August months. From 2013 to the present, another conversion from morning to evening peak was observed where the peak occurs in December, January, and February. Figure 3 shows the differential peak representing the evening peak to Morning Peak during the study period from 1995–2022, as shown in the figure periods where peak load converted from evening to morning and vice versa.
Jordan’s morning and evening peak load during the 1995-2022 period [29]
| Year | Peak load (MW) | Year | Peak load (MW) | Year | Peak load (MW) | Year | Peak load (MW) | ||||
|---|---|---|---|---|---|---|---|---|---|---|---|
| Morning | Evening | Morning | Evening | Morning | Evening | Morning | Evening | ||||
| 1995 | 842 | 862 (Sep. 13) | 2002 | 1,370 July 31 | 1,310 | 2009 | 2,208 July 29 | 2,131 | 2,016 | 3,180 | 2,208 July 29 |
| 1996 | 895 | 902 (Sep. 28) | 2003 | 1,384 | 1,387 (Aug. 30) | 2010 | 2,544 (Aug. 3) | 2,362 | 2017 | 3,320 (July 25) | 3,220 |
| 1997 | 912 | 971 (Oct. 15) | 2004 | 1,515 (Aug. 27) | 1,471 | 2011 | 2,660 (Aug. 29) | 2,530 | 2018 | 3,100 | 3,205 (Jan. 21) |
| 1998 | 1,020 | 1,020 (Aug. 23) | 2005 | 1,710 (Aug. 8) | 1,665 | 2012 | 2,770 (July 31) | 2,630 | 2019 | 3,260 | 3380 (Feb.7) |
| 1999 | 1,085 | 1,099 (Aug. 23) | 2006 | 1,819 | 1,860 (July 31) | 2013 | 2,840 | 2,975 (Dec. 17) | 2020 | 3,530 | 3,630 (Jan. 19) |
| 2000 | 1,203 (July 31) | 1,188 | 2007 | 2,130 (July 29) | 2,030 | 2014 | 2,845 | 2,900 (Dec. 28) | 2021 | 3540 | 3770 (Dec. 21) |
| 2001 | 1,225 (July 23) | 1,215 | 2008 | 2,141 (Aug. 19) | 2,112 | 2015 | 3,310 (Aug. 4) | 3,160 | 2022 | 3,800 | 4,010 (Jan. 20) |

The differential peak load (evening peak to morning peak) in the period 1995–2022.
Based on Table 1 and Figure 3, from 2000 to 2012, air-conditioning technology became widely used in different utilities including homes and government offices, shops, and malls. During this period, air conditioning is used for cooling rather than heating due to the high cost of heating. From 2012 to the present, and with the invention of inverter or dual-inverter air-conditioning systems and the implementation of these systems for both space heating and cooling in Jordan, a significant reduction in peak load was attained with maximum load reduction potential and optimal economy mainly during evening periods is achieved. However, the implementation of inverter air conditions for space heating in the evening by many end-users caused a conversion from morning to evening peak in winter, as many customers utilize these systems for heating as an alternative to gasoline, which became dominant, especially in the last 5 years until 2022.
The justification of load conversion in Jordan is mainly due to determinates related to climatic and nonclimatic variables that imply weather and technological factors associated with introducing new space cooling/heating methods to be used in both summer and winter as alternatives to gasoline and traditional cooling systems. Moreover, the DLCs’ shape in any country can be changed and controlled by implementing demand side management techniques by encouraging energy users to shift their demand needs toward the valley and reduce energy consumption and peak demand. DSM programs such as financial incentives, load scheduling, and energy conservation by many countries [30,31]. In Jordan, foundations such as the Energy and Minerals Regulatory Commission and Ministry of Energy and Mineral Resources implement several DSM technologies and strategies with recommendations to the end-users to be applied, such as the usage of efficient appliances and lights, commercial load scheduling, restricting residential appliance use, price incentives and tariff structure, community involvement, and finally, consumer education and village committees [32]. Researchers such as Eissa [33] show that incentive-based programs such as time-of-use programs and incentive-based demand response programs applied to industrial and commercial data are better than time-varying retail tariffs. With the application of the time-of-use incentives, load shifting for customers, such as water pumping and industrial loads from peak periods to minimum periods, can change the shape of DLC in Jordan.
It is worth mentioning that during 2021, the total energy consumed by the end-use customers in all sectors is about 17,550 GWh. Most of this energy is consumed by the residential and government sectors (about 45% of total energy purchased), while the minimum consumption was in the street lighting sector with a value of about 2%. The sectorial consumption in 2021 is shown in Figure 4.
![Figure 4
Electricity consumption by sector type in the year 2021 [34].](/document/doi/10.1515/eng-2022-0560/asset/graphic/j_eng-2022-0560_fig_004.jpg)
Electricity consumption by sector type in the year 2021 [34].
3 Long-term electricity demand forecast in Jordan
A long-term electricity demand forecast study is the first step in the planning activities of an electrical power system. It is used as input for related power system planning studies, such as the expansion of power generation and power transmission lines. It is also used as input in restructuring the electrical tariffs and other related financial studies. The accuracy and strength of the study rely upon the availability and accuracy of the data input that represents the independent variables affecting electricity demand in the country and upon the methodology and mathematical models employed in conducting this study. In Jordan, the study is conducted in three different directions: medium, high, and low forecast trends [35]. The medium forecast trend represents the realization of the planned aspirations based on normal economic and demographic growth. The high forecast trend represents the high expectations based on optimistic economic and demographic growth expectations. In contrast, the low trend represents the low expectations due to the degradation in the economy, income, productivity, and high cost of living in the country. These trends are used to avoid the ambiguity and uncertainty that may occur in the data input used in forecasting the electricity demand. The forecast study conducted in NEPCO employs the end-user method that subdivides the energy consumption into domestic, commercial, large industrial, medium, and small industrial, services, water pumping, and street lighting sectors. Each of these sectors represents a consumption pattern that differs from other sectors in the factors affecting the sector’s consumption. The factors affecting consumption in each sector are summarized in Table 2.
Factors affecting electricity consumption in each sector in Jordan [35]
| Sector | Factors affecting consumption |
|---|---|
| Domestic | Per capita income rate, electricity prices, and the sudden increase in the population due to forced migration from neighboring countries witnessing internal wars, such as Syria, Iraq, Yemen, Lebanon, and Libya |
| Commercial | Value added, electricity prices, and number of subscribers |
| Medium and small industries | Value added and number of subscribers |
| Services | Value added |
| Large industries and water pumping | The quantities of production (Ton and
|
| Street lighting | The number of household subscribers |
The study employs three different cumulative methods for the end-use customers as follows.
3.1 The econometric method
The econometric method is used in forecasting the demand for electricity in domestic, commercial, medium, and small industrial, services, and water pumping sectors in small and medium projects. The regression model in its linear form based on historical consumption and influencing factors is presented in equation (1):
where
where
3.2 Field survey method
The field survey method is used in forecasting the demand for electric power in the large industries such as cement, phosphates, potash, fertilizers and oil refineries, and large industrial projects under implementation or planned for construction. The method is also used in the water pumping sector for large projects. This method depends on the annual production quantities expected from these projects and the specific amount of consumption per unit of production as in equation (4):
where
3.3 Gempertz extrapolation method
This Gempertz method is used to forecast some factors affecting electricity consumption, such as population and other related factors affecting electricity demand [36]. In our study, this method is suitable for forecasting the electricity consumption in the street lighting sector and the number of households in the domestic sector. This method is considered a modification of the exponential system by making growth dependent on the time factor until saturation is reached. This method is viewed as a modification of the exponential system by making the growth dependent on the time factor until the saturation state is reached in infinity and according to equation (5) [37].
where
The end-user electricity consumption forecast per sector extracted from the techniques presented in Section 4 is summarized in Table 3.
The end-use electricity consumption forecast per sector up to the year 2050 in GWh
| Year | Domestic and Government | Industrial | Commercial | Agriculture and water pumping | Street lighting | Total |
|---|---|---|---|---|---|---|
| 2023 | 8766.472 | 4421.561 | 3027.067 | 2932.784 | 432.117 | 19,580 |
| 2025 | 9237.032 | 4658.898 | 3189.551 | 3090.207 | 455.312 | 20,631 |
| 2030 | 10414.1 | 5252.58 | 3595.994 | 3483.991 | 513.332 | 23,260 |
| 2035 | 11591.17 | 5846.261 | 4002.438 | 3877.775 | 571.35 | 25,889 |
| 2040 | 12768.25 | 6439.94 | 4408.881 | 4271.559 | 629.373 | 28,518 |
| 2045 | 13945.32 | 7033.624 | 4815.324 | 4665.343 | 687.393 | 31,147 |
| 2050 | 15122.39 | 7627.305 | 5221.767 | 5059.127 | 745.413 | 33,776 |
The total end-use electricity consumption in GWh is referred to the generation bus by adding the amounts of losses in the distribution and transmission power grid, according to equation (7):
where
where
The end-use electricity consumption forecast per sector up to the year 2050 in GWh
| Year | Energy (GWh) | GR
|
Pek load (MW) | GR
|
|---|---|---|---|---|
| 2018(act) | 18,913 | 3,205 | ||
| 2019(act) | 19,273 | 1.90 | 3,380 | 5.46 |
| 2020(act) | 19,194 |
|
3,630 | 7.40 |
| 2021(act) | 19,719 | 2.73 | 3,770 | 3.86 |
| 2022(act) | 20,460 | 3.75 | 4,010 | 6.37 |
| 2023 | 21,080 | 3.03 | 4,092 | 2.04 |
| 2025 | 22,131 | 2.46 | 4,313 | 2.66 |
| 2030 | 24,760 | 2.27 | 4,963 | 2.85 |
| 2035 | 27,389 | 2.04 | 5,635 | 2.57 |
| 2040 | 30,018 | 1.85 | 6,270 | 2.16 |
| 2045 | 32,647 | 1.69 | 6,980 | 2.17 |
| 2050 | 35,276 | 1.56 | 7,642 | 1.83 |
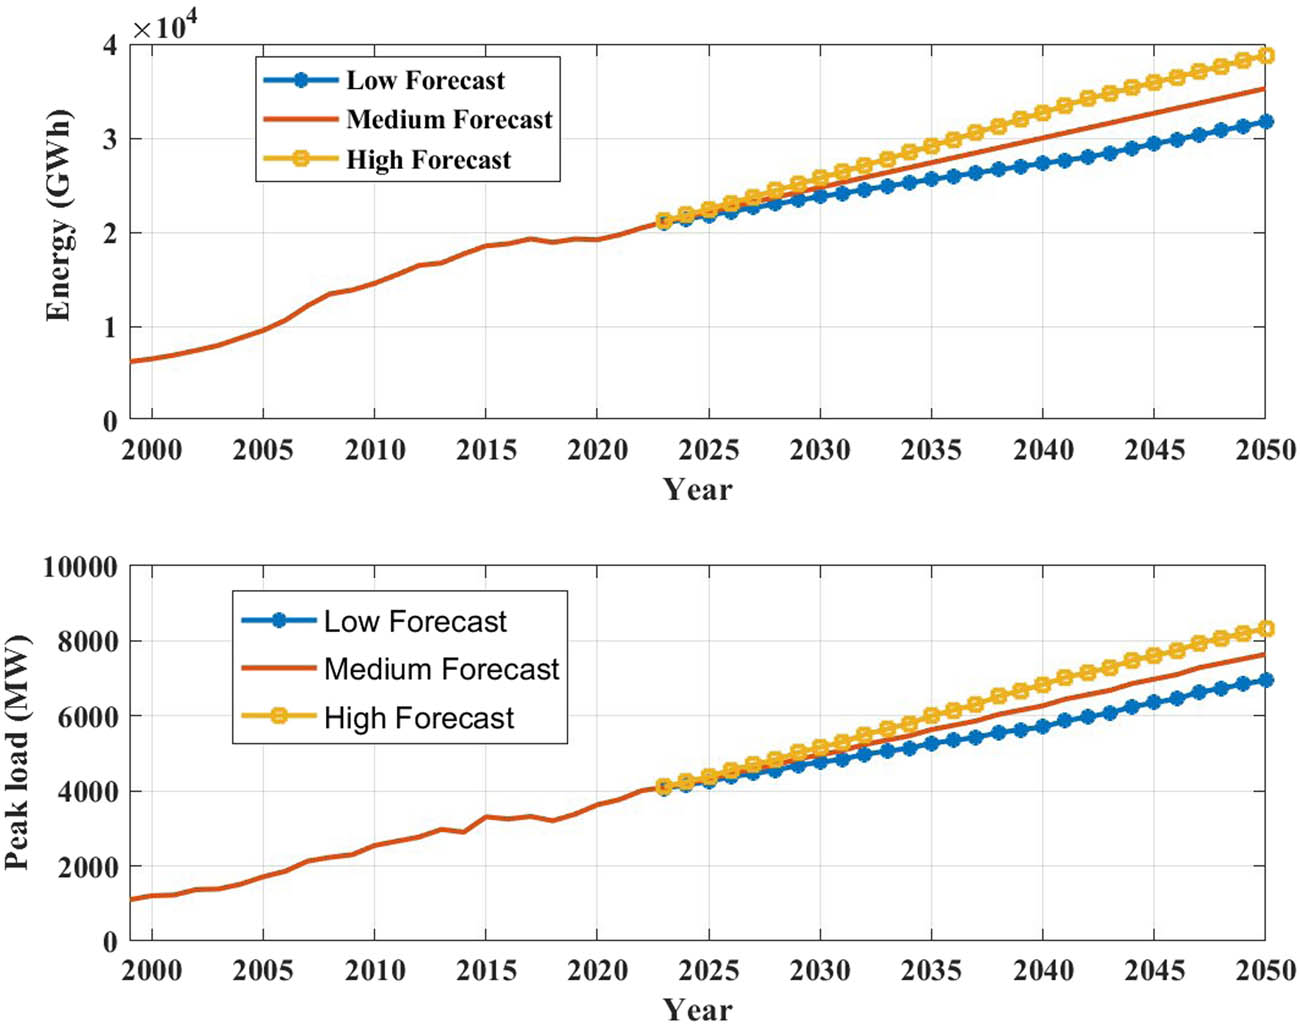
The forecasted energy and peak load at generation bus for the period 2023–2050 in three directions low, medium, and high forecast.
4 The DLC prediction technique and results
Based on the electricity demand forecast study (medium projection) summarized in Table 4 and Figure 5, respectively, the DLCs are predicted based on the following procedure:
Determine the hourly historical growth rate GR(t)% over a real period from 2007–2022 by equation (9):
(9)where GR(
Smooth the real
(10)where
Determine the forecasted hourly peak load
(11)where
(12)where
The
(13)For example, the value of
Forecast the annual energy in the f-year in GWh by summing the predicted hourly peak loads using equation (14)
(14)The values obtained in equations (11) and (14), should be slightly normalized to ensure that they are not exceeding the forecasted values of Table 3 (for instance, 35,276 GWh and 7,642 MW in the year 2050). Based on historical data for DLCs in Jordan, three possible scenarios for peak occurrence took place: the first scenario is that peak load is a daytime peak around 14:00 LT in summer as in the period 2000–2012, the second scenario is that both morning and evening peak loads are almost equal as in DLC’s of 1996, 1998, and 2003, respectively and finally the evening peak is higher than morning peak took place in winter around 17:00 as in the period 2013–2022. Based on these scenarios and the procedure mentioned in Section 5, equations (9)–(14) for the DLC prediction, Figures 6 and 7 show the DLC for the period 2023–2050.

The DLC with evening peak occurrence.

The DLC with morning peak occurrence.
5 Conclusion
This article presents the load development and variations in Jordan during the 1994–2022 period, emphasizing the peak load conversion from the evening to the morning period and justifying this conversion. It also introduces the determinants affecting the electricity demand methods in Jordan and the variability of these determinants during the last three decades in Jordan. The future DLC is an essential indicator in any country’s power system planning, reflecting the load variations connected with economic and demographic growth expectations. Thus, based on the growth rate statistical method, the article proposes a mathematical model for predicting the DLCs in Jordan in the period 2023–2050. The historical hourly peak loads in the period 1994–2020 and the annual forecasted peak loads during the morning and evening periods taken from the long-term load forecast (LTLF) study of NEPCO during 2022–2050 are employed in the prediction model. In the prediction technique, the actual hourly growth rates, the annual forecasted growth rates, and the hourly peak loads in the reference year 2022 are the main input variables used in the prediction formula (i.e., k(t),
The peak load in Jordan relies upon several climatic and nonclimatic variables, implying the ambient temperature, GDP, income, demographics, urbanization, electricity tariff, average oil prices, and other related factors related to technology and new aspects of energy saving and space heating/cooling systems, and the DLC in Jordan is variable and changing from year to year. The proposed model considers a variation in the future DLC and suggests three different scenarios of DLC’s prediction based on the time occurrence of the peak load: the first is the daytime peak occurrence scenario, the second is that the evening peak occurrence scenario, and finally is the daytime and evening peaks may be close to each other.
Acknowledgment
The authors would like to thank NEPCO for providing the hourly load data for the period of study.
-
Conflict of interest: Authors state no conflict of interest.
References
[1] Shuvra MA, Rahman MM, Ali A, Khan IS. Modeling and forecasting demand for electricity in Bangladesh: econometrics model. International Conference on Economics, Trade and Development. 2011. Vol. 7, p. 74.Search in Google Scholar
[2] Bonkaney AL. Influence of climate and nonclimate parameters on monthly electricity consumption in Niger. J Energy. 2020 Mar 1;2020:1–10.10.1155/2020/8460263Search in Google Scholar
[3] Liu X, Sun T, Feng Q, Zhang D. Dynamic nonlinear influence of urbanization on Chinaas electricity consumption: Evidence from dynamic economic growth threshold effect. Energy. 2020 Apr 1;196;117187.10.1016/j.energy.2020.117187Search in Google Scholar
[4] Al-Bajjali SK, Shamayleh AY. Estimating the determinants of electricity consumption in Jordan. Energy. 2018 Mar 15;147:1311–20.10.1016/j.energy.2018.01.010Search in Google Scholar
[5] Ubani O. Determinants of the dynamics of electricity consumption in N igeria. OPEC Energy Review. 2013 Jun;37(2):149–61.10.1111/opec.12004Search in Google Scholar
[6] Yu Y, Zhang N, Kim JD. Impact of urbanization on energy demand: an empirical study of the Yangtze River Economic Belt in China. Energy Policy. 2020 Apr 1;139:111354.10.1016/j.enpol.2020.111354Search in Google Scholar
[7] Shahbaz M, Sbia R, Hamdi H, Ozturk I. Economic growth, electricity consumption, urbanization and environmental degradation relationship in United Arab Emirates. Ecological Indicators. 2014 Oct 1;45:622–31.10.1016/j.ecolind.2014.05.022Search in Google Scholar
[8] Hong H, Zhang C. Bitcoin trading, economic growth, energy use, and CO2 emissions: An advanced panel study of emerging market economies. Int Rev Econ Finance. 2023;87:519–31.10.1016/j.iref.2023.06.003Search in Google Scholar
[9] Chen YT. The factors affecting electricity consumption and the consumption characteristics in the residential sector – a case example of Taiwan. Sustainability. 2017 Aug 21;9(8):1484.10.3390/su9081484Search in Google Scholar
[10] Sandri S, Hussein H, Alshyab N. Sustainability of the energy sector in Jordan: challenges and opportunities. Sustainability. 2020 Dec 14;12(24):10465.10.3390/su122410465Search in Google Scholar
[11] Momani MA. Factors affecting electricity demand in Jordan. Energy Power Eng. 2013;5(1):50–58. 10.4236/epe.2013.51007.Search in Google Scholar
[12] Momani MA, Alhmoud L. Statistical modeling of the determinants driving the electricity demand in Jordan. IEEE Open Access J Power Energy. 2023 Mar 9;10:294–303.10.1109/OAJPE.2023.3255100Search in Google Scholar
[13] Jaber JO, Mohsen MS, Probert SD, Alees M. Future electricity-demands and greenhouse-gas emissions in Jordan. Appl Energy. 2001 May 1;69(1):1–8.10.1016/S0306-2619(00)00068-4Search in Google Scholar
[14] Almuhtady A, Alshwawra A, Alfaouri M, Al-Kouz W, Al-Hinti I. Investigation of the trends of electricity demands in Jordan and its susceptibility to the ambient air temperature towards sustainable electricity generation. Energy Sustainability Soc. 2019 Dec;9(1):1–8.10.1186/s13705-019-0224-1Search in Google Scholar
[15] Yi-Ling H, Hai-Zhen M, Guang-Tao D, Jun S. Influences of urban temperature on the electricity consumption of Shanghai. Adv Climate Change Res. 2014 Jan 1;5(2):74–80.10.3724/SP.J.1248.2014.074Search in Google Scholar
[16] Cartalis C, Synodinou A, Proedrou M, Tsangrassoulis A, Santamouris M. Modifications in energy demand in urban areas as a result of climate changes: an assessment for the southeast Mediterranean region. Energy Conversion Management. 2001 Sep 1;42(14):1647–56.10.1016/S0196-8904(00)00156-4Search in Google Scholar
[17] Pardo A, Meneu V, Valor E. Temperature and seasonality influences on Spanish electricity load. Energy Econ. 2002 Jan 1;24(1):55–70.10.1016/S0140-9883(01)00082-2Search in Google Scholar
[18] Behmiri NB, Fezzi C, Ravazzolo F. Incorporating air temperature into mid-term electricity load forecasting models using time-series regressions and neural networks. Energy. 2023 Sep 1;278:127831.10.1016/j.energy.2023.127831Search in Google Scholar
[19] Yadav S, Tondwal B, Tomar A. Models of load forecasting. In Prediction Techniques for Renewable Energy Generation and Load Demand Forecasting. Singapore: Springer Nature Singapore; 2023 Jan 21. p. 111–30.10.1007/978-981-19-6490-9_7Search in Google Scholar
[20] Momani M, Alrousan W, Alqudah A. Short-term load forecasting based on NARX and radial basis neural networks approaches for the Jordanian power grid. Jordan J Electr Eng. 2016;2:81–93.Search in Google Scholar
[21] Alhmoud L, Nawafleh Q. Short-term load forecasting for Jordan’s power system using neural network based different. In2019 IEEE International Conference on Environment and Electrical Engineering and 2019 IEEE Industrial and Commercial Power Systems Europe (EEEIC/I & CPS Europe). IEEE; 2019 Jun 11. p. 1–6.10.1109/EEEIC.2019.8783979Search in Google Scholar
[22] Alhmoud L, Al-Zoubi AM, Aljarah I. Solar PV power forecasting at Yarmouk University using machine learning techniques. Open Eng. 2022 Dec 31;12(1):1078–88.10.1515/eng-2022-0386Search in Google Scholar
[23] Chapagain K, Kittipiyakul S. Performance analysis of short-term electricity demand with atmospheric variables. Energies. 2018 Apr 2;11(4):818.10.3390/en11040818Search in Google Scholar
[24] Grandjean A, Binet G, Bieret J, Adnot J, Duplessis B. A functional analysis of electrical load curve modelling for some households specific electricity end-uses. In 6th International Conference on Energy Efficiency in Domestic Appliances and Lighting (EEDAL’11). 2011 May 24. p. 24.Search in Google Scholar
[25] Cho H, Goude Y, Brossat X, Yao Q. Modeling and forecasting daily electricity load curves: a hybrid approach. J Amer Stat Assoc. 2013 Mar 1;108(501):7–21.10.1080/01621459.2012.722900Search in Google Scholar
[26] Shang C, Gao J, Liu H, Liu F. Short-term load forecasting based on PSO-KFCM daily load curve clustering and CNN-LSTM model. IEEE Access. 2021 Mar 18;9:50344–57.10.1109/ACCESS.2021.3067043Search in Google Scholar
[27] Caro E, Juan J. Short-term load forecasting for Spanish insular electric systems. Energies. 2020 Jul 15;13(14):3645.10.3390/en13143645Search in Google Scholar
[28] Alfares HK, Nazeeruddin M. Electric load forecasting: literature survey and classification of methods. Int J Syst Sci. 2002 Jan 1;33(1):23–34.10.1080/00207720110067421Search in Google Scholar
[29] NEPCO, Load data 1995–2022, private communication, 2022.Search in Google Scholar
[30] Aneiros G, Vilar J, Raña P. Short-term forecast of daily curves of electricity demand and price. Int J Electr Power Energy Syst. 2016 Sep 1;80:96–108.10.1016/j.ijepes.2016.01.034Search in Google Scholar
[31] Darwazeh D, Duquette J, Gunay B, Wilton I, Shillinglaw S. Review of peak load management strategies in commercial buildings. Sustainable Cities Society. 2022 Feb 1;77:103493.10.1016/j.scs.2021.103493Search in Google Scholar
[32] Energy and Minerals Regulatory Commission, (online), www.emrc.gov.jo.Search in Google Scholar
[33] Eissa MM. Demand side management program evaluation based on industrial and commercial field data. Energy Policy. 2011 Oct 1;39(10):5961–9.10.1016/j.enpol.2011.06.057Search in Google Scholar
[34] National Electical Power Company (NEPCO), Annual report. 2021.Search in Google Scholar
[35] National Electical Power Company (NEPCO), Load forecast study, Annual report. 2020.Search in Google Scholar
[36] Tjørve KM, Tjørve E. The use of Gompertz models in growth analyses, and new Gompertz-model approach: an addition to the Unified-Richards family. PloS One. 2017 Jun 5;12(6):e0178691.10.1371/journal.pone.0178691Search in Google Scholar PubMed PubMed Central
[37] Franses PH. A method to select between Gompertz and logistic trend curves. Tech Forecast Social Change. 1994 May 1;46(1):45–9.10.1016/0040-1625(94)90016-7Search in Google Scholar
© 2023 the author(s), published by De Gruyter
This work is licensed under the Creative Commons Attribution 4.0 International License.
Articles in the same Issue
- Regular Articles
- Design optimization of a 4-bar exoskeleton with natural trajectories using unique gait-based synthesis approach
- Technical review of supervised machine learning studies and potential implementation to identify herbal plant dataset
- Effect of ECAP die angle and route type on the experimental evolution, crystallographic texture, and mechanical properties of pure magnesium
- Design and characteristics of two-dimensional piezoelectric nanogenerators
- Hybrid and cognitive digital twins for the process industry
- Discharge predicted in compound channels using adaptive neuro-fuzzy inference system (ANFIS)
- Human factors in aviation: Fatigue management in ramp workers
- LLDPE matrix with LDPE and UV stabilizer additive to evaluate the interface adhesion impact on the thermal and mechanical degradation
- Dislocated time sequences – deep neural network for broken bearing diagnosis
- Estimation method of corrosion current density of RC elements
- A computational iterative design method for bend-twist deformation in composite ship propeller blades for thrusters
- Compressive forces influence on the vibrations of double beams
- Research on dynamical properties of a three-wheeled electric vehicle from the point of view of driving safety
- Risk management based on the best value approach and its application in conditions of the Czech Republic
- Effect of openings on simply supported reinforced concrete skew slabs using finite element method
- Experimental and simulation study on a rooftop vertical-axis wind turbine
- Rehabilitation of overload-damaged reinforced concrete columns using ultra-high-performance fiber-reinforced concrete
- Performance of a horizontal well in a bounded anisotropic reservoir: Part II: Performance analysis of well length and reservoir geometry
- Effect of chloride concentration on the corrosion resistance of pure Zn metal in a 0.0626 M H2SO4 solution
- Numerical and experimental analysis of the heat transfer process in a railway disc brake tested on a dynamometer stand
- Design parameters and mechanical efficiency of jet wind turbine under high wind speed conditions
- Architectural modeling of data warehouse and analytic business intelligence for Bedstead manufacturers
- Influence of nano chromium addition on the corrosion and erosion–corrosion behavior of cupronickel 70/30 alloy in seawater
- Evaluating hydraulic parameters in clays based on in situ tests
- Optimization of railway entry and exit transition curves
- Daily load curve prediction for Jordan based on statistical techniques
- Review Articles
- A review of rutting in asphalt concrete pavement
- Powered education based on Metaverse: Pre- and post-COVID comprehensive review
- A review of safety test methods for new car assessment program in Southeast Asian countries
- Communication
- StarCrete: A starch-based biocomposite for off-world construction
- Special Issue: Transport 2022 - Part I
- Analysis and assessment of the human factor as a cause of occurrence of selected railway accidents and incidents
- Testing the way of driving a vehicle in real road conditions
- Research of dynamic phenomena in a model engine stand
- Testing the relationship between the technical condition of motorcycle shock absorbers determined on the diagnostic line and their characteristics
- Retrospective analysis of the data concerning inspections of vehicles with adaptive devices
- Analysis of the operating parameters of electric, hybrid, and conventional vehicles on different types of roads
- Special Issue: 49th KKBN - Part II
- Influence of a thin dielectric layer on resonance frequencies of square SRR metasurface operating in THz band
- Influence of the presence of a nitrided layer on changes in the ultrasonic wave parameters
- Special Issue: ICRTEEC - 2021 - Part III
- Reverse droop control strategy with virtual resistance for low-voltage microgrid with multiple distributed generation sources
- Special Issue: AESMT-2 - Part II
- Waste ceramic as partial replacement for sand in integral waterproof concrete: The durability against sulfate attack of certain properties
- Assessment of Manning coefficient for Dujila Canal, Wasit/-Iraq
- Special Issue: AESMT-3 - Part I
- Modulation and performance of synchronous demodulation for speech signal detection and dialect intelligibility
- Seismic evaluation cylindrical concrete shells
- Investigating the role of different stabilizers of PVCs by using a torque rheometer
- Investigation of high-turbidity tap water problem in Najaf governorate/middle of Iraq
- Experimental and numerical evaluation of tire rubber powder effectiveness for reducing seepage rate in earth dams
- Enhancement of air conditioning system using direct evaporative cooling: Experimental and theoretical investigation
- Assessment for behavior of axially loaded reinforced concrete columns strengthened by different patterns of steel-framed jacket
- Novel graph for an appropriate cross section and length for cantilever RC beams
- Discharge coefficient and energy dissipation on stepped weir
- Numerical study of the fluid flow and heat transfer in a finned heat sink using Ansys Icepak
- Integration of numerical models to simulate 2D hydrodynamic/water quality model of contaminant concentration in Shatt Al-Arab River with WRDB calibration tools
- Study of the behavior of reactive powder concrete RC deep beams by strengthening shear using near-surface mounted CFRP bars
- The nonlinear analysis of reactive powder concrete effectiveness in shear for reinforced concrete deep beams
- Activated carbon from sugarcane as an efficient adsorbent for phenol from petroleum refinery wastewater: Equilibrium, kinetic, and thermodynamic study
- Structural behavior of concrete filled double-skin PVC tubular columns confined by plain PVC sockets
- Probabilistic derivation of droplet velocity using quadrature method of moments
- A study of characteristics of man-made lightweight aggregate and lightweight concrete made from expanded polystyrene (eps) and cement mortar
- Effect of waste materials on soil properties
- Experimental investigation of electrode wear assessment in the EDM process using image processing technique
- Punching shear of reinforced concrete slabs bonded with reactive powder after exposure to fire
- Deep learning model for intrusion detection system utilizing convolution neural network
- Improvement of CBR of gypsum subgrade soil by cement kiln dust and granulated blast-furnace slag
- Investigation of effect lengths and angles of the control devices below the hydraulic structure
- Finite element analysis for built-up steel beam with extended plate connected by bolts
- Finite element analysis and retrofit of the existing reinforced concrete columns in Iraqi schools by using CFRP as confining technique
- Performing laboratory study of the behavior of reactive powder concrete on the shear of RC deep beams by the drilling core test
- Special Issue: AESMT-4 - Part I
- Depletion zones of groundwater resources in the Southwest Desert of Iraq
- A case study of T-beams with hybrid section shear characteristics of reactive powder concrete
- Feasibility studies and their effects on the success or failure of investment projects. “Najaf governorate as a model”
- Optimizing and coordinating the location of raw material suitable for cement manufacturing in Wasit Governorate, Iraq
- Effect of the 40-PPI copper foam layer height on the solar cooker performance
- Identification and investigation of corrosion behavior of electroless composite coating on steel substrate
- Improvement in the California bearing ratio of subbase soil by recycled asphalt pavement and cement
- Some properties of thermal insulating cement mortar using Ponza aggregate
- Assessment of the impacts of land use/land cover change on water resources in the Diyala River, Iraq
- Effect of varied waste concrete ratios on the mechanical properties of polymer concrete
- Effect of adverse slope on performance of USBR II stilling basin
- Shear capacity of reinforced concrete beams with recycled steel fibers
- Extracting oil from oil shale using internal distillation (in situ retorting)
- Influence of recycling waste hardened mortar and ceramic rubbish on the properties of flowable fill material
- Rehabilitation of reinforced concrete deep beams by near-surface-mounted steel reinforcement
- Impact of waste materials (glass powder and silica fume) on features of high-strength concrete
- Studying pandemic effects and mitigation measures on management of construction projects: Najaf City as a case study
- Design and implementation of a frequency reconfigurable antenna using PIN switch for sub-6 GHz applications
- Average monthly recharge, surface runoff, and actual evapotranspiration estimation using WetSpass-M model in Low Folded Zone, Iraq
- Simple function to find base pressure under triangular and trapezoidal footing with two eccentric loads
- Assessment of ALINEA method performance at different loop detector locations using field data and micro-simulation modeling via AIMSUN
- Special Issue: AESMT-5 - Part I
- Experimental and theoretical investigation of the structural behavior of reinforced glulam wooden members by NSM steel bars and shear reinforcement CFRP sheet
- Improving the fatigue life of composite by using multiwall carbon nanotubes
- A comparative study to solve fractional initial value problems in discrete domain
- Assessing strength properties of stabilized soils using dynamic cone penetrometer test
- Investigating traffic characteristics for merging sections in Iraq
- Enhancement of flexural behavior of hybrid flat slab by using SIFCON
- The main impacts of a managed aquifer recharge using AHP-weighted overlay analysis based on GIS in the eastern Wasit province, Iraq