The effect of multi-stage modification on the performance of Savonius water turbines under the horizontal axis condition
-
Dandun Mahesa Prabowoputra
 ,
Jung Min Sohn
,
Jung Min Sohn

Abstract
Indonesia has the abundant potential of hydropower but not yet processed optimally, which intensely depends on fossil fuel. Hydropower installed in Indonesia is only 11,272 MW, from the estimated potential approximately 94,476 MW. This data shows that 89% of the hydropower potential in Indonesia has not been processed. One of the present efforts to utilize this resource is addressed to develop the Savonius water turbine. Conventional water Savonius turbines have a comprehensible structure and easy to be applied. However, the turbines produce relatively small power, which requires further assessment to improve its performance. The current study is performed by considering geometric changes on the water Savonius turbine to observe their effect on power characteristics. Considered changes are made on the number of stages, and the angle between stages, specifically a single-stage, two-stage 0°, Two-stage 90°, three-stage 0°, and three Stage 120°. The research was carried out by designing simulation model using ANSYS software with CFX Solver. Water speed is determined to 0.8 m/s, while plates with 110 mm in diameter and 110 mm in height are incorporated as rotor configuration. Based on this study, it can be concluded that the addition of the stage affected improving the performance of the Savonius water turbine, where the multi-stage turbine experienced an increment compared to conventional water turbines. The interesting tendency was found on the two-stage rotors with angle of 0° which produced a smaller Cpmax compared to the conventional water Savonius turbines.
1 Introduction
An average increase in electrical energy consumption by 4.7% and production by 11.8% in the last three years in Indonesia. Electricity consumption is dominated by the household, business, and industrial sectors. The National Power Plant is supplied by 61% of coal power plants [1]. However, the energy source has decreased every year. Another energy source that has great potential in Indonesia is Hydropower. Hydro energy and micro-mini hydro have a potential of 76% compared to other energy sources [2]. The development of a water turbine is one of the efforts to process water energy into electricity. Research on hydro turbines has been carried out such as screw-type at small hydropower plants [3]. In general, turbines are divided into horizontal axis and the vertical axis in this study using a horizontal axis Savonius type turbine. In the 1920s, Savonius published the results of carried out tests on his rotor design. They are operating in both wind and water. In the case of water, the test was carried out in the river flow, tidal waters and sea waves [4].
Research has been conducted on Savonius type turbines, especially on the vertical axis and wind turbines. Research on the effect of the overlap ratio has been carried out on vertical wind turbines. The study was conducted in an overlap ratio of 0 to 0.3. The results of the study show that the overlap ratio of 0 produces the highest Cpmax [5]. In another study regarding the overlap ratio that has been carried out on horizontal axis water turbines, it shows that Cpmax is obtained in 0.3 overlaps. The Cpmax produced in the study was 0.19 at TSR 0.79 [6]. Other research is about performance with the addition deflector variation. From this study it was found that the addition of the deflector increased the coefficient of power (Cp) by 50% [7]. The change of shape of blade becomes a helix shape, and the addition of deflector has been tested to the water Savonius turbine on the vertical axis. The study resulted in an increase in Cpmax from 0.125 to 0.14 [8]. Research on Savonius wind turbines with number of blades 2 and 3 was carried out and resulted that the Savonius wind turbines with two blades produced higher Cpmax compared to wind turbines with three blades [9]. In general, research on Savonius turbine development is about modifying the number of blades and Shape of blade which is carried out either in simulation or experiment [10]. Collaboration of the mentioned methods is very effective as results of experimental works can be expanded by numerical approach, and vice versa, which this research stage is taken as benchmarking in computational fluid dynamic [11, 12, 13, 14, 15] and finite element method [16, 17, 18, 19, 20].
This research was carried out using a Savonius type turbine on the horizontal axis. Since Savonius has a simple structure that is easy to modify and can operate at low speeds, Savonius has a lower efficiency than other types, so research still needs to be done to improve its performance [21]. This study aims to determine the effect of the number of stage on the performance of Savonius water turbines with cconsidered changes on the number of stages, precisely a single-stage, two-stage 0°, two-stage 90°, three-stage 0°, and three stage 120°.
2 Data Reduction and Model Geometry
Turbine performance always uses the relationship between the coefficient of power and the Tip Speed Ratio function. So the results of the research that has been carried out through simulation, then processed using equations to calculate the performance parameters, where TSR, Cp, and Ct is a non-dimensional number that appropriately used as a design parameter. Mathematical expressions for these terminologies are presented in Equations 1-3.
TSR (Tip Speed Ratio)
Coefficient Power (Cp)
Coefficient Torque (Ct)
where U is the free flow velocity, ρ is the water density, A is the Area of the Rotor, T is the torque, ω is the angular velocity, Ct is Coefficient torque and Cp is the Power coefficient [22].
This study was carried out using the Savonius rotor on the horizontal axis. The research has been done with variation single-stage, two-stage 0°, two-stage 90°, three-stage 0°, and three Stage 120°. The dimensions for each rotor are shown in Table 1. The number of rotors tested is five rotors. Description dimension on the geometry of the rotor shown in Figures 1 and 2. Figure 2 shows the top projection of single-stage rotors, two-stage 0°, and three-stage 0°. Research conducted using the aspect ratio (D /H) of 1 and the overlap ratio of 0. Table 1 shows that D is the endplate diameter, d is the rotor diameter, H is the rotor height, h is the stage height of the rotor, and T is the thickness.
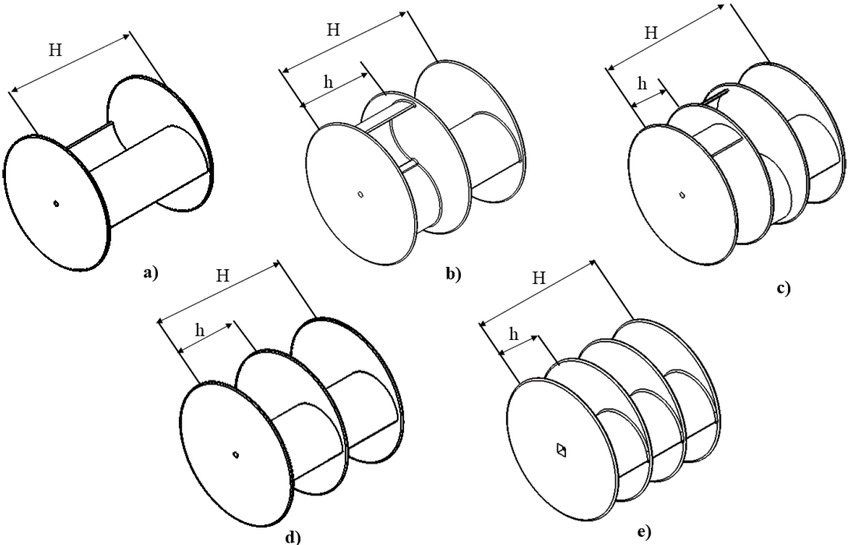
The geometry of a) Single-stage, b) two-stage 90°, c) three-stage 120°, d) two-stage 0°, and e) three-stage 0°.
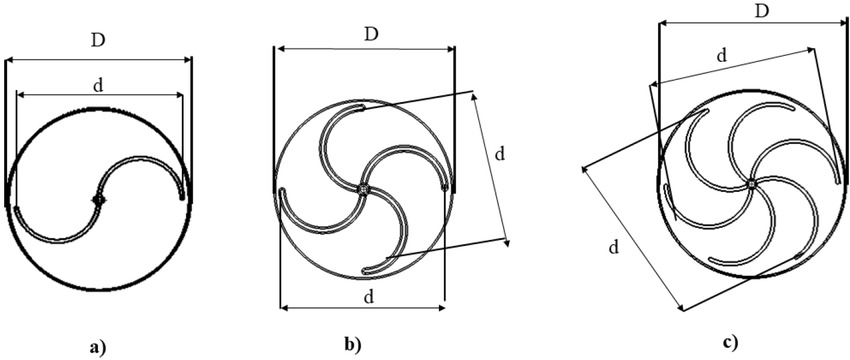
Top projection of a) Single-stage, two-stage 00, and three-stage 00 b) two-stage 900, and c) three-stage 1200.
The dimension of the rotor.
| Parameter | Rotor Type | ||||
|---|---|---|---|---|---|
| Single Stage | Two-Stage 90° | Two-Stage 0° | Three Stage 120° | Three Stage 0° | |
| D (mm) | 110 | 110 | 110 | 110 | 110 |
| d (mm) | 100 | 100 | 100 | 100 | 100 |
| H (mm) | 110 | 110 | 110 | 110 | 110 |
| h (mm) | - | 52 | 52 | 34 | 34 |
| T (mm) | 2 | 2 | 2 | 2 | 2 |
3 Methodology
The research was carried out in 3D simulation using Ansys software with cfx solver. The research was conducted with the pre-research and research stages. Performed on prestudy phase is to make 3D design, validate, mesh independence study. The second stage determines boundary conditions, meshing, and running simulations. Validation was carried out on Roy et al. [23]. Validation was carried out at the position of TSR 0.74 where Cpmax was reached. Cp at 0.65 TSR obtained from the simulation was 0.252, wherein the mentioned study, it was 0.252. The data shows a 2.35% error rate. Benchmark has shown in Figure 3.
![Figure 3 Graph of benchmarking simulation with Roy’s experiment [23].](/document/doi/10.1515/eng-2020-0085/asset/graphic/j_eng-2020-0085_fig_003.jpg)
Graph of benchmarking simulation with Roy’s experiment [23].
Mesh independence study needs to be done in simulation research. By conducting mesh independence of our research can obtain a number of elements that are effective in the simulation process. Mesh independence study is done by adding cells [24]. Data from the mesh independence study process are shown in Figure 4 which the graph shows the relationship between the numbers of elements with a torque value. The graph shows that the most effective mesh has meshed with the number of elements 1,883,498. The number of elements in the mesh was chosen because there is no significant change in the torque value when the number of elements adds more.
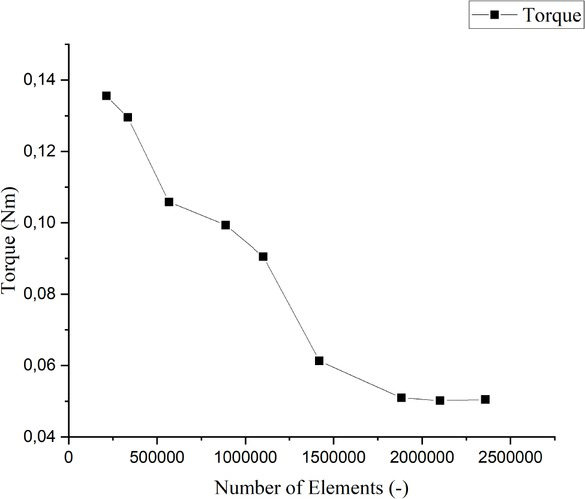
Graph the relationship between the number of elements and torque.
4 Numerical Model
Simulations are carried out using mesh with the tetrahedral method and using inflation on the rotor wall. The results of the mesh are shown in Figures 5 and 6. The figure shows the mesh method used and mesh size. Meshing for rotary domains and domain stationaries is done separately. Figure 5 shows the mesh on the rotary domain, and Figure 6 shows the mesh on the stationary domain. In this study, CFX software has been used for computing. Using this software, all rotor designs have been analyzed.Numerical research is possibly done using numerical methods of one dimensional [25] or three-dimensional [26]. Equation of momentum, turbulent kinetic energy has been solved numerically using the software, where the governing equation is shown in Equations 4-7.
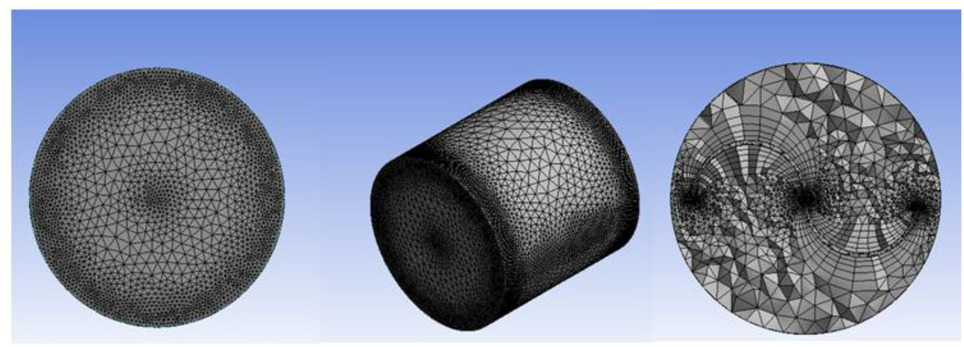
Mesh on a rotary domain.
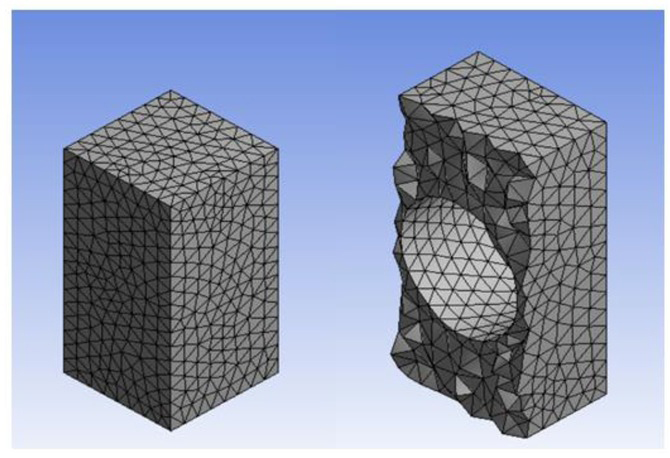
Mesh at the stationary domain.
Continuity Equation:
X-Momentum:
Y-Momentum:
Z-Momentum:
where ρ is the density, t is the time, u, v, and w are the velocities in three coordinates of Cartesian, and x, y, and z are the Cartesian coordinates.
The simulation domain consists of two domains, namely the stationary domain and the rotary domain [27]. A rotary domain is a rotating domain, and this domain consists of parts of the wall rotor, front interface, interface, and rear interface. The rotary domain is shown in Figure 7a The Stationery domain is non-rotating. This domain consists of six parts. These parts are the front interface, interface, rear interface, inlet, wall, and outlet. The stationary domain is shown in Figure 6b The rotary domain and stationary domain are connected by the interface section. The overall schematic simulation is shown in Figure 8. An inflation with a 1.2 growth rate and level of 5 was using. the small thickness of the cells in the boundary layer of the blades from the first small layer aim to smooth transition using the y ≤ 1 value highly recommended for turbulent models [28].

Domain of Simulation.
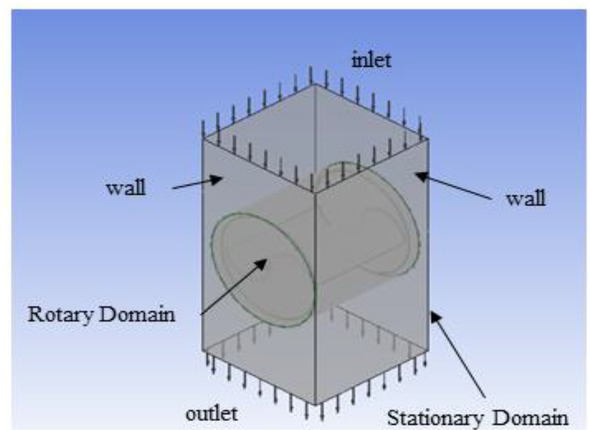
Schematic of CFD simulation.
Simulation is done using water fluid. The incoming inlet flow is subsonic flow using the K-Epsilon turbulence type. The type of analysis used is the transient blade row. The inlet velocity of 0.8 m/s and the simulation is carried out at the TSR interval 0.4–1. The boundary conditions on the wall use the no-slip condition. Water flow in subsonic condition. This research is using Turbulence Model K-epsilon. For other boundary conditions shown in Table 2.
Boundary condition of simulations
| No | Parameter | Value |
|---|---|---|
| 1. | Fluid type | Water |
| 2. | Density (kg/m3) | 1,000 |
| 5. | Water velocity (m/s) | 0.8 |
| 6. | Outlet pressure (atm) | 1 |
| 8 | Gravity (m/s2) | 9.81 |
5 Results and Discussion
The performance of the Savonius hydrokinetic turbine having the variable number of stages on rotor has been investigated numerically in velocity of 0.8 m/s at TSR interval 0.4–1. From the simulation process, the pressure contours and velocity contours of each design are obtained. Also, the torque value is obtained so that Cp can be obtained from each design. Simulation has convergence at residual target 10−4. Coefficient power (Cp) and coefficient torque (Ct) generated by the Single Stage Rotor at TSR intervals of 0.3–0.9 are shown on the graph Figure 9. Cp continues to increase at TSR < 0.6 and decrease at TSR > 0.6. The resulting Cpmax is 0.1 at TSR 0.7. Ctmax is obtained at 0.2 at TSR 0.3. Where Cpmax and Ctmax are not on the same TSR.
Graph of correlation a) Cp with TSR and b) Ct with TSR on Rotor Single-Stage.
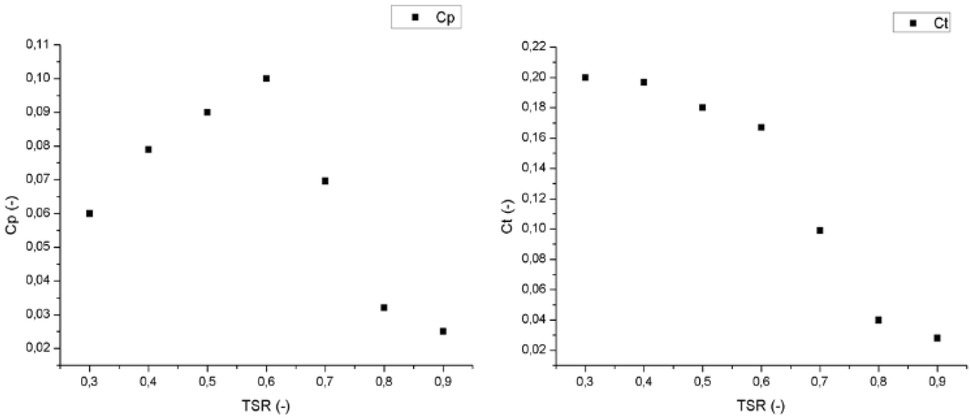
Figure 10 shows the Cp and Ct generated by the two-stage Rotor 90°. Cp increases at TSR <0.7 then decreases at TSR > 0.7. The resulting Cpmax is 0.18 at TSR 0.8. Ct increases at TSR <0.5 Ct values increase, whereas at TSR > 0.5 Ct values decrease. Ctmax is obtained at 0.29 on TSR 0.5. The Cp and Ct produced by the two-stage 0° rotors are shown in Figure 11. The graph shows that the Cpmax is 0.058 at TSR 0.4. Ctmax was reached at 0.158 at TSR 0.3. For this rotor, the same as the previous rotor, where Cpmax and Ctmax are not on the same TSR.
Graph of correlation a) Cp with TSR and b) Ct with TSR on Rotor Two-Stage 90°.
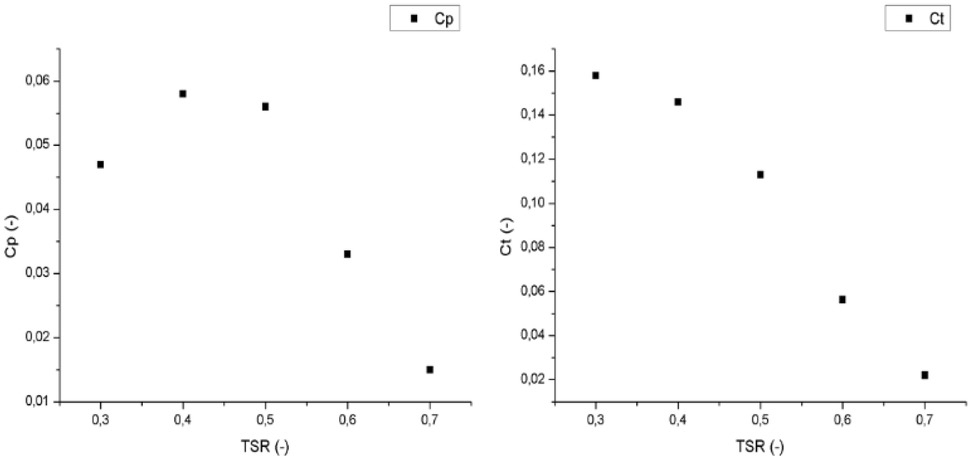
Graph of correlation a) Cp with TSR and b) Ct with TSR on Rotor Two-Stage 0°.
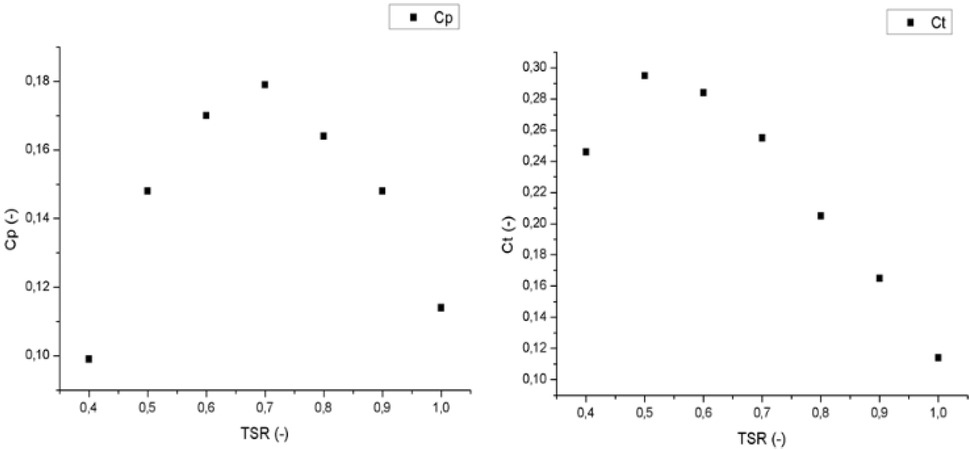
Cp and Ct generated by the Rotor three Stage 120° stage at TSR intervals of 0.4-1.1 are shown in Figure 12. Cp continues to increase at TSR < 0.9 and decrease at TSR > 0.9. The resulting Cpmax was 0.197 at TSR 0.9. Ctmax was obtained at 0.249 at TSR 0.7. Where Cpmax and Ctmax are not on the same TSR.

Graph of correlation a) Cp with TSR and b) Ct with TSR on Rotor Three Stage 120°.
Figure 13 shows the Cp and Ct produced by Rotor three-stage 0°. Cp increases at TSR < 0.4 then decreases at TSR > 0.4. The resulting Cpmax was 0.048 at TSR 0.4. Ct increases at TSR < 0.4 Ct values increase, whereas at TSR > 0.4 Ct values decrease. Ctmax is obtained at 0.12 at TSR 0.4. Where TSR for Cpmax is the same as TSR for Ctmax.
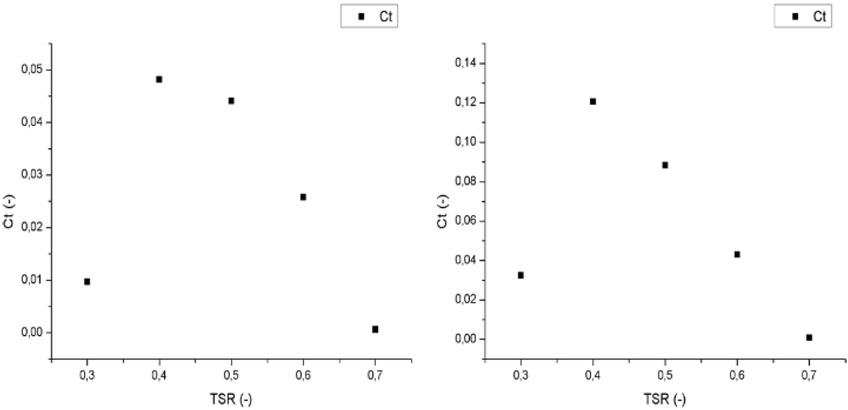
Graph of correlation a) Cp with TSR and b) Ct with TSR on Rotor Three Stage 0°.
Besides producing Cp and Ct values, this simulation produces output in the form of pressure contours, velocity contours, and streamlines. The pressure contours for each type of rotor are shown in Figure 14. The velocity contour is shown in Figure 15, and the velocity vector is shown in Figure 16. By studying pressure contours around models with different numbers of stage (Figures 14 and 15), there is a slight difference in pressure distribution in the blade with the same position. Where pressure is seen around the upper blade, more rotors with more stages have greater pressure. This is due to the area of the blade in multistage rotors smaller than the single-stage rotors. Figure 16 shows the vector of velocity streamlines at single-stage, two-stage, and three-stage.
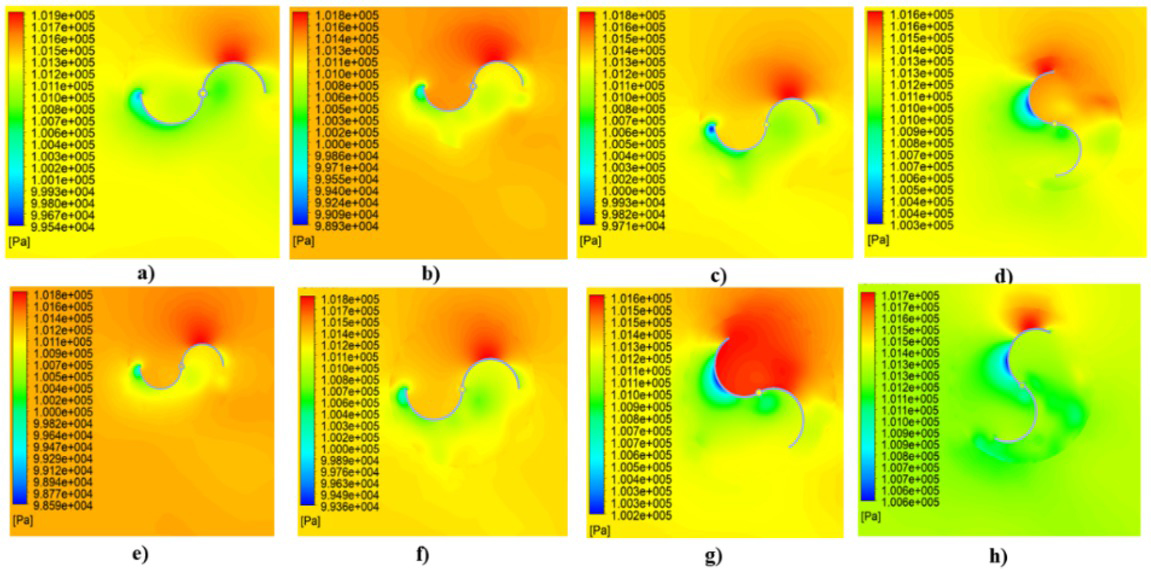
Distribution of pressure on a) Rotor Single Stage, b)Rotor Two-Stage 0°, c) First Stage Rotor Two-Stage 90°, d) Second Stage Rotor Two-Stage 90°, e) Rotor Three Stage 0°, f) First Stage Rotor Three Stage 120°, g) Second Stage Rotor Three Stage 120°, and h) Third Stage Rotor Three Stage 120°.
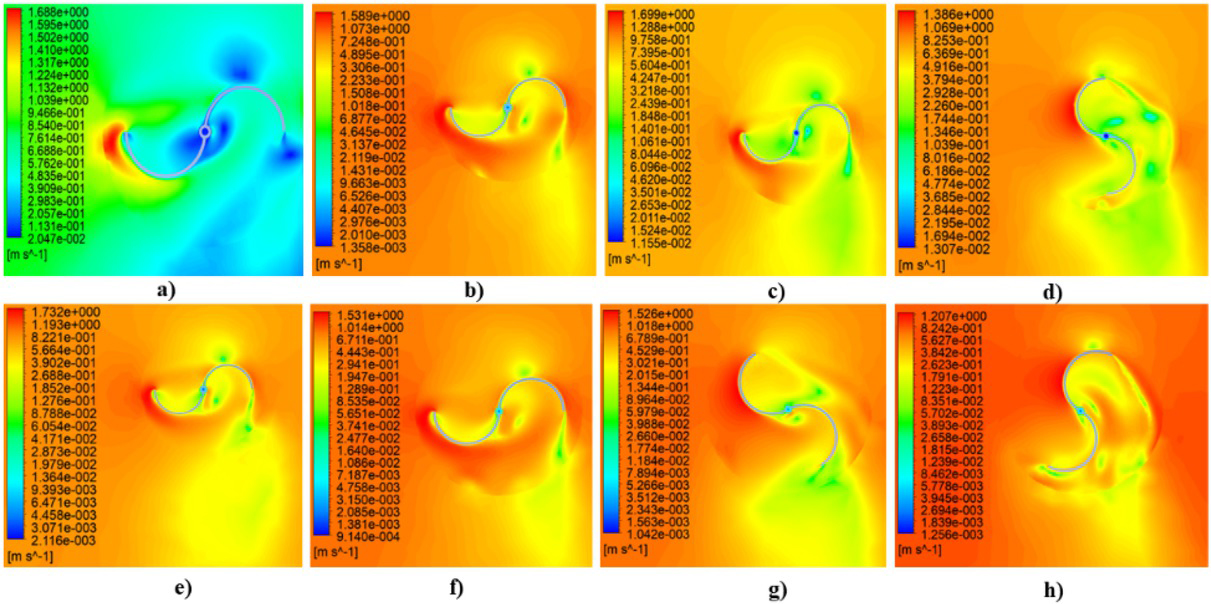
Distribution of velocity on a) Rotor Single Stage, b)Rotor Two-Stage 0°, c) First Stage Rotor Two-Stage 90°, d) Second Stage Rotor Two-Stage 90°, e) Rotor Three Stage 0°, f) First Stage Rotor Three Stage 120°, g) Second Stage Rotor Three Stage 120°, and h) Third Stage Rotor Three Stage 120°.
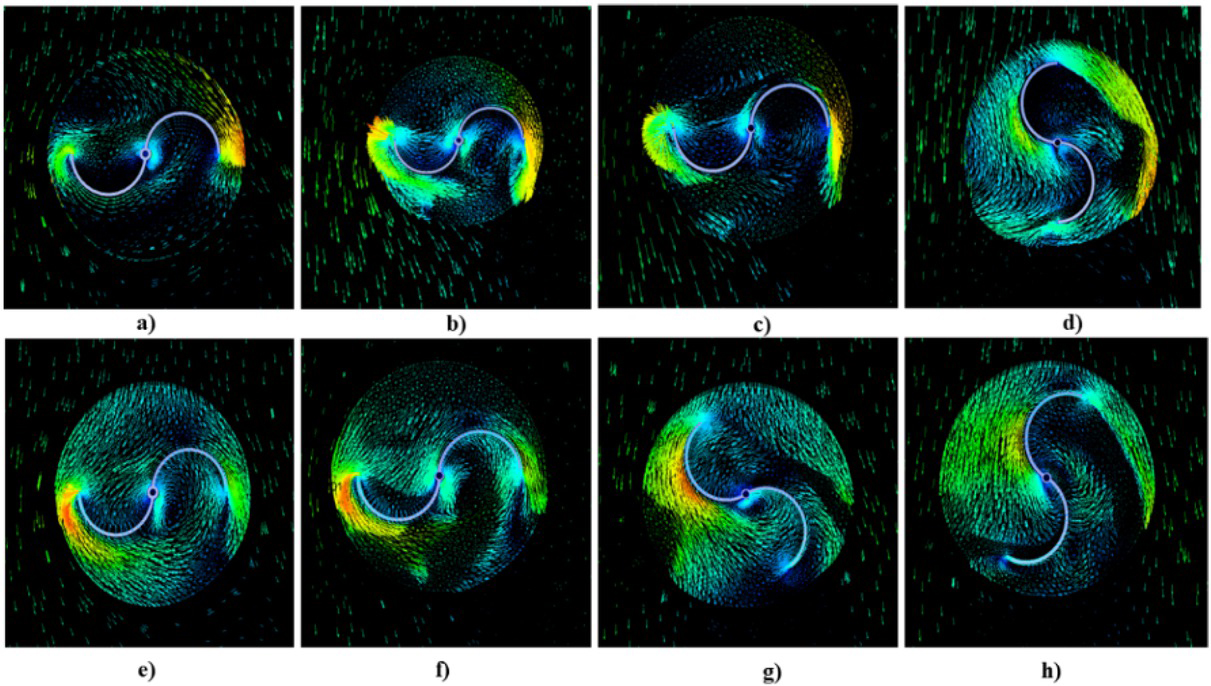
Vector of velocity on a) Rotor Single Stage, b)Rotor Two-Stage 0°, c) First Stage Rotor Two-Stage 90°, d) Second Stage Rotor Two-Stage 90°, e) Rotor Three Stage 0°, f) First Stage Rotor Three Stage 120°,g) Second Stage Rotor Three Stage 120°, and h) Third Stage Rotor Three Stage 120°.
6 Conclusions
The simulation of three different types of Savonius rotors has been carried out by involving single-stage and two-stage. The results of this study conclude that the modification of the Rotor three-stage 120° has the highest coefficient of power maximum (Cpmax) value compared to another Rotor. The Cpmax Rotor three-stage 120° is reached at 0.197, Rotor two-stage 90° is reached at 0.178, and the single-stage Cpmax is reached at 0.1. On two-stage and three-stage 0° rotors, Cpmax is lower than a single-stage, two-stage 0° is reached at 0.058 and Three-stage 0° at 0.048. Therefore, the three-stage 120° rotor is proofed as an alternative design which can improve the performance of water turbine Savonius, especially utilize water resources to produce renewable energy. From this simulation research we get a picture of the velocity and pressure distribution that can be used as a reference for experimental studies and the development of the next rotor design.
Specifications
- A
swept area of the rotor
- Ct
torque coefficient
- Cp
power coefficient
- Cpmax
power coefficient maximum
- T
torque
- TSR
tip speed ratio
- ω
angular velocity
- U
velocity
- ρ
water density
- x, y, z
Cartesian coordinates
Geometrical parameters of the prototype
- D
endplate diameter
- d
rotor diameter
- H
rotor height
- h
height of rotor stage
- t
rotor thickness
References
[1] IESR. Indonesia Clean Energy Outlook Imprint Indonesia Clean Energy Outlook. 2018.Search in Google Scholar
[2] Yudiartono., Anindhita., Rahardjo, I., Fitriana, I., Outlook Energi Indonesia 2018: Sustainable Energy for Land Transportation 2018.Search in Google Scholar
[3] Caban J, Gardyński L. Evacuation Systems of screw-type water turbines in small hydropower plant [https://doi.org/10.5604/20804075.1062334]. Adv Sci Technol. 2013;7(19):20–6.10.5604/20804075.1062334Search in Google Scholar
[4] Abulnaga, B., Water Power Without Waterfalls. 1988.Search in Google Scholar
[5] Kacprzak K, Sobczak K. Computational assessment of the influence of the overlap ratio on the power characteristics of a Classical Savonius wind turbine [https://doi.org/10.1515/eng-2015-0039]. Open Eng. 2015;5(1):314–22.10.1515/eng-2015-0039Search in Google Scholar
[6] Hadi S, Khuluqi H, Prabowoputra DM, Prasetyo A, Tjahjana DD, Farkhan A. Performance of Savonius horizontal axis water turbine in free flow vertical pipe as effect of blade overlap. Journal of Advance Research on Fluid Mechanics and Termal Sciences. 2019;58:219–23.Search in Google Scholar
[7] Golecha K, Eldho TI, Prabhu SV. Influence of the deflector plate on the performance of modified Savonius water turbine [https://doi.org/10.1016/j.apenergy.2011.03.025]. Appl Energy. 2011;88(9):3207–17.10.1016/j.apenergy.2011.03.025Search in Google Scholar
[8] Mosbahi M, Ayadi A, Chouaibi Y, Driss Z, Tucciarelli T. Performance study of a Helical Savonius hydrokinetic turbine with a new deflector system design [https://doi.org/10.1016/j. enconman.2019.04.080]. Energy Convers Manage. 2019;194:55–74.10.1016/j.enconman.2019.04.080Search in Google Scholar
[9] Ahmed WU, Zahed JH. Numerical study of two and three bladed savonius wind turbine. 2nd International Conference on Green Energy and Technology, November 2014, Dhaka, Bangladesh. https://doi.org/10.1109/ICGET.2014.6966657.https://doi.org/10.1109/ICGET.2014.6966657Search in Google Scholar
[10] Talukdara PK, Sardarb A, Kulkarnia V, Sahaa UK. Parametric analysis of model Savonius hydrokinetic turbines through experimental and computational investigations [https://doi.org/10.1016/j.enconman.2017.12.011]. Energy Convers Manage. 2018;158:36–49.10.1016/j.enconman.2017.12.011Search in Google Scholar
[11] Sayed M, Lutz T, Krämer E, Shayegan S, Wüchner R. Lutz, T., Krämer, E., Shayegan, S., Wüchner, R., Aeroelastic analysis of 10 MW wind turbine using CFD–CSD explicit FSI-coupling approach [https://doi.org/10.1016/j.jfluidstructs.2019.03.023]. J Fluids Structures. 2019;87:354–77.10.1016/j.jfluidstructs.2019.03.023Search in Google Scholar
[12] Bahatmaka A, Kim DJ, Chrismianto D, Setiawan JD, Prabowo AR. Numerical investigation on the performance of ducted propeller, MATEC Web of Conferences, 2017, 138, 07002. [https://doi.org/10.1051/matecconf/201713807002]10.1051/matecconf/201713807002Search in Google Scholar
[13] Alizadeh H, Jahangir MH, Ghasempour R. CFD-based improvement of Savonius type hydrokinetic turbine using optimized barrier at the low-speed flows [https://doi.org/10.1016/j.oceaneng. 2020.107178]. Ocean Eng. 2020;202:107178.10.1016/j.oceaneng.2020.107178Search in Google Scholar
[14] Niklas K, Pruszko H. Full scale CFD seakeeping simulations for case study ship redesigned from V-shaped bulbous bow to X-bow hull form [https://doi.org/10.1016/j.apor.2019.05.011]. Appl Ocean Res. 2019;89:188–201.10.1016/j.apor.2019.05.011Search in Google Scholar
[15] Bahatmaka A, Kim DJ, Samuel S, Prabowo AR, Zaw MT. Investigation on the performance of the traditional Indonesian fishing vessel, MATEC Web of Conferences, 2017, 159, 02056. [https: //doi.org/10.1051/matecconf/201815902056]10.1051/matecconf/201815902056Search in Google Scholar
[16] Prabowo AR, Nubli H, Sohn JM. On the structural behaviour to penetration of striking bow under collision incidents between two ships [https://doi.org/10.15282/ijame.16.4.2019.19.0553]. International Journal of Automotive and Mechanical Engineering. 2019;16(4):7480–97.10.15282/ijame.16.4.2019.19.0553Search in Google Scholar
[17] Prabowo AR, Cho HJ, Lee SG, Baek SJ, Byeon JH, Bae DM, et al. Evaluating structural crashworthiness and progressive failure of double hull tanker under accidental grounding: bottom raking case [https://doi.org/10.1515/eng-2018-0024]. Open Eng. 2018;8(1):193–204.10.1515/eng-2018-0024Search in Google Scholar
[18] Nasser YA. Frontal crash simulation of vehicles against lighting columns using FEM [https://doi.org/10.1016/j.aej.2013.01.005]. Alex Eng J. 2013;52(3):295–9.10.1016/j.aej.2013.01.005Search in Google Scholar
[19] Ge L, Zhang AM, Wang SP. Investigation of underwater explosion near composite structures using a combined RKDG-FEM approach [https://doi.org/10.1016/j.jcp.2019.109113]. J Comput Phys. 2020;404:109113.10.1016/j.jcp.2019.109113Search in Google Scholar
[20] Prabowo AR, Sohn JM, Byeon JH, Bae DM, Zakki AF, Cao B. Structural analysis for estimating damage behavior of double hull under ice-grounding scenario models [https://doi.org/10.4028/www.scientific.net/KEM.754.303]. Key EngMater. 2017;754:303–6.10.4028/www.scientific.net/KEM.754.303Search in Google Scholar
[21] Roth, N.J., A Prototype Design and Performance of the Savonius Rotor Based Irrigation System. 1985.Search in Google Scholar
[22] Patel V, Eldho TI, Prabhu SV. Velocity and performance correction methodology for hydrokinetic turbines experimented with different geometry of the channel [https://doi.org/10.1016/j.renene. 2018.08.027]. Renew Energy. 2019;131:1300–17.10.1016/j.renene.2018.08.027Search in Google Scholar
[23] Roy S, Saha UK. Wind tunnel experiments of a newly developed two - bladed Savonius - style wind turbine [https://doi.org/10. 1016/j.apenergy.2014.10.022]. Appl Energy. 2015;137:117–25.10.1016/j.apenergy.2014.10.022Search in Google Scholar
[24] Thakur N, Biswas A, Kumar Y, Basumatary M. CFD analysis of performance improvement of the Savonius water turbine by using an impinging jet duct design [https://doi.org/10.1016/j.cjche.2018.11.014]. Chin J Chem Eng. 2019;27(4):794–801.10.1016/j.cjche.2018.11.014Search in Google Scholar
[25] He JH. A fractal variational theory for one-dimensional compressible flow in a microgravity space [https://doi.org/10.1142/S0218348X20500243]. Fractals. Forthcoming 2019.10.1142/S0218348X20500243Search in Google Scholar
[26] He JH. Lagrange crisis and generalized variational principle for 3D unsteady flow [https://doi.org/10.1108/HFF-07-2019-0577]. Int J Numer Methods Heat Fluid Flow. 2019;30(3):1189–96.10.1108/HFF-07-2019-0577Search in Google Scholar
[27] Prabowoputra DM, Hadi S, Prabowo AR, Sohn JM. Performance investigation of the Savonius horizontal water turbine accounting for stage rotor design [https://doi.org/10.18178/ijmerr.9.2. 184-189]. International Journal of Mechanical Engineering and Robotics Research. 2020;9:184–9.10.18178/ijmerr.9.2.184-189Search in Google Scholar
[28] Driss Z, Mlayeh O, Driss S, Maaloul M, Abid MS. Study of the incidence angle effect on the aerodynamic structure characteristics of an incurved Savonius wind rotor placed in a wind tunnel [https://doi.org/10.1016/j.energy.2016.07.112]. Energy. 2016;113:894–908.10.1016/j.energy.2016.07.112Search in Google Scholar
© 2020 D. M. Prabowoputra et al., published by De Gruyter
This work is licensed under the Creative Commons Attribution 4.0 International License.
Articles in the same Issue
- Regular Articles
- Fabrication of aluminium covetic casts under different voltages and amperages of direct current
- Inhibition effect of the synergistic properties of 4-methyl-norvalin and 2-methoxy-4-formylphenol on the electrochemical deterioration of P4 low carbon mold steel
- Logistic regression in modeling and assessment of transport services
- Design and development of ultra-light front and rear axle of experimental vehicle
- Enhancement of cured cement using environmental waste: particleboards incorporating nano slag
- Evaluating ERP System Merging Success In Chemical Companies: System Quality, Information Quality, And Service Quality
- Accuracy of boundary layer treatments at different Reynolds scales
- Evaluation of stabiliser material using a waste additive mixture
- Optimisation of stress distribution in a highly loaded radial-axial gas microturbine using FEM
- Analysis of modern approaches for the prediction of electric energy consumption
- Surface Hardening of Aluminium Alloy with Addition of Zinc Particles by Friction Stir Processing
- Development and refinement of the Variational Method based on Polynomial Solutions of Schrödinger Equation
- Comparison of two methods for determining Q95 reference flow in the mouth of the surface catchment basin of the Meia Ponte river, state of Goiás, Brazil
- Applying Intelligent Portfolio Management to the Evaluation of Stalled Construction Projects
- Disjoint Sum of Products by Orthogonalizing Difference-Building ⴱ
- The Development of Information System with Strategic Planning for Integrated System in the Indonesian Pharmaceutical Company
- Simulation for Design and Material Selection of a Deep Placement Fertilizer Applicator for Soybean Cultivation
- Modeling transportation routes of the pick-up system using location problem: a case study
- Pinless friction stir spot welding of aluminium alloy with copper interlayer
- Roof Geometry in Building Design
- Review Articles
- Silicon-Germanium Dioxide and Aluminum Indium Gallium Arsenide-Based Acoustic Optic Modulators
- RZ Line Coding Scheme With Direct Laser Modulation for Upgrading Optical Transmission Systems
- LOGI Conference 2019
- Autonomous vans - the planning process of transport tasks
- Drivers ’reaction time research in the conditions in the real traffic
- Design and evaluation of a new intersection model to minimize congestions using VISSIM software
- Mathematical approaches for improving the efficiency of railway transport
- An experimental analysis of the driver’s attention during train driving
- Risks associated with Logistics 4.0 and their minimization using Blockchain
- Service quality of the urban public transport companies and sustainable city logistics
- Charging electric cars as a way to increase the use of energy produced from RES
- The impact of the truck loads on the braking efficiency assessment
- Application of virtual and augmented reality in automotive
- Dispatching policy evaluation for transport of ready mixed concrete
- Use of mathematical models and computer software for analysis of traffic noise
- New developments on EDR (Event Data Recorder) for automated vehicles
- General Application of Multiple Criteria Decision Making Methods for Finding the Optimal Solution in City Logistics
- The influence of the cargo weight and its position on the braking characteristics of light commercial vehicles
- Modeling the Delivery Routes Carried out by Automated Guided Vehicles when Using the Specific Mathematical Optimization Method
- Modelling of the system “driver - automation - autonomous vehicle - road”
- Limitations of the effectiveness of Weigh in Motion systems
- Long-term urban traffic monitoring based on wireless multi-sensor network
- The issue of addressing the lack of parking spaces for road freight transport in cities - a case study
- Simulation of the Use of the Material Handling Equipment in the Operation Process
- The use of simulation modelling for determining the capacity of railway lines in the Czech conditions
- Proposals for Using the NFC Technology in Regional Passenger Transport in the Slovak Republic
- Optimisation of Transport Capacity of a Railway Siding Through Construction-Reconstruction Measures
- Proposal of Methodology to Calculate Necessary Number of Autonomous Trucks for Trolleys and Efficiency Evaluation
- Special Issue: Automation in Finland
- 5G Based Machine Remote Operation Development Utilizing Digital Twin
- On-line moisture content estimation of saw dust via machine vision
- Data analysis of a paste thickener
- Programming and control for skill-based robots
- Using Digital Twin Technology in Engineering Education – Course Concept to Explore Benefits and Barriers
- Intelligent methods for root cause analysis behind the center line deviation of the steel strip
- Engaging Building Automation Data Visualisation Using Building Information Modelling and Progressive Web Application
- Real-time measurement system for determining metal concentrations in water-intensive processes
- A tool for finding inclusion clusters in steel SEM specimens
- An overview of current safety requirements for autonomous machines – review of standards
- Expertise and Uncertainty Processing with Nonlinear Scaling and Fuzzy Systems for Automation
- Towards online adaptation of digital twins
- Special Issue: ICE-SEAM 2019
- Fatigue Strength Analysis of S34MnV Steel by Accelerated Staircase Test
- The Effect of Discharge Current and Pulse-On Time on Biocompatible Zr-based BMG Sinking-EDM
- Dynamic characteristic of partially debonded sandwich of ferry ro-ro’s car deck: a numerical modeling
- Vibration-based damage identification for ship sandwich plate using finite element method
- Investigation of post-weld heat treatment (T6) and welding orientation on the strength of TIG-welded AL6061
- The effect of nozzle hole diameter of 3D printing on porosity and tensile strength parts using polylactic acid material
- Investigation of Meshing Strategy on Mechanical Behaviour of Hip Stem Implant Design Using FEA
- The effect of multi-stage modification on the performance of Savonius water turbines under the horizontal axis condition
- Special Issue: Recent Advances in Civil Engineering
- The effects of various parameters on the strengths of adhesives layer in a lightweight floor system
- Analysis of reliability of compressed masonry structures
- Estimation of Sport Facilities by Means of Technical-Economic Indicator
- Integral bridge and culvert design, Designer’s experience
- A FEM analysis of the settlement of a tall building situated on loess subsoil
- Behaviour of steel sheeting connections with self-drilling screws under variable loading
- Resistance of plug & play N type RHS truss connections
- Comparison of strength and stiffness parameters of purlins with different cross-sections of profiles
- Bearing capacity of floating geosynthetic encased columns (GEC) determined on the basis of CPTU penetration tests
- The effect of the stress distribution of anchorage and stress in the textured layer on the durability of new anchorages
- Analysis of tender procedure phases parameters for railroad construction works
- Special Issue: Terotechnology 2019
- The Use of Statistical Functions for the Selection of Laser Texturing Parameters
- Properties of Laser Additive Deposited Metallic Powder of Inconel 625
- Numerical Simulation of Laser Welding Dissimilar Low Carbon and Austenitic Steel Joint
- Assessment of Mechanical and Tribological Properties of Diamond-Like Carbon Coatings on the Ti13Nb13Zr Alloy
- Characteristics of selected measures of stress triaxiality near the crack tip for 145Cr6 steel - 3D issues for stationary cracks
- Assessment of technical risk in maintenance and improvement of a manufacturing process
- Experimental studies on the possibility of using a pulsed laser for spot welding of thin metallic foils
- Angular position control system of pneumatic artificial muscles
- The properties of lubricated friction pairs with diamond-like carbon coatings
- Effect of laser beam trajectory on pocket geometry in laser micromachining
- Special Issue: Annual Engineering and Vocational Education Conference
- The Employability Skills Needed To Face the Demands of Work in the Future: Systematic Literature Reviews
- Enhancing Higher-Order Thinking Skills in Vocational Education through Scaffolding-Problem Based Learning
- Technology-Integrated Project-Based Learning for Pre-Service Teacher Education: A Systematic Literature Review
- A Study on Water Absorption and Mechanical Properties in Epoxy-Bamboo Laminate Composite with Varying Immersion Temperatures
- Enhancing Students’ Ability in Learning Process of Programming Language using Adaptive Learning Systems: A Literature Review
- Topical Issue on Mathematical Modelling in Applied Sciences, III
- An innovative learning approach for solar power forecasting using genetic algorithm and artificial neural network
- Hands-on Learning In STEM: Revisiting Educational Robotics as a Learning Style Precursor