Dispatching policy evaluation for transport of ready mixed concrete
-
Michal Weiszer
 ,
Vieroslav Molnár
,
Vieroslav Molnár

Abstract
Process of ready mixed concrete (RMC) delivery is an example of multi-objective optimization due to the conflicting objectives of the parties involved. In order to face this problem, discrete event simulation model of the delivery process is created with input parameters based on the surveyed data of real processes. The model is simulated with different vehicle dispatching policies and the results are analysed focusing on performance indicators. The research results compared in terms of Pareto optimality indicate that employing effective dispatching strategies can reduce both site idle time and waiting time of vehicles.
1 Introduction
Ready mixed concrete (RMC) produced in batch plant is a widely used material in construction industry. Along with its advantages it introduces new type of problems related to RMC delivery from the batch plant to the construction site [1]. Delivery is one the key factors for the effectiveness of the inexpensiveness of the whole process. Late arrival of vehicles to the construction site may cause interruptions in concrete placement and idle time of machinery and workers. On the other hand, arrivals of vehicles with short interarrival times result in vehicles queuing on site with idle times of vehicles. Minimization of the idle times of vehicles is not only in the interest of batch plant but also contractor since many vehicles queuing in the construction site is problematic due to limited space, environmental issues and noise mainly in urban areas. Furthermore, RMC must be placed within certain time from the loading in batch plant otherwise it loses its quality and hardens.
In practice, RMC delivery planning is mainly determined by batch plant manager who estimates the vehicles needed for the order and their dispatching interval according to the quantity and delivery time of the concrete specified in the order. Its task is to plan the whole process optimally to ensure utilization of machinery and workers of the batch plant and construction site as well.
This planning process is rather difficult because it is influenced by uncertainty such as changing traffic conditions and concrete placement rate. Well prepared plan together with possible real time operational control of the delivery could maximize utilization of vehicles, minimize their idle times and maximize utilization of machinery and workers on the construction site. Delivery plan also determines the number of vehicles needed to fulfil the order.
In this paper, simulation model of RMC delivery from batch plant to construction site is presented. The model draws from discrete-event simulation methodology and it is applied in a novel way to the RMC delivery process. The contribution of this paper can be summarized as follows. Firstly, the presented model enables to choose optimal vehicle dispatching plan. Rather than selecting single dispatching interval value as presented in previous research [2, 3, 4], this paper evaluates several possible options and demonstrates the effect of different dispatching policies [5] on the delivery process. Secondly, the simulation also incorporates feedback from construction site about current situation in delivery. The feedback enables to promptly react to the actual conditions (such as delays in traffic or casting at the construction site) in contrast to the previous research [6, 7]. Finally, policies with different parameters than in [8] are used in scenarios and are evaluated in terms of Pareto optimality. Optimization treated in this manner takes into account both batch plant and contractors interests namely maximization of vehicle utilization and maximization of construction site machinery and workers.
Firstly, previous research in this field is presented in the next section. Then, process of the RMC delivery is analysed in the following section together with surveyed data from real RMC castings in Slovakia. These processes then serve as a basis for simulation model creation in the fourth section with input data from the survey. Created model is verified and used for scenario evaluation in the fifth section. In the same section, results of simulation for various scenarios and the real process are compared. Finally, conclusions are drawn in the last section.
2 Previous research
Production and delivery of RMC from the batch plant to the construction site is an example of JIT process [9]. Several authors employ simulation as a tool for optimization and emphasis is put mainly on time plan of the delivery.
Simulation model with spreadsheet add-in risk analysis tool @Risk is presented by Wang [2]. This model is used to determine the optimal interarrival time of trucks that maximizes the utilization of concrete pump and minimizes the number of trucks needed. More authors [6, 7] combine genetic algorithm (GA) (see [10, 11]) with simulation to determine the arrival, departure and waiting time of trucks. GAsearches dispatching sequence of trucks from RMC plant to multiple construction sites in order to minimize waiting time of trucks on all construction sites. Combination of Simulation and genetic algorithm is also used by authors [3, 4]. Efficiency of operation in their model is measured by idle times on sites or Total operations inefficiency defined as combination of idle times of trucks, plant and site equipment. Decision variables searched by genetic algorithm are interarrival times of the trucks and their number.
Another authors [8] also focus on truck dispatching interval. However, the truck dispatching interval in their model can vary according to construction manager’s response to traffic conditions and RMC placement rate. During the simulation the interval is updated regularly to meet specified objectives (e.g. minimum number of trucks queued at site). Unlike others, they use continuous simulation modelling approach to capture information about work in progress. Results show that responsive scheduling can achieve trade-off between site manager’s and RMC supplier’s objectives.
RMC distribution has also captured attention of operation research, where researchers see the RMC distribution as a vehicle scheduling problem, order assignment problem (one order can be assigned to multiple plants) [12] or vehicle routing problem [13]. From recent optimization and simulation approaches (e.g. [14, 15]), local search is used by authors [13], variable neighbourhood search combined with mixed integer programming is proposed by authors [12]. Other works include one by Yan [16, 17] who uses time-space network [18] and [19].
3 RMC delivery process
Generic concrete placement process consists of following individual sub-processes:
vehicle dispatching in batch plant,
production and discharging of concrete into the vehicle,
transportation to the construction site,
unloading of vehicles at the construction site,
return of vehicles to the batch plant.
In order to build the simulation model, real RMC delivery operations were observed in Bratislava, Slovakia. Four casting operations, each one lasting a whole day, of the same type of structural element being constructed were examined by checking delivery tickets, comprising of 170 individual deliveries (vehicle trips) in total. Obtained data are used in the model as input values.
3.1 RMC production
RMC is produced in the batch plant which schedules production according to its capacity and demand. Input raw materials are aggregates, sand, cement, water and additives which are mixed together in the specified proportion to satisfy quality requirements. Observed batch plant has a RMC production capacity of 60 m3/ h.
The production of RMC starts by discharging of individual ingredients into the mixer where they are mixed for specified amount of time. Produced RMC is then loaded into the truck positioned under the mixer. After loading the truck drives to recycling station where excess concrete is washed off.
Truck driver receives a delivery order from plant dis-patcher and the truck leaves the batch plant. Survey results showed that average time for these processes is 4 min and the average dispatching interval was 11.66 min. During the survey, no intended dispatching policy was applied.
3.2 Transportation
The transportation process is determined by specific properties of RMC. The trucks cycle between the batch plant and construction site until the whole volume of ordered concrete is transported. During transportation, trucks with revolving drums constantly mix the RMC. The main parameter of the vehicles is their capacity. In the observed processes, truck capacity ranged from 5 m3 to 9 m3. Proportion of individual capacities (drum volumes) is shown in Figure 1.

Histogram of truck capacities.
Transportation of RMC is heavily influenced by current traffic conditions such as traffic congestions. In observed processes, average travelling time reached 24.46 min with standard deviation 5.74 min. The average travelling time takes into account the distance between the plant and the construction site and its stochastic nature reflect the traffic conditions. A normal distribution of travelling time is assumed in this paper based on previous research [20, 21] and empirical fit of the data compared to other distributions. Histogram of surveyed data with fitted normal distribution curve is depicted in Figure 2. Stochastic travelling times cause a deterioration of the initial interval of consecutive vehicles from the batch plant. Therefore, vehicles may arrive at the construction site with different interarrival times.
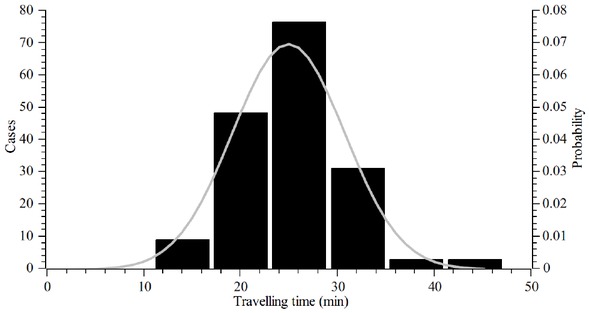
Histogram of travelling time with fitted normal distribution curve.
3.3 Unloading of RMC
After the arrival of the vehicle, it waits in a queue until concrete placing machinery (pump) is ready to service it. In observed processes, mobile pump was used with capacity higher than workers capacity to place concrete. Unloading performance determines the time to unload one vehicle. The performance is not constant but varies and it was observed that it was the determining factor affecting the unloading time rather than volume of RMC that vehicle carried (Figure 3). Average unloading time for one vehicle ranged from 5 min to 20 min. The variation in unloading times is due to the specific factors related to the site such as site layout, height or shape of pouring. After unloading, vehicles return to the batch plant for next delivery.

Histogram of unloading times for each day.
4 Model description and methodology
This paper adopts Discrete-event simulation technique [22] which was implemented in Extendsim simulation package.
The basic structure of the simulation model of the RMC delivering process is depicted in Figure 4. The simulation begins with the generation of the vehicles. Resource of vehicles is a resource block from which the vehicles are drawn into the Queue 1. Queue 1 is a First-in-first-out type with priority for used vehicles. This ensures that vehicles which returned from the delivery are the first one to be used. This way, only the number of vehicles needed is present at the time in the simulation model. New vehicle is sent to delivery if there is no returned vehicle in the Queue 1.
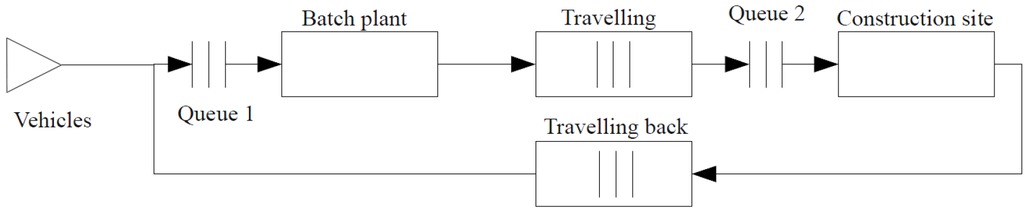
Simulation model scheme.
The batch plant is modelled as a single server activity. The service time is equal to the required dispatching interval. It is assumed, that during this time, all activities taking place in the batch plant (mixing, loading, washing) are completed. Vehicles have their attribute of concrete quantity updated. Separate attribute from vehicle capacity is used, since last vehicle may be assigned lower quantity of concrete than its capacity. During simulation, the quantity of produced and loaded RMC is summed. When the sum is equal to the ordered quantity, batch plant stops servicing vehicles.
Infinite server represents travelling from the batch plant to the construction site. Each vehicle receives service with processing time equal to the travelling time. Travelling time is generated as a random number with normal distribution, mean and standard deviation obtained from surveyed data.
Vehicles which arrived to the construction site queue up in the Queue 2 waiting to be unloaded. Since only one vehicle at the time can be unloaded, unloading process is modelled as a single server. For analytical purposes, there is an assumption of no maximum waiting time for vehicles after the RMC loses its quality. Such a constraint would be important particularly in extreme weather conditions (cold or hot). However, the data used in this study was obtained during normal weather conditions.
Empty vehicles travel back to the batch plant for next deliveries. The simulation ends with the last vehicle departing from the construction site when the quantity of ordered RMC is transported.
4.1 Pareto optimality
In this study, we consider the minimization of 1) construction site idle time which is mainly the interest of the contractor and 2) waiting time of vehicles which is a concern for the batch plant. As explained in Section 1, high values of construction site idle time and waiting times of delivery vehicles cause inefficiencies for both construction site and batch plant, respectively. In contrast with single-objective problems, multi-objective optimization problems have to deal with more objectives at the same time. Since optimization of the decision variable with respect to just one objective can often lead to worse results in other objectives, simultaneous approach is needed and single solution to multi-objective problem often does not exist at all.
Therefore, the aim of multi-objective optimization is to find a set of solutions each of which minimizes the objective functions at an acceptable level. Predominant concept in determining an optimal solution in multi-objective applications is Pareto optimality [11, 23, 24, 25, 26, 27, 28]. In this concept, solutions can dominate each other.
A solution x1 is said to dominate the other solution x2, if:
The solution x1 is no worse than x2 in all objectives. Thus, the solutions are compared based on their objective function values, and
The solution x1 is strictly better than x2 in at least one objective.
Solution, that is not dominated by any other solution in solution space is called Pareto-optimal. A Pareto-optimal solution cannot be improved in any objective without worsening in at least one other objective. The all non-dominated solutions in solution space constitute the Pareto optimal set. The corresponding objective functions values of the Pareto-optimal set in the objective space form a Pareto front.
5 Computational results
5.1 Verification and validation of the model
Reliability of the simulation model can be verified by comparing actual surveyed data and the model output. The model was simulated 100 times for each day with input data based on survey results. Several performance output parameters were collected as summarized in Table 1. The surveyed data and simulation results are not identical due to the stochastic nature of the process and possible survey bias. For example, the average of surveyed site idle time is 30 min and simulated result is 52.15 min. When compared to the average duration (533.75 min and 516.78 min), the site was idle for 5.62% of time for the surveyed data and 10.09% for the simulation. Similarly, the total average waiting time of vehicles (589.75 min and 617.08 min) is 110.49% of the duration for surveyed data and 119.41% for the simulation.
Model validation
| Day | Cycles | Duration (min) | Site idle time (min) | Site idle time (%) | Waiting time of vehicles (min) | Waiting time of vehicles (%) | Avg waiting time of vehicle (min) | Avg interval (min) | Vehicles used (truck) |
|---|---|---|---|---|---|---|---|---|---|
| Surveyed data | |||||||||
| 1 | 48 | 578 | 35 | 6.06% | 385 | 66.61% | 8.02 | 11.277 | 10 |
| 2 | 53 | 669 | 30 | 4.48% | 635 | 94.92% | 11.98 | 11.923 | 9 |
| 3 | 33 | 433 | 45 | 10.39% | 354 | 81.76% | 10.73 | 12.344 | 8 |
| 4 | 36 | 455 | 10 | 2.20% | 985 | 216.48% | 27.36 | 11.714 | 12 |
| Avg Simulated results | - | 533.75 | 30 | 5.62% | 589.75 | 110.49% | 14.52 | 11.81 | 9.75 |
| 1 | 48 | 580.41 | 89.19 | 15.37% | 424.86 | 73.20% | 9.04 | 11.37 | 8.82 |
| 2 | 53 | 621.42 | 60.96 | 9.81% | 636.07 | 102.36% | 12.23 | 10.95 | 9.53 |
| 3 | 33 | 426.95 | 49.07 | 11.49% | 405.52 | 94.98% | 11.81 | 11.71 | 8.84 |
| 4 | 36 | 438.36 | 9.36 | 2.14% | 1001.89 | 228.55% | 30 | 10.4 | 12.23 |
| Avg | - | 516.78 | 52.15 | 10.09% | 617.08 | 119.41% | 15.77 | 11.11 | 9.86 |
Simulation results for different scenarios
| Interval (min) | Duration (min) | Site idle time (min) | Site idle time (%) | Waiting time of vehicles (min) | Waiting time of vehicles (%) | Avg waiting time of vehicle (min) | Avg interval (min) | Vehicles used (truck) |
|---|---|---|---|---|---|---|---|---|
| Scenario 1 | ||||||||
| 10 | 480.10 | 19.40 | 4.04% | 820.23 | 170.85% | 21.41 | 10.02 | 10.54 |
| 11 | 523.88 | 65.00 | 12.41% | 328.28 | 62.66% | 8.85 | 11.66 | 7.72 |
| 12 | 536.40 | 75.40 | 14.06% | 273.26 | 50.94% | 7.29 | 12.00 | 7.42 |
| 13 | 573.54 | 112.66 | 19.64% | 182.87 | 31.88% | 4.82 | 13.01 | 6.65 |
| 14 | 613.22 | 153.52 | 25.04% | 126.84 | 20.68% | 3.32 | 13.98 | 6.18 |
| Scenario 2 | ||||||||
| 10 | 497.28 | 38.45 | 7.73% | 478.69 | 96.26% | 12.43 | 11.15 | 8.54 |
| 11 | 513 | 55.51 | 10.82% | 335.76 | 65.45% | 8.78 | 11.54 | 7.81 |
| 12 | 542.21 | 81.20 | 14.98% | 238.03 | 43.90% | 6.24 | 12.24 | 7.19 |
| 13 | 575.94 | 115.55 | 20.06% | 177.58 | 30.83% | 4.67 | 13.07 | 6.63 |
| 14 | 613.94 | 153.85 | 25.06% | 125.96 | 20.52% | 3.31 | 14.00 | 6.16 |
| Scenario 3 | ||||||||
| 10 | 506.66 | 45.62 | 9.00% | 411.83 | 81.28% | 10.51 | 11.36 | 8.24 |
| 11 | 518.13 | 60.12 | 11.60% | 307.56 | 59.36% | 7.96 | 11.65 | 7.65 |
| 12 | 543.87 | 86.06 | 15.82% | 226.58 | 41.66% | 5.88 | 12.28 | 7.12 |
| 13 | 576.58 | 116.63 | 20.23% | 170.36 | 29.55% | 4.45 | 13.11 | 6.59 |
| 14 | 613.60 | 155.51 | 25.34% | 123.86 | 20.19% | 3.21 | 14.03 | 6.12 |
| Scenario 4 | ||||||||
| 10 | 487.31 | 28.89 | 5.93% | 837.21 | 171.80% | 10.64 | 21.40 | 10.51 |
| 11 | 492.44 | 31.76 | 6.45% | 739.29 | 150.13% | 10.81 | 18.71 | 10.11 |
| 12 | 498.18 | 37.02 | 7.43% | 682.49 | 137.00% | 10.93 | 17.13 | 9.91 |
| 13 | 503.45 | 43.34 | 8.61% | 642.62 | 127.64% | 11.01 | 15.95 | 9.87 |
| 14 | 511.45 | 49.65 | 9.71% | 565.65 | 110.60% | 11.27 | 13.97 | 9.59 |
For analytical purpose, the model accuracy is sufficient, the simulated results approximate surveyed data and the model can be used for further testing. The simulated results are further referred to as Base case.
5.2 Simulation results for different dispatching policies
The model was simulated with the same travelling time distribution, same fleet of vehicles (represented by vehicle capacities) and same unloading time distribution for each day but under different vehicle dispatching scenarios to investigate the effect of individual policies on selected performance criteria.
Firstly, constant dispatching interval of vehicles from the batch plant was employed (Scenario 1). For each day, same value of dispatching interval was used and the test was repeated with increasing value of the dispatching interval. Average of the simulated results of the four days were then compared to each other.
Secondly, variable dispatching interval from the batch plant with feedback from the construction site was adopted. Two cases were simulated, one with queue update time 30 min (Scenario 2) and the second with 15 min update time (Scenario 3). The information about the queue length at the construction site serves as an input for simple decision process of modifying the initial dispatching interval. If the queue length at the construction site is greater or equal to two, the interval is increased by one minute. If the queue length is equal to zero, the interval is decreased by one minute. However, it cannot drop below the initial interval. This scenario represents a situation where a construction site manager checks the length of vehicle queue on regular basis and reports back to the batch plant to adjust the dispatching interval accordingly.
Finally, variable dispatching interval from the batch plant with 30 min update about the queue length from the construction site was used (Scenario 4). In contrast with previous scenarios, in this case the dispatching interval could go below the initial value. The simulation results are summarized in Table 1.
The simulation results confirmed that the dispatching interval has significant impact on all output performance indicators. Longer dispatching interval caused increase in duration of the process in all scenarios. This is mainly due to higher site idle times with high dispatching interval values when the construction site has to wait for vehicles and concrete placement is interrupted. On the other hand, if the dispatching interval is short, vehicles tend to queue at the construction site and high vehicle idle times can be observed. The queueing of vehicles in case of a short interval is shown in Figure 5. A comparison of vehicle waiting time for different intervals is in Figure 6.

The length of vehicle queue at the construction site (day 4, constant interval 10 min)
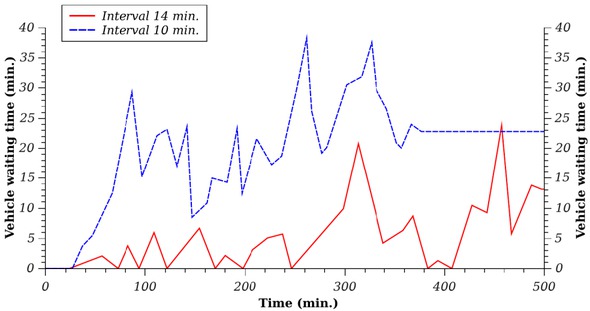
Vehicle waiting time at the construction site, day 1, constant interval
The results also confirmed that there is a trade-off between site idle time and vehicles idle time. Moreover, the results imply that number of vehicles needed to complete the order is related to the dispatching interval. With longer dispatching interval, it was possible to transport the ordered volume of RMC with less vehicles than in the case with shorter dispatching interval.
As mentioned in Subsection 4.1, in multi-objective optimization problems, single optimal solution may not exist at all. However, a list of a few solutions in terms of Pareto optimality could be very helpful for the decision maker.
Based on his or her preferences, the decision maker could choose the right trade between conflicting objectives. Comparison of different dispatching policies can be made by evaluating the relationship between site idle times and vehicle idle times. The simulation results for these two performance indicators are compared in Figure 5. The data points are labelled with value of the dispatching interval.
Scenario 2 and 3 with variable dispatching interval with 15 and 30 min update times when decrease below the initial interval is not allowed show similar results in comparison with constant dispatching interval case with higher interval values (13 and 14 min). This is due to the fact that with higher intervals, queue length is often equal to zero and the model tries to decrease the interval by one minute. However, since decrease below the initial interval is not allowed, the interval stays the same resulting in the same behaviour as with constant interval policy.
The policy with variable dispatching interval with 30 min update time when decrease below the initial interval is allowed used in Scenario 4 showed poor performance in vehicle idle times for all interval values. This could be due to high uncertainty associated with travelling times and long distance between batch plant and construction site resulting in long time to adjustment of the interval to make an effect. The uncertainty is therefore an important factor and not considering it could compromise the planned schedule [6, 7]. The comparison of Scenario 2 and 4 is depicted in Figure 7 and 8, respectively. Scenario 4 enabled low values of dispatching interval which resulted in a long vehicle queue early on (around time 100 min.) in contrast to Scenario 2. As can be seen in Figure 7, when no decrease below initial interval was allowed, this initial value prevented the dispatching interval from low values and higher vehicle idle times associated with them. These observations indicate although the feedback could effectively react to uncertainties, in contrast to [8], a more sophisticated policy such as presented in this paper is needed to achieve a better
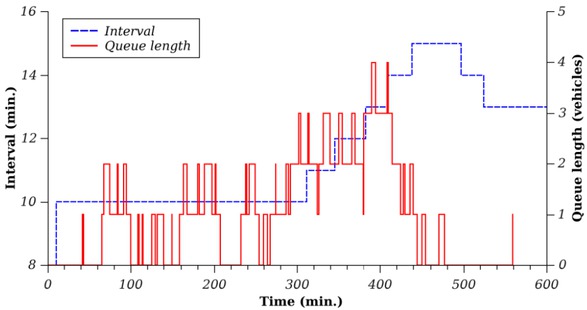
Interval and vehicle queue length for Scenario 2, for day 1, Initial interval 10 min

Interval and vehicle queue length for Scenario 4, for day 1, Initial interval 10 min
The greatest improvement in performance indicators of Scenarios 2 and 3 in comparison with constant interval Scenario 1 is achieved with 10, 11 and 12 min dispatching interval. Considering fitted splines (Figure 9), points for variable interval scenarios dominate the constant interval points in the left part of the graph. These results indicate that even if the interval is optimised such as in the previous research [2, 3, 4], a constant interval policy is outperformed by a policy with feedback. Variable dispatching interval policy used in Scenario 3 with initial interval of 11 min enabled to improve the site idle time by 7.60% and vehicles idle time by 6.31% compared to constant interval policy in Scenario 1.

Comparison of simulation results and Pareto fronts
In all scenarios, applied policies achieved better values of performance indicators than in Base case. The simulation results indicate that suitably chosen dispatching policy can reduce waiting time of vehicles and site idle time in the same time.
6 Conclusion
Managing real world RMC delivery process is a challenging task due to the uncertainty involved. Furthermore, participating partners have different and conflicting objectives. Developed discrete event simulation model tries to improve the whole process by simultaneously minimizing waiting time of vehicles and site idle time. To achieve such effect, various dispatching policies were employed and their results investigated. Comparison of the simulated performance indicators in terms of Pareto optimality showed that variable dispatching interval adjusted according to the feedback from the construction site without decreasing below the initial interval value performed better than other policies including constant interval dispatching. Moreover, variable and constant dispatching interval achieved improvement in both performance indicators compared to the base case.
Although the simulation model was created with input data based on survey of real processes, it can be adapted to different operation conditions by modifying the input values. The simulation model could be then used as a decision supporting tool for selecting the suitable dispatching policy for the RMC delivery process. Similarly, an estimation of number of vehicles needed for the order could be made based on simulation results. Rather than searching for single optimal dispatching interval value, exploring Pareto optimal solutions as in this research helps the decision maker to investigate various scenarios. This way a trade-off between different objectives can be made.
The future research could investigate more sophisticated methods of controlling dispatching interval of vehicles incorporating feedback from the construction site. Collecting further data could also improve the accuracy of the model. Finally, a real-world testing of the proposed controlling policy would help to gather valuable feedback and fine-tune the model.
Acknowledgement
This work is a part of these projects VEGA 1/0600/20, VEGA 1/0403/18, KEGA 012TUKE-4/2019, KEGA 013TUKE-4/2019, APVV SK-SRB-18-0053.
References
[1] Schmid V, Doerner KF, Hartl RF, et al. A Hybrid Solution Approach for Ready-Mixed Concrete Delivery. Transp Sci 2009; 43: 70–85.10.1287/trsc.1080.0249Search in Google Scholar
[2] Wang SQ, Teo CL, Ofori G. Scheduling the truckmixer arrival for a ready mixed concrete pour via simulation with @risk. J Constr Res 2001; 2: 169–179.Search in Google Scholar
[3] Lu M, Lam H-C. Simulation-optimization integrated approach to planning ready mixed concrete production and delivery: validation and applications. In: Winter Simulation Conference. 2009, pp. 2593–2604.10.1109/WSC.2009.5429729Search in Google Scholar
[4] Lu M, Lam H-C. Optimized concrete delivery scheduling using combined simulation and genetic algorithms. In: Proceedings of the Winter, pp. 2572–2580.Search in Google Scholar
[5] Kleywegt AJ, Papastavrou JD. Acceptance and Dispatching Policies for a Distribution Problem. Transp Sci 1998; 32: 127–141.10.1287/trsc.32.2.127Search in Google Scholar
[6] Feng C-W, Cheng T-M, Wu H-T. Optimizing the schedule of dispatching RMC trucks through genetic algorithms. Autom Constr 2004; 13: 327–340.10.1016/j.autcon.2003.10.001Search in Google Scholar
[7] Feng C-W, Wu H-T. Integrating fmGA and CYCLONE to optimize the schedule of dispatching RMC trucks. Autom Constr 2006; 15: 186–199.10.1016/j.autcon.2005.04.001Search in Google Scholar
[8] Park M, Kim W-Y, Lee H-S, et al. Supply chain management model for ready mixed concrete. Autom Constr 2011; 20: 44–55.10.1016/j.autcon.2010.07.005Search in Google Scholar
[9] Tommelein ID, En A, Yi L. Just-in-Time Concrete Delivery: Mapping Alternatives for Vertical Supply Chain Integration. In: Proc. Seventh Ann. Conf. Intl. Group for Lean Constr., IGLC-7. 1999, pp. 26–28.Search in Google Scholar
[10] Guo H, Feng Y, Hao F, et al. Dynamic Fuzzy Logic Control of Genetic Algorithm Probabilities. J Comput 2014; 9: 22–27.10.4304/jcp.9.1.22-27Search in Google Scholar
[11] Deb K, Agrawal S, Pratap A, et al. A Fast Elitist Non-dominated Sorting Genetic Algorithm for Multi-objective Optimization: NSGA-II. In: Parallel Problem Solving from Nature PPSN VI. Berlin, Germany, 2000, pp. 849–858.10.1007/3-540-45356-3_83Search in Google Scholar
[12] Schmid V, Doerner KF, Hartl RF, et al. Hybridization of very large neighborhood search for ready-mixed concrete delivery problems. Comput Oper Res 2010; 37: 559–574.10.1016/j.cor.2008.07.010Search in Google Scholar
[13] Asbach L, Dorndorf U, Pesch E. Analysis, modeling and solution of the concrete delivery problem. Eur J Oper Res 2009; 193: 820–835.10.1016/j.ejor.2007.11.011Search in Google Scholar
[14] Li S, Karatzoglou A, Gentile C. Collaborative Filtering Bandits. In: Proceedings of the 39th International ACM SIGIR conference on Research and Development in Information Retrieval - SIGIR ’16 .New York, New York, USA: ACM Press, 2016, pp. 539–548.10.1145/2911451.2911548Search in Google Scholar
[15] Kar P, Li S, Narasimhan H, et al. Online Optimization Methods for the Quantification Problem. In: Proceedings of the 22nd ACM SIGKDD International Conference on Knowledge Discovery and Data Mining - KDD ’16. New York, New York, USA: ACM Press, 2016, pp. 1625–1634.10.1145/2939672.2939832Search in Google Scholar
[16] Yan S, Lai W, Chen M. Production scheduling and truck dispatching of ready mixed concrete. Transp Res Part E Logist Transp Rev 2008; 44: 164–179.10.1016/j.tre.2006.05.001Search in Google Scholar
[17] Yan S, Lin H-C, Liu Y-C. Optimal schedule adjustments for supplying ready mixed concrete following incidents. Autom Constr 2011; 20: 1041–1050.10.1016/j.autcon.2011.04.005Search in Google Scholar
[18] Lin P-C, Wang J, Huang S-H, et al. Dispatching ready mixed concrete trucks under demand postponement and weight limit regulation. Autom Constr 2010; 19: 798–807.10.1016/j.autcon.2010.05.002Search in Google Scholar
[19] Naso D, Surico M, Turchiano B, et al. Genetic algorithms for supply-chain scheduling: A case study in the distribution of ready-mixed concrete. Eur J Oper Res 2007; 177: 2069–2099.10.1016/j.ejor.2005.12.019Search in Google Scholar
[20] Yan S, Lin HC, Jiang XY. A planning model with a solution algorithm for ready mixed concrete production and truck dispatching under stochastic travel times. Eng Optim 2012; 44: 427–447.10.1080/0305215X.2011.580741Search in Google Scholar
[21] Soofastaei A, Aminossadati SM, Kizil MS, et al. A discrete-event model to simulate the effect of truck bunching due to payload variance on cycle time, hauled mine materials and fuel consumption. Int J Min Sci Technol 2016; 26: 745–752.10.1016/j.ijmst.2016.05.047Search in Google Scholar
[22] Sokolowski JA, Banks CM. Principles of Modeling and Simulation: A Multidisciplinary Approach. Hoboken, New Jersey: John Wiley & Sons, Inc., 2009.10.1002/9780470403563Search in Google Scholar
[23] Marler RT, Arora JS. Survey of multi-objective optimization methods for engineering. Struct Multidiscip Optim 2004; 26: 369–395.10.1007/s00158-003-0368-6Search in Google Scholar
[24] Deb K. Multi-Objective Optimization. In: Search Methodologies. Boston, MA: Springer US, pp. 403–449.10.1007/978-1-4614-6940-7_15Search in Google Scholar
[25] Stopka O, Kampf R. Determining the most suitable layout of space for the loading units’ handling in the maritime port. Transport 2016; 33: 280–290.10.3846/16484142.2016.1174882Search in Google Scholar
[26] Stopka O, Stopkova M, Kampf R. Application of the Operational Research Method to Determine the Optimum Transport Collection Cycle of Municipal Waste in a Predesignated Urban Area. Sustainability 2019; 11: 2275.10.3390/su11082275Search in Google Scholar
[27] Stopka O, Ľupták V. Optimization of Warehouse Management in the Specific Assembly and Distribution Company: a Case Study. Naše more 2018; 65: 266–269.10.17818/NM/2018/4SI.19Search in Google Scholar
[28] Lizbetin J, Bartuska L. The Influence of Human Factor on Congestion Formation on Urban Roads. Procedia Eng 2017; 187: 206–211.10.1016/j.proeng.2017.04.366Search in Google Scholar
© 2020 M. Weiszer et al., published by De Gruyter
This work is licensed under the Creative Commons Attribution 4.0 International License.
Articles in the same Issue
- Regular Articles
- Fabrication of aluminium covetic casts under different voltages and amperages of direct current
- Inhibition effect of the synergistic properties of 4-methyl-norvalin and 2-methoxy-4-formylphenol on the electrochemical deterioration of P4 low carbon mold steel
- Logistic regression in modeling and assessment of transport services
- Design and development of ultra-light front and rear axle of experimental vehicle
- Enhancement of cured cement using environmental waste: particleboards incorporating nano slag
- Evaluating ERP System Merging Success In Chemical Companies: System Quality, Information Quality, And Service Quality
- Accuracy of boundary layer treatments at different Reynolds scales
- Evaluation of stabiliser material using a waste additive mixture
- Optimisation of stress distribution in a highly loaded radial-axial gas microturbine using FEM
- Analysis of modern approaches for the prediction of electric energy consumption
- Surface Hardening of Aluminium Alloy with Addition of Zinc Particles by Friction Stir Processing
- Development and refinement of the Variational Method based on Polynomial Solutions of Schrödinger Equation
- Comparison of two methods for determining Q95 reference flow in the mouth of the surface catchment basin of the Meia Ponte river, state of Goiás, Brazil
- Applying Intelligent Portfolio Management to the Evaluation of Stalled Construction Projects
- Disjoint Sum of Products by Orthogonalizing Difference-Building ⴱ
- The Development of Information System with Strategic Planning for Integrated System in the Indonesian Pharmaceutical Company
- Simulation for Design and Material Selection of a Deep Placement Fertilizer Applicator for Soybean Cultivation
- Modeling transportation routes of the pick-up system using location problem: a case study
- Pinless friction stir spot welding of aluminium alloy with copper interlayer
- Roof Geometry in Building Design
- Review Articles
- Silicon-Germanium Dioxide and Aluminum Indium Gallium Arsenide-Based Acoustic Optic Modulators
- RZ Line Coding Scheme With Direct Laser Modulation for Upgrading Optical Transmission Systems
- LOGI Conference 2019
- Autonomous vans - the planning process of transport tasks
- Drivers ’reaction time research in the conditions in the real traffic
- Design and evaluation of a new intersection model to minimize congestions using VISSIM software
- Mathematical approaches for improving the efficiency of railway transport
- An experimental analysis of the driver’s attention during train driving
- Risks associated with Logistics 4.0 and their minimization using Blockchain
- Service quality of the urban public transport companies and sustainable city logistics
- Charging electric cars as a way to increase the use of energy produced from RES
- The impact of the truck loads on the braking efficiency assessment
- Application of virtual and augmented reality in automotive
- Dispatching policy evaluation for transport of ready mixed concrete
- Use of mathematical models and computer software for analysis of traffic noise
- New developments on EDR (Event Data Recorder) for automated vehicles
- General Application of Multiple Criteria Decision Making Methods for Finding the Optimal Solution in City Logistics
- The influence of the cargo weight and its position on the braking characteristics of light commercial vehicles
- Modeling the Delivery Routes Carried out by Automated Guided Vehicles when Using the Specific Mathematical Optimization Method
- Modelling of the system “driver - automation - autonomous vehicle - road”
- Limitations of the effectiveness of Weigh in Motion systems
- Long-term urban traffic monitoring based on wireless multi-sensor network
- The issue of addressing the lack of parking spaces for road freight transport in cities - a case study
- Simulation of the Use of the Material Handling Equipment in the Operation Process
- The use of simulation modelling for determining the capacity of railway lines in the Czech conditions
- Proposals for Using the NFC Technology in Regional Passenger Transport in the Slovak Republic
- Optimisation of Transport Capacity of a Railway Siding Through Construction-Reconstruction Measures
- Proposal of Methodology to Calculate Necessary Number of Autonomous Trucks for Trolleys and Efficiency Evaluation
- Special Issue: Automation in Finland
- 5G Based Machine Remote Operation Development Utilizing Digital Twin
- On-line moisture content estimation of saw dust via machine vision
- Data analysis of a paste thickener
- Programming and control for skill-based robots
- Using Digital Twin Technology in Engineering Education – Course Concept to Explore Benefits and Barriers
- Intelligent methods for root cause analysis behind the center line deviation of the steel strip
- Engaging Building Automation Data Visualisation Using Building Information Modelling and Progressive Web Application
- Real-time measurement system for determining metal concentrations in water-intensive processes
- A tool for finding inclusion clusters in steel SEM specimens
- An overview of current safety requirements for autonomous machines – review of standards
- Expertise and Uncertainty Processing with Nonlinear Scaling and Fuzzy Systems for Automation
- Towards online adaptation of digital twins
- Special Issue: ICE-SEAM 2019
- Fatigue Strength Analysis of S34MnV Steel by Accelerated Staircase Test
- The Effect of Discharge Current and Pulse-On Time on Biocompatible Zr-based BMG Sinking-EDM
- Dynamic characteristic of partially debonded sandwich of ferry ro-ro’s car deck: a numerical modeling
- Vibration-based damage identification for ship sandwich plate using finite element method
- Investigation of post-weld heat treatment (T6) and welding orientation on the strength of TIG-welded AL6061
- The effect of nozzle hole diameter of 3D printing on porosity and tensile strength parts using polylactic acid material
- Investigation of Meshing Strategy on Mechanical Behaviour of Hip Stem Implant Design Using FEA
- The effect of multi-stage modification on the performance of Savonius water turbines under the horizontal axis condition
- Special Issue: Recent Advances in Civil Engineering
- The effects of various parameters on the strengths of adhesives layer in a lightweight floor system
- Analysis of reliability of compressed masonry structures
- Estimation of Sport Facilities by Means of Technical-Economic Indicator
- Integral bridge and culvert design, Designer’s experience
- A FEM analysis of the settlement of a tall building situated on loess subsoil
- Behaviour of steel sheeting connections with self-drilling screws under variable loading
- Resistance of plug & play N type RHS truss connections
- Comparison of strength and stiffness parameters of purlins with different cross-sections of profiles
- Bearing capacity of floating geosynthetic encased columns (GEC) determined on the basis of CPTU penetration tests
- The effect of the stress distribution of anchorage and stress in the textured layer on the durability of new anchorages
- Analysis of tender procedure phases parameters for railroad construction works
- Special Issue: Terotechnology 2019
- The Use of Statistical Functions for the Selection of Laser Texturing Parameters
- Properties of Laser Additive Deposited Metallic Powder of Inconel 625
- Numerical Simulation of Laser Welding Dissimilar Low Carbon and Austenitic Steel Joint
- Assessment of Mechanical and Tribological Properties of Diamond-Like Carbon Coatings on the Ti13Nb13Zr Alloy
- Characteristics of selected measures of stress triaxiality near the crack tip for 145Cr6 steel - 3D issues for stationary cracks
- Assessment of technical risk in maintenance and improvement of a manufacturing process
- Experimental studies on the possibility of using a pulsed laser for spot welding of thin metallic foils
- Angular position control system of pneumatic artificial muscles
- The properties of lubricated friction pairs with diamond-like carbon coatings
- Effect of laser beam trajectory on pocket geometry in laser micromachining
- Special Issue: Annual Engineering and Vocational Education Conference
- The Employability Skills Needed To Face the Demands of Work in the Future: Systematic Literature Reviews
- Enhancing Higher-Order Thinking Skills in Vocational Education through Scaffolding-Problem Based Learning
- Technology-Integrated Project-Based Learning for Pre-Service Teacher Education: A Systematic Literature Review
- A Study on Water Absorption and Mechanical Properties in Epoxy-Bamboo Laminate Composite with Varying Immersion Temperatures
- Enhancing Students’ Ability in Learning Process of Programming Language using Adaptive Learning Systems: A Literature Review
- Topical Issue on Mathematical Modelling in Applied Sciences, III
- An innovative learning approach for solar power forecasting using genetic algorithm and artificial neural network
- Hands-on Learning In STEM: Revisiting Educational Robotics as a Learning Style Precursor