A tool for finding inclusion clusters in steel SEM specimens
-
Anna-Mari Wartiainen
 ,
Markus Harju
,
Markus Harju

Abstract
Non-metallic inclusions, especially large or clustered inclusions, in steel are usually harmful. Thus, the microscopic analysis of test specimens is an important part of the quality control. This steel purity analysis produces a large amount of individual inclusion information for each test specimen. The interpretation of the results is laborious and the comparison of larger product groups practically impossible. The purpose of this study was to develop an easy-to-use tool for automatic interpretation of the SEM analysis to differentiate clustered and large inclusions information from the manifold individual inclusion information. Because of the large variety of the potential users, the tool needs to be applicable for any steel grade and application, both for liquid and final product specimen, to analyse automatically steel specimen inclusions, especially inclusion clusters, based on the INCA Feature program produced data from SEM/EDS. The developed tool can be used to improve the controlling of the steel purity or for automatic production of new inclusion cluster features that can be utilised further in quality prediction models, for example.
1 Introduction
The inclusions are in most cases detrimental to steel quality. Inclusion characteristics, including number, size distribution, chemical compositions, shapes, spatial distribution and clustering degree, have a significant impact on steel properties. Thus, in order to learn steel cleanliness, it is important to be able to analyse inclusion characteristics in steel specimen. [1, 2, 3, 4, 5, 6, 7, 8]
A typical test specimen from a steel product contains some thousands of inclusions, depending on the steel and the test type. An automatic Oxford INCA feature analysis program produces more than 15 features (including information about the location, size, area, aspect ratio, direction and chemical composition of the inclusion) for each inclusion that it differentiates from a scanning electron microscopy/energy dispersive spectroscopy (SEM/EDS) data of a steel specimen. However, the inclusion clusters may play a larger role for steel quality than the individual inclusions [8]. There is a need for an automated inclusion cluster analysis tool that enables the effective analysis of the test specimens in large scale and production of information about the most critical inclusion and inclusion cluster features.
Earlier the number density distribution, the area fraction, nearest neighbour spacing distribution or Dirichlet tessellation of the inclusions have been studied, as described in [1]. The studies have aimed to find out the homogeneity of inclusion spacing. The inclusion size distribution, especially the maximum inclusion size prediction, and cluster generation methods have been studied extensively.[1, 2, 3, 4, 9, 10]
The amount of process and quality data sources can be large in steel manufacturing. Often, the insufficient analytic skills or the lack of time prevent the effective use of this data, but intelligently designed presentation of the information derived from this data enables the support for the decision making [11]. The end user should be involved closely in the automated and smart decision support development. Poor design or low level of trust may lead to misuse or disuse of the system [12, 13, 14].
The contribution of this paper is a description of a novel tool for automated finding and analysing steel specimen inclusion clusters based on INCA Feature program produced inclusion data from SEM/EDS. The requirements for the tool include the applicability for any steel grade and application, and both for liquid and final product test specimens.
The tool described in this paper is the first step of a steel cleanliness analysing tool that would allow a rapid comparison of steel products and be applicable to a wide range of products. The final tool will provide a criterion for a steel cleanliness of the product applied to the whole manufacturing process.
The aim of the developed tool is not to directly predict inclusion cluster characteristics and their impact on the mechanical properties, although the tool is used to achieve knowledge of inclusions and using the achieved knowledge some prediction might also be done. Instead, the tool enables different kinds of testing and interpretations of the SEM/EDS results, depending on the user’s interests.
The next section describes the structure of the developed tool. The tool usage demonstration is then followed before discussion and conclusions.
2 The structure of the tool
For efficient usage of the tool, it is important that no additional work is needed for data preparation, especially, if a large number of specimens needs to be analysed. Therefore, the tool is capable of reading the original .xlsx-files created by INCA Feature program for SEM/EDS analysed specimen and finds inclusion clusters and provides summaries and visualisations for them. The tool can be used for testing different hypotheses, and for this purpose, the tool’s flexible parameter setting is especially helpful.
The starting point in our study was to begin with a simple modelling and to develop the model towards a more accurate modelling. The tool was built with the free statistical program R [15]. The purpose of the tool is to help analysing the data INCA Feature program provides in Excel sheet for any kind of specimen, e.g. both liquid and final product specimen, for any steel grade. The features that the INCA Feature program provides in Excel sheet for each inclusion, include the centre coordinates, the area, the length, the direction, the breadth and the composition as element weight per cents.
The tool finds inclusion clusters in SEM specimens and produces a summary for each cluster and for a set of clusters as well. The challenge is to find a trade-off between the accuracy of the modelling of the inclusions and the processing time for the analysis.
2.1 Inclusion shape approximation
Clusters are found by inspecting the Euclidean distance between the inclusions, which is the most used, simple, and easy to understand distance measure. In order to be able to calculate the distance, the inclusions are approximated in R program as an ellipse capable of imitating length, breadth and direction defined by the original INCA Feature data. Figure 1 presents an illustration, where the ellipse points have been distributed with 10∘ interval.
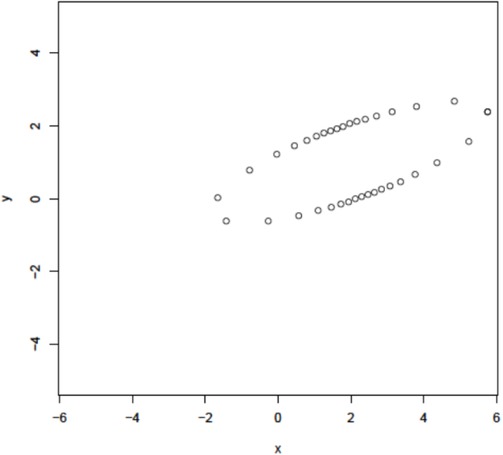
An ellipse used for approximating an inclusion in a steel specimen.
The size, the aspect ratio and the direction of each inclusion are critical features in the distance calculation, and thus, improve the accuracy significantly compared to the tools based on the distances between the centre points of the inclusions or between equivalent circles. Figure 2 presents a specimen with inclusions having various shapes, sizes and directions which are nicely characterised with ellipses. Currently, the elliptic approximation of an inclusion is based on 35 points, since the increase of the number of points would increase the calculation time as well.

Different shapes, sizes and directions of the inclusions in a steel specimen approximated with ellipses.
Elliptical presentation of the inclusions improves the interpretation of the actual importance of the inclusions in the specimen. In Figure 3, the upper plot presents the inclusions with equally sized dots similarly to INCA Feature presentation. The lower plot contains the elliptic approximations imitating the actual size of the inclusions. As can be seen, most of the inclusions are very small and insignificant and only a few of them are actually large. A falsely illustrated plot may also mislead the eye to find nonexistent clusters in the specimen.

Inclusions with equally sized points (top) and with ellipses (bottom). The elliptic presentation reveals the actual size of the inclusions.
The information for each cluster includes the number of the inclusions in the cluster with their ID numbers and chemical compositions and areas. The chemical compositions are classified based on the inclusion compositions in weight per cents available by the INCA Feature data. The classification for each inclusion is done by defining limits for the weight per cents and the classification for each cluster is the classified inclusion composition with the largest area in the cluster. The areas of the inclusions in a cluster are defined by the original INCA Feature data, not the ellipses. The tool also provides a number of different graphical summaries and visualisations.
2.2 Parameter setting
The tool has a flexible parametrisation for the cluster definition. The distance limit for any two inclusions to be included in the same cluster is one of the parameters that the user can set. The minimum length and the minimum area of a cluster are also user specified parameter values. In addition, the parameters provide a possibility to separately define the minimum lengths and areas for clusters to be shown in plots and in different parts of the specimen.
The combination of desired plots is also selected with parameters. The tool has three different chemical composition classifications with a different number of classes implemented, and the user can set a parameter to select one or all of these based on the preference. The user may set the parameters in a graphical user interface, see Figure 4. Default parameters which help starting to use the tool are read from a settings file.

Main window of the tool’s graphical user interface.
3 Demonstration of the tool usage
3.1 Usability and design
The basic requirement for the design of the tool was to be as user-friendly as possible. The close co-operation with the end users has been an important part of the tool development. The effortless usage of the tool in everyday work has been the main motivation in the design.
In the graphical user interface, the user is presented with a main window where all cluster analysis parameters can be set. The window includes buttons for all main operations. Specimen file(s) to be analysed may be selected from the local file system by pointing-and-clicking with a mouse. The tool is capable of analysing several files simultaneously. Numerical parameter values may be entered into text edit fields. Depending on the preference, several analysis parameters may be turned on or off by using check boxes and the desired chemical composition classification can be chosen from a drop-down list. For convenience, each user interface component is accompanied with a tool-tip for a short explanation of the parameter setting in question.
The rationale behind this approach is that this way the user can change settings faster and more easily than with command line approach. Parameters may be saved into and read from settings files at any time. Moreover, the tool indicates erroneous values and guides the user towards properly formatted settings.
The tool is able to analyse one specimen file and produce results for it in about 10 seconds for a typical specimen with some thousands of inclusions. Multiple specimen files can be provided at once allowing for batch processing of large amounts of data. The amount of inclusions in the original INCA Feature data file has a direct impact on the running time.
3.2 Output and results
The main function of the tool is to find inclusion clusters from the specimen and summarise these findings to the user in an effective way. Key results of the tool are (1) the cluster with most inclusions, (2) the longest cluster and (3) the largest cluster in terms of surface area. These results are given to the user both in numerical and graphical form. Visual information is easier to interpret, but the numbers can be utilised with other applications if necessary.
Figures 5, 6 and 7 present some examples of the produced plots. Each plot contains three subplots, where the specimen is depicted in increasing zoom levels from left to right. The location of the currently observed cluster is highlighted with a rectangle and the chemical composition of the cluster is indicated by using different colours in a plot. The horizontal and vertical axis represent the actual position of the cluster within the specimen. In addition, the user may choose to produce several plots in separate windows from all clusters exceeding a predefined length limit or area limit for more careful examination of their position and composition. All plots can be saved into image files (PDF and/or JPEG) automatically for archiving or presentation purposes, for examples. The names of the plots will be generated based on the original INCA Feature data file and the used parameters in order to minimise the chance for confusion and to guarantee the easy location of the plots. The option for automated actions saves working time during the analysis.

Cluster with most inclusions in the specimen.

Longest cluster found in the specimen.

Largest cluster found in the specimen.
The tool enables cluster location analysis for three regions (specimen is divided for lowest 1/3, middle, and highest 1/3 regions) and the clusters exceeding length, count and/or area limit are recorded per each region. Results of that operation are gathered into a tabular form for easy inspection.
As a high-level overview of the cluster lengths the tool provides histogram and distribution of cluster depths as a function of cluster lengths. Figure 8 reveals that most of the clusters belong to the shortest class, but some quite long clusters have been found as well. Figure 9 shows how the shortest clusters can be found at any depth of the specimen, while the longest clusters can be found mainly close to the top surface or near the centre line. In addition, a statistical summary is provided for cluster lengths, inclusion count and location information in terms of mean, median, minimum, maximum and 1st and 3rd quartiles.

Histogram showing the cluster length distribution in the specimen.

Distribution of clusters in terms of length and depth.
3.3 Demonstration of the actual use
When the product development engineers use the tool, they might try to locate features in the SEM/EDS analysis that could explain the mechanical properties of the product. The tool visualises effectively the inclusion clusters causing potential risks to the final product. Flanging is a machining step that sets high demands for the steel surface area. Inclusions that locate near the surface of the specimen increase the risk for failure in the bendability test.
Figure 10 presents a long inclusion cluster both in actual SEM photo and in the plot produced by the tool. The top of the plot corresponds to the bottom of the SEM photo. It can be seen that the similarity of the elliptic approximations to the actual inclusions is satisfactory. With the automated analysis of the tool, this inclusion line was located and labelled as a severe quality risk.With additional information, the user is capable of checking the chemical composition of the cluster and the summarised size information. This near surface located cluster is a good example of hazards that may risk the surface quality of a product during the machining step.

A long inclusion cluster as shown in the SEM specimen and as shown in the tool.
4 Discussion and Conclusions
This paper describes a novel tool for automated finding and analysing steel specimen inclusion clusters based on INCA Feature program produced data for SEM/EDS. The tool enables more effective use of the inclusion data that is produced in large amount for every test specimen in steel manufacturing. The advancement of the tool is that it can be applied for any steel grade and application, and both for liquid and final product specimen. It provides useful cleanliness information for steel engineers by processing further the data available from INCA Feature. This tool enables the study of inclusions in general and obtaining the composition of inclusions and clusters, or the study of only a certain type (composition) of inclusions.
The tool finds inclusion clusters in SEM specimens and produces a summary for each cluster and for a set of clusters. Visualisations of clusters are also provided. Clusters are found by inspecting the Euclidean distance between inclusions, which are each approximated as an ellipse with length, breadth and direction defined by the original INCA Feature data. The tool has a flexible parametrisation that enables the usage for any type of specimens.
There is a trade-off between the processing time and modelling accuracy. It was seen that an adequate level of accuracy is achieved by approximating the inclusions with ellipses and there is no need for more accurate modelling for this purpose and thus, the processing time can be kept at a reasonable level. The processing time has been decreased by optimising the code and could be further decreased eg. by applying parallel processing for segments of the steel specimen.
The tool was developed in close co-operation with the end users in order to guarantee the best possible use experience. There is no additional preparation required for the original INCA Feature data sheets, which enable the simultaneous analysis of several specimens. The GUI was designed based on the user’s preferences for default values, and the option for automated saving of the plots reduces the need for manual feeding. Next, the tool will be implemented for everyday use for laboratory assistants at SSAB, Europe (Raahe, Finland). They will be using the tool routinely for quality control and process status monitoring. Also, product and process development engineers are potential users of the tool. The produced numerical information about the clusters can be utilised for steel purity grading and also for quality prediction.
Acknowledgement
The authors thank SSAB Europe, Raahe for providing the data and their expertise for the tool. Further acknowledgements are given to Business Finland and Dimecc Oy and Centre for Advanced Steels Research (CASR) for supporting this research.
References
[1] Atkinson HV, Shi G. Characterization of inclusions in clean steels: a review including the statistics of extremes methods. Prog Mater Sci. 2003;48:457–520.10.1016/S0079-6425(02)00014-2Search in Google Scholar
[2] Michelic SK, Wieser G, Bernhard C. On the representativeness of automated SEM/EDS analyses for inclusion characterisation with special regard to the measured sample area. ISIJ Int. 2011;51:769–775.10.2355/isijinternational.51.769Search in Google Scholar
[3] Kanbe Y, Karasev A, Torodoki H, Jönsson PG. Application of Extreme value analysis for two- and three-dimensional determinations of the largest inclusion in metal samples. ISIJ Int. 2011;51:593–602.10.2355/isijinternational.51.593Search in Google Scholar
[4] Kaushik P, Lahmann J, Nadif M. State of the art in control of inclusions, their characterization, and future requirements. Metall 20 Mater Trans B. 2012; 43B:710–725.10.1007/s11663-012-9646-2Search in Google Scholar
[5] Kaushik P, Pielet H, Yin H. Inclusion characterisation – tool for measurement of steel cleanliness and process control: Part I. Ironmak and Steelmak. 2009;36:561–571.10.1179/030192309X12492910938131Search in Google Scholar
[6] Nuspl M, Wegscheider W, Angeli J, Posch W, Mayr M. Qualita25 tive and quantitative determination of micro-inclusions by automated SEM/EDX analysis. Anal Bioanal Chem. 2004;379:640–645.10.1007/s00216-004-2528-ySearch in Google Scholar PubMed
[7] Bartosiaki BG, Pereira JA, Bielefeldt WV, Vilele ACF. Assessment of inclusion analysis via manual and automated SEM and total oxygen content of steel. J Mater Res Technol. 2015;4:235–240.10.1016/j.jmrt.2015.01.008Search in Google Scholar
[8] Seleznev M, Wong KY, Stoyan D, Weidner A, Biermann H. Cluster detection of non-metallic inclusions in 42CrMo4 steel. Steel Res Int. 2018;89:180026. Available from: https://doi.org/10.1002/srin.20180021610.1002/srin.201800216Search in Google Scholar
[9] Beretta S, Murakami Y. Largest-extreme-value distribution analysis of multiple inclusion types in determining steel cleanliness. Metall Mater Trans B:2001;32B:517–523.10.1007/s11663-001-0036-4Search in Google Scholar
[10] Li T, Shimasaki S, Taniguchi S, Narita S. Reliability of inclusion statistic in steel by stereological methods. ISIJ Int. 2016;56:1625–1633.10.2355/isijinternational.ISIJINT-2016-269Search in Google Scholar
[11] Tamminen S, Tiensuu H, Ferreira E, Helaakoski H, Kyllönen V, Jokisaari J, et al. From measurements to knowledge - online quality monitoring and smart manufacturing. Advances in Data Mining, Applications and Theoretical Aspects. 2018;17–28.10.1007/978-3-319-95786-9_2Search in Google Scholar
[12] Parasuraman R, Manzey D. Complacency and bias in human use of automation: An attentional integration. Hum Factors. 2010;52:381–410.10.1177/0018720810376055Search in Google Scholar PubMed
[13] Lee J, See K. Trust in automation: Designing for appropriate reliance. Hum Factors. 2004;46:50–80.10.1518/hfes.46.1.50.30392Search in Google Scholar
[14] Haider H. The role of information reduction in skill acquisition, Cognitive Psychol. 1996;30:304–337.10.1006/cogp.1996.0009Search in Google Scholar PubMed
[15] R Core Team, R: A language and environment for statistical computing, R Foundation for Statistical Computing, Vienna, Austria, 2018. Available from: https://www.R-project.org/Search in Google Scholar
© 2020 A.-M. Wartiainen et al., published by De Gruyter
This work is licensed under the Creative Commons Attribution 4.0 International License.
Articles in the same Issue
- Regular Articles
- Fabrication of aluminium covetic casts under different voltages and amperages of direct current
- Inhibition effect of the synergistic properties of 4-methyl-norvalin and 2-methoxy-4-formylphenol on the electrochemical deterioration of P4 low carbon mold steel
- Logistic regression in modeling and assessment of transport services
- Design and development of ultra-light front and rear axle of experimental vehicle
- Enhancement of cured cement using environmental waste: particleboards incorporating nano slag
- Evaluating ERP System Merging Success In Chemical Companies: System Quality, Information Quality, And Service Quality
- Accuracy of boundary layer treatments at different Reynolds scales
- Evaluation of stabiliser material using a waste additive mixture
- Optimisation of stress distribution in a highly loaded radial-axial gas microturbine using FEM
- Analysis of modern approaches for the prediction of electric energy consumption
- Surface Hardening of Aluminium Alloy with Addition of Zinc Particles by Friction Stir Processing
- Development and refinement of the Variational Method based on Polynomial Solutions of Schrödinger Equation
- Comparison of two methods for determining Q95 reference flow in the mouth of the surface catchment basin of the Meia Ponte river, state of Goiás, Brazil
- Applying Intelligent Portfolio Management to the Evaluation of Stalled Construction Projects
- Disjoint Sum of Products by Orthogonalizing Difference-Building ⴱ
- The Development of Information System with Strategic Planning for Integrated System in the Indonesian Pharmaceutical Company
- Simulation for Design and Material Selection of a Deep Placement Fertilizer Applicator for Soybean Cultivation
- Modeling transportation routes of the pick-up system using location problem: a case study
- Pinless friction stir spot welding of aluminium alloy with copper interlayer
- Roof Geometry in Building Design
- Review Articles
- Silicon-Germanium Dioxide and Aluminum Indium Gallium Arsenide-Based Acoustic Optic Modulators
- RZ Line Coding Scheme With Direct Laser Modulation for Upgrading Optical Transmission Systems
- LOGI Conference 2019
- Autonomous vans - the planning process of transport tasks
- Drivers ’reaction time research in the conditions in the real traffic
- Design and evaluation of a new intersection model to minimize congestions using VISSIM software
- Mathematical approaches for improving the efficiency of railway transport
- An experimental analysis of the driver’s attention during train driving
- Risks associated with Logistics 4.0 and their minimization using Blockchain
- Service quality of the urban public transport companies and sustainable city logistics
- Charging electric cars as a way to increase the use of energy produced from RES
- The impact of the truck loads on the braking efficiency assessment
- Application of virtual and augmented reality in automotive
- Dispatching policy evaluation for transport of ready mixed concrete
- Use of mathematical models and computer software for analysis of traffic noise
- New developments on EDR (Event Data Recorder) for automated vehicles
- General Application of Multiple Criteria Decision Making Methods for Finding the Optimal Solution in City Logistics
- The influence of the cargo weight and its position on the braking characteristics of light commercial vehicles
- Modeling the Delivery Routes Carried out by Automated Guided Vehicles when Using the Specific Mathematical Optimization Method
- Modelling of the system “driver - automation - autonomous vehicle - road”
- Limitations of the effectiveness of Weigh in Motion systems
- Long-term urban traffic monitoring based on wireless multi-sensor network
- The issue of addressing the lack of parking spaces for road freight transport in cities - a case study
- Simulation of the Use of the Material Handling Equipment in the Operation Process
- The use of simulation modelling for determining the capacity of railway lines in the Czech conditions
- Proposals for Using the NFC Technology in Regional Passenger Transport in the Slovak Republic
- Optimisation of Transport Capacity of a Railway Siding Through Construction-Reconstruction Measures
- Proposal of Methodology to Calculate Necessary Number of Autonomous Trucks for Trolleys and Efficiency Evaluation
- Special Issue: Automation in Finland
- 5G Based Machine Remote Operation Development Utilizing Digital Twin
- On-line moisture content estimation of saw dust via machine vision
- Data analysis of a paste thickener
- Programming and control for skill-based robots
- Using Digital Twin Technology in Engineering Education – Course Concept to Explore Benefits and Barriers
- Intelligent methods for root cause analysis behind the center line deviation of the steel strip
- Engaging Building Automation Data Visualisation Using Building Information Modelling and Progressive Web Application
- Real-time measurement system for determining metal concentrations in water-intensive processes
- A tool for finding inclusion clusters in steel SEM specimens
- An overview of current safety requirements for autonomous machines – review of standards
- Expertise and Uncertainty Processing with Nonlinear Scaling and Fuzzy Systems for Automation
- Towards online adaptation of digital twins
- Special Issue: ICE-SEAM 2019
- Fatigue Strength Analysis of S34MnV Steel by Accelerated Staircase Test
- The Effect of Discharge Current and Pulse-On Time on Biocompatible Zr-based BMG Sinking-EDM
- Dynamic characteristic of partially debonded sandwich of ferry ro-ro’s car deck: a numerical modeling
- Vibration-based damage identification for ship sandwich plate using finite element method
- Investigation of post-weld heat treatment (T6) and welding orientation on the strength of TIG-welded AL6061
- The effect of nozzle hole diameter of 3D printing on porosity and tensile strength parts using polylactic acid material
- Investigation of Meshing Strategy on Mechanical Behaviour of Hip Stem Implant Design Using FEA
- The effect of multi-stage modification on the performance of Savonius water turbines under the horizontal axis condition
- Special Issue: Recent Advances in Civil Engineering
- The effects of various parameters on the strengths of adhesives layer in a lightweight floor system
- Analysis of reliability of compressed masonry structures
- Estimation of Sport Facilities by Means of Technical-Economic Indicator
- Integral bridge and culvert design, Designer’s experience
- A FEM analysis of the settlement of a tall building situated on loess subsoil
- Behaviour of steel sheeting connections with self-drilling screws under variable loading
- Resistance of plug & play N type RHS truss connections
- Comparison of strength and stiffness parameters of purlins with different cross-sections of profiles
- Bearing capacity of floating geosynthetic encased columns (GEC) determined on the basis of CPTU penetration tests
- The effect of the stress distribution of anchorage and stress in the textured layer on the durability of new anchorages
- Analysis of tender procedure phases parameters for railroad construction works
- Special Issue: Terotechnology 2019
- The Use of Statistical Functions for the Selection of Laser Texturing Parameters
- Properties of Laser Additive Deposited Metallic Powder of Inconel 625
- Numerical Simulation of Laser Welding Dissimilar Low Carbon and Austenitic Steel Joint
- Assessment of Mechanical and Tribological Properties of Diamond-Like Carbon Coatings on the Ti13Nb13Zr Alloy
- Characteristics of selected measures of stress triaxiality near the crack tip for 145Cr6 steel - 3D issues for stationary cracks
- Assessment of technical risk in maintenance and improvement of a manufacturing process
- Experimental studies on the possibility of using a pulsed laser for spot welding of thin metallic foils
- Angular position control system of pneumatic artificial muscles
- The properties of lubricated friction pairs with diamond-like carbon coatings
- Effect of laser beam trajectory on pocket geometry in laser micromachining
- Special Issue: Annual Engineering and Vocational Education Conference
- The Employability Skills Needed To Face the Demands of Work in the Future: Systematic Literature Reviews
- Enhancing Higher-Order Thinking Skills in Vocational Education through Scaffolding-Problem Based Learning
- Technology-Integrated Project-Based Learning for Pre-Service Teacher Education: A Systematic Literature Review
- A Study on Water Absorption and Mechanical Properties in Epoxy-Bamboo Laminate Composite with Varying Immersion Temperatures
- Enhancing Students’ Ability in Learning Process of Programming Language using Adaptive Learning Systems: A Literature Review
- Topical Issue on Mathematical Modelling in Applied Sciences, III
- An innovative learning approach for solar power forecasting using genetic algorithm and artificial neural network
- Hands-on Learning In STEM: Revisiting Educational Robotics as a Learning Style Precursor