Data analysis of a paste thickener
-
 ,
,

Abstract
The solids content of slurry is typically increased in thickeners. A clean overflow and maximum solids concentration in the underflow are the general targets. The flocculant rate and underflow rate are the two independent variables that are typically used for control. The dependent variables include rake torque, underflow density, overflow turbidity, solids interface level (bed depth), solids inventory (bed pressure), solids settling rate and underflow viscosity. The research problem in question is that the outgoing paste is sometimes difficult to pump. The phenomena leading to this situation are not well known. In the worst-case scenario these phenomena cause clogging in the piping. A data analysis has been done to find the variables that affect and correlate with the pumping problem. The scope of this study covers the measurements from the feed line, thickener and underflow. The goal is to gain better understanding of the phenomena after this phase. The data analysis was done using the paste line pressure difference as a response variable and by dividing the data collected from Yara’s Siilinjärvi mill into two parts: operation areas with high and low pressure difference. The analysis is focused on Thickener 1 due to better availability of measurements. The knowledge of the variables found to influence the pressure difference can be utilized in further development.
1 Introduction
The modern world is highly dependent on materials. The saying: “What you can’t grow, you need to dig” is true and it means that people need different kinds of materials to produce tools and necessities for their day-to-day use. As a result, mining is becoming a more and more important branch of industry. A lot of attention is being paid to make it as efficient as possible. As the amount of rock crushed increases, the amount of waste rock also increases. For example, the tailings from flotation circuits contain a lot of water and it is beneficial to reduce the water content before storing in tailings ponds. A paste thickener can be used to lower the water content. The aim is to investigate the behaviour and variables that affect the paste-thickening vessel in order to make the operation cost-efficient. Thickening is the most economical of several dewatering techniques. The thickening process normally occurs in large-diameter tanks where solid particles settle under the influence of gravity, i.e. sedimentation. Jewell et al. [1] raise a valid challenge in the debate: the operation of paste thickeners has various practical problems. One of them is a narrow operating window as a small change in the underflow solids concentration may have a major impact on the properties (for example pumpability and flowability) of the underflow. Consequently, the control of the paste thickener can be challenging.
Different methods are used to control the paste thickener. Tan, Bao and Bickert [2] propose a model predictive control with rake torque constraint. Chai, Li and Wang [3] and Chai et al. [4] propose an intelligent switching control which includes an underflow slurry flow-rate (USF) pre-setting unit and a fuzzy reasoning-based USF set-point compensator. The switching mechanism uses rule-based reasoning. Langlois and Cipriano [5] have introduced a dynamic simulator for the thickener which can be utilized to develop different kinds of control strategies. Remes, Aaltonen and Koivo [6] have developed a Kalman filter based soft sensor to monitor the thickener operation to reduce process disturbances. Bergh, Ojeda and Torres [7] have introduced the expert control tuning of an industrial thickener. Segovia, Concha and Sbarbaro [8] tested different thickener control strategies using a calibrated simulator, pointing out the weaknesses and giving hints for improving their performance.
The research problem in question is that the paste exiting the thickener is sometimes difficult to pump. The phenomena leading to this situation are not well known. In the worst-case scenario these phenomena cause clogging in the piping. This leads to a need for extra maintenance and even stoppages, therefore it would be beneficial to understand these phenomena better. In this paper, we concentrate on the data analysis of a paste thickener to find the affecting factors, utilizing a data set from an industrial thickener.
2 Process description and data set
The only phosphate mine in the EU is the Yara mine located in Siilinjärvi, Finland. The product of the ore extracted from the open pits is apatite concentrate, from which fertilizers and phosphoric acid are the final products. The total ore mined annually is 11 Mt and the production of apatite concentrate is 1 Mt.
The solids content of the slurry is typically raised in thickeners. A clean overflow and maximum solid concentration in the underflow are the general targets. Agglomerates of solids are formed using flocculants to increase the settling rate and improve the overflow clarity. Very high on-line operation availability is required from a thickener. Many industrial sectors use these vessels.
A typical thickener used in mineral processing is illustrated in Figure 1. The flocculant rate and underflow rate are the two independent variables which are typically used for control. The feed rate is only used in an emergency to avoid disturbances to plant production. The dependent variables include rake torque, underflow density, overflow turbidity, solids interface level (bed depth), solids inventory (bed pressure), solids settling rate and underflow viscosity [7].
![Figure 1 A typical thickener used in mineral processing [7]](/document/doi/10.1515/eng-2020-0038/asset/graphic/j_eng-2020-0038_fig_001.jpg)
A typical thickener used in mineral processing [7]
The data set used for data analysis contains data from both of Yara’s paste thickeners, but after discussions with plant experts the data analysis was limited to Thickener 1. The whole data set contained altogether 73 measurements from February 2017 to February 2018. The frequency of measurements wasone per minute. In the actual data analysis, twenty-six variables from the thickener feed, thickener and paste line were used. Information about the performance optimization of paste thickening can be found for example in [9].
3 Results and discussion
3.1 Data pre-processing
The rows containing NaN (not a number) were removed. The periods when the values of the pressure difference of the paste line (i.e. response variable) did not change were removed. Four feed and three Thickener 1 measurements were delayed for eight hours because the thickener delay was estimated to be eight hours. The delay value was defined by the mill experts based on their knowledge of the process. Six data sets were formed using the booster pumps and the paste line pressure difference as dividers. Only periods of over one day were accepted as a usage period. This was defined by the value of the current in amperes measurement. If the value was over 50, the pump was deemed to be in use.
Division into operation areas was made based on the pressure difference of the paste line. The histograms in Figure 2. illustrate the numbers of data points with different pressure differences. The bin size of the histogram is 0.5 bar. As the pressure difference fifteen-minute average is over 13 bars, it belongs in the high-pressure difference operation area. When the pressure difference is lower, it belongs in the low-pressure difference operation area. Two different booster pumps, KA7402 and KA7403, were used.

Dividing the data based on pressure difference (X-axis paste line pressure difference and Y-axis the number of values divided into different bins)
3.2 Data analysis
3.2.1 Correlation
The linear Pearson correlation coefficients between input and response variables were calculated and are presented in Figure 3.

Correlation coefficients in different operation areas
The correlations in the whole operation area and the low pressure difference are mostly close to each other. In the high pressure difference operation area the correlations are weak (close to zero). Next, the variables with a correlation higher than 0.5 were taken for closer analysis. A couple of variables are presented in Figure 4, which shows that there are two different operating conditions. This is clearest between variable 18 and the paste line pressure difference. For example, between ten and thirty bars, two different positive correlating tubes can be observed.

Scatter graphs between variables: Outotec Analyzer 1, Paste line 1, Thickener 12, Thickener 14 and response during the usage of booster pump KA7403
It can be concluded that dividing the data between high pressure and low pressure difference operation areas is not enough to explain all the interactions within the process. Based on the correlations, no single variable can be found that could explain the changes within the pressure difference. From the data, two different operating conditions can be determined. Let us try to determine these operating conditions using clustering.
3.2.2 Clustering
The data from variable Paste line 1 and the pressure difference during the usage of booster pump KA7403 was clustered using k-means. The cosine parameter was used as a distance measure. Two and three clusters were tested. The result is presented in Figure 5. The data tubes can be reasonably identified in the three cluster cases. The correlations are presented in section 3.2.3. Clustering was also done for KA7402, but the result was not as good as for KA7403.

Clusters from variable Paste line 1 and response during the usage of booster pump KA7403; on the left there are the two cluster cases and on the right three cluster cases
3.2.3 Correlation coefficients in clusters
Correlation coefficients for three clusters of booster pump KA7403 are presented in Figure 6. When comparing the results to those presented in Figure 3, significant differences can be seen:

Correlation coefficients for three clusters of booster pump KA7403
Thickener 1 – 5 variables: correlations are now around 0.4-0.6 compared to earlier −0.1-0.
Outotec Analyzer 1, Outotec Analyzer 2, Paste line 1 and Thickener 12 variables: correlations are strong in cluster1, earlier they were lower.
In addition, in Figure 6 the variables of Outotec Analyzer 1 and Outotec Analyzer 2 have stronger negative correlation in cluster 1 than in cluster 3. In other words, as the values of these variables decrease, the paste line pressure difference increases more clearly in the operation area of cluster 1. Although the variables of Thickener 1 - 5 had stronger correlation in cluster 3 than in cluster1, the same observation can be made for the variables of Paste line 1 and Thickener 12 too.
3.3 Multivariable linear regression
A multivariable linear regression (MLR) model is given by Harrel [10]:
where y is the output variable (N×1), X is the input variable matrix (N×M) and b is the vector of regression coefficients (M×1). N is the number of data points and M is the number of variables. It should be noted that the equation above is written for a single output variable. The regression coefficients are obtained as the least squares’ solution given by
The MLR model structure can capture the major interactions even though it is limited to linear relationships.
3.3.1 Data sets for booster pumps KA7402 and KA7403
Linear regression models for both booster pumps were created separately. Modelling was done using repeated 10-fold cross-validation and a testing data set. The data set was divided so that 20% of the data was chosen randomly for the testing data set. The rest of the data set was used in cross-validation, thus forming the training data set and internal validation data set. The model was optimized on the grounds of the internal validation data set. R2 and RMSE were used as the criteria. The response was scaled between 0 and 1. Variables for the models were selected using the forward selection method. The modelling results are presented in Tables 1 and 2.
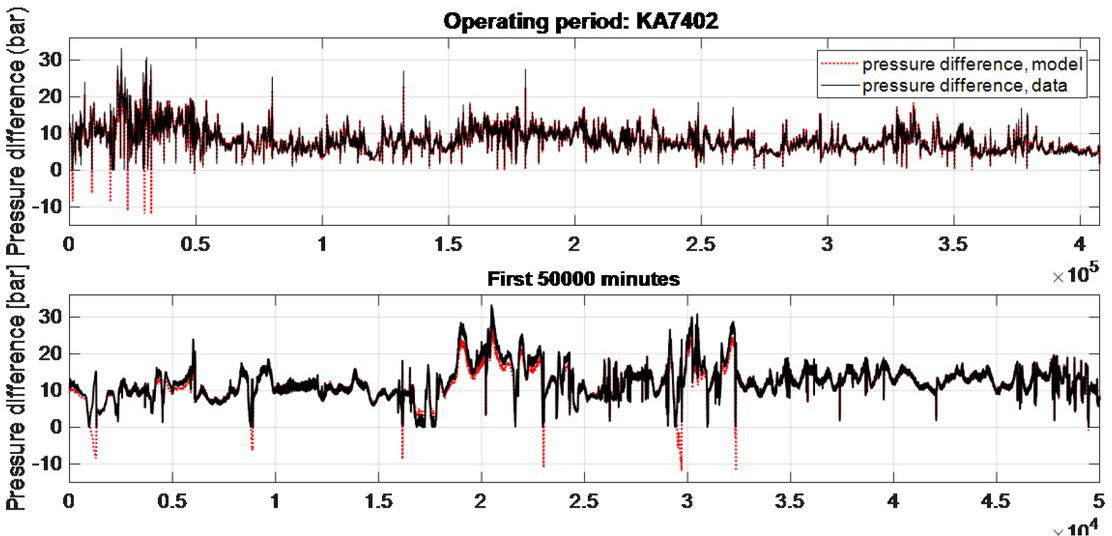
Fitting of best model to training data set for booster pump KA7402
Selected variables and modelling result for booster pump KA7402
| R2 | RMSE | |||
|---|---|---|---|---|
| Variables | Training | Testing | Training | Testing |
| 1.var:PL1 | 0.7362 | 0.7421 | 0.0485 | 0.0478 |
| 2.var:PL2 | 0.9081 | 0.9072 | 0.0286 | 0.0286 |
| 3.var:T16 | 0.9104 | 0.9096 | 0.0282 | 0.0283 |
| 4.var:T2 | 0.9126 | 0.9120 | 0.0279 | 0.0279 |
| 5.var:T4 | 0.9147 | 0.9135 | 0.0276 | 0.0277 |
Selected variables and modelling result for booster pump KA7403
| R2 | RMSE | |||
|---|---|---|---|---|
| Variables | Training | Testing | Training | Testing |
| 1.var:T14 | 0.4105 | 0.4056 | 0.1013 | 0.1018 |
| 2.var:T12 | 0.4586 | 0.4602 | 0.0971 | 0.0970 |
| 3.var:T15 | 0.4893 | 0.4909 | 0.0943 | 0.0942 |
| 4.var:OA2 | 0.5100 | 0.5112 | 0.0924 | 0.0923 |
| 5.var:T17 | 0.5215 | 0.5244 | 0.0913 | 0.0910 |
Figure 7 shows that the best model works well overall, but in some situations, it estimates the pressure difference to be negative. This indicates that the variables of the model do not explain the pressure difference correctly in all situations.
4 Summary
The strongest interactions between the variables and pressure difference for booster pump KA7402 were:
Based on correlation: variable Paste line 1
Based on regression: variables Paste line 1, Paste line 2, Thickener 16 and Thickener 2
Similar interactions for booster pump KA7403 were:
Based on correlation: variable Thickener 14
Based on regression: variables Thickener 14, Thickener 12, Thickener 15, Outotec Analyzer 2 and Thickener 17.
The process was analysed by dividing the data first into high and low pressure difference operation areas and then clustering the data from the variable of Paste line 1 and the response variable. As a summary, it can be stated that clustering has a major effect on correlation. However, there is a great risk of drawing misleading conclusions unless sufficient process knowledge is available.
When drawing scatter diagrams, it was noted that there are at least two operation areas in the process. The affecting variables were not investigated at this stage, but via modelling it can be assumed that there may be more operation areas, especially in the high pressure difference area.
The paste line pressure difference can be estimated promisingly using linear regression models, especially during usage of booster pump KA7402.
At this stage of data analysis, the analysis has been restricted to assuming that the pumping problem occurs when the paste line pressure difference is over 13 bar. This is by no means the whole truth, as often the quality is good with high pressure differences. However, when the pressure difference grows extremely high it will cause problems. Moreover, some sort of indicator would be needed to tell when there really are pumping problems. This is not known precisely, even by the process operators them-selves. This limitation was used to be able to observe which variables have an effect on pressure difference and how they differ in high and low pressure difference operation areas. Through data analysis, the behaviour of the process was understood better. It was noted that the low pressure difference area behaves more smoothly and is easier to control. The high pressure difference area shows high variance, meaning that operating conditions change more, making process control more challenging. There are many operation areas which need to be identified in order to define the variables leading to a problem situation, to investigate the dynamics and to be able to predict the problem.
References
[1] Jewell RJ, Fourie AB, Lord ER. Paste and Thickened Tailings: A 50 Guide. Australian Centre for Geomechanics, University of Western Australia; 2002.Search in Google Scholar
[2] Tan CK, Bao J, Bickert G. A study on model predictive control in paste thickeners with rake torque constraint, J. Miner Eng. 2017;105:52–62. 5510.1016/j.mineng.2017.01.011Search in Google Scholar
[3] Chai T, Li H, Wang H. An intelligent switching control for the intervals of concentration and flow-rate of underflow slurry in a mixed separation thickener, IFAC Proceedings Volumes, Volume 47, 2014, 338-34510.3182/20140824-6-ZA-1003.02114Search in Google Scholar
[4] Chai T, Jia Y, Li H, Wang H. An intelligent switching control 60 for a mixed separation thickener process. Control Eng Pract. 2016;57:61–71.10.1016/j.conengprac.2016.07.007Search in Google Scholar
[5] Langlois JI, Cipriano A. Dynamic modeling and simulation of tailing thickener units for the development of control strategies. Miner Eng. 2019;131:131–9. 65 https://doi.org/10.1016/j.mineng.2018.11.00610.1016/j.mineng.2018.11.006Search in Google Scholar
[6] Remes A, Aaltonen J, Koivo H. Soft-sensor estimation of an apatite thickener operation at the Siilinjärvi concentrator, IFAC Proceedings Volumes, Volume 42, 2009, 167-17210.3182/20091014-3-CL-4011.00031Search in Google Scholar
[7] Bergh L., Ojeda P., Torres L., Expert control tuning of an industrial thickener, IFAC-PapersOnLine, 2015, 48-17, 086-091 7010.1016/j.ifacol.2015.10.083Search in Google Scholar
[8] Segovia JP, Concha F, Sbarbaro D. On the control of sludge level and underflow concentration in industrial thickeners, IFAC Proceedings Volumes, Volume 44, 2011, 8571-857610.3182/20110828-6-IT-1002.02667Search in Google Scholar
[9] Ruhanen E, Kosonen M, Kauvosaari S, Meintjes C. Performance optimization of paste thickening at the Yara Siilinjärvi Plant. In 75 R.J. Jewell and A.B. Fourie (Eds.), Paste 2018 - Proceedings of the 21st international seminar on paste and thickened tailings, Perth, Australia: Australian Centre for Geomechanics, 75-8810.36487/ACG_rep/1805_06_KosonenSearch in Google Scholar
[10] Harrell FE Jr. Regression modelling strategies with applications to linear models, logistic regression, and survival analysis. New 80 York. Springer; 2001. https://doi.org/10.1007/978-1-4757-3462-110.1007/978-1-4757-3462-1Search in Google Scholar
© 2020 J. Ruuska et al., published by De Gruyter
This work is licensed under the Creative Commons Attribution 4.0 International License.
Articles in the same Issue
- Regular Articles
- Fabrication of aluminium covetic casts under different voltages and amperages of direct current
- Inhibition effect of the synergistic properties of 4-methyl-norvalin and 2-methoxy-4-formylphenol on the electrochemical deterioration of P4 low carbon mold steel
- Logistic regression in modeling and assessment of transport services
- Design and development of ultra-light front and rear axle of experimental vehicle
- Enhancement of cured cement using environmental waste: particleboards incorporating nano slag
- Evaluating ERP System Merging Success In Chemical Companies: System Quality, Information Quality, And Service Quality
- Accuracy of boundary layer treatments at different Reynolds scales
- Evaluation of stabiliser material using a waste additive mixture
- Optimisation of stress distribution in a highly loaded radial-axial gas microturbine using FEM
- Analysis of modern approaches for the prediction of electric energy consumption
- Surface Hardening of Aluminium Alloy with Addition of Zinc Particles by Friction Stir Processing
- Development and refinement of the Variational Method based on Polynomial Solutions of Schrödinger Equation
- Comparison of two methods for determining Q95 reference flow in the mouth of the surface catchment basin of the Meia Ponte river, state of Goiás, Brazil
- Applying Intelligent Portfolio Management to the Evaluation of Stalled Construction Projects
- Disjoint Sum of Products by Orthogonalizing Difference-Building ⴱ
- The Development of Information System with Strategic Planning for Integrated System in the Indonesian Pharmaceutical Company
- Simulation for Design and Material Selection of a Deep Placement Fertilizer Applicator for Soybean Cultivation
- Modeling transportation routes of the pick-up system using location problem: a case study
- Pinless friction stir spot welding of aluminium alloy with copper interlayer
- Roof Geometry in Building Design
- Review Articles
- Silicon-Germanium Dioxide and Aluminum Indium Gallium Arsenide-Based Acoustic Optic Modulators
- RZ Line Coding Scheme With Direct Laser Modulation for Upgrading Optical Transmission Systems
- LOGI Conference 2019
- Autonomous vans - the planning process of transport tasks
- Drivers ’reaction time research in the conditions in the real traffic
- Design and evaluation of a new intersection model to minimize congestions using VISSIM software
- Mathematical approaches for improving the efficiency of railway transport
- An experimental analysis of the driver’s attention during train driving
- Risks associated with Logistics 4.0 and their minimization using Blockchain
- Service quality of the urban public transport companies and sustainable city logistics
- Charging electric cars as a way to increase the use of energy produced from RES
- The impact of the truck loads on the braking efficiency assessment
- Application of virtual and augmented reality in automotive
- Dispatching policy evaluation for transport of ready mixed concrete
- Use of mathematical models and computer software for analysis of traffic noise
- New developments on EDR (Event Data Recorder) for automated vehicles
- General Application of Multiple Criteria Decision Making Methods for Finding the Optimal Solution in City Logistics
- The influence of the cargo weight and its position on the braking characteristics of light commercial vehicles
- Modeling the Delivery Routes Carried out by Automated Guided Vehicles when Using the Specific Mathematical Optimization Method
- Modelling of the system “driver - automation - autonomous vehicle - road”
- Limitations of the effectiveness of Weigh in Motion systems
- Long-term urban traffic monitoring based on wireless multi-sensor network
- The issue of addressing the lack of parking spaces for road freight transport in cities - a case study
- Simulation of the Use of the Material Handling Equipment in the Operation Process
- The use of simulation modelling for determining the capacity of railway lines in the Czech conditions
- Proposals for Using the NFC Technology in Regional Passenger Transport in the Slovak Republic
- Optimisation of Transport Capacity of a Railway Siding Through Construction-Reconstruction Measures
- Proposal of Methodology to Calculate Necessary Number of Autonomous Trucks for Trolleys and Efficiency Evaluation
- Special Issue: Automation in Finland
- 5G Based Machine Remote Operation Development Utilizing Digital Twin
- On-line moisture content estimation of saw dust via machine vision
- Data analysis of a paste thickener
- Programming and control for skill-based robots
- Using Digital Twin Technology in Engineering Education – Course Concept to Explore Benefits and Barriers
- Intelligent methods for root cause analysis behind the center line deviation of the steel strip
- Engaging Building Automation Data Visualisation Using Building Information Modelling and Progressive Web Application
- Real-time measurement system for determining metal concentrations in water-intensive processes
- A tool for finding inclusion clusters in steel SEM specimens
- An overview of current safety requirements for autonomous machines – review of standards
- Expertise and Uncertainty Processing with Nonlinear Scaling and Fuzzy Systems for Automation
- Towards online adaptation of digital twins
- Special Issue: ICE-SEAM 2019
- Fatigue Strength Analysis of S34MnV Steel by Accelerated Staircase Test
- The Effect of Discharge Current and Pulse-On Time on Biocompatible Zr-based BMG Sinking-EDM
- Dynamic characteristic of partially debonded sandwich of ferry ro-ro’s car deck: a numerical modeling
- Vibration-based damage identification for ship sandwich plate using finite element method
- Investigation of post-weld heat treatment (T6) and welding orientation on the strength of TIG-welded AL6061
- The effect of nozzle hole diameter of 3D printing on porosity and tensile strength parts using polylactic acid material
- Investigation of Meshing Strategy on Mechanical Behaviour of Hip Stem Implant Design Using FEA
- The effect of multi-stage modification on the performance of Savonius water turbines under the horizontal axis condition
- Special Issue: Recent Advances in Civil Engineering
- The effects of various parameters on the strengths of adhesives layer in a lightweight floor system
- Analysis of reliability of compressed masonry structures
- Estimation of Sport Facilities by Means of Technical-Economic Indicator
- Integral bridge and culvert design, Designer’s experience
- A FEM analysis of the settlement of a tall building situated on loess subsoil
- Behaviour of steel sheeting connections with self-drilling screws under variable loading
- Resistance of plug & play N type RHS truss connections
- Comparison of strength and stiffness parameters of purlins with different cross-sections of profiles
- Bearing capacity of floating geosynthetic encased columns (GEC) determined on the basis of CPTU penetration tests
- The effect of the stress distribution of anchorage and stress in the textured layer on the durability of new anchorages
- Analysis of tender procedure phases parameters for railroad construction works
- Special Issue: Terotechnology 2019
- The Use of Statistical Functions for the Selection of Laser Texturing Parameters
- Properties of Laser Additive Deposited Metallic Powder of Inconel 625
- Numerical Simulation of Laser Welding Dissimilar Low Carbon and Austenitic Steel Joint
- Assessment of Mechanical and Tribological Properties of Diamond-Like Carbon Coatings on the Ti13Nb13Zr Alloy
- Characteristics of selected measures of stress triaxiality near the crack tip for 145Cr6 steel - 3D issues for stationary cracks
- Assessment of technical risk in maintenance and improvement of a manufacturing process
- Experimental studies on the possibility of using a pulsed laser for spot welding of thin metallic foils
- Angular position control system of pneumatic artificial muscles
- The properties of lubricated friction pairs with diamond-like carbon coatings
- Effect of laser beam trajectory on pocket geometry in laser micromachining
- Special Issue: Annual Engineering and Vocational Education Conference
- The Employability Skills Needed To Face the Demands of Work in the Future: Systematic Literature Reviews
- Enhancing Higher-Order Thinking Skills in Vocational Education through Scaffolding-Problem Based Learning
- Technology-Integrated Project-Based Learning for Pre-Service Teacher Education: A Systematic Literature Review
- A Study on Water Absorption and Mechanical Properties in Epoxy-Bamboo Laminate Composite with Varying Immersion Temperatures
- Enhancing Students’ Ability in Learning Process of Programming Language using Adaptive Learning Systems: A Literature Review
- Topical Issue on Mathematical Modelling in Applied Sciences, III
- An innovative learning approach for solar power forecasting using genetic algorithm and artificial neural network
- Hands-on Learning In STEM: Revisiting Educational Robotics as a Learning Style Precursor