The impact of the truck loads on the braking efficiency assessment
-
 ,
,

Abstract
The paper deals with possibilities of assessment of braking efficiency during evaluation of braking system at technical inspection of trucks in conditions of the Slovak Republic. The braking efficiency of the vehicle is evaluated by measuring the braking forces at the roller brake tester. The magnitude of these forces also depends on the loads of the measured vehicle. The paper analyses the results of the practical tests of the braking efficiency measurement of a truck of category N3 and of a vehicle combination consisting of vehicles of category N3 and O4. The analysed vehicle combination was gradually loaded in four different ways and a special situation was the measurement of the braking efficiency of the tractor itself. The instantaneous load on each axle was recorded with portable axle weights. The braking efficiency evaluation was carried out in accordance with the valid methodology, which allows the application of the direct evaluation method, the method of linear extrapolation, the method of the reference braking forces and the indicative evaluation. A vehicle with the same braking system may be assessed as roadworthy or not roadworthy. This is due to the application of different methods of evaluating the braking efficiency and different way of loads at the loading area.
1 Introduction
The braking efficiency is the ability of the brake to reduce the vehicle speed up to a possible stop, to maintain a certain speed of the descending vehicle on a slope, or to keep the vehicle on a slope [1]. When discussing the braking efficiency, it is advisable to distinguish which brake system was built into the vehicle. The construction of the brake system parts depends on its function. Depending on this, the braking is divided into service, parking, emergency, relieving, automatic and inertia. During the technical inspection, the technician not only evaluates the service brake with its functional parts, but also checks the other types of in-vehicle braking systems, if vehicle is equipped with them. These systems differ from each other in terms of construction, therefore the methods of their diagnosis and the expression of the braking efficiency itself also differ. For example, an expression of the efficiency for the service and parking brakes. Both the parking brake and the service brake apply a different method of assessing their suitability.
The brake system inspections of vehicles of categories M1 with a maximum allowed mass exceeding 3.5 tonnes, M2, M3, N2, N3, O3, and O4 are carried out under the conditions of periodic technical inspections on the basis of Methodical Instruction No. 74/2018 in the Slovak Republic. The Regulation lays down the procedure for inspecting these vehicle categories at the roller brake test facilities for the following control items: service brake performance, service brake efficiency, parking brake performance and parking brake efficiency [2, 3].
In order to assess the braking performance of trucks for the purpose of this paper, the performance and efficiency of the service brake were evaluated. The effect of the service brake is expressed in the Methodical Instruction No. 74/2018 [1] by braking ratio. The braking ratio is the ratio of the sum of the braking forces attained for a particular type of braking and the gravity of the tested vehicle. Braking ratio is expressed as a percentage. This methodical instruction also sets the minimum braking ratio value for specific vehicle categories depending on the date of first registration or the date of their approval and also the presence of the ABS system. Vehicles of categories L, M, N, O, T, R and Ps shall be capable of attaining the prescribed minimum braking efficiency in terms of braking ratio with the service brake. The values of prescribed minimum braking ratios are given in Table 1 [1, 4].
The values of prescribed minimum braking ratios. Source: [1]
| Vehicle category | Minimal Braking ratio Zmin (%) | |
|---|---|---|
| Vehicles registered for the first time since 1.1.2012 | Vehicles registered for the first time before 1.1.2012 | |
| N1 | 50% | 40% |
| M1 | 58% | 50% |
| and for vehicles without ABS or approved before 1.10.1991 48% | ||
| M2 a M3 | 50% | 50% |
| and for vehicles without ABS or approved before 1.10.1991 48% | ||
| N2 a N3 | 50% | for vehicles registered for the first time after 1988 45% and for others |
| 43% | ||
| O2, O3 a O4 | 45% for semi-trailers, 50% for drawbar trailers | for semi-trailers and drawbar trailers registered for the first time after 1988 and 40% for others |
2 The methodology of assessing the service brake efficiency
The procedure for evaluating the braking efficiency of the truck’s service brake shall be determined according to the construction of the vehicle’s brake system, the vehicle’s control connections and the available brake system data. In the case of trucks there is a pneumatic system and therefore we can follow all four available methods of evaluating the braking performance: Direct evaluation method, Reference forces method, Linear extrapolation method, Indicative evaluation method [5, 6].
2.1 Direct evaluation method
The method is based on a direct evaluation of the braking efficiency of the vehicle without measuring the control air pressure or brake pressure. The braking efficiency is obtained on the basis of the braking ratio calculated from the braking forces measured on the roller brake tester on a partially or fully loaded vehicle [5, 7,8,9].
The braking forces measured at the roller brake tester shall be used to calculate the braking ratio according Equation (1) that the vehicle would have achieved under the same braking forces under load conditions at the maximum permissible gross mass:
where:
Z - braking ratio [%],
ΣBvi - sum of the braking forces at the circumference of theaxle wheels i [N],
mc - maximum permissible gross mass of the vehicle [kg][1, 8, 10].
2.2 Reference forces method
The method is based on evaluating the braking efficiency of the vehicle by comparing the achieved braking forces at a defined braking pressure on all wheels of the vehicle with the reference braking forces data specified by the vehicle manufacturer. This method may only be used if the necessary brake system data (reference braking forces) are available and the vehicle is equipped with functional control brake pressure connections [9, 11, 12, 13].
On each axle of the vehicle, the sum of the measured braking forces on each wheel is compared with the corresponding reference braking force according Equation (2). If for each axle of the vehicle meet:
then the service brake of the vehicle achieves the prescribed minimum braking efficiency [1, 10, 14, 15].
At the time of the measurement, the technical inspection’s information system of did not provide Volvo brake reference force data or Schwarzmuller reference brake force data. That is why it was not possible to use this method to evaluate the braking efficiency of the semitrailer vehicle combination.
2.3 Linear Extrapolation method
This method is based on the evaluation of the dependence of the braking forces measured on roller brake tester from the braking pressure measured through the control connections. The extrapolation is applied to a theoretical condition corresponding to the minimum air pressure in the service brake system with the brake pedal fully depressed and with vehicle which is loaded to the maximum permissible total mass. In the case of a trailer inspection, the towing vehicle to which it is coupled in the combination shall be capable of at least the pressure values prescribed by the trailer’s manufacturer in the charging and control lives (generally at least 800 kPa in the charging line and at least 650 kPa in control line).
From the braking pressure values measured on the roller brake tester, an extrapolation constant ii is calculated for each axle of the vehicle separately according Equation (3):
where:
pmci - minimum service brake circuit pressure on the axle i at full depressed brake pedal of the vehicle loaded to the maximum permissible gross weight (kPa). If this is not known, a pmci value of 800 kPa shall be used for each axle of the motor vehicle. In the case of a trailer, a pmci of 650 kPa shall be used for each axle,
pni - pressure at the beginning of braking applied of the axle i (kPa); if the beginning of braking applied pressure value cannot be unambiguously determined during the measurement, a constant value of 40 kPa shall be used for the calculation.
pi - braking pressure at which the maximum braking forces on the axle i in (kPa) have been achieved on the roller brake tester [1, 6, 16, 17, 18].
The values measured on the roller brake tester and the extrapolation constants of all axles are used to calculate the vehicle braking ratio. This braking ratio is extrapolated to the theoretical state corresponding to the minimum braking pressure when the brake pedal is fully depressed, and the vehicle is loaded for the maximum permissible gross mass according to the Equation (4):
where:
Z - braking ratio [%],
ΣBvi - sum of the braking forces at the circumference of theaxle wheels i [N],
ii - extrapolation constants of the axle i,
mc - maximum permissible gross mass of the vehicle [kg][1].
2.4 Indicative Evaluation method
The method is based on evaluating the braking performance of a vehicle by achieving all-wheel lock when measuring braking forces on a partially or fully loaded vehicle on a roller brake tester. This method can only be used if the vehicle being inspected is not equipped with brake pressure control connections or if the vehicle’s pressure control connections are not functional and other methods described in this Guideline cannot be used (e.g. due to unavailability of inspected vehicle’s brake technical data). Using the method with reduced friction coefficient of roller brake tester cylinders surface (e.g. wet) can lead to incorrect vehicle evaluation. The evaluation using this method is only indicative in comparison with the above methods and corresponds only to the instantaneous load condition of the vehicle [19, 20, 21].
This method is inapplicable in both cases of the vehicles tested, as they are subject to the obligation to be fitted with control pressure connections as they are registered for the first time after 31.12.1994 [2, 13, 22].
3 Measurement procedure and braking efficiency results
The analysis of the service brake efficiency was performed on a Volvo FH 460 N3 tractor and a Schwarzmüller SPA / 3EE O4 semi-trailer. The measurements were carried out at the Station of Technical Inspection in Kysucké NovéMesto. The MAHA Eurosystem LKW IW 4 LON measuring device is used to measure the service brake efficiency in a given Station of Technical Inspection. The decisive factor in measuring the braking efficiency was the load on the vehicle by different load distribution variants. We simulated real performance at the Station of Technical Inspection according to generally binding and valid methodologies. When measuring the load on the individual axles of the vehicle, we used portable scales of the brand Tenzováhy type PV-10. It is a system used for control weighing by both state authorities and private companies. The portable scales can be used in both static and dynamic mode (while driving).
The following load variants of the vehicle combination were simulated:
Measurement No.1 - Maximum semi-trailer load,
Measurement No.2 - Load of the front part of the semi-trailer,
Measurement No.3 - Load of the rear part of the semitrailer,
Measurement No.4 - Unloaded semi-trailer,
Measurement No.5 - Tractor without semi-trailer.
The load on the individual axles varied depending on how the goods were distributed in the loading area of the semi-trailer. The goods consisted of pallet units with the same weight of approximately 1.33 tons. The load of individual axles of tractor and semi-trailer measured by axle scales PV-10 are processed in Table 2.
The measured load of individual axles.
| Tractor load [kg] | Semi-trailer load [kg] | ||||
|---|---|---|---|---|---|
| 1. axle | 2. axle | 1. axle | 2. axle | 3. axle | |
| 1. measurement | 7 200 | 10 200 | 6 750 | 7 000 | 7 500 |
| 2. measurement | 7 350 | 10 700 | 2 700 | 2 900 | 3 000 |
| 3. measurement | 5 450 | 2 450 | 6 850 | 7 350 | 8 150 |
| 4. measurement | 5 700 | 3 350 | 1 550 | 1 750 | 1 950 |
| 5. measurement | 5 500 | 2 500 | - | - | - |
Four load distributions on the semi-trailer simulate four different cases of load distribution on the loading area. In Figure 1(a, b, c, d) are shown the distribution of pallet units in semi-trailer. In the case of Figure 1d is an unloaded semi-trailer and a special case is Measurement No.5, in which the tractor without an attached semi-trailer was evaluated.
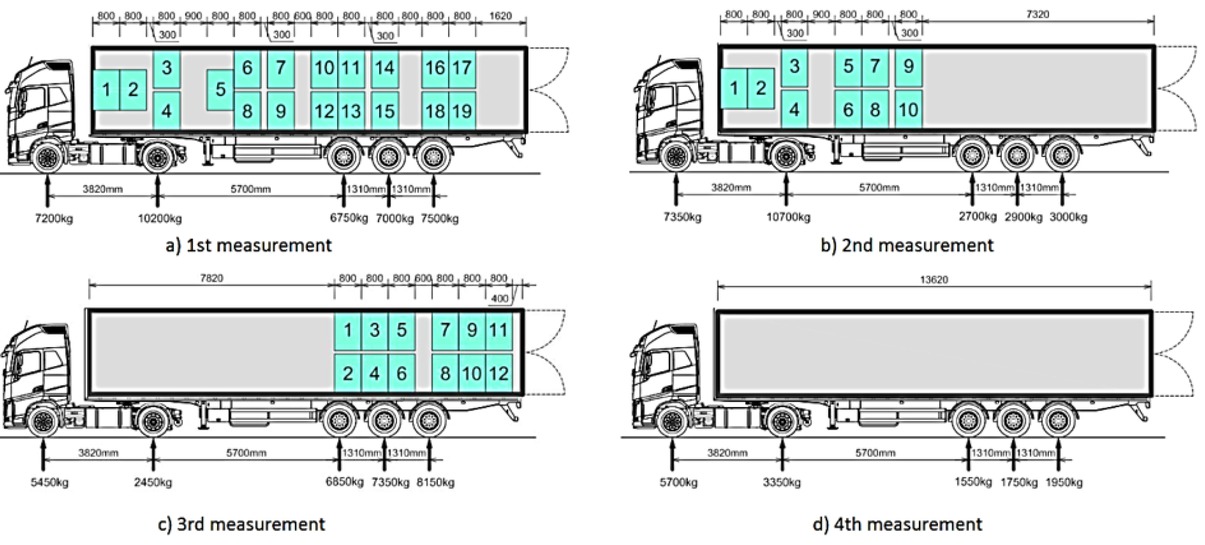
Load distributions: a) Measurement No. 1; b) Measurement No. 2; c) Measurement No. 3; Measurement No. 4.
4 Service brake efficiency results
Table 3 lists all relevant data measured at the roller brake tester. These data are necessary to calculate the service brake efficiency by available methods. To calculate the braking ratio by linear extrapolation, the construction pressures data of the braking actuator have also been added. When calculating the brake ratio by direct evaluation and linear extrapolation, it is also necessary to know the values of the maximum gross weights of the vehicles, which are 18 000 kg for the tractor and 27 000 kg for the semi-trailer. The table contains all available information necessary for evaluating the braking efficiency of the vehicle at the roller brake tester. It is the braking force on the individual axles, the control pressure in the air pressure system, the symmetry of the braking efficiency and the variation of braking efficiency. The results of the achieved braking forces and the control pressure are further converted into a vehicle braking ratio parameter, depending on the vehicle load, according to the mentioned methods for evaluating the braking efficiency of heavy duty vehicles. Table 3 shows that incorrect axle load or low axle load also has a significant effect on the symmetry of braking efficiency and variation of braking efficiency [6, 23, 24]. The symmetry of the braking efficiency shall not exceed 30% for each axle, which is not observed in the case of measurements No.2 and No.4 for the evaluation of the axles of the semi-trailer. The variation in braking efficiency shall not exceed 10%. The variation in braking performance shall not exceed 10%. This value was also exceeded in case of measurement No.4 for the third axle of the semi-trailer because of unloaded semi-trailer. A vehicle so loaded when measuring the service brake efficiency during a periodic technical inspection would be assessed as not roadworthy [1, 16, 25].
Results for all measurements of service brake efficiency.
| Vehicle | Axle | Braking force for service brake (kN) | Braking pressure (kPa) | Construction pressure of the braking actuator (kPa) | Symmetry (%) | Comply | Variation of braking force (%) | Comply | ||
|---|---|---|---|---|---|---|---|---|---|---|
| Measurement No.1 | ||||||||||
| Tractor | 1 | 23.87 N | 22.29 B | 510 | 1000 | 10 | Y | 4 | 6 | Y |
| 2 | 23.49 N | 23.31 B | 460 | 1000 | 9 | Y | 12 | 7 | Y | |
| Semi-trailer | 1 | 12.40 N | 15.00 B | 444 | 650 | 23 | Y | 6 | 9 | Y |
| 2 | 14.24 B | 14.78 N | 458 | 650 | 4 | Y | 8 | 5 | Y | |
| 3 | 17.85 B | 16.75 N | 520 | 650 | 6 | Y | 7 | 6 | Y | |
| Measurement No.2 | ||||||||||
| Tractor | 1 | 24.71 N | 23.07 B | 502 | 1000 | 8 | Y | 7 | 6 | Y |
| 2 | 23.77 N | 23.51 B | 362 | 1000 | 14 | Y | 10 | 10 | Y | |
| Semi-trailer | 1 | 4.52 N | 4.31 B | 170 | 650 | 31 | N | 44 | 64 | N |
| 2 | 5.04 B | 6.30 N | 186 | 650 | 25 | Y | 18 | 11 | Y | |
| 3 | 5.62 B | 6.44 N | 74 | 650 | 20 | Y | 18 | 11 | Y | |
| Measurement No.3 | ||||||||||
| Tractor | 1 | 20.22 N | 19.00 B | 414 | 1000 | 13 | Y | 8 | 7 | Y |
| 2 | 7.69 B | 8.11 N | 520 | 1000 | 15 | Y | 20 | 13 | Y | |
| Semi-trailer | 1 | 11.90 N | 14.46 B | 390 | 650 | 22 | Y | 8 | 8 | Y |
| 2 | 14.71 N | 15.20 B | 488 | 650 | 17 | Y | 9 | 4 | Y | |
| 3 | 18.92 B | 17.65 N | 500 | 650 | 17 | Y | 6 | 7 | Y | |
| Measurement No.4 | ||||||||||
| Tractor | 1 | 21.08 B | 19.26N | 434 | 1000 | 14 | Y | 7 | 4 | Y |
| 2 | 12.12 N | 11.89 B | 494 | 1000 | 16 | Y | 20 | 8 | Y | |
| Semi-trailer | 1 | 1.69 N | 2.57 B | 88 | 650 | 49 | N | 12 | 11 | Y |
| 2 | 2.91 B | 3.05 N | 102 | 650 | 38 | N | 17 | 5 | Y | |
| 3 | 4.0 N | 4.67 B | 62 | 650 | 14 | Y | 12 | 56 | N | |
| Measurement No.5 | ||||||||||
| Tractor | 1 | 18.18 N | 15.7 B | 258 | 1000 | 14 | Y | 5 | 9 | Y |
| 2 | 8.01 B | 7.89 N | 508 | 1000 | 14 | Y | 15 | 14 | Y | |
The values given in Table 4 are obtained after calculating the braking ratio by all available methods of evaluating the service braking efficiency. The table contains the required braking ratio values for tested vehicles, the total and instantaneous masses of vehicles used in calculating as well as the vehicles roadworthy [18]. A total of up to 3 cases of evaluation could not use the linear extrapolation method because the condition for reaching 30% of the construction pressure of the braking actuator was not met.
The comparison of Direct evaluation method and Linear extrapolation method.
| Vehicle | Measurement No. | Required braking ratio Z (%) | Direct evaluation method | Linear extrapolation Method | |||||
|---|---|---|---|---|---|---|---|---|---|
| Total weight of vehicle from the Certificate of Registration (kg) | Result (%) | Comply | Total weight of vehicle from the Certificate of Registration (kg) | Result (%) | Comply | Requirement of 30% Pm | |||
| tractor | 1 | 50 | 18 000 | 52.68 | yes | 18 000 | 114.04 | yes | yes |
| 2 | 50 | 18 000 | 53.87 | yes | 18 000 | 136.13 | yes | yes | |
| 3 | 50 | 18 000 | 31.18 | no | 18 000 | 74.95 | yes | yes | |
| 4 | 50 | 18 000 | 36.47 | no | 18 000 | 84.47 | yes | yes | |
| 5 | 50 | 18 000 | 28.21 | no | 18 000 | 103.02 | no | ||
| semi-trailer | 1 | 45 | 27 000 | 34.39 | no | 27 000 | 48.24 | yes | yes |
| 2 | 45 | 27 000 | 12.18 | no | 27 000 | 115.29 | no | ||
| 3 | 45 | 27 000 | 35.07 | no | 27 000 | 51.06 | yes | yes | |
| 4 | 45 | 27 000 | 7.14 | no | 27 000 | 133.42 | no | ||
Although there are several methods available for evaluating the braking efficiency of a service brake, they do not always lead to the same evaluation, even if it is one and the same vehicle. The load factor appears to be very important. Direct evaluation method is only applicable in a small percentage of cases, although it remains the most physically accurate method. This is due to the fact that the vehicles are under-loaded to the technical inspection. The reference braking forces are not provided by the manufacturers in the extent that they could cover the full range of tested vehicles. In terms of evaluating the service brake efficiency, the indicative evaluation method is the least accurate evaluation method for new vehicles. Therefore, it is only used for older vehicles. With regard to linear extrapolation method, it is accepted as a full-fledged method, although the braking effect calculated on the basis of this method is only theoretical.
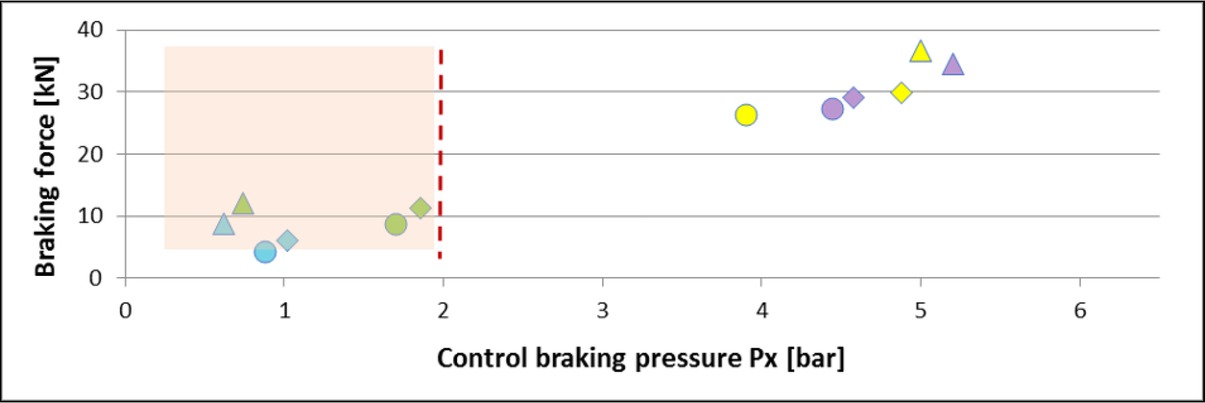
In Figure 2 there is shown which axles meet the condition of reaching 30% of the construction pressure of the brake actuator and which do not. The red dashed line is a separate area showing the satisfactory and unsatisfactory control pressure values for use in the extrapolation calculation of braking ratio for the Volvo N3 tested vehicle. For this vehicle we assume a value of Pm = 10 bar (manufacturer’s data) and from this value the result is Pmin = 0.3 x Pm = 3 bar.

Dependence of braking forces on tractor control pressure.
 measurement No. 1, axle 1
 measurement No. 1, axle 2
 measurement No. 3, axle 1
 measurement No. 3, axle 2
 measurement No. 5, axle 1
 measurement No. 5, axle 2
 measurement No. 2, axle 1
 measurement No. 2, axle 2
 measurement No. 4, axle 1
 measurement No. 4, axle 2
In Figure 3 it is shown which axles meet the condition of reaching 30% of the construction pressure of the brake actuator and which do not. Colour numbers of the measurements are distinguished for a better overview. There are also areas showing satisfactory and unsatisfactory control pressure values for use in the extrapolation calculation of braking ratio for the Schwarzmuller O4 tested vehicle. For this vehicle we assume a value of Pm = 6.5 bar (manufacturer’s data) and from this value the result is Pmin = 0.3 × Pm = 1.95 bar.
Dependence of braking forces on control pressure for semi-trailer.
 measurement No. 1, axle 1
 measurement No. 1, axle 2
 measurement No. 1, axle 3
 measurement No. 3, axle 1
 measurement No. 3, axle 2
 measurement No. 3, axle 3
 measurement No. 2, axle 1
 measurement No. 2, axle 2
 measurement No. 2, axle 3
 measurement No. 4, axle 1
 measurement No. 4, axle 2
 measurement No. 4, axle 3
5 Conclusion
The evaluation of the braking efficiency at the roller brake tester can be considered as the most important check within the regular technical inspection of both passenger cars and trucks. The results are the output of practical measurements of the semi-trailer vehicle combination with different loads at a particular Station of Technical Inspection. Over the past seven years, a specific technical inspection worker has carried out 343 periodic technical inspections of vehicle categories N2 and N3 and 129 technical inspections of vehicle categories O3 and O4. Of the 343 checked vehicles, 44 vehicles were assessed as unfit for braking efficiency, 21 of which were obviously due to insufficient vehicle load. Of the 129 checked vehicles categories O3, O4, 20 vehicles were assessed as unfit due to insufficient braking efficiency, of which, in 13 cases, apparently due to low vehicle load. A special regulation provides for a minimum load of vehicle submitted for technical inspection, but in practice this indicator is uncontrollable in real. For this reason, some technical inspection stations use an additional load of vehicle in the form adding goods, or by drawing the loading area to the roller brake tester with lashing straps. Practical measurements have shown that a sufficiently loaded vehicle with the correct load distribution leads to its correct measurement at the Technical Inspection.
The requirement for appropriate loading of the truck during the technical inspection process with consider a braking efficiency is a topical issue. According the similar studies [26], it is possible to expect compulsory equipping of Technical Inspection Stations with scales, or with compulsory reference brake force data from truck manufacturers.
References
[1] Methodical Instruction No. 74/2018 for the performance of brake system inspections of vehicles of categories M1 with a maximum allowed mass exceeding 3.5 tonnes, M2, M3, N2, N3, O3 and O4 in roller brake tester. Ministry of Transport and Construction of the Slovak Republic; 2018.Search in Google Scholar
[2] ISO 21069-1. Road vehicles – Test of braking systems on vehicles with a maximum authorized total mass of over 3.5 t using a roller brake tester, Part 1: Pneumatic braking systems.Search in Google Scholar
[3] Decree N. 137/2018 Z.z. laying down details on the operation of vehicles in road traffic. Ministry of Transport and Construction of the Slovak Republic; 2018.Search in Google Scholar
[4] Government Regulation no. 140/2009, Regulation of the Government of the Slovak Republic laying down details on type-approval of motor vehicles and their trailers, systems, components and separate technical units intended for these vehicles.Search in Google Scholar
[5] Rybianský M, Kuchynka R, Ondrejka P, Hron P. (2009). The using of the roller brake tester for evaluation of the braking efficicency in judge expertise TESTEK, s.r.o., Bratislava, available at: http://www.testek.sk/files/prez/brzdy_vsb_tatry_2009.pdfSearch in Google Scholar
[6] Šešera M, Ondrejka P. The brake system inspections of vehicles of categories M, N and O with maximum allowed mass exceeding 3,5 tonnes with using a new method of reference braking forces, TESTEK, s.r.o., Bratislava, available at: http://www.testek.sk/files/prez/sesera-ondrejka_zmena_brzdy_tazke_vozidla.pdfSearch in Google Scholar
[7] Ondrus J, Kolla E. (2017). Practical Use of the Braking Attributes Measurements Results. 18th International Scientific Conference Logi 2017. 134, 00044. https://doi.org/10.1051/matecconf/20171340004410.1051/matecconf/201713400044Search in Google Scholar
[8] Ondrus, J & Hockicko, P. (2015). Braking deceleration measurement using the video analysis of motions by SW tracker. Transport and telecommunication journal 16(2). (127 – 137). https://doi.org/10.1515/ttj-2015-001210.1515/ttj-2015-0012Search in Google Scholar
[9] Vrabel, J., Jagelcak, J., Zamecnik, J. & Caban, J. (2017). Influence of Emergency Braking on Changes of the Axle Load of Vehicles Transporting Solid Bulk Substrates. Transbaltica 2017. Transportation science and technology 187. (89-99). https://doi.org/10.1016/j.proeng.2017.04.35410.1016/j.proeng.2017.04.354Search in Google Scholar
[10] Idzikowski, A. (2017). Boolean model of HSUH leakage testing for the purpose of designing a diagnosing unit of selected damages of vehicle braking mechanisms. The Archives of Automotive Engineering – Archiwum Motoryzacji 78(4). https://doi.org/10.14669/AM.VOL78.ART6Search in Google Scholar
[11] Stopka O, Kampf R. Determining the most suitable layout of space for the loading units’ handling in the maritime port. Transport. 2018;33(1):280–90.10.3846/16484142.2016.1174882Search in Google Scholar
[12] Idzikowski, A. (2017). Boolean model of HSUH leakage testing for the purpose of designing a diagnosing unit of selected damages of vehicle braking mechanisms. The Archives of Automotive Engineering – Archiwum Motoryzacji 78(4). https://doi.org/10.14669/AM.VOL78.ART610.14669/AM.VOL78.ART6Search in Google Scholar
[13] Matuszak, Z., Nowak, A., Żabińska, I. & Martínez de Osés, F.X. (2019). Road safety on the example of the city of Bytom. The Archives of Automotive Engineering – Archiwum Motoryzacji 83(1). 43–57. https://doi.org/10.14669/AM.VOL83.ART310.14669/AM.VOL83.ART3Search in Google Scholar
[14] Li, J., Zha, XJ & Wu, DS. (2011). The Theoretical Analysis of Test Result’s Errors for the Roller Type Automobile Brake Tester. Computer and computing technologies in agriculture IV, PT 4. 347. (382-389). https://doi.org/10.1007/978-3-642-18369-0_4410.1007/978-3-642-18369-0_44Search in Google Scholar
[15] Senabre C, Velasco E, Valero S. Comparative analysis of vehicle brake data in the Ministry of Transport test on the roller brake tester and on flat ground. Int J Automot Technol. 2012;13(5):735– 42.10.1007/s12239-012-0072-xSearch in Google Scholar
[16] Rievaj, V., Vrabel, J., Synak, F. & Bartuska, L. (2018). The effects of vehicle load on driving characteristics. Advances in science and technology-research journal 12(1). (142-149). https://doi.org/10.12913/22998624/8089610.12913/22998624/80896Search in Google Scholar
[17] Kalašová A, Kapusta J. (2015). Motor vehicle safety technologies in relation to the accident rates. 15th International Conference on Transport Systems Telematics, (172–179).10.1007/978-3-319-24577-5_17Search in Google Scholar
[18] Figlus, T. (2013). Possibility to control and adjust the suspensions of vehicles. Activities of transport telematics. 395, 2013, 378–383. https://doi.org/10.1007/978-3-642-41647-7_4610.1007/978-3-642-41647-7_46Search in Google Scholar
[19] Dai W, Jiang J, Ding G, Liu Z. Development and Application of Fire Video Image Detection Technology in China’s Road Tunnels. Civil Engineering Journal. 2019;5(1):1.10.28991/cej-2019-03091221Search in Google Scholar
[20] Moradzaeh, A. & Khaffafi, K. (2018). Comparison and Evaluation of the Performance of Various Types of Neural Networks for Planning Issues Related to Optimal Management of Charging and Discharging Electric Cars in Intelligent Power Grids. https://doi.org/10.28991/ijse-0112310.28991/ijse-01123Search in Google Scholar
[21] Kordani AA, et al. Effect of adverse weather conditions on vehicle braking distance of highways. Civil Engineering Journal. 2018;4(1):46.10.28991/cej-030967Search in Google Scholar
[22] Ližbetin J. Methodology for determining the location of intermodal transport terminals for the development of sustainable transport systems: A case study from Slovakia. Sustainability. 2019;11(5):1230.10.3390/su11051230Search in Google Scholar
[23] Barta D, Mruzek M. (2012). Using of braking in real driving urban cycle. LOGI - Scientific Journal on Transport and Logistics, 3(1), (14-22). ISSN 1804-3216.Search in Google Scholar
[24] Cujan Z, Fedorko G. Supplying of Assembly Lines Using Train of Trucks. Open Eng. 2016;6(1):426–31.10.1515/eng-2016-0057Search in Google Scholar
[25] Varecha D., Kohar R. & Brumercik F. (2019). AGV Brake System Simulation, LOGI – Scientific Journal on Transport and Logistics, 10(1), 1-9. https://doi.org/10.2478/logi-2019-000110.2478/logi-2019-0001Search in Google Scholar
[26] Rybianský M, Ondrejka P, Testek s. Slovakia. Roller Brake Testers and Vertical Load Measuring in ISO 21069-1. available at: http://www.testek.sk/files/WG1_Subwg/WG1_Subwg_Brakes_02_2018_003_ISO_and_load_measuring.pdfSearch in Google Scholar
© 2020 B. Šarkan et al., published by De Gruyter
This work is licensed under the Creative Commons Attribution 4.0 International License.
Articles in the same Issue
- Regular Articles
- Fabrication of aluminium covetic casts under different voltages and amperages of direct current
- Inhibition effect of the synergistic properties of 4-methyl-norvalin and 2-methoxy-4-formylphenol on the electrochemical deterioration of P4 low carbon mold steel
- Logistic regression in modeling and assessment of transport services
- Design and development of ultra-light front and rear axle of experimental vehicle
- Enhancement of cured cement using environmental waste: particleboards incorporating nano slag
- Evaluating ERP System Merging Success In Chemical Companies: System Quality, Information Quality, And Service Quality
- Accuracy of boundary layer treatments at different Reynolds scales
- Evaluation of stabiliser material using a waste additive mixture
- Optimisation of stress distribution in a highly loaded radial-axial gas microturbine using FEM
- Analysis of modern approaches for the prediction of electric energy consumption
- Surface Hardening of Aluminium Alloy with Addition of Zinc Particles by Friction Stir Processing
- Development and refinement of the Variational Method based on Polynomial Solutions of Schrödinger Equation
- Comparison of two methods for determining Q95 reference flow in the mouth of the surface catchment basin of the Meia Ponte river, state of Goiás, Brazil
- Applying Intelligent Portfolio Management to the Evaluation of Stalled Construction Projects
- Disjoint Sum of Products by Orthogonalizing Difference-Building ⴱ
- The Development of Information System with Strategic Planning for Integrated System in the Indonesian Pharmaceutical Company
- Simulation for Design and Material Selection of a Deep Placement Fertilizer Applicator for Soybean Cultivation
- Modeling transportation routes of the pick-up system using location problem: a case study
- Pinless friction stir spot welding of aluminium alloy with copper interlayer
- Roof Geometry in Building Design
- Review Articles
- Silicon-Germanium Dioxide and Aluminum Indium Gallium Arsenide-Based Acoustic Optic Modulators
- RZ Line Coding Scheme With Direct Laser Modulation for Upgrading Optical Transmission Systems
- LOGI Conference 2019
- Autonomous vans - the planning process of transport tasks
- Drivers ’reaction time research in the conditions in the real traffic
- Design and evaluation of a new intersection model to minimize congestions using VISSIM software
- Mathematical approaches for improving the efficiency of railway transport
- An experimental analysis of the driver’s attention during train driving
- Risks associated with Logistics 4.0 and their minimization using Blockchain
- Service quality of the urban public transport companies and sustainable city logistics
- Charging electric cars as a way to increase the use of energy produced from RES
- The impact of the truck loads on the braking efficiency assessment
- Application of virtual and augmented reality in automotive
- Dispatching policy evaluation for transport of ready mixed concrete
- Use of mathematical models and computer software for analysis of traffic noise
- New developments on EDR (Event Data Recorder) for automated vehicles
- General Application of Multiple Criteria Decision Making Methods for Finding the Optimal Solution in City Logistics
- The influence of the cargo weight and its position on the braking characteristics of light commercial vehicles
- Modeling the Delivery Routes Carried out by Automated Guided Vehicles when Using the Specific Mathematical Optimization Method
- Modelling of the system “driver - automation - autonomous vehicle - road”
- Limitations of the effectiveness of Weigh in Motion systems
- Long-term urban traffic monitoring based on wireless multi-sensor network
- The issue of addressing the lack of parking spaces for road freight transport in cities - a case study
- Simulation of the Use of the Material Handling Equipment in the Operation Process
- The use of simulation modelling for determining the capacity of railway lines in the Czech conditions
- Proposals for Using the NFC Technology in Regional Passenger Transport in the Slovak Republic
- Optimisation of Transport Capacity of a Railway Siding Through Construction-Reconstruction Measures
- Proposal of Methodology to Calculate Necessary Number of Autonomous Trucks for Trolleys and Efficiency Evaluation
- Special Issue: Automation in Finland
- 5G Based Machine Remote Operation Development Utilizing Digital Twin
- On-line moisture content estimation of saw dust via machine vision
- Data analysis of a paste thickener
- Programming and control for skill-based robots
- Using Digital Twin Technology in Engineering Education – Course Concept to Explore Benefits and Barriers
- Intelligent methods for root cause analysis behind the center line deviation of the steel strip
- Engaging Building Automation Data Visualisation Using Building Information Modelling and Progressive Web Application
- Real-time measurement system for determining metal concentrations in water-intensive processes
- A tool for finding inclusion clusters in steel SEM specimens
- An overview of current safety requirements for autonomous machines – review of standards
- Expertise and Uncertainty Processing with Nonlinear Scaling and Fuzzy Systems for Automation
- Towards online adaptation of digital twins
- Special Issue: ICE-SEAM 2019
- Fatigue Strength Analysis of S34MnV Steel by Accelerated Staircase Test
- The Effect of Discharge Current and Pulse-On Time on Biocompatible Zr-based BMG Sinking-EDM
- Dynamic characteristic of partially debonded sandwich of ferry ro-ro’s car deck: a numerical modeling
- Vibration-based damage identification for ship sandwich plate using finite element method
- Investigation of post-weld heat treatment (T6) and welding orientation on the strength of TIG-welded AL6061
- The effect of nozzle hole diameter of 3D printing on porosity and tensile strength parts using polylactic acid material
- Investigation of Meshing Strategy on Mechanical Behaviour of Hip Stem Implant Design Using FEA
- The effect of multi-stage modification on the performance of Savonius water turbines under the horizontal axis condition
- Special Issue: Recent Advances in Civil Engineering
- The effects of various parameters on the strengths of adhesives layer in a lightweight floor system
- Analysis of reliability of compressed masonry structures
- Estimation of Sport Facilities by Means of Technical-Economic Indicator
- Integral bridge and culvert design, Designer’s experience
- A FEM analysis of the settlement of a tall building situated on loess subsoil
- Behaviour of steel sheeting connections with self-drilling screws under variable loading
- Resistance of plug & play N type RHS truss connections
- Comparison of strength and stiffness parameters of purlins with different cross-sections of profiles
- Bearing capacity of floating geosynthetic encased columns (GEC) determined on the basis of CPTU penetration tests
- The effect of the stress distribution of anchorage and stress in the textured layer on the durability of new anchorages
- Analysis of tender procedure phases parameters for railroad construction works
- Special Issue: Terotechnology 2019
- The Use of Statistical Functions for the Selection of Laser Texturing Parameters
- Properties of Laser Additive Deposited Metallic Powder of Inconel 625
- Numerical Simulation of Laser Welding Dissimilar Low Carbon and Austenitic Steel Joint
- Assessment of Mechanical and Tribological Properties of Diamond-Like Carbon Coatings on the Ti13Nb13Zr Alloy
- Characteristics of selected measures of stress triaxiality near the crack tip for 145Cr6 steel - 3D issues for stationary cracks
- Assessment of technical risk in maintenance and improvement of a manufacturing process
- Experimental studies on the possibility of using a pulsed laser for spot welding of thin metallic foils
- Angular position control system of pneumatic artificial muscles
- The properties of lubricated friction pairs with diamond-like carbon coatings
- Effect of laser beam trajectory on pocket geometry in laser micromachining
- Special Issue: Annual Engineering and Vocational Education Conference
- The Employability Skills Needed To Face the Demands of Work in the Future: Systematic Literature Reviews
- Enhancing Higher-Order Thinking Skills in Vocational Education through Scaffolding-Problem Based Learning
- Technology-Integrated Project-Based Learning for Pre-Service Teacher Education: A Systematic Literature Review
- A Study on Water Absorption and Mechanical Properties in Epoxy-Bamboo Laminate Composite with Varying Immersion Temperatures
- Enhancing Students’ Ability in Learning Process of Programming Language using Adaptive Learning Systems: A Literature Review
- Topical Issue on Mathematical Modelling in Applied Sciences, III
- An innovative learning approach for solar power forecasting using genetic algorithm and artificial neural network
- Hands-on Learning In STEM: Revisiting Educational Robotics as a Learning Style Precursor