Diabetes mellitus type 2: Exploratory data analysis based on clinical reading
-
Miroslava Nedyalkova
 ,
Sergio Madurga
,
Sergio Madurga

Abstract
Diabetes mellitus type 2 (DMT2) is a severe and complex health problem. It is the most common type of diabetes. DMT2 is a chronic metabolic disorder that affects the way your body metabolizes sugar. With DMT2, your body either resists the effects of insulin or does not produce sufficient insulin to continue normal glucose levels. DMT2 is a disease that requires a multifactorial approach of controlling that includes lifestyle change and pharmacotherapy. Less than ideal management increases the risk of developing complications and comorbidities such as cardiovascular disease and numerous social and economic penalties. That is why the studies dedicated to the pathophysiological mechanisms and the treatment of DMT2 are extremely numerous and diverse. In this study, exploratory data analysis approaches are applied for the treatment of clinical and anthropometric readings of patients with DMT2. Since multivariate statistics is a well-known method for classification, modeling and interpretation of large collections of data, the major aim of the present study was to reveal latent relations between the objects of the investigation (group of patients and control group) and the variables describing the objects (clinical and anthropometric parameters). In the proposed method by the application of hierarchical cluster analysis and principal component analysis it is possible to identify reduced number of parameters which appear to be the most significant discriminant parameters to distinguish between four patterns of patients with DMT2. However, there is still lack of multivariate statistical studies using DMT2 data sets to assess different aspects of the problem like optimal rapid monitoring of the patients or specific separation of patients into patterns of similarity related to their health status which could be of help in preparation of data bases for DMT2 patients. The outcome from the study could be of custom for the selection of significant tests for rapid monitoring of patients and more detailed approach to the health status of DMT2 patients.
1 Introduction
Diabetes mellitus represents a heterogeneous group of metabolic diseases characterized by hyperglycemia resulting from an inadequate insulin secretion or impaired insulin effects [1]. More than 90% of all diabetic patients are diagnosed with diabetes mellitus type 2 (DMT2) [2]. Insulin resistance in muscle, liver and fat cells and relative insulin deficiency due to beta-cell dysfunction are paramount for the development of DMT2; however, other pathophysiological mechanisms including impaired incretin effects, increased glucagon secretion, increased kidney glucose reabsorption and brain insulin resistance might also be of great importance [3]. DMT2 is a chronic disease associated with multiple complications, reduced quality of life, premature mortality and large economic burden, most directly affecting patients in low- and middle-income countries [4,5]. According to a large multinational study, the prevalence of micro- and macrovascular complications in patients with DMT2 was 53.5% and 27.2%, respectively, while 38.4% of the diabetic individuals suffered from diabetic neuropathy [6]. DMT2 and its complications were negatively associated with patients’ quality of life in regard to occupation, family and sexual life as well as future perspectives [7]. The economic costs of diabetes have increased by 26% from 2012 to 2017 in parallel with the increased prevalence of diabetes and the increased cost per person with diabetes [8,9].
Recently, the chemometrics and machine learning methods were successfully applied to analyze metabolites and to reveal the potential biomarkers in the clinical diagnosis of DMT2. Free fatty acids were identified as potential biomarkers of DMT2 by using heuristic evolving latent projections, selective ion analysis and competitive adaptive reweighted sampling [10]. Fisher linear discriminate analysis, support vector machine and decision tree algorithms were employed to analyze elements in blood samples, and it has been demonstrated that the level of chromium and iron can serve as a valuable tool of diagnosing DMT2 [11]. The support vector machine approach was also applied to element concentration in urine and hair samples to distinguish between DMT1 and DMT2 [12]. By using orthogonal partial least-squares discriminant analysis for metabolomic analysis of human serum samples, it was revealed that metabolomics fingerprints can identify potential biomarkers of red meat consumption and can be related to the risk of development of DMT2 [13]. The elemental analysis of diabetic toenails and a large variety of machine learning algorithms were combined for the non-invasive diagnosis of DMT2, and it was found that the levels of aluminum, cesium, nickel, vanadium and zinc in toenails can serve as an indicator for the presence or absence of DMT2 [14].
The high incidence and costs as well as the predicted increase of the diabetes prevalence in the future [15] justifies the efforts to apply new multidisciplinary approaches in the diabetic research. Therefore, the present study aims to reveal hidden patterns and subgroups of diabetic patients through hierarchical cluster analysis and principal component analysis (PCA). The major goals of the present study are as follows:
proper classification of DMT2 patients and members of control group;
reduction of the number of variables for optimization of the monitoring process of DMT2 patients;
detection of patterns of similarity within the class of DMT2 patients; and
determination of discriminant parameters for each identified pattern of patients.
2 Materials and methods
2.1 Input data and methods of exploratory data analysis
2.1.1 Input data
Data subject to intelligent data analysis are collected from patients’ records. Data were provided by the for active treatment in endocrinology “Acad. Iv. Penchev”, Sofia, Bulgaria and other endocrinological practices. Totally, 100 patients (57 females and 43 males) of age between 36 and 86 with duration of the disease between 1 and 30 years were involved. Additionally, data for 20 healthy volunteers (11 females and 9 males) are added for comparison with the same parameters tested. In Supplementary File 1: Table S1, the clinical parameters measured and their code names are indicated. The following parameters were taken into account:
anthropometric data – age, duration of disease, weight, height and body mass index (BMI) – calculated according to the well-known formula: weight (kg)/height2 (m2), waist and hip circumference;
blood tests for thrombocytes, thrombocyte volume to total volume and erythrocyte sedimentation rate;
liver and muscle functional tests – alanine aminotransferase (ALAT), gamma glutamyl transferase (GGT), albumin and creatinine phosphokinase (CPK);
kidney function data – creatinine and uric acid;
protein profile – total protein, lipid profile: high-density lipoproteins (HDLs), low-density lipoproteins (LDLs), very low-density lipoproteins (VLDLs), cholesterol and triglycerides;
electrolyte content – potassium ions and sodium ions;
glucose levels (for patients checked in and checked out during a session of medical treatment in a hospital) – hemoglobin A1c, fasting glucose, postprandial glucose, before sleep glucose and mean value of glucose.
2.2 Exploratory data analysis methods
In order to search for specific relationships between the clinical parameters or between the DMT2 patients. The input matrix has dimensions (120 × 35).
The following methods were used for data interpretation.
2.2.1 Hierarchical cluster analysis
Hierarchical cluster analysis is used to detect groups of similarity (clusters) between the objects of interest (DMT2 patients and control group) or between variables (clinical parameters) by agglomerative hierarchical clustering. The major steps in the analysis include data normalization (z-standardization) to eliminate differences in the variable’s dimensions, squared Euclidean distance as similarity measure, Ward’s method of linkage, Sneath’s test of cluster significance and dendrogram plot as a graphical output [16].
2.2.2 PCA
PCA is able to reduce the number of the variables describing the system of objects in the direction of its highest variance. New variables are introduced, and the coordinates of the existing variable space are replaced by new ones. These new coordinates are the so-called latent factors or principal components (PCs). Their correct interpretation is the main task since they carry specific information about new types of relationships within the original data set. Two sets of output results are considered factor scores giving the new coordinates of the factor space with the location of the objects and factor loadings informing on the relationship between the variables. Only statistically significant loadings (>0.70) are taken into account for the interpretation.
The new PCs selected for interpretation should explain a significant portion of the total variance of the system. Usually, the first principal component (PC1) explains the maximal part of the system variation and each additional PC has a respective contribution to the variance explanation but with less significance.
A reliable interpretation pattern requires normally such a number of PCs, so that over 75% of the total variation can be explained. Often, the Varimax rotated PCA solution is applied that allows a better explanation of the system since it strengthens the role of the latent factors with higher impact on the variation explanation and diminishes the role of PCs with lower impact [17].
2.2.3 Partial least square – discriminant analysis (PLS-DA)
PLS-DA is a supervised linear classification method that combines the properties of partial least squares (PLS) regression with the discrimination power of a discriminant method. The PLS regression algorithm identifies latent variables with a maximum covariance with the classes [18], which are coded into a dummy matrix Y, which represents the membership of each sample in a binary form. The PLS2 model is then calibrated on the Y matrix [19] and the probability that a sample belongs to a specific class can be calculated on the basis of the predicted responses [20]. Thus, each modeled class can be described by a classification function reporting the coefficients that determine the linear combination of the original variables to define the classification score. Before the PLS-DA calculation, data were auto scaled.
All calculation work was done by the use of the software package STATISTICA 8.0 [21], except for the classification PLS-DA models, which were calculated with the MATLAB toolbox [22].
Ethical approval: All procedures were carried out in accordance with the principles of ethics of the Declaration of Helsinki. The Institutional Ethics Committee approved the use of anonymous patients’ data for the study goals.
3 Results and discussion
3.1 Basic statistics
In Table 1, the basic statistical data for all 120 objects are given.
Mean values and standard deviations for 34 clinical parameters (variable “sex” is omitted)
| Variables | Control | SD control | DMT2 patients | SD DMT2 patients |
|---|---|---|---|---|
| Age | 50.35 | 9.82 | 60.29 | 10.58 |
| Duration | 0.00 | 0.00 | 7.35 | 6.47 |
| Weight | 71.05 | 8.82 | 84.22 | 18.30 |
| Height | 173.60 | 7.71 | 165.70 | 10.38 |
| BMI | 22.90 | 1.94 | 30.87 | 6.02 |
| Waist (W) | 86.85 | 4.02 | 103.18 | 12.44 |
| Hip (H) | 88.60 | 6.46 | 109.65 | 14.20 |
| W/H | 0.98 | 0.05 | 0.95 | 0.07 |
| Thromboc | 276.95 | 48.16 | 256.10 | 72.41 |
| Thrvol/Vol | 0.26 | 0.04 | 0.22 | 0.07 |
| ESR | 16.35 | 6.53 | 23.84 | 21.51 |
| ALAT | 28.85 | 9.22 | 29.39 | 23.01 |
| GGT | 38.45 | 12.01 | 49.56 | 48.27 |
| CPK | 67.40 | 36.65 | 101.95 | 121.84 |
| Creatinine | 82.85 | 14.63 | 96.29 | 35.00 |
| Uric acid | 264.45 | 73.94 | 297.98 | 83.68 |
| Total protein | 70.01 | 6.20 | 70.68 | 5.26 |
| Albumin | 39.90 | 5.86 | 38.63 | 3.92 |
| HDL | 1.15 | 0.19 | 1.10 | 0.24 |
| LDL | 2.16 | 0.35 | 2.95 | 1.02 |
| VLDL | 0.76 | 0.40 | 0.86 | 0.41 |
| Cholesterol | 3.70 | 0.67 | 5.05 | 1.51 |
| Triglycerides | 1.17 | 0.40 | 2.54 | 3.29 |
| K | 4.08 | 0.61 | 4.61 | 0.52 |
| Na | 138.60 | 4.42 | 140.23 | 3.47 |
| HbA1c | 5.40 | 0.38 | 8.65 | 1.90 |
| Fast glucose 1 | 4.73 | 0.57 | 9.78 | 3.78 |
| Postprandial | 4.91 | 0.58 | 10.70 | 3.90 |
| Before sleep | 4.80 | 0.40 | 10.30 | 4.64 |
| Mean 1 | 4.83 | 0.45 | 10.09 | 3.37 |
| Fast glucose2 | 4.73 | 0.57 | 7.65 | 2.05 |
| Postprandial | 4.91 | 0.58 | 8.87 | 2.09 |
| Before sleep | 4.80 | 0.40 | 7.45 | 2.66 |
| Mean 2 | 4.83 | 0.45 | 7.87 | 1.64 |
Detailed statistical data about patients and control group indicate that there are no significant differences between the averages for both groups between indicators such as age, thrombocytes, ALAT, total protein, albumin, K, Na and the different cholesterol determinations (p < 0.05). Statistically significant differences (p > 0.05) are observed for BMI and the parameters related to it (weight, waist and hip), GGT, CPK, creatinine, uric acid, triglycerides, erythrocyte sedimentation rate (ESR) and all glucose tests. All this could be attributed to factors related to the disease not to demographic reasons.
The correlation analysis carried out for the DMT2 group shows that statistically significant correlations (p > 0.05) are found as follows:
Age: all parameters related to BMI (anthropometric indicators), creatinine, uric acid, thrombocytes, Na and HbA1c;
Duration: weight, ESR, ALAT, creatinine and uric acid;
Weight: all BMI indicators and Na;
Height: waist, ESR, ALAT and Na;
BMI: waist, hip, HDL and HbAc1;
Waist: hip, HDL and fast glucose;
Thrombocytes: ESR and total protein;
ESR: creatinine, albumin and HDL;
ALAT: GGT, total protein, albumin and LDL;
GGT: uric acid, HDL, triglycerides, K, Na, postprandial glucose and mean glucose 1;
Creatinine: uric acid and total protein;
Uric acid: VLDL and triglycerides;
Total protein: albumin, LDL and cholesterol;
Albumin: HDL, VLDL, HbA1c, before sleep glucose and mean glucose 2;
HDL, LDL and VLDL: cholesterol and triglycerides;
Cholesterol: triglycerides, Na, fast glucose 1, mean glucose 1, fast glucose 2 and mean glucose 2;
Triglycerides: Na, HbAc1, post prandial glucose and mean glucose 1;
K: before sleep glucose 2 and mean glucose 2;
Na: HbAc1; and
For the control group very few significant correlations are observed.
It could be concluded that several groups of mutual correlated clinical parameters for DMT2 patients are registered as follows:
glucose test parameters;
BMI and related anthropometric indicators;
cholesterol indicators and triglycerides; and
creatinine, uric acid and proteins.
This is important preliminary information about links between the clinical and anthropometric indicators, which could be of help for the multivariate statistical data analysis.
3.1.1 Classification approach to separate controls from DMT2 patients
The goal is to find specific descriptors able to distinguish between the control group and the group of DMT2 patients.
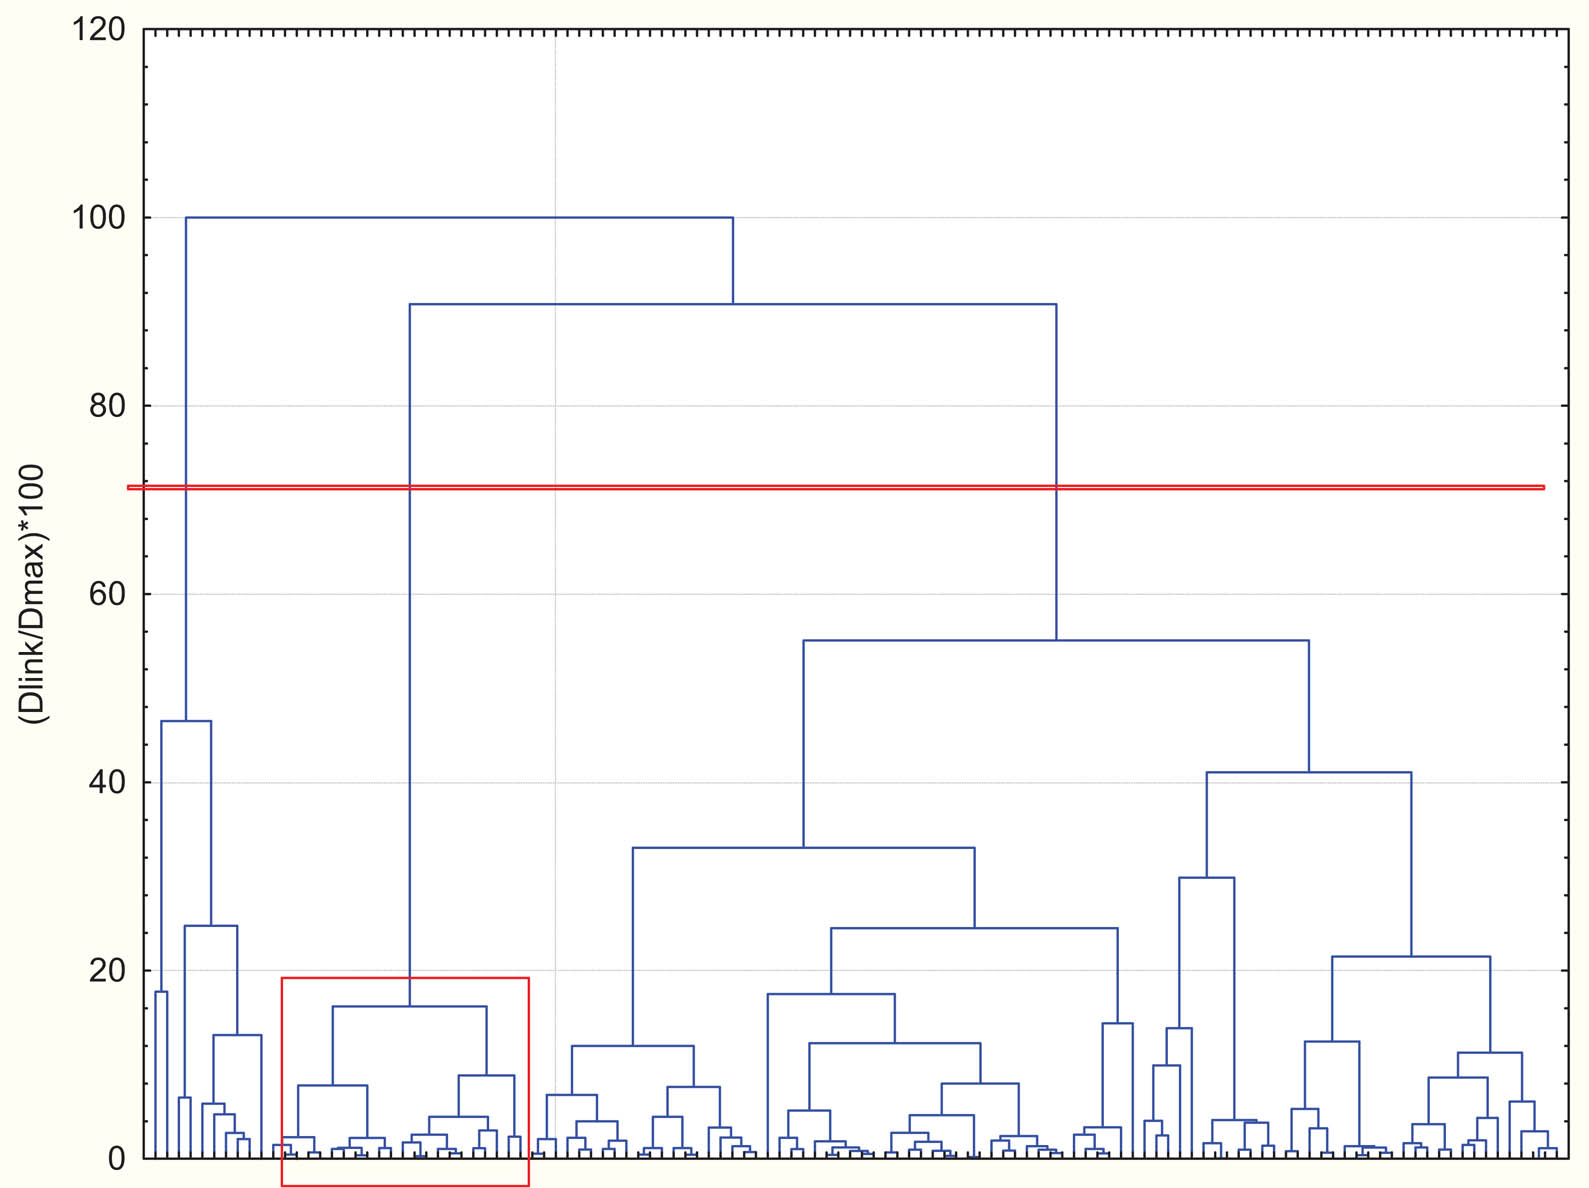
The first approach used was hierarchical cluster analysis. In Figure 1, the hierarchical dendrogram for clustering of all 120 objects (20 of the control group and 100 DMT2 patients) is presented. The separation even in this simple way of grouping is satisfactory – all members of the control group are included in one single cluster. Only one DMT2 patient is wrongly classified as member of the control group. The most statistically significant descriptors for the separation are all glucose test values, all anthropometric indicators, ESR, GGT, CPK and cholesterol.
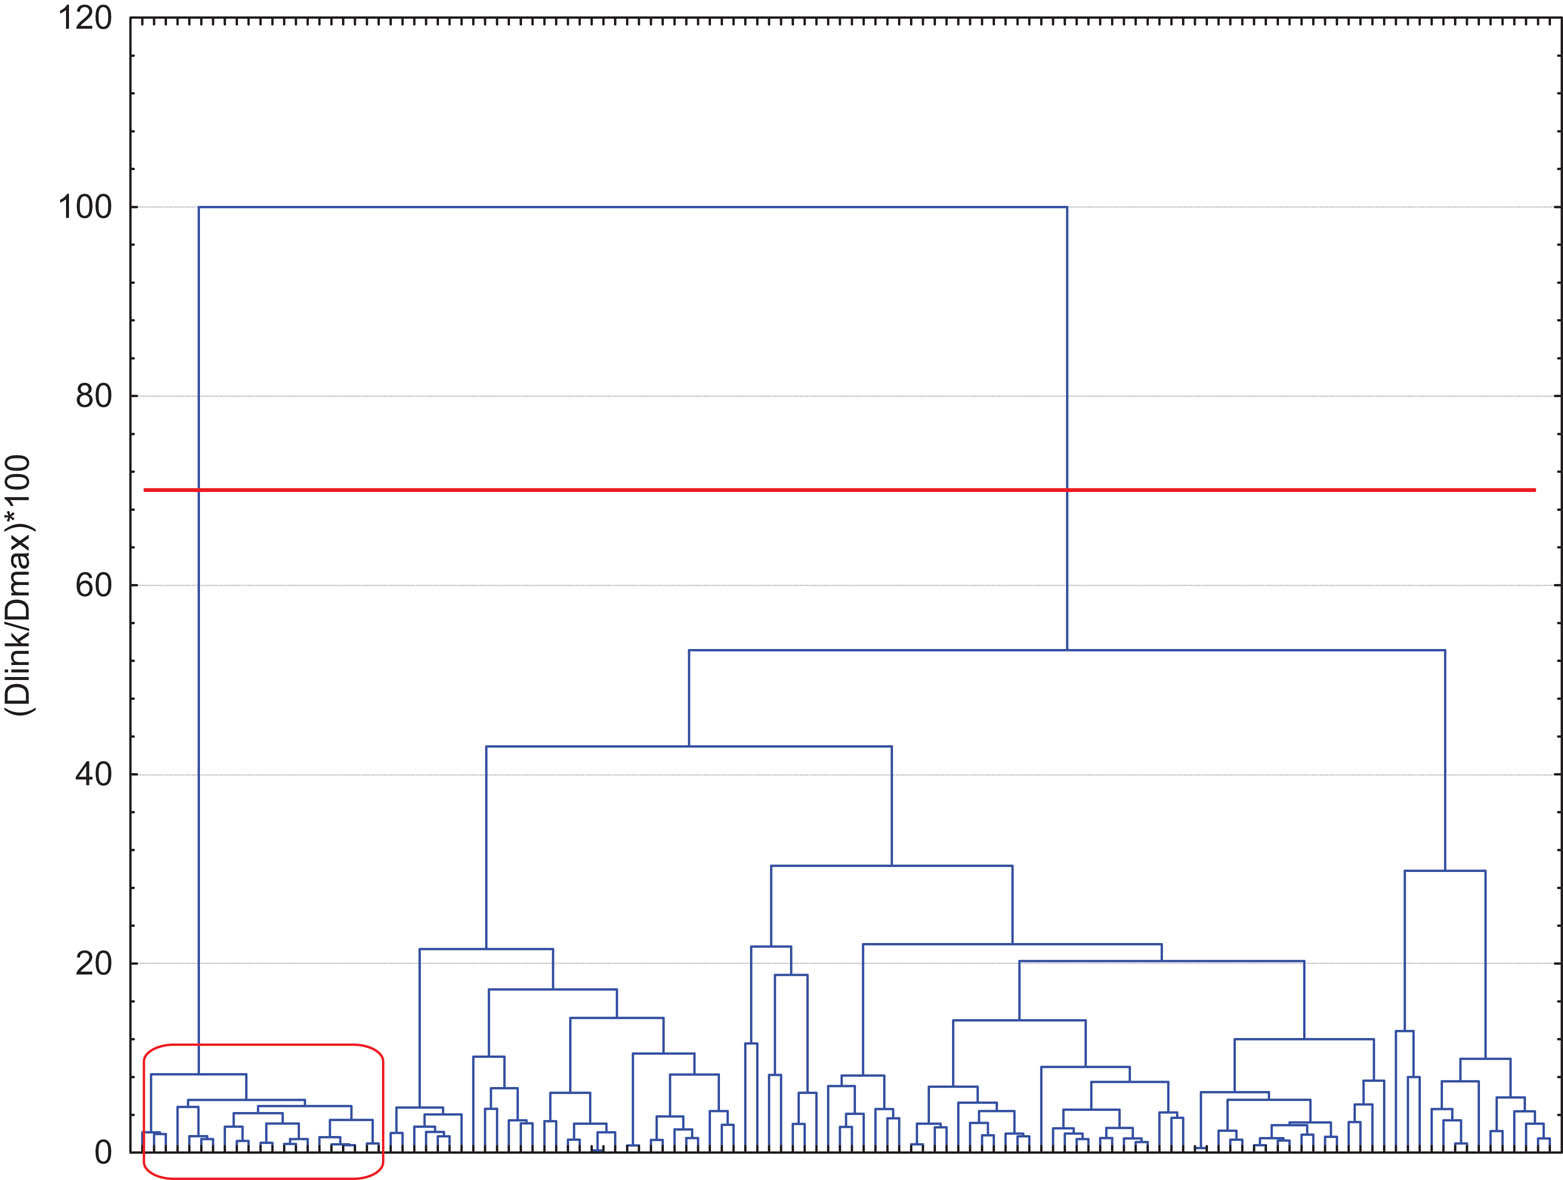
Separation of the control group (the cluster on the left side) from the DTM2 patients by hierarchical cluster analysis using all input parameters.
The same data set was treated by the PLS-DA approach. In Figure 2, the separation of the objects into two very different classes (N – control group and P – patients with DMT2) is indicated. The discriminant indicators are found to be as follows: postprandial glucose test, almost all anthropometric parameters, age and, surprisingly, potassium.
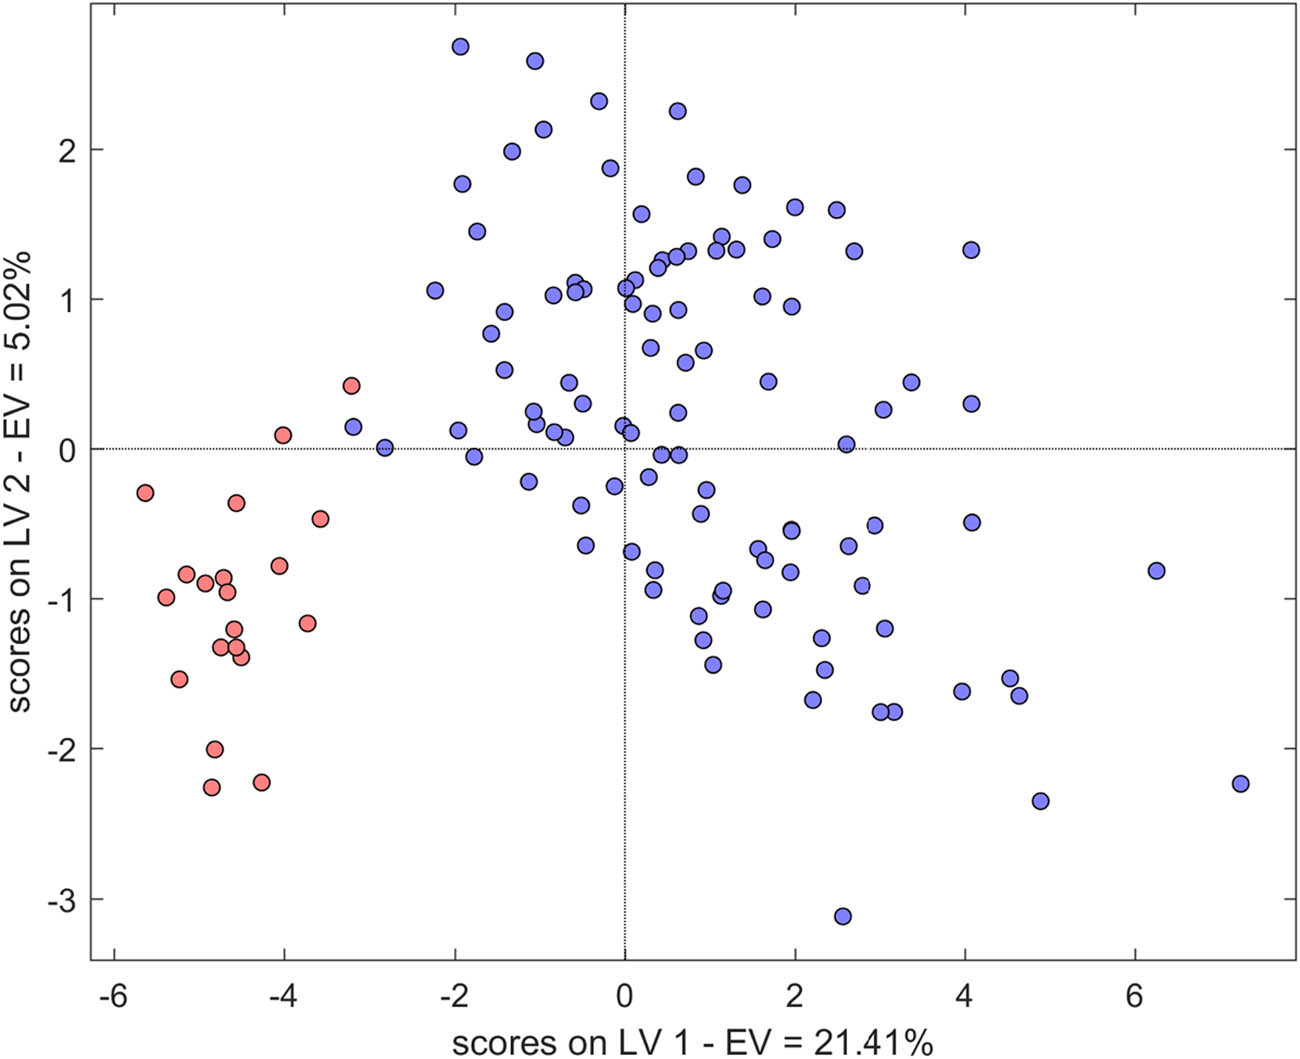
Separation of the control group (the cluster on the left side) from the DTM2 patients by PLS-DA approach.
It is shown that reliable classification and separation of the control group from the DMT2 patients’ group are possible by the use of all clinical and anthropometric parameters used. In the next steps of the multivariate statistical analysis, an effort will be made to reduce the number of parameters used to optimize the monitoring of the patients.
3.1.2 Hierarchical cluster analysis of clinical parameters
In Figures 3 and 4, the hierarchical dendrograms for clustering of the clinical parameters (normalized inputs, squared Euclidean distances as similarity measure, method of Ward of linkage and Sneath’s test for cluster significance) are presented (for the control group of 20 participants, Figure 1 and for the DMT2 group of 100 patients, Figure 2).
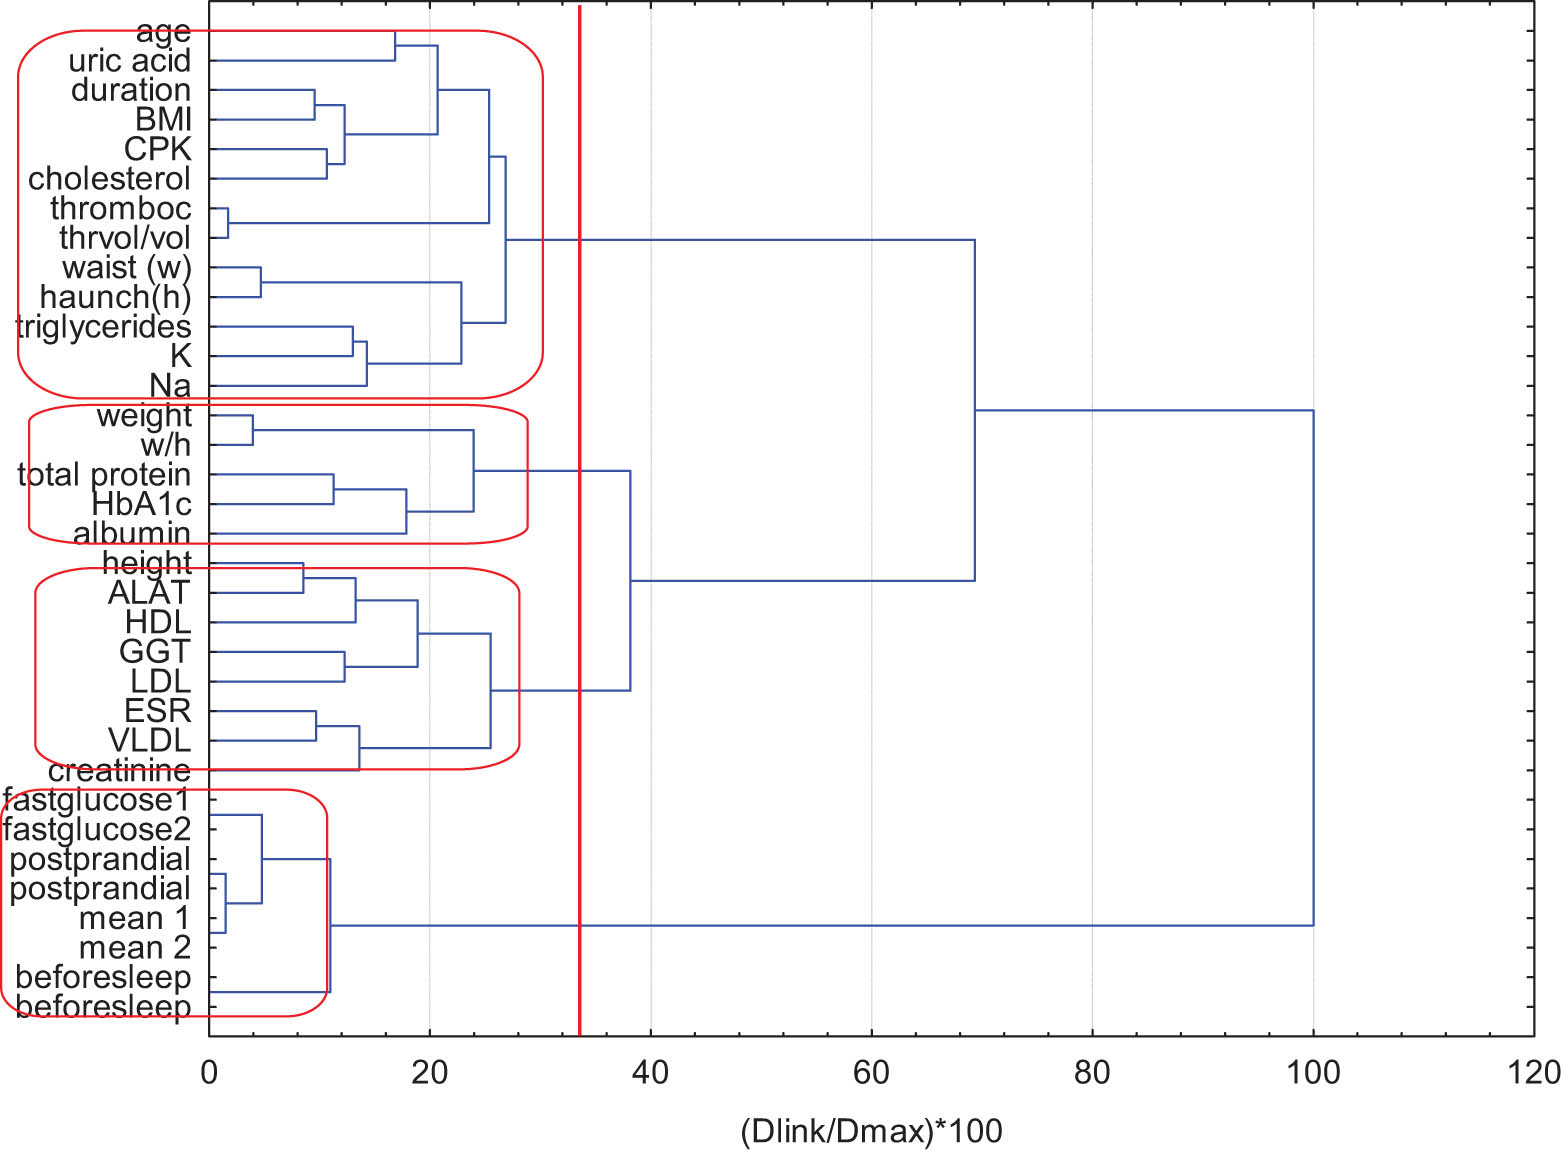
Hierarchical dendrogram for linkage of clinical parameters for control group.
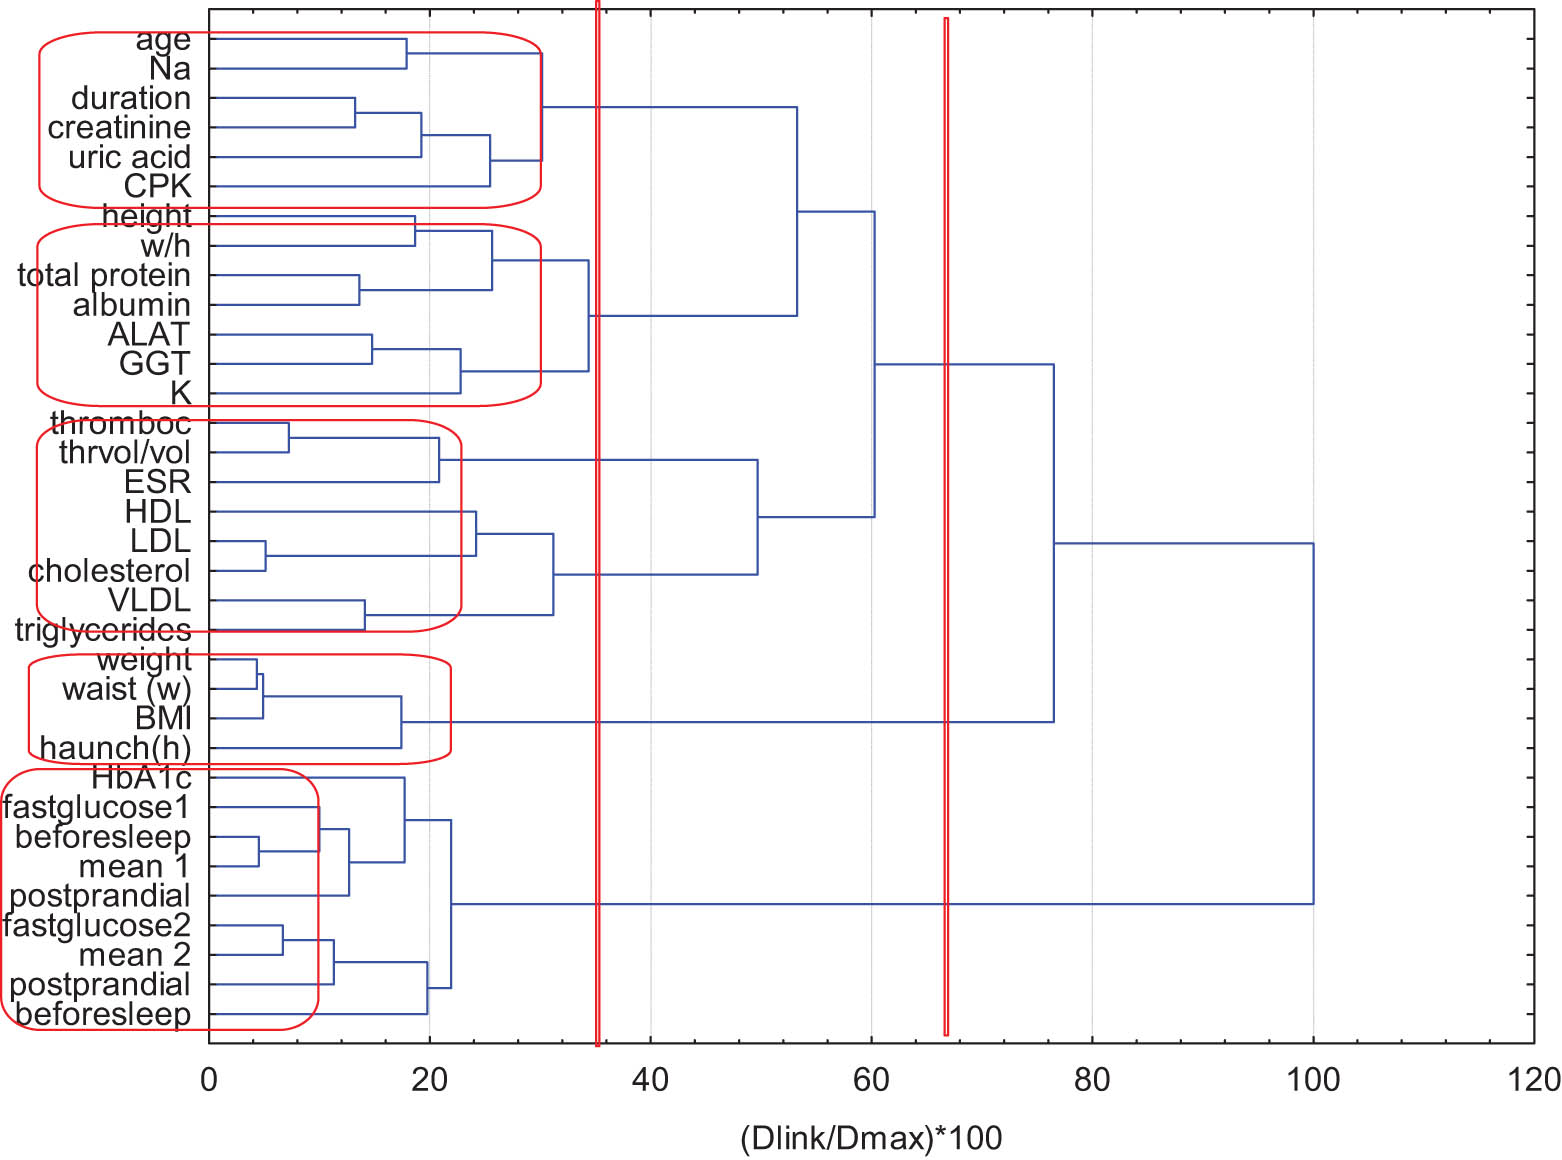
Hierarchical dendrogram for linkage of clinical parameters for the group of DMT2 patients.
Four major clusters are formed: the first one includes all glucose tests (except for HbAc1), the second one – dominantly the different cholesterol indicators and enzyme function indicators, the third one – protein and albumin levels along with HbAc1 and the last one – blood parameters, anthropometric indicators and BMI, electrolytes, cholesterol and triglycerides. It could be assumed that in the control group the clustering of the tested parameters is distributed mainly with respect to the body systems and functions involved – enzyme control and cholesterol deposition, protein exchange, blood status and metabolic syndrome assessment.
In Figure 4, the same type of dendrogram for the group of 100 patients with DMT2 is given.
The separation of the 34 clinical parameters (parameter “sex” is eliminated from the analysis since preliminary studies have proven that there is no specific division between male and female patients) leads to the formation of the following five clusters:
K1: all glucose tests including the HbAc1 test, which is considered as one of the most important indicators for long-term glycemic control – glucose indicator cluster;
K2: (weight, waist, BMI and hip) – anthropometric indicator cluster;
K3: (thrombocytes, ESR, HDL, LDL, cholesterol, VLDL and triglycerides) – this cluster indicates the link between blood quality indicators and cholesterol deposition indicators – cholesterol cluster;
K4: (ALAT, gamma-glutamyl transferase (GGK), albumin, total protein, height and K) linkage between enzyme indicators and protein indicators; the link to K seems to be interesting – enzyme cluster;
K5: (age, Na, duration, creatinine, uric acid and CPK) – logical link between age and duration of the disease as well as between the indicators for the renal function – renal function cluster.
The clustering of the clinical parameters for the DMT2 patient group indicates the specificity of the assessment of the patients with respect to the impact of the disease on the different organs and systems of the human body. It is possible to separate a reduced set of indicators (one or two from each identified cluster) to perform a rapid assessment of the health status of the DMT2 patients.
3.1.3 PCA
In order to complete and confirm the results of the hierarchical clustering of the clinical parameters, PCA was additionally carried out. It could help for interpretation of the data structure both for the control group and for patients with DMT2. Varimax rotation mode was used for both data sets (in Table S2 – SI).
Eight latent factors explain over 80% of the total variance of the system. In general, the significant grouping of clinical parameters resembles that of hierarchical clustering – all glucose tests have high factor loadings in PC1 but HbAc1 does not belong to this first principal component PC4; the anthropometric parameters weight, height and hip are correlated (high factor loadings in PC2). More detailed comparison is not very correct since in PCA one deals with eight latent factors since the identified number of clusters in the hierarchical clustering is four. But PCA gives the opportunity to reduce the number of variables by selecting representative variables from each latent factor (if it is needed to further interpretation).
PC1 (16.6% of explained variance) could be conditionally named “hyperglycemic factor” incorporating all glucose parameters with high factor loadings.
This most significant “hyperglycemic factor” (16.6%) described the increased glucose concentrations. It might reflect the inability of beta-cell to produce sufficient insulin to maintain normoglycemia, which is the cornerstone for the DMT2 development [3]. PC2 (11.9% of the total variance) indicates the close links between the anthropometric parameters and could be conditionally named “anthropometric or obesity factor”. The “obesity” factor (11.9%) emphasized the important interrelations between visceral fat mass and carbohydrate dysregulation. Visceral obesity could influence negatively the glycemic control by increasing insulin resistance and gluconeogenesis [23]. Therefore, the acquisition of healthy eating patterns and maintaining of normal body weight are among the fundamental aspects of the DMT2 treatment plan [24].
High factor loadings for almost all cholesterol indicators are found in PC3 (7.7% explanation of the total variance). It is conditionally named “lipid factor”.
The “lipid factor” might explain additional 7.7% of the group variation. The atherogenic lipid profile of DMT2 patients is characterized by specific alterations including hypertriglyceridemia, decreased HDL-cholesterol levels and a preponderance of smaller denser LDL cholesterol particles despite the normal LDL cholesterol blood levels [25]. Insulin resistance might determine not only the development of hyperglycemia but also the progress of lipid abnormalities. The increased secretion of free fatty acid from the adipose tissue as well as their decreased utilization in the skeletal muscles due to insulin resistance might enhance their efflux to the liver leading to impaired triglyceride metabolism [26]. The correction of lipid abnormalities in diabetic patients might decrease the risk for macrovascular complications and reduce the cardiovascular morbidity and mortality [27].
The PC4 indicates good correlation between thrombocytes and ESR (7.4% explained variance) and the conditional name given is “inflammatory factor”.
The bidirectional interrelations between the DMT2 and inflammation might explain 7.4% of the variations among diabetic patients and controls. Obesity and insulin resistance are often associated with an increased expression of various pro-inflammatory adipocytokines that might contribute to the maintenance of chronic low-grade systemic inflammation. The inflammatory response could facilitate the development of DMT2 by aggravating the insulin resistance and hyperglycemia, thus creating a vicious circle [28,29]. Since metabolic dysregulation itself maintains inflammation, the adequate treatment of the DMT2, obesity and dyslipidemia might reduce inflammation by improving the metabolic parameters [30]. The use of specific anti-inflammatory agents for reduction of insulin resistance is a matter of further research.
PC5 shows high loadings for age, duration of the disease (very logical link), uric acid and creatinine (explained variance of 7.3%). It indicates the impact of the disease on the kidneys and could be conditionally named “renal function factor”.
The age and renal function are important determinants of the intragroup variation (7.3%). Ageing is related to specific difficulties in the diabetes care because of the pronounced heterogeneity in the health status of older adults, different patient’s life expectancy, presence of comorbidities, increased risk for hypoglycemia and inability to transfer automatically the results from anti-diabetic studies conducted on younger patients to older ones [42]. The care for patients with renal impairment faces similar problems apart from the specifically limited therapeutic options [31].
The sixth latent factor explains additional 7.1% of the total variance. Its conditional name could be “liver function factor” as it demonstrates correlation between ALAT and GGT. Additionally, it offers a specific link between the enzyme indicators with potassium that could not be explained outside the context of unreported dietary habits or concomitant treatment.
The liver function is another crucial factor that might explain additional 7.1% of the total variance. Hepatocytes are main regulators of the glucose homeostasis through the processes of glycogen storage, glycogenolysis and gluconeogenesis. Thus, hyperglycemic states are often found in patients with hepatic diseases [32]. However, the treatment of diabetes mellitus in patients with liver disorders might be a challenge, because of the increased prevalence of concomitant malnutrition, alcohol abuse, increased risk of hypoglycemia as well as possible side effect of oral antidiabetic drugs metabolized in the liver [33].
PC7 (6.5% explanation of the total variance) is a conditional “protein factor” since it reveals high factor loadings for total protein and albumin.
The last involved latent component PC8 (5.1% explanation of the total variance) indicates the specific role of CPK in the assessment of the health status of the patients.
The importance of the other two latent factors, such as protein and CPK levels, is probably associated with an influence of concomitant conditions and/or medications. The described traits emphasize on the need of personalized complex care for the individuals at increased risk for hyperglycemia including a treatment of concomitant obesity, dyslipidemia and subclinical inflammation considering their age, renal and liver functions.
Since the PCA is a traditional method for space reduction, the further goals of the study were important to select respective variables from the strongly correlated (high factor loadings) parameters of each identified latent factor. Considering the important influence of the postprandial glucose load, obesity, inflammation, renal and liver functions for the health status of the patients with DM2 a restricted set of main indicators was chosen: postprandial glucose 1, BMI, cholesterol, thrombocytes, creatinine, uric acid, GGT and K. These indicators represent each latent factor and count for the role of the glucose tests, anthropometric indicators, liver function, renal function, inflammation markers, lipid profile and electrolytes for effective assessment of the health status of DMT2 patients.
In Figure 5, the hierarchical dendrogram for all 120 objects of the study (controls and DMT2 patients) is presented.
Hierarchical dendrogram for separation between objects of the control group (marked) and DMT2 patients using eight selected significant parameters.
It is seen that the separation between both classes of objects is achieved. The only minor exception is that two patients with DMT2 are wrongly attributed to the control group. This is statistically completely acceptable.
One of the general objectives of the present study is to divide the DMT2 patients into groups of similarity (clusters) using a discrete number of important parameters. This classification could be of use to specific observation of the health status of the different patients and, additionally, to support in identifying symptoms of accompanying DMT2 diseases and complications.
In Figure 6, the hierarchical dendrogram for clustering of 100 DTM2 patients using 8 significant clinical and anthropometric indicators is shown.
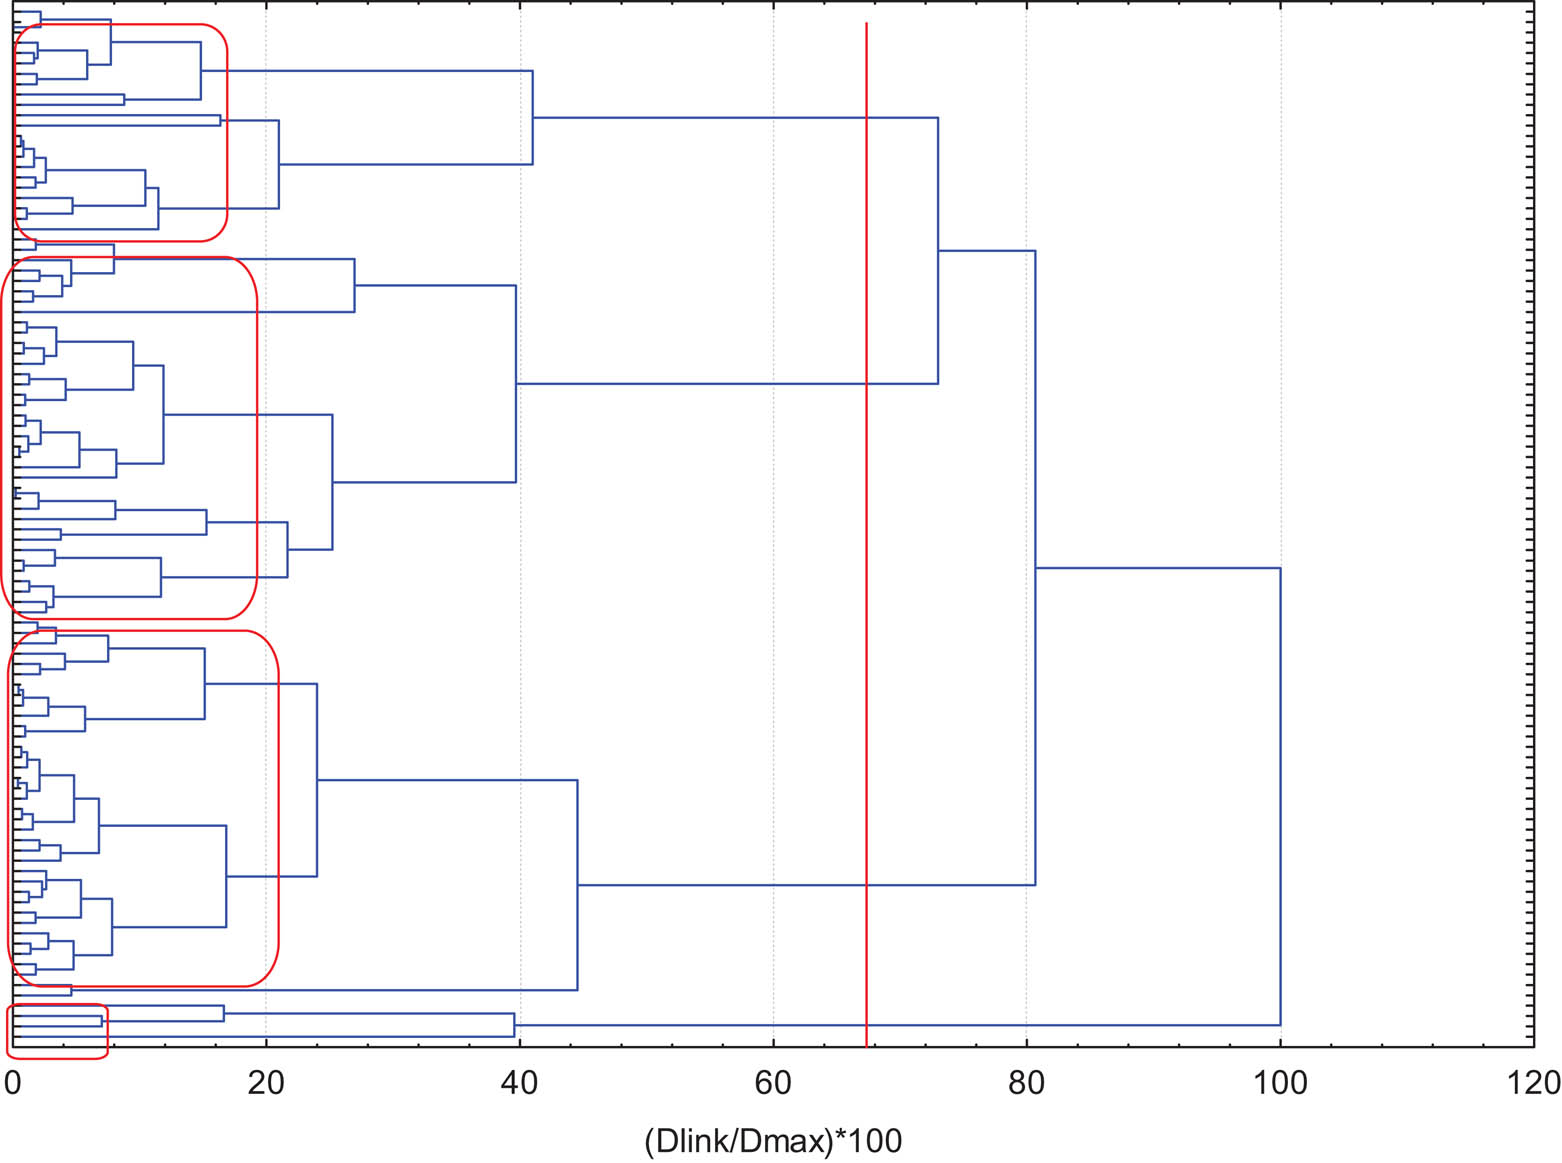
Hierarchical dendrogram for clustering of 100 DMT2 patients using 8 variables.
Four significant clusters are formed. The members of each cluster are as follows:
Cluster 1 (25 members),
Cluster 2 (31 members),
Cluster 3 (38 members) and
Cluster 4 (6 members).
It could be assumed that each cluster represents patients with specific health status pattern. In order to determine the major discriminants for each pattern of patients, the average values (as standardized values) for each parameter for each cluster were calculated. Figure 7 represents the results.
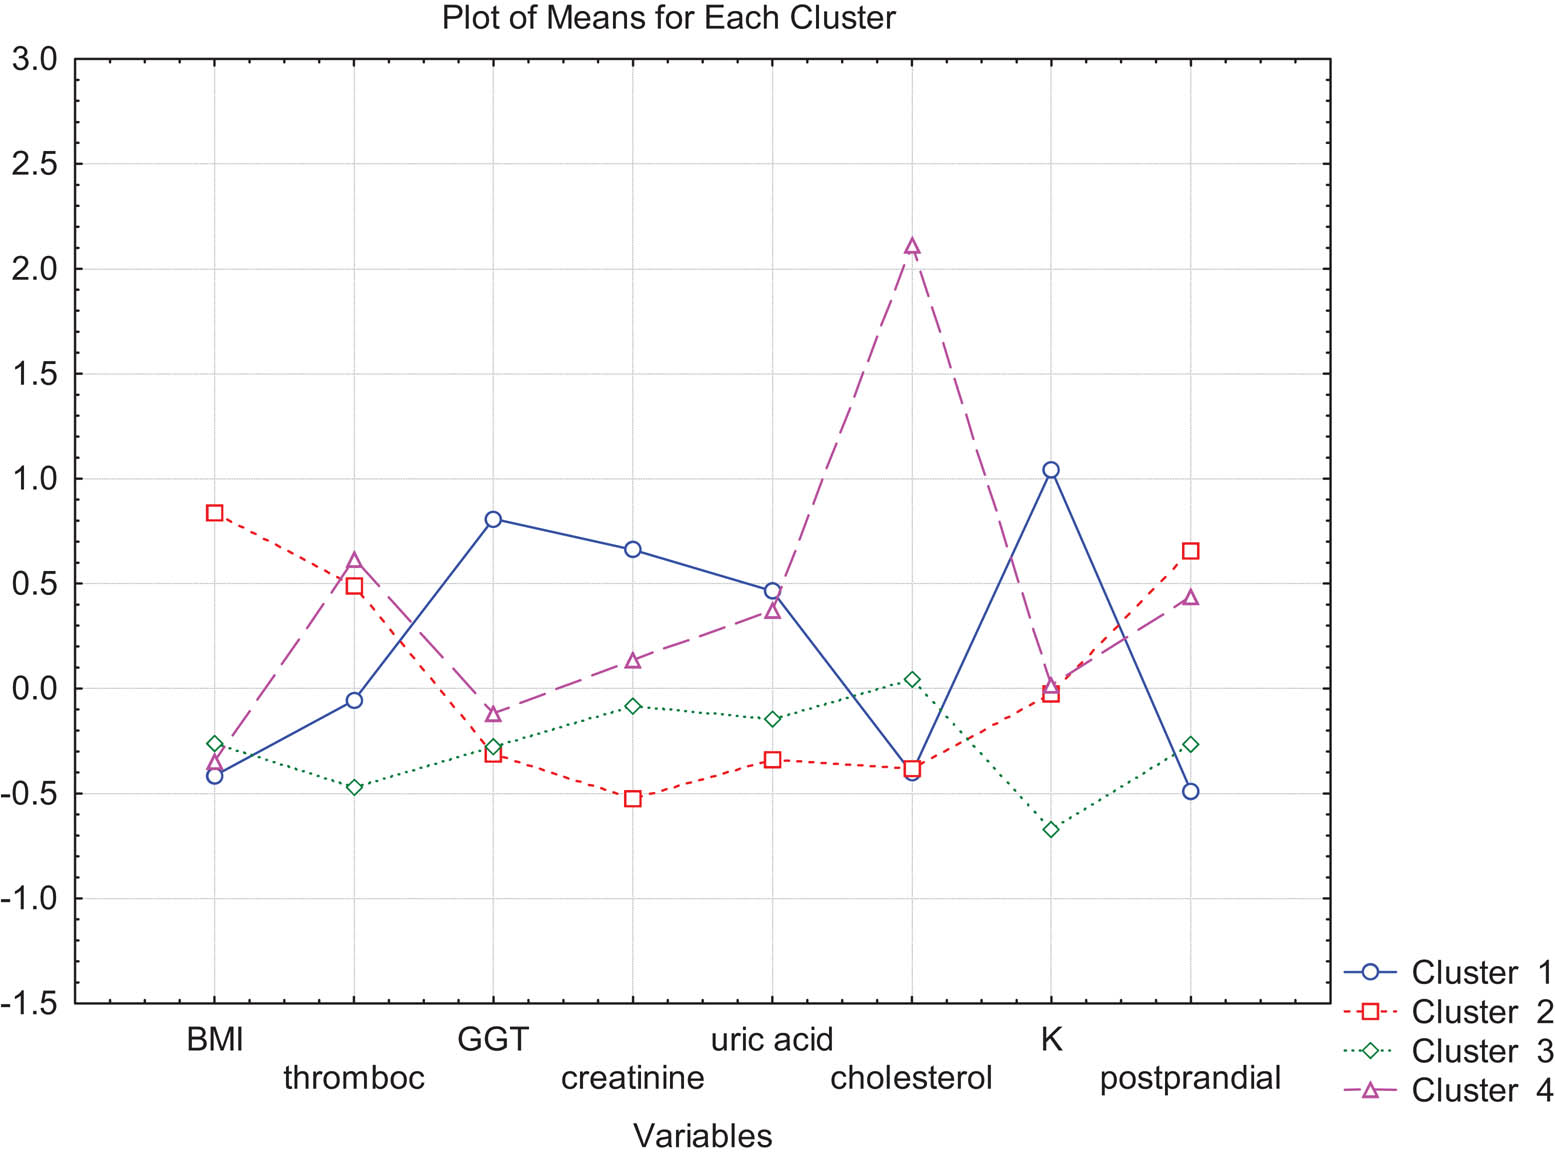
Plot of means (standardized values) for each parameter for each identified cluster.
Cluster 1 is characterized by highest levels for GGT, creatinine, uric acid and K. At the same time, it indicates low BMI, cholesterol and glucose levels. It could be assumed that the 25 members of this cluster might suffer from microvascular complications, such as diabetic nephropathy or they might have concomitant liver or renal diseases despite the relatively good glycemic control.
Cluster 2 includes DMT2 patients (quite significant number) with worsened DMT2 status indicated by the highest BMI and glucose level (the most significant discriminants for DMT2). There are no further indications for accompanying health problems.
Cluster 3 is the pattern of patients (largest number of members) with improved DMT2 status with no extreme values of the clinical and anthropometric indicators.
Cluster 4 involves a limited number of patients (only six). Although having low mean values for BMI, this pattern of patients shows still high glucose levels as well as and, additionally, highest cholesterol and thrombocyte levels, relatively high creatinine and uric acid levels. The DMT2 status requires significant improvement because of increased risk of micro- and macrovascular complications and cardiovascular morbidity and mortality.
The present study succeeded to distribute the DMT2 patients into groups of similarity (patterns or phenotypes) using a reduced number of commonly tested para meters. Using the described statistical approach, four phenotypes of diabetic patients could be additionally interpreted.
Phenotype 1 was characterized by parameters suggesting impaired renal and liver functions. The BMI, cholesterol and glucose levels were relatively low reflecting the complicated balance between optimal glycemic control, malnutrition and the avoidance of hypoglycemia [31,33]. Therefore, the therapeutic intensity and goals might be less stringent in this category.
Phenotype 2 includes obese diabetic patients with poor glycemic control but no signs of concomitant health problems. The therapeutic approach in these patients should be focused on more intense therapy plan including lifestyle changes, healthy diet as well as antidiabetic drugs considering optimal medication adherence. The maintenance of healthy weight as well as the intensive glycemic control with the goal of achieving near-normoglycemia is crucial for the prevention of diabetic complications [34].
Phenotype 3 includes diabetic patients with optimal laboratory parameters and good control of the hyperglycemia. Thus, no therapy changes are needed in this group of individuals.
Phenotype 4 consists of a limited number of patients with unfavorable lipid and glucose values as well as increased uric acid levels despite the lack of obesity. Probably, these individuals belong to the group of so-called metabolically obese but normal weight patients, who are at increased cardiovascular risk due to increased insulin resistance, hyperglycemia and visceral fat deposition [35]. Moreover, normal-weight elderly people with metabolic disturbances have shown a higher risk of cardiovascular and all-cause mortality in comparison to obese individuals without metabolic disturbances [36]. Therefore, only the aggressive treatment of lipid abnormalities as well as the persistent efforts to optimize glycemic control might preclude the development of macrovascular complications in that group of patients.
4 Conclusion
The application of exploratory data analysis to classify, model and interpret clinical data of DMT2 patients has many aspects – to predict DMT2 by classification methods among large group of patients, to model the trajectories of the disease by interpretation of specific indicators, to identify metabolic and genetic biomarkers in patients with DMT2 and concomitant cardio-vascular factors by chemometric approaches, to study diabetic complications etc. [37,38,39,40].
In the present study, an effort is made to determine significant indicators out of all typical clinical and anthropometric data for DMT2 patients. The variable reduction offered (8 out of 35 variables) makes it possible to achieve the major goals of the study:
To classify correctly into different class members of the control group of healthy volunteers from patients with DMT2.
To determine by rapid tests, the specific health status of statistically significant patterns (clusters) of patients, which allows specific treatment and health care.
To offer discriminant parameters for each identified specific pattern of DMT2 patients.
To create a statistical basis for the personalized approach in the treatment of patients with DMT2 and concomitant diseases.
The present study has used intelligent data analysis to explain the variable traits of diabetic patients compared to the control group, which could reflect the differences in the pathophysiological mechanisms related to the disease. Moreover, different phenotypes of patients have been identified as in other studies, which might require distinct therapeutic approach and goals [41].
In conclusion, further efforts to differentiate distinct pathophysiological mechanisms and clinical subgroups through the PCA might contribute to the development of personalized approach in the management of diabetic patients.
Acknowledgments
Funding: This project was supported by the BSF grant number KP-06-OPR-03/14-2018 and by the Sofia University.
Author contributions: Conceptualization: M. N. and V. S.; methodology: M. N. and V. S.; software: D. B., M. N. and V. S; data writing – original draft preparation: M. N., R. R., J. R. and V. S.; and writing – review and editing: M. N., S. M., R. R., J. R., I. K., A. E. and V. S.
Conflict of interest: The authors declare no conflict of interest.
References
[1] Blair M. Diabetes mellitus review. Urol Nurs. 2016;36:27–36.10.7257/1053-816X.2016.36.1.27Search in Google Scholar
[2] Bullard KM, Cowie CC, Lessem SE, Saydah SH, Menke A, Geiss LS, et al. Prevalence of diagnosed diabetes in adults by diabetes type – United States, 2016. Morb Mortal Wkly Rep. 2018;67:359–61.10.15585/mmwr.mm6712a2Search in Google Scholar PubMed PubMed Central
[3] Defronzo RA. From the triumvirate to the “ominous octet”: a new paradigm for the treatment of type 2 diabetes mellitus. Clin Diabetol. 2009;10:101–28.10.2337/db09-9028Search in Google Scholar PubMed PubMed Central
[4] Seuring T, Archangelidi O, Suhrcke M. The economic costs of type 2 diabetes: a global systematic review. Pharmacoeconomics. 2015;33:811–31.10.1007/s40273-015-0268-9Search in Google Scholar PubMed PubMed Central
[5] Sortsoe C, Green A, Jensen PB, Emneus M. Societal costs of diabetes mellitus in Denmark. Diabet Med. 2016;33:877–85.10.1111/dme.12965Search in Google Scholar PubMed PubMed Central
[6] Litwak L, Goh S-Y, Hussein Z, Malek R, Prusty V, Khamseh ME. Prevalence of diabetes complications in people with type 2 diabetes mellitus and its association with baseline characteristics in the multinational A1chieve study. Diabetol Metab Syndr. 2013;5:57.10.1186/1758-5996-5-57Search in Google Scholar PubMed PubMed Central
[7] Papazafiropoulou AK, Bakomitrou F, Trikallinou A, Ganotopoulou A, Verras C, Christofilidis G, et al. Diabetes-dependent quality of life (ADDQOL) and affecting factors in patients with diabetes mellitus type 2 in Greece. BMC Res Notes. 2015;8:786.10.1186/s13104-015-1782-8Search in Google Scholar PubMed PubMed Central
[8] American Diabetes Association. Economic costs of diabetes in the US in 2017. Diabetes Care. 2018;41:917–28.10.2337/dci18-0007Search in Google Scholar PubMed PubMed Central
[9] American Diabetes Association. Improving care and promoting health in populations: standards of medical care in diabetes-2018. Diabetes Care. 2018;41:7–12.10.2337/dc18-S001Search in Google Scholar PubMed
[10] Tan B, Liang Y, Yi L, Li H, Zhou Z, Ji X, et al. Identification of free fatty acids profiling of type 2 diabetes mellitus and exploring possible biomarkers by GC-MS coupled with chemometrics. Metabolomics. 2010;6:219–228.10.1007/s11306-009-0189-8Search in Google Scholar
[11] Chen H, Tan C. Prediction of type-2 diabetes based on several element levels in blood and chemometrics. Biol Trace Elem Res. 2012;147:67–74.10.1007/s12011-011-9306-4Search in Google Scholar PubMed
[12] Chen H, Tan C, Lin Z, Wu T. The diagnostics of diabetes mellitus based on ensemble modeling and hair/urine element level analysis. Comput Biol Med. 2014;50:70–5.10.1016/j.compbiomed.2014.04.012Search in Google Scholar PubMed
[13] Carrizo D, Chevallier OP, Woodside JV, Brennan SF, Cantwell MM, Cuskelly G, et al. Untargeted metabolomic analysis of human serum samples associated with exposure levels of persistent organic pollutants indicate important perturbations in Sphingolipids and Glycerophospholipids levels. Chemosphere. 2017;168:731–8.10.1016/j.chemosphere.2016.11.001Search in Google Scholar PubMed
[14] Carter JA, Long CS, Smith BP, Smith TL, Donati GL. Combining elemental analysis of toenails and machine learning techniques as a non-invasive diagnostic tool for the robust classification of type-2 diabetes. Expert Syst Appl. 2019;115:245–55.10.1016/j.eswa.2018.08.002Search in Google Scholar
[15] Ogurtsova K, da Rocha Fernandes JD, Huang Y, Linnenkamp U, Guariguata L, Cho NH, et al. IDF diabetes atlas: global estimates for the prevalence of diabetes for 2015 and 2040. Diabetes Res Clin Pract. 2017;128:40–50.10.1016/j.diabres.2017.03.024Search in Google Scholar PubMed
[16] Massart DL, Kaufman L. The interpretation of analytical chemical data by the use of cluster analysis. New York: Wiley; 1983.Search in Google Scholar
[17] Vandeginste B, Massart D, De Jong S, Massaart D, Buydens L. Handbook of chemometrics and qualimetrics: art Bp. Elsevier: Amsterdam; 1998.Search in Google Scholar
[18] Höskuldsson A. PLS regression methods. J Chemom. 1988;2:211–28.10.1002/cem.1180020306Search in Google Scholar
[19] Barker M, Rayens W. Partial least squares for discrimination. J Chemom. 2003;17:166–73.10.1002/cem.785Search in Google Scholar
[20] Pérez NF, Ferré J, Boqué R. Calculation of the reliability of classification in discriminant partial least-squares binary classification. Chemom Intell Lab Syst. 2009;95:122–8.10.1016/j.chemolab.2008.09.005Search in Google Scholar
[21] Hill T, Lewicki P, Lewicki P. Statistics: methods and applications: a comprehensive reference for science, industry, and data mining. StatSoft, Inc. United Kingdom; 2006.Search in Google Scholar
[22] Ballabio D, Consonni V. Classification tools in chemistry. Part 1: linear models. PLS-DA. Anal Methods. 2013;5:3790–8.10.1039/c3ay40582fSearch in Google Scholar
[23] Gastaldelli A, Miyazaki Y, Pettiti M, Matsuda M, Mahankali S, Santini E, et al. Metabolic effects of visceral fat accumulation in type 2 diabetes. J Clin Endocrinol Metab. 2002;87:5098–103.10.1210/jc.2002-020696Search in Google Scholar PubMed
[24] American Diabetes Association. Lifestyle management: standards of medical care in diabetes – 2019. Diabetes Care. 2019;42:46–60.10.2337/dc19-S005Search in Google Scholar PubMed
[25] Haffner SM. Management of dyslipidemia in adults with diabetes. Diabetes Care. 2003;26:83–6.10.2337/diacare.21.1.160Search in Google Scholar PubMed
[26] Krauss RM. Lipids and lipoproteins in patients with type 2 diabetes. Diabetes Care. 2004;27:1496–504.10.2337/diacare.27.6.1496Search in Google Scholar PubMed
[27] Krentz AJ. Lipoprotein abnormalities and their consequences for patients with type 2 diabetes. Diabetes Obes Metab. 2003;5:19–27.10.1046/j.1462-8902.2003.0310.xSearch in Google Scholar PubMed
[28] Wieser V, Moschen AR, Tilg H. Inflammation, cytokines and insulin resistance: a clinical perspective. Arch Immunol Ther Exp (Warsz). 2013;61:119–25.10.1007/s00005-012-0210-1Search in Google Scholar PubMed
[29] Lontchi-Yimagou E, Sobngwi E, Matsha TE, Kengne AP. Diabetes mellitus and inflammation. Curr Diab Rep. 2013;13:435–44.10.1007/s11892-013-0375-ySearch in Google Scholar PubMed
[30] Pollack RM, Donath MY, LeRoith D, Leibowitz G. Anti-inflammatory agents in the treatment of diabetes and its vascular complications. Diabetes Care. 2016;39:S244–52.10.2337/dcS15-3015Search in Google Scholar PubMed
[31] Ioannidis I. Diabetes treatment in patients with renal disease: is the landscape clear enough? World J Diabetes. 2014;5:651–8.10.4239/wjd.v5.i5.651Search in Google Scholar PubMed PubMed Central
[32] Picardi A, D’Avola D, Gentilucci UV, Galati G, Fiori E, Spataro S, et al. Diabetes in chronic liver disease: from old concepts to new evidence. Diabetes Metab Res Rev. 2006;22:274–83.10.1002/dmrr.636Search in Google Scholar PubMed
[33] Gangopadhyay KK, Singh P. Consensus statement on dose modifications of antidiabetic agents in patients with hepatic impairment. Indian J Endocrinol Metab. 2017;21:341–54.10.4103/ijem.IJEM_512_16Search in Google Scholar PubMed PubMed Central
[34] American Diabetes Association. 11. Microvascular complications and foot care: standards of medical care in diabetes – 2019. Diabetes Care. 2019;42:S124–38.10.2337/dc19-S011Search in Google Scholar PubMed
[35] Conus F, Rabasa-Lhoret R, Peronnet F. Characteristics of metabolically obese normal-weight (MONW) subjects. Appl Physiol Nutr Metab. 2007;32:4–12.10.1139/h06-092Search in Google Scholar PubMed
[36] Choi KM, Cho HJ, Choi HY, Yang SJ, Yoo HJ, Seo JA, et al. Higher mortality in metabolically obese normal-weight people than in metabolically healthy obese subjects in elderly Koreans. Clin Endocrinol. 2013;79:364–70.10.1111/cen.12154Search in Google Scholar PubMed
[37] Habibi S, Ahmadi M, Alizadeh S. Type 2 diabetes mellitus screening and risk factors using decision tree: results of data mining. Glob J Health Sci. 2015;7:304–10.10.5539/gjhs.v7n5p304Search in Google Scholar PubMed PubMed Central
[38] Oh W, Kim E, Castro MR, Caraballo PJ, Kumar V, Steinbach MS, et al. Type 2 diabetes mellitus trajectories and associated risks. Big Data. 2016;4:25–30.10.1089/big.2015.0029Search in Google Scholar PubMed PubMed Central
[39] Evangelista AF, Collares CV, Xavier DJ, Macedo C, Manoel-Caetano FS, Rassi DM, et al. Integrative analysis of the transcriptome profiles observed in type 1, type 2 and gestational diabetes mellitus reveals the role of inflammation. BMC Med Genom. 2014;7:28.10.1186/1755-8794-7-28Search in Google Scholar PubMed PubMed Central
[40] Won JC, Im Y-J, Lee J-H, Kim CH, Kwon HS, Cha B-Y, et al. Clinical phenotype of diabetic peripheral neuropathy and relation to symptom patterns: cluster and factor analysis in patients with type 2 diabetes in Korea. J Diabetes Res. 2017;2017:5751687.10.1155/2017/5751687Search in Google Scholar PubMed PubMed Central
[41] Montero RM, Herath A, Qureshi A, Esfandiari E, Pusey CD, Frankel AH, et al. Defining phenotypes in diabetic nephropathy: a novel approach using a cross-sectional analysis of a single centre cohort. Sci Rep. 2018;8:53,1–8.10.1038/s41598-017-18595-1Search in Google Scholar PubMed PubMed Central
[42] Bradley D, Hsueh W. Type 2 Diabetes in the Elderly: Challenges in a Unique Patient Population. J Geriatr Med Gerontol. 2016;2(2):14.10.23937/2469-5858/1510014Search in Google Scholar PubMed PubMed Central
© 2020 Miroslava Nedyalkova et al., published by De Gruyter
This work is licensed under the Creative Commons Attribution 4.0 International License.
Articles in the same Issue
- Regular Articles
- Electrochemical antioxidant screening and evaluation based on guanine and chitosan immobilized MoS2 nanosheet modified glassy carbon electrode (guanine/CS/MoS2/GCE)
- Kinetic models of the extraction of vanillic acid from pumpkin seeds
- On the maximum ABC index of bipartite graphs without pendent vertices
- Estimation of the total antioxidant potential in the meat samples using thin-layer chromatography
- Molecular dynamics simulation of sI methane hydrate under compression and tension
- Spatial distribution and potential ecological risk assessment of some trace elements in sediments and grey mangrove (Avicennia marina) along the Arabian Gulf coast, Saudi Arabia
- Amino-functionalized graphene oxide for Cr(VI), Cu(II), Pb(II) and Cd(II) removal from industrial wastewater
- Chemical composition and in vitro activity of Origanum vulgare L., Satureja hortensis L., Thymus serpyllum L. and Thymus vulgaris L. essential oils towards oral isolates of Candida albicans and Candida glabrata
- Effect of excess Fluoride consumption on Urine-Serum Fluorides, Dental state and Thyroid Hormones among children in “Talab Sarai” Punjab Pakistan
- Design, Synthesis and Characterization of Novel Isoxazole Tagged Indole Hybrid Compounds
- Comparison of kinetic and enzymatic properties of intracellular phosphoserine aminotransferases from alkaliphilic and neutralophilic bacteria
- Green Organic Solvent-Free Oxidation of Alkylarenes with tert-Butyl Hydroperoxide Catalyzed by Water-Soluble Copper Complex
- Ducrosia ismaelis Asch. essential oil: chemical composition profile and anticancer, antimicrobial and antioxidant potential assessment
- DFT calculations as an efficient tool for prediction of Raman and infra-red spectra and activities of newly synthesized cathinones
- Influence of Chemical Osmosis on Solute Transport and Fluid Velocity in Clay Soils
- A New fatty acid and some triterpenoids from propolis of Nkambe (North-West Region, Cameroon) and evaluation of the antiradical scavenging activity of their extracts
- Antiplasmodial Activity of Stigmastane Steroids from Dryobalanops oblongifolia Stem Bark
- Rapid identification of direct-acting pancreatic protectants from Cyclocarya paliurus leaves tea by the method of serum pharmacochemistry combined with target cell extraction
- Immobilization of Pseudomonas aeruginosa static biomass on eggshell powder for on-line preconcentration and determination of Cr (VI)
- Assessment of methyl 2-({[(4,6-dimethoxypyrimidin-2-yl)carbamoyl] sulfamoyl}methyl)benzoate through biotic and abiotic degradation modes
- Stability of natural polyphenol fisetin in eye drops Stability of fisetin in eye drops
- Production of a bioflocculant by using activated sludge and its application in Pb(II) removal from aqueous solution
- Molecular Properties of Carbon Crystal Cubic Structures
- Synthesis and characterization of calcium carbonate whisker from yellow phosphorus slag
- Study on the interaction between catechin and cholesterol by the density functional theory
- Analysis of some pharmaceuticals in the presence of their synthetic impurities by applying hybrid micelle liquid chromatography
- Two mixed-ligand coordination polymers based on 2,5-thiophenedicarboxylic acid and flexible N-donor ligands: the protective effect on periodontitis via reducing the release of IL-1β and TNF-α
- Incorporation of silver stearate nanoparticles in methacrylate polymeric monoliths for hemeprotein isolation
- Development of ultrasound-assisted dispersive solid-phase microextraction based on mesoporous carbon coated with silica@iron oxide nanocomposite for preconcentration of Te and Tl in natural water systems
- N,N′-Bis[2-hydroxynaphthylidene]/[2-methoxybenzylidene]amino]oxamides and their divalent manganese complexes: Isolation, spectral characterization, morphology, antibacterial and cytotoxicity against leukemia cells
- Determination of the content of selected trace elements in Polish commercial fruit juices and health risk assessment
- Diorganotin(iv) benzyldithiocarbamate complexes: synthesis, characterization, and thermal and cytotoxicity study
- Keratin 17 is induced in prurigo nodularis lesions
- Anticancer, antioxidant, and acute toxicity studies of a Saudi polyherbal formulation, PHF5
- LaCoO3 perovskite-type catalysts in syngas conversion
- Comparative studies of two vegetal extracts from Stokesia laevis and Geranium pratense: polyphenol profile, cytotoxic effect and antiproliferative activity
- Fragmentation pattern of certain isatin–indole antiproliferative conjugates with application to identify their in vitro metabolic profiles in rat liver microsomes by liquid chromatography tandem mass spectrometry
- Investigation of polyphenol profile, antioxidant activity and hepatoprotective potential of Aconogonon alpinum (All.) Schur roots
- Lead discovery of a guanidinyl tryptophan derivative on amyloid cascade inhibition
- Physicochemical evaluation of the fruit pulp of Opuntia spp growing in the Mediterranean area under hard climate conditions
- Electronic structural properties of amino/hydroxyl functionalized imidazolium-based bromide ionic liquids
- New Schiff bases of 2-(quinolin-8-yloxy)acetohydrazide and their Cu(ii), and Zn(ii) metal complexes: their in vitro antimicrobial potentials and in silico physicochemical and pharmacokinetics properties
- Treatment of adhesions after Achilles tendon injury using focused ultrasound with targeted bFGF plasmid-loaded cationic microbubbles
- Synthesis of orotic acid derivatives and their effects on stem cell proliferation
- Chirality of β2-agonists. An overview of pharmacological activity, stereoselective analysis, and synthesis
- Fe3O4@urea/HITh-SO3H as an efficient and reusable catalyst for the solvent-free synthesis of 7-aryl-8H-benzo[h]indeno[1,2-b]quinoline-8-one and indeno[2′,1′:5,6]pyrido[2,3-d]pyrimidine derivatives
- Adsorption kinetic characteristics of molybdenum in yellow-brown soil in response to pH and phosphate
- Enhancement of thermal properties of bio-based microcapsules intended for textile applications
- Exploring the effect of khat (Catha edulis) chewing on the pharmacokinetics of the antiplatelet drug clopidogrel in rats using the newly developed LC-MS/MS technique
- A green strategy for obtaining anthraquinones from Rheum tanguticum by subcritical water
- Cadmium (Cd) chloride affects the nutrient uptake and Cd-resistant bacterium reduces the adsorption of Cd in muskmelon plants
- Removal of H2S by vermicompost biofilter and analysis on bacterial community
- Structural cytotoxicity relationship of 2-phenoxy(thiomethyl)pyridotriazolopyrimidines: Quantum chemical calculations and statistical analysis
- A self-breaking supramolecular plugging system as lost circulation material in oilfield
- Synthesis, characterization, and pharmacological evaluation of thiourea derivatives
- Application of drug–metal ion interaction principle in conductometric determination of imatinib, sorafenib, gefitinib and bosutinib
- Synthesis and characterization of a novel chitosan-grafted-polyorthoethylaniline biocomposite and utilization for dye removal from water
- Optimisation of urine sample preparation for shotgun proteomics
- DFT investigations on arylsulphonyl pyrazole derivatives as potential ligands of selected kinases
- Treatment of Parkinson’s disease using focused ultrasound with GDNF retrovirus-loaded microbubbles to open the blood–brain barrier
- New derivatives of a natural nordentatin
- Fluorescence biomarkers of malignant melanoma detectable in urine
- Study of the remediation effects of passivation materials on Pb-contaminated soil
- Saliva proteomic analysis reveals possible biomarkers of renal cell carcinoma
- Withania frutescens: Chemical characterization, analgesic, anti-inflammatory, and healing activities
- Design, synthesis and pharmacological profile of (−)-verbenone hydrazones
- Synthesis of magnesium carbonate hydrate from natural talc
- Stability-indicating HPLC-DAD assay for simultaneous quantification of hydrocortisone 21 acetate, dexamethasone, and fluocinolone acetonide in cosmetics
- A novel lactose biosensor based on electrochemically synthesized 3,4-ethylenedioxythiophene/thiophene (EDOT/Th) copolymer
- Citrullus colocynthis (L.) Schrad: Chemical characterization, scavenging and cytotoxic activities
- Development and validation of a high performance liquid chromatography/diode array detection method for estrogen determination: Application to residual analysis in meat products
- PCSK9 concentrations in different stages of subclinical atherosclerosis and their relationship with inflammation
- Development of trace analysis for alkyl methanesulfonates in the delgocitinib drug substance using GC-FID and liquid–liquid extraction with ionic liquid
- Electrochemical evaluation of the antioxidant capacity of natural compounds on glassy carbon electrode modified with guanine-, polythionine-, and nitrogen-doped graphene
- A Dy(iii)–organic framework as a fluorescent probe for highly selective detection of picric acid and treatment activity on human lung cancer cells
- A Zn(ii)–organic cage with semirigid ligand for solvent-free cyanosilylation and inhibitory effect on ovarian cancer cell migration and invasion ability via regulating mi-RNA16 expression
- Polyphenol content and antioxidant activities of Prunus padus L. and Prunus serotina L. leaves: Electrochemical and spectrophotometric approach and their antimicrobial properties
- The combined use of GC, PDSC and FT-IR techniques to characterize fat extracted from commercial complete dry pet food for adult cats
- MALDI-TOF MS profiling in the discovery and identification of salivary proteomic patterns of temporomandibular joint disorders
- Concentrations of dioxins, furans and dioxin-like PCBs in natural animal feed additives
- Structure and some physicochemical and functional properties of water treated under ammonia with low-temperature low-pressure glow plasma of low frequency
- Mesoscale nanoparticles encapsulated with emodin for targeting antifibrosis in animal models
- Amine-functionalized magnetic activated carbon as an adsorbent for preconcentration and determination of acidic drugs in environmental water samples using HPLC-DAD
- Antioxidant activity as a response to cadmium pollution in three durum wheat genotypes differing in salt-tolerance
- A promising naphthoquinone [8-hydroxy-2-(2-thienylcarbonyl)naphtho[2,3-b]thiophene-4,9-dione] exerts anti-colorectal cancer activity through ferroptosis and inhibition of MAPK signaling pathway based on RNA sequencing
- Synthesis and efficacy of herbicidal ionic liquids with chlorsulfuron as the anion
- Effect of isovalent substitution on the crystal structure and properties of two-slab indates BaLa2−xSmxIn2O7
- Synthesis, spectral and thermo-kinetics explorations of Schiff-base derived metal complexes
- An improved reduction method for phase stability testing in the single-phase region
- Comparative analysis of chemical composition of some commercially important fishes with an emphasis on various Malaysian diets
- Development of a solventless stir bar sorptive extraction/thermal desorption large volume injection capillary gas chromatographic-mass spectrometric method for ultra-trace determination of pyrethroids pesticides in river and tap water samples
- A turbidity sensor development based on NL-PI observers: Experimental application to the control of a Sinaloa’s River Spirulina maxima cultivation
- Deep desulfurization of sintering flue gas in iron and steel works based on low-temperature oxidation
- Investigations of metallic elements and phenolics in Chinese medicinal plants
- Influence of site-classification approach on geochemical background values
- Effects of ageing on the surface characteristics and Cu(ii) adsorption behaviour of rice husk biochar in soil
- Adsorption and sugarcane-bagasse-derived activated carbon-based mitigation of 1-[2-(2-chloroethoxy)phenyl]sulfonyl-3-(4-methoxy-6-methyl-1,3,5-triazin-2-yl) urea-contaminated soils
- Antimicrobial and antifungal activities of bifunctional cooper(ii) complexes with non-steroidal anti-inflammatory drugs, flufenamic, mefenamic and tolfenamic acids and 1,10-phenanthroline
- Application of selenium and silicon to alleviate short-term drought stress in French marigold (Tagetes patula L.) as a model plant species
- Screening and analysis of xanthine oxidase inhibitors in jute leaves and their protective effects against hydrogen peroxide-induced oxidative stress in cells
- Synthesis and physicochemical studies of a series of mixed-ligand transition metal complexes and their molecular docking investigations against Coronavirus main protease
- A study of in vitro metabolism and cytotoxicity of mephedrone and methoxetamine in human and pig liver models using GC/MS and LC/MS analyses
- A new phenyl alkyl ester and a new combretin triterpene derivative from Combretum fragrans F. Hoffm (Combretaceae) and antiproliferative activity
- Erratum
- Erratum to: A one-step incubation ELISA kit for rapid determination of dibutyl phthalate in water, beverage and liquor
- Review Articles
- Sinoporphyrin sodium, a novel sensitizer for photodynamic and sonodynamic therapy
- Natural products isolated from Casimiroa
- Plant description, phytochemical constituents and bioactivities of Syzygium genus: A review
- Evaluation of elastomeric heat shielding materials as insulators for solid propellant rocket motors: A short review
- Special Issue on Applied Biochemistry and Biotechnology 2019
- An overview of Monascus fermentation processes for monacolin K production
- Study on online soft sensor method of total sugar content in chlorotetracycline fermentation tank
- Studies on the Anti-Gouty Arthritis and Anti-hyperuricemia Properties of Astilbin in Animal Models
- Effects of organic fertilizer on water use, photosynthetic characteristics, and fruit quality of pear jujube in northern Shaanxi
- Characteristics of the root exudate release system of typical plants in plateau lakeside wetland under phosphorus stress conditions
- Characterization of soil water by the means of hydrogen and oxygen isotope ratio at dry-wet season under different soil layers in the dry-hot valley of Jinsha River
- Composition and diurnal variation of floral scent emission in Rosa rugosa Thunb. and Tulipa gesneriana L.
- Preparation of a novel ginkgolide B niosomal composite drug
- The degradation, biodegradability and toxicity evaluation of sulfamethazine antibiotics by gamma radiation
- Special issue on Monitoring, Risk Assessment and Sustainable Management for the Exposure to Environmental Toxins
- Insight into the cadmium and zinc binding potential of humic acids derived from composts by EEM spectra combined with PARAFAC analysis
- Source apportionment of soil contamination based on multivariate receptor and robust geostatistics in a typical rural–urban area, Wuhan city, middle China
- Special Issue on 13th JCC 2018
- The Role of H2C2O4 and Na2CO3 as Precipitating Agents on The Physichochemical Properties and Photocatalytic Activity of Bismuth Oxide
- Preparation of magnetite-silica–cetyltrimethylammonium for phenol removal based on adsolubilization
- Topical Issue on Agriculture
- Size-dependent growth kinetics of struvite crystals in wastewater with calcium ions
- The effect of silica-calcite sedimentary rock contained in the chicken broiler diet on the overall quality of chicken muscles
- Physicochemical properties of selected herbicidal products containing nicosulfuron as an active ingredient
- Lycopene in tomatoes and tomato products
- Fluorescence in the assessment of the share of a key component in the mixing of feed
- Sulfur application alleviates chromium stress in maize and wheat
- Effectiveness of removal of sulphur compounds from the air after 3 years of biofiltration with a mixture of compost soil, peat, coconut fibre and oak bark
- Special Issue on the 4th Green Chemistry 2018
- Study and fire test of banana fibre reinforced composites with flame retardance properties
- Special Issue on the International conference CosCI 2018
- Disintegration, In vitro Dissolution, and Drug Release Kinetics Profiles of k-Carrageenan-based Nutraceutical Hard-shell Capsules Containing Salicylamide
- Synthesis of amorphous aluminosilicate from impure Indonesian kaolin
- Special Issue on the International Conf on Science, Applied Science, Teaching and Education 2019
- Functionalization of Congo red dye as a light harvester on solar cell
- The effect of nitrite food preservatives added to se’i meat on the expression of wild-type p53 protein
- Biocompatibility and osteoconductivity of scaffold porous composite collagen–hydroxyapatite based coral for bone regeneration
- Special Issue on the Joint Science Congress of Materials and Polymers (ISCMP 2019)
- Effect of natural boron mineral use on the essential oil ratio and components of Musk Sage (Salvia sclarea L.)
- A theoretical and experimental study of the adsorptive removal of hexavalent chromium ions using graphene oxide as an adsorbent
- A study on the bacterial adhesion of Streptococcus mutans in various dental ceramics: In vitro study
- Corrosion study of copper in aqueous sulfuric acid solution in the presence of (2E,5E)-2,5-dibenzylidenecyclopentanone and (2E,5E)-bis[(4-dimethylamino)benzylidene]cyclopentanone: Experimental and theoretical study
- Special Issue on Chemistry Today for Tomorrow 2019
- Diabetes mellitus type 2: Exploratory data analysis based on clinical reading
- Multivariate analysis for the classification of copper–lead and copper–zinc glasses
- Special Issue on Advances in Chemistry and Polymers
- The spatial and temporal distribution of cationic and anionic radicals in early embryo implantation
- Special Issue on 3rd IC3PE 2020
- Magnetic iron oxide/clay nanocomposites for adsorption and catalytic oxidation in water treatment applications
- Special Issue on IC3PE 2018/2019 Conference
- Exergy analysis of conventional and hydrothermal liquefaction–esterification processes of microalgae for biodiesel production
- Advancing biodiesel production from microalgae Spirulina sp. by a simultaneous extraction–transesterification process using palm oil as a co-solvent of methanol
- Topical Issue on Applications of Mathematics in Chemistry
- Omega and the related counting polynomials of some chemical structures
- M-polynomial and topological indices of zigzag edge coronoid fused by starphene