Experimental and simulation study on a rooftop vertical-axis wind turbine
-
Malek Ali
 ,
Abderraouf Gherissi
,
Abderraouf Gherissi

Abstract
In this study, a small vertical-axis wind turbine (VAWT) was successfully designed and tested to produce electrical energy using renewable wind energy after being installed on the roof of buildings. The VAWT was constructed according to the existing wind source in the Tabuk region in Saudi Arabia. The use of VAWT on roofs is a sustainable solution for producing clean electricity and contributing to a portion of the local electricity consumption. A rooftop wind turbine test was performed to determine the behavior and output of a VAWT under non-constant wind speeds under natural conditions. To verify the resistance of the shear stress and pressure, a computational fluid dynamics (CFD) simulation on the airfoil was conducted. The experimental test results showed that the VAWT can reach its rated power at 9 m/s. The minimum wind speed needed for power production was 3 m/s. The maximum power coefficient obtained during testing was approximately 0.45 at a tip speed ratio of around 1.94. The simulation mesh is constructed with Ansys mesh. Two dimensional (2-D) mapped face meshing, fine, high smoothing mesh was constructed with 50 division numbers and a bias factor of about 150. The grid with 15,000 cells generated the same results as the higher number of cell grids. The simulation equivalent force was about 2.8 N for a single blade, such as 8.5 N in total, which presents an error of about 3%. The CFD simulation and experimental tests on existing forces confirm that the VAWT structure’s resistance can be guaranteed at high wind speeds.
Notation
-
-
power coefficient
- CFD
-
computational fluid dynamics
- D
-
diameter of the turbine (m)
- E
-
wind energy (J)
- F D
-
drag force (N)
- F L
-
lift force (N)
- F N
-
normal force (N)
- F T
-
tangential force (N)
- HAWT
-
horizontal-axis wind turbine
- I
-
electrical current (A)
- L
-
blade length (m)
- M
-
air mass (kg)
-
-
air mass flow rate (kg/s)
-
-
electrical power (W)
-
-
mechanical power (W)
-
-
wind power (W)
- T
-
torque (N m)
-
-
velocity (m/s)
- V
-
electrical voltage (V)
- VAWT
-
vertical-axis wind turbine
-
-
tangential velocity (m/s)
-
-
speed of the tips of turbine blades (m/s)
-
-
velocity of the wind (m/s)
-
-
relative velocity (m/s)
- α
-
angle of attack (deg)
- λ
-
tip-speed-ratio
- ∞
-
azimuthal angle (deg)
- Ω
-
angular frequency (rad/s)
- ρ
-
air density (kg/m3)
-
-
angular velocity of the rotor (1/s)
1 Introduction
Owing to the price instability of fossil fuels globally for political or non-political reasons, wind energy is an important renewable and sustainable energy resource that is widely used as an alternative energy source. The most important advantages of renewable energy are lower costs as well as lower non-carbon emissions, and this makes renewable energy friendly to the climate and environmentally friendly. There are two main types of renewable energy: solar energy and wind energy. Both types are widely used as sources of electric power generation. The global focus on wind energy conversion has increased with horizontal-axis wind turbine (HAWT) and vertical-axis wind turbine (VAWT).
Wind power was shown to have the lowest relative greenhouse gas emissions, the least water consumption demands, and the best social consequences; yet, it takes more acreage and has a higher relative capital cost [1]. Several factors affect the performance and life cycle of the VAWT [2,3,4]. Experiments indicated that an HAWT outperformed a VAWT under the same meteorological conditions in terms of performance and shorter wake (faster recovery) [5]. Experimental research was done on the effectiveness, drag, and horizontal midplane wake characteristics of a vertical-axis Savonius wind turbine, based on the findings from the wake measurements, and some recommendations on where to place supplementary turbines are made [6]. The wind conditions on the roof and the behavior of a roof-located wind turbine with respect to optimized energy yield were addressed by Sander et al. [7], and it was concluded that an H-Darrieus is preferred to the HAWT for operation on a flat roof of higher buildings. [8] How the remaining lifetime of a wind turbine component can be estimated based on online measurement data was investigated, and it was found from the interviews that the owners do not get sufficient information from the manufacturer in order to do similar studies [9]. By analyzing the link between the aspect ratio of a vertical-axis straight-bladed (H-Rotor) wind turbine and its performance (power coefficient), the numerical study employed demonstrated how the Reynolds number of rotor blades has a significant impact on the turbine performance. From a geometrical perspective, as the aspect ratio decreases, the Reynolds number increases, enhancing the performance of wind turbines [10]. The Darrieus VAWT configurations were evaluated, including the drawbacks of each variation that hindered the development into a large-scale rotor.
The blade is the most important component of any wind turbine; the airfoil of the blade must be carefully designed in order to achieve the best energy output. Blade section simulations were carried out for the S822 airfoil at a chord Reynolds number of 100,000 and an angle of attack of 5°. The simulations provide insights into a physical mechanism that explains the lift increase observed for rotating blade sections when compared with stationary blade sections, which is commonly referred to as rotational augmentation [11]. XFOIL was used to develop and test three high-performance airfoils (EYO7-8, EYO8-8, and EYO9-8) for small wind turbine applications in the study of Emmanuel et al. [12]. Preliminary wind turbine rotor analysis also showed that EYO7-8, EYO8-8, and EYO9-8 rotors had maximum power coefficients of 0.371, 0.366, and 0.358, respectively. A proposal for a new design criterion for H-Darrieus turbines based on the energy-yield maximization was given in the study of Bianchini et al. [13]; critical analysis of the best design choices in terms of turbine shape, dimensions, airfoils, and constraints was clarified. A comparison of NACA 6-series and 4-digit airfoils for Darrieus wind turbines was done by Migliore [14], and ten different airfoils having thickness-to-chord ratios of 12, 15, and 18% were studied. Performance estimates were made using a blade element/momentum theory approach. The results indicated that NACA 6-series airfoils show peak power coefficients as great as NACA 4-digit airfoils and have broader and flatter power coefficient/tip speed ratio curves. The design life of wind turbines is often about 20 years. In practice, it is often noted that the components in the turbine fail earlier and must be replaced before the advertised age. Therefore, it is very important for wind turbine owners to have a good assessment of the remaining components and develop an appropriate maintenance schedule. Wind turbines must follow a technical standard that provides common rules and guidelines. This standard specifies the basic design requirements for wind turbines, which include protocols for engineering design and component testing. The standard is implemented to provide an adequate level of protection against damage to turbines and their subsystems. Implementing standards in the turbine design process is an important part. It is critical to consider the external conditions when designing the wind turbine because it is dependent on the location where it is built.
In this study, a small-scale VAWT was created in order to reduce the home electrical energy budget charge and take advantage of the majority of urban building top roofs that are empty. Moreover, based on the average wind speed in the Tabuk region of Saudi Arabia, the wind turbine was designed with an H-Darrius NACA 0018 airfoil. A complete design was created to generate and measure the mechanical and electrical power output from the VAWT under real-world wind speed conditions. The turbine was tested in the Tabuk region at different wind speeds. Several studies have been conducted on the performance of VAWTs. In contrast to previous studies, the focus here will be on wind speed and airfoil simulation.
2 Experimental method
This experimental and simulation study aimed to investigate natural wind effects on VAWT modules in the Tabuk region in Saudi Arabia and to test different wind speeds and their corresponding power coefficient. In this study, VAWTs were tested on the roof of buildings. The power coefficient (
Experiment data were analyzed in order to calculate the power coefficient. A comparative assessment for different wind speeds was done to distinguish the rated power that suits VAWT specifications. The experimental and simulation results of the study were matching.
2.1 VAWT design
The design of the blade and its airfoil was based on several previous studies. The computer-aided design (CAD) of VAWT is shown in Figure 1.

CAD design of the VAWT with it’s main parts.
VAWT was successfully designed from the main parts of the prototype as listed in Table 1.
Main parts of the VAWT
| Item no. | Part number | Quantity |
|---|---|---|
| 1 | Tower | 1 |
| 2 | Container | 1 |
| 3, 6 | Ball bearing | 2 |
| 4 | Shaft | 1 |
| 5 | Spur gear | 2 |
| 7 | Plate | 1 |
| 8 | Arms (rotor) | 1 |
| 9 | Blade | 3 |
| 10 | Base | 1 |
Aluminum was chosen for the blades because it is lightweight and resistant to corrosion. In addition, composite materials that are based on aluminum, epoxy, or plastic can be used and are usually reinforced with different types of reinforcements, such as titanium carbide or natural fibers, among others. The improvement of the composite surface hardness by air abrasive jet polishing of SiO2 particles was done in the study of Gherissi and Ali [16]. The obtained results demonstrated the importance of superficial hardening of composites Al-TiC by the impact of the SiO2 air jet and show that the surface hardness improvement is greatest for the nanocomposites compared with microcomposites and a pure matrix material. In the study of Ali and Gherissi [17], aluminum matrix composites were successfully synthesized by melting the Al scrap at 850°C. It was observed that the ultimate tensile strengths of Al-SiO2 composites with 0, 10, and 20 wt% of SiO2 were 25, 62, and 65 MPa, respectively. The epoxy matrix composites reinforced with various concentrations of titanium carbide (TiC) have been synthesized and characterized successfully in the study of Ali [18]; the results obtained show improvements in both the mechanical and tribological behavior of the composites. The other parts were made from steel to withstand fatigue and give more stability to the whole prototype. The blade design was changed from a solid cross section to a hollow cross section with various wall thicknesses in order to reduce both mass and centrifugal forces on the blades. The maximum stresses and maximum deflection must be proportional to the thickness of the wall. It was found that the solid cross section has the maximum stress and deflection, so it was chosen for the design of the VAWT.
The speed and kinetic energy of the wind must be reduced in order to extract the required energy. Several studies have found that if too much wind energy is excluded, the wind is on the downwind flank of the VAWT. This phenomenon would then cause compression in front of the blades and a slight blow-off on the flank sides rather than turning the blades, resulting in a power limit for the VAWT. The VAWT will then operate between 50 and 60% of its theoretical maximum efficiency due to blade efficiency, generator efficiency, friction losses, and electrical losses. In addition, if the wind speed exceeds the furling velocity, the wind turbine has to be shut down to prevent the blades from breaking. A mechanical brake is then required for the wind turbine rotor’s safety. To ensure sufficient speed at the generator side, a gearbox was designed that can accelerate a rotational speed at a ratio of about 5.7; that is, every time the blades make one revolution, the generator shaft spins 5.7 times.
The experiments were conducted on the vertical wind turbine prototype shown in Figure 2. The wind turbine performance was carried out under several wind conditions, as shown in Table 2. The maximum wind speed was about 13 m/s and the lowest was 3 m/s. The optimum tilt angle was established by determining the wind direction and the maximum output rotational speed of the rotor. The actual measured energy is calculated as input mechanical force and output electrical energy.
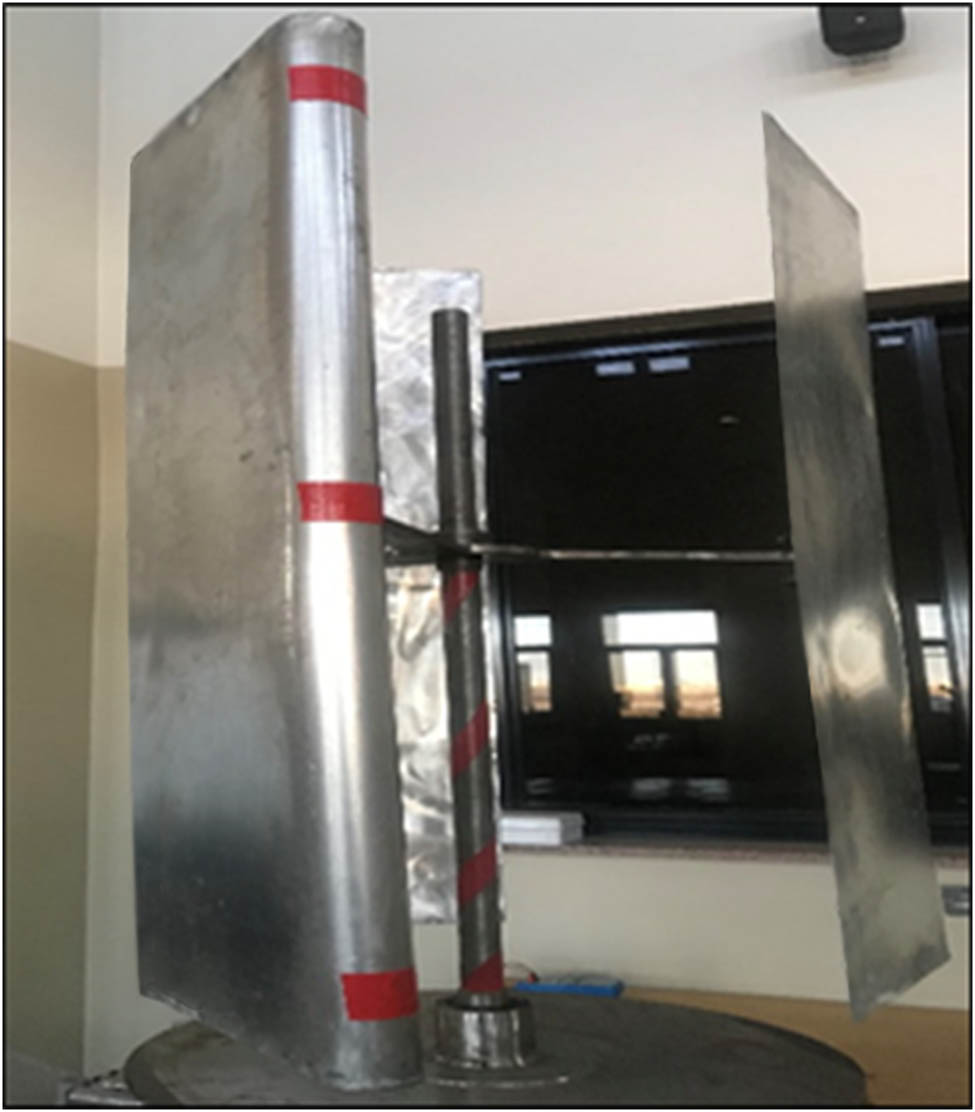
VAWT prototype with 1 m three-blade H-Darrieus.
Experimental VAWT testing results on natural wind speeds
| V w (m/s) | 3 | 5.4 | 6.8 | 7.3 | 8 | 9 | 10 |
| N rotor (rpm) | 40 | 120 | 200 | 220 | 300 | 450 | 540 |
| V b (m/s) | 1.55 | 4.65 | 7.75 | 8.53 | 11.63 | 17.44 | 20.93 |
| λ | 0.52 | 0.87 | 1.14 | 1.17 | 1.46 | 1.94 | 2.1 |
| T (N m) | 0.25 | 1.25 | 2 | 2.8 | 3 | 3.1 | 3.2 |
| P Mech (W) | 1.05 | 15.71 | 41.89 | 64.51 | 94.25 | 146.09 | 180.96 |
|
|
0.09 | 0.23 | 0.3 | 0.37 | 0.41 | 0.45 | 0.4 |
The airfoil was selected as NACA 0018 based on several previous studies. Because of its resistance to changes in the angle of attack and wind speed, the NACA 0018 airfoil typically provides more lift, has fewer manufacturing constraints, and has greater sustainability and fatigue resistance. The wind blade, the airfoil NACA 0018, and the applied forces are shown in Figure 3. Different aerodynamic forces can be generated on the sectional profile of the blades due to the airflow stream through the turbine rotors. Mainly, these forces are the drag force F D and the lift force F L: the drag force in the direction of the airflow and the lift force perpendicular to the airflow. When optimizing wind turbine blades, the goal is to maximize the lift force while minimizing the drag force. As the turbine rotates, the airfoil’s angle of attack α continuously changes as a function of its azimuthal position θ, which produces variable aerodynamic forces and is often referred to as the Darrieus motion [19]. The magnitude and orientation of the lift and drag forces as well as the resultant force vary. The resultant force can be decomposed into a normal force F N and a tangential force F T. The tangential force component then drives the rotation of the wind turbine and produces the torque necessary to generate electricity [20].

The wind blade, the airfoil NACA 0018, and applied forces.
A computational fluid dynamics (CFD) simulation was conducted on the ANSYS student version of the airfoil at a wind velocity (10 m/s), which matched the maximum experimental wind speed reached in the experiments.
3 Results and discussion
3.1 Experimental results and discussion
Each region has different wind speeds depending on the season. According to the local meteorological data, the Tabuk region’s average wind speeds during the windier months of the year (January through July) exceeded 3.66 m/s, while they were about 3.3 m/s during the calmer months of the year (August through December). The aerodynamic efficiency of the blades typically depends on the wind speed, size, mass, and quantity of wind energy in a particular blade region. The formula is as follows:
Generally, the air mass per second can be formulated as follows:
where A is the turbine’s swept area and is given as
where L is the blade length and D is the diameter of the turbine. Then, the air mass per second hitting the blades in any given second can be written as
Thus, the power formula
with ρ = 1.255 kg/m3, L = 1 m, and D = 0.72 m.
To evaluate wind turbine performance, the power coefficient can be written as follows:
To evaluate the output of the VAWT, the electrical power can be calculated as follows:
The mechanical power can be calculated by using the following equation:
where T is the torque and
The tip speed ratio
After conducting the required experiments on natural wind speeds in different Tabuk city areas with different levels and at different time durations, the optimal results were regrouped in Table 2.
The performance of the VAWT over all expected tip speed ratios is reported in Table 2. Based on the experiments on VAWT at natural wind speeds, the results are shown in Figure 4. It is observed that
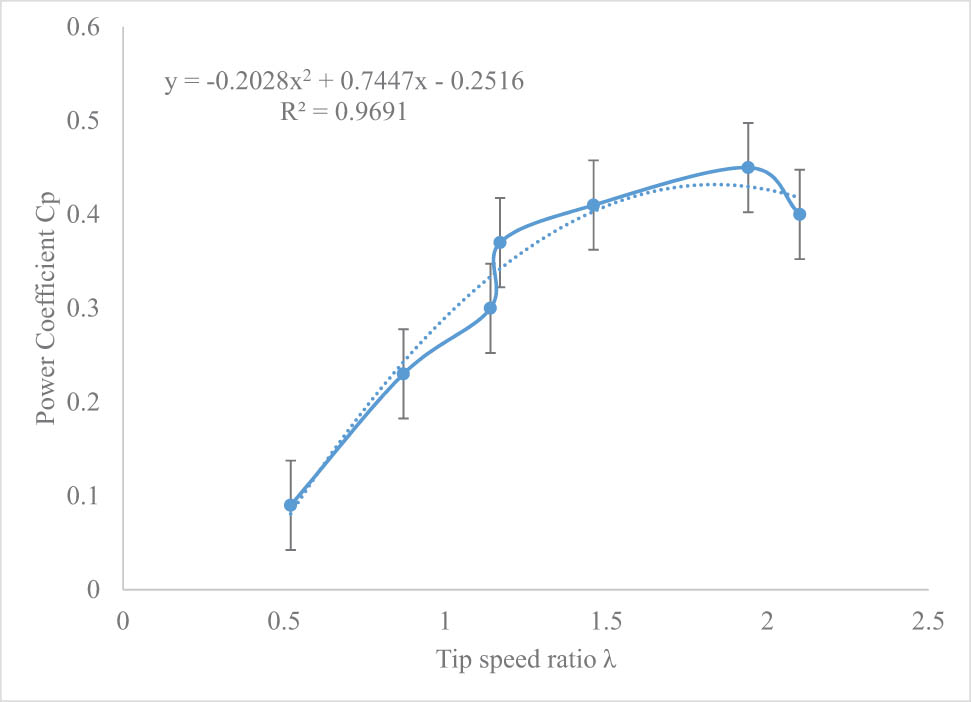
The power coefficient
It is observed that the mechanical power increases quadratically with the wind speed, so the wind turbine can reach high mechanical power at high rotor speeds but is limited, as shown in Figure 4, by a tip speed ratio of about 1.94. A sudden jump in the power coefficient values for the tip speed ratios of 1–2 may be due to inaccurate measurements of the mechanical power. The VAWT’s electrical generator is a permanent magnet cable-wound synchronous generator. Figure 5 shows that the electrical power increases approximately linearly with increasing wind speed, implying that the wind turbine can achieve high electrical power at high wind speeds.
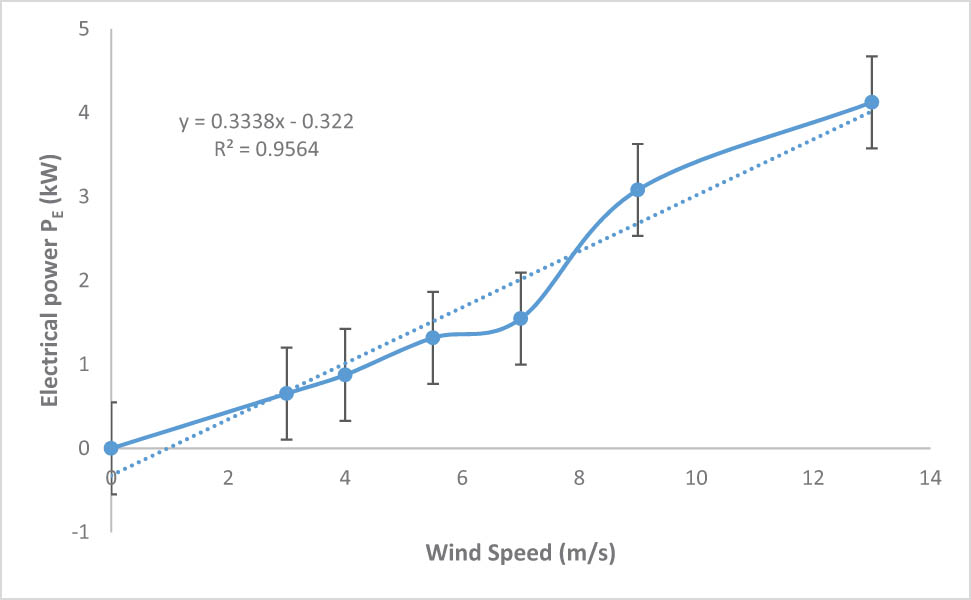
The generated electrical power P E vs wind speed V w.
3.2 Simulation results and discussion
Generating the right computational domain for the simulation of the airfoil is an important task of the modeling process of the VAWT. Different wind conditions and airfoil profiles were considered. The domain was not too small to correctly reproduce the flow around the airfoil and not too large to avoid unnecessary increases in cell numbers of the grid. An independent study was conducted to select a suitable domain/grid for the present simulation case. The requirements of the meshing in terms of quality and first cell positioning near the airfoil were considered.
Figure 6 shows the CFD computational domain and boundary conditions used to conduct the simulation. The computational domain is composed of an upstream C-shape, half circle, in which the airfoil is included. The airfoil end is located at the center of the semicircle. The diameter of the semicircle is set as 12 times the chord of the airfoil. The downstream domain is a square with a side length equal to the circle diameter. The boundary conditions are defined as follows. The airfoil is simulated as a wall subjected to velocity inlet and pressure outlet boundary conditions. To show the flow field represented by pressure and velocity distributions, the wind velocity was applied horizontally at the cord line and the angles of attack were varied between −9°, 0°, and 9°. Both lift and drag dimensionless coefficients were calculated at 0° angle of attack. As the angle of attack increases, the pressure on the lower side of the airfoil increases while the velocity decreases. With the decrease of the pressure on the upper side of the airfoil, the velocity increases.
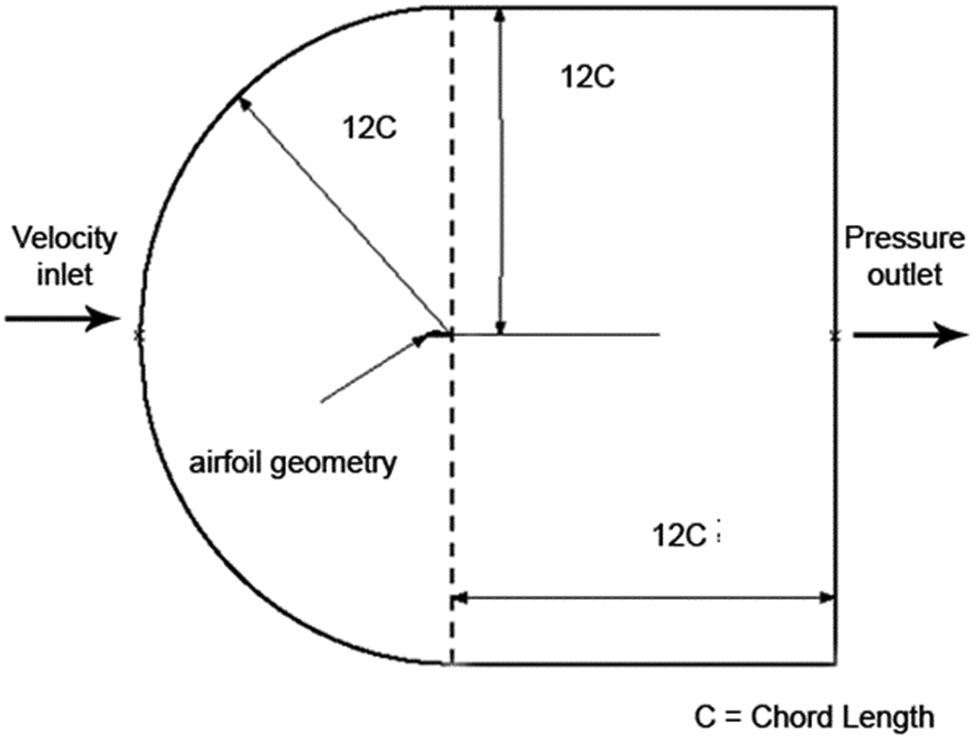
The CFD computational domain and boundary conditions.
Figure 7 shows a sample of used meshing. The mesh is constructed with Ansys Mesh. The 2-D mapped face meshing, a fine, high smoothing mesh, was constructed with 50 division numbers and a bias factor of about 150. The C–H type structured grid is applied in the airfoil domain to consider the boundary layer effect on the aerodynamic performance of airfoils. Also considering the requirements of the turbulence model for the grid, the boundary layer mesh is denser around the airfoil, so the results met the stability requirements.
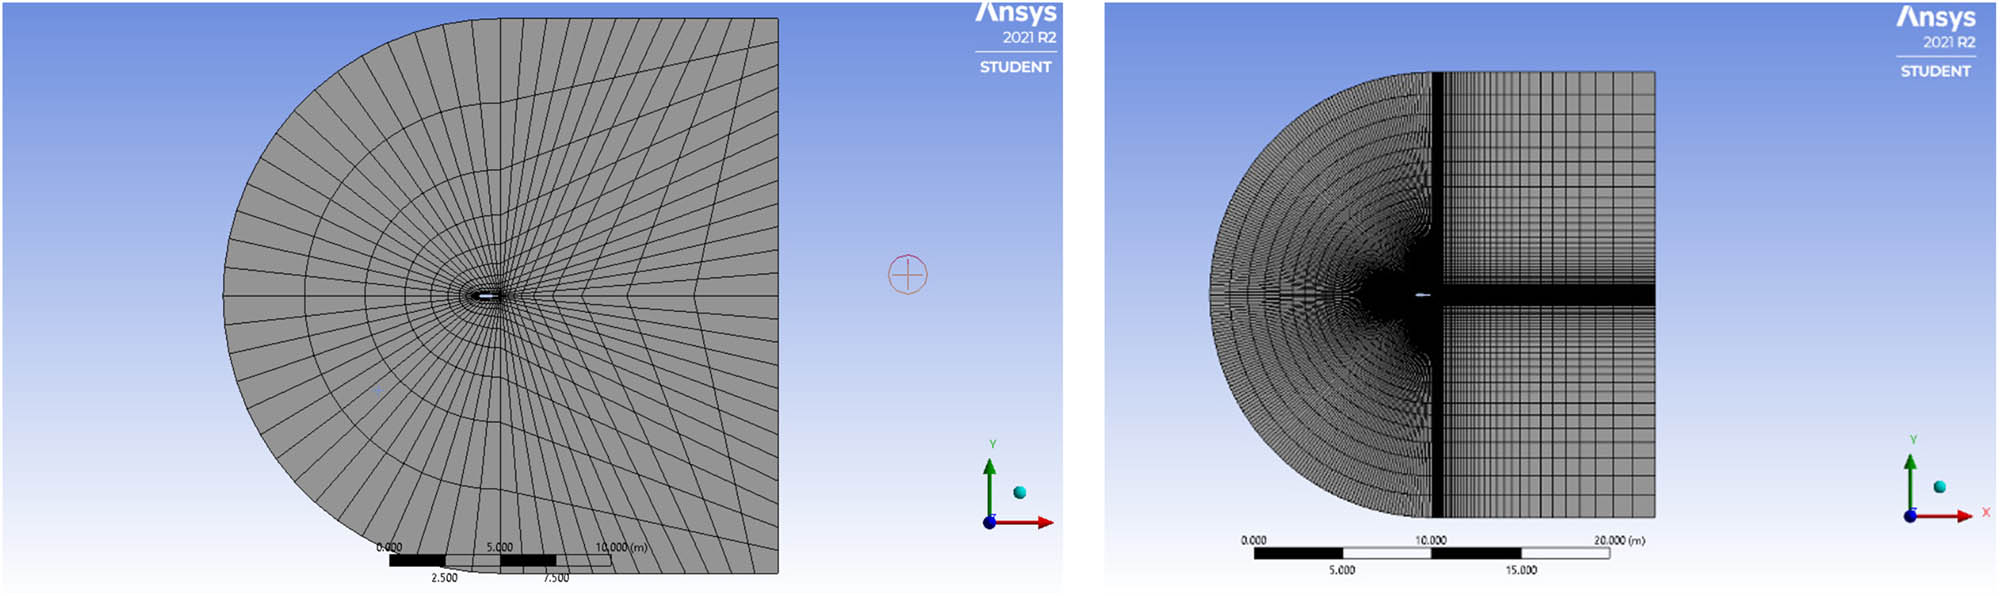
A sample of mesh dependency.
Different edges and face sizings are chosen to build different meshes with different numbers of elements to check the independency of the results. As shown in Table 3, five different fine mesh grids were created. The grid with 15,000 cells with about 1.3 h computational time generated the same results as the higher number of cell grids.
Mesh dependency study
| Grid | No. of elements | Near-wall mesh quality | Computational time (h) |
|---|---|---|---|
| 1 | 36,000 | Satisfied | 5.2 |
| 2 | 24,000 | Satisfied | 3.1 |
| 3 | 15,000 | Satisfied | 1.3 |
| 4 | 12,000 | Not satisfied | 1.0 |
| 5 | 9,000 | Not satisfied | 0.8 |
The simulation results on pressure coefficients and velocity magnitudes are shown in Figures 8 and 9. The vector representation assigned maximum shear stress zones. The orientation of the blades and the airfoil positions relative to the angles of attack of the wind helps to have different lift forces from the tail of the airfoil and the front head. The flow field of the trailing edge of the wind turbine blade airfoil shows that the flow still belongs to the laminar status of the different conditions of angles of attack and there is no presence of turbulence. The results of the aerodynamic performance of the blade airfoil using the present model correspond with the experimental results.
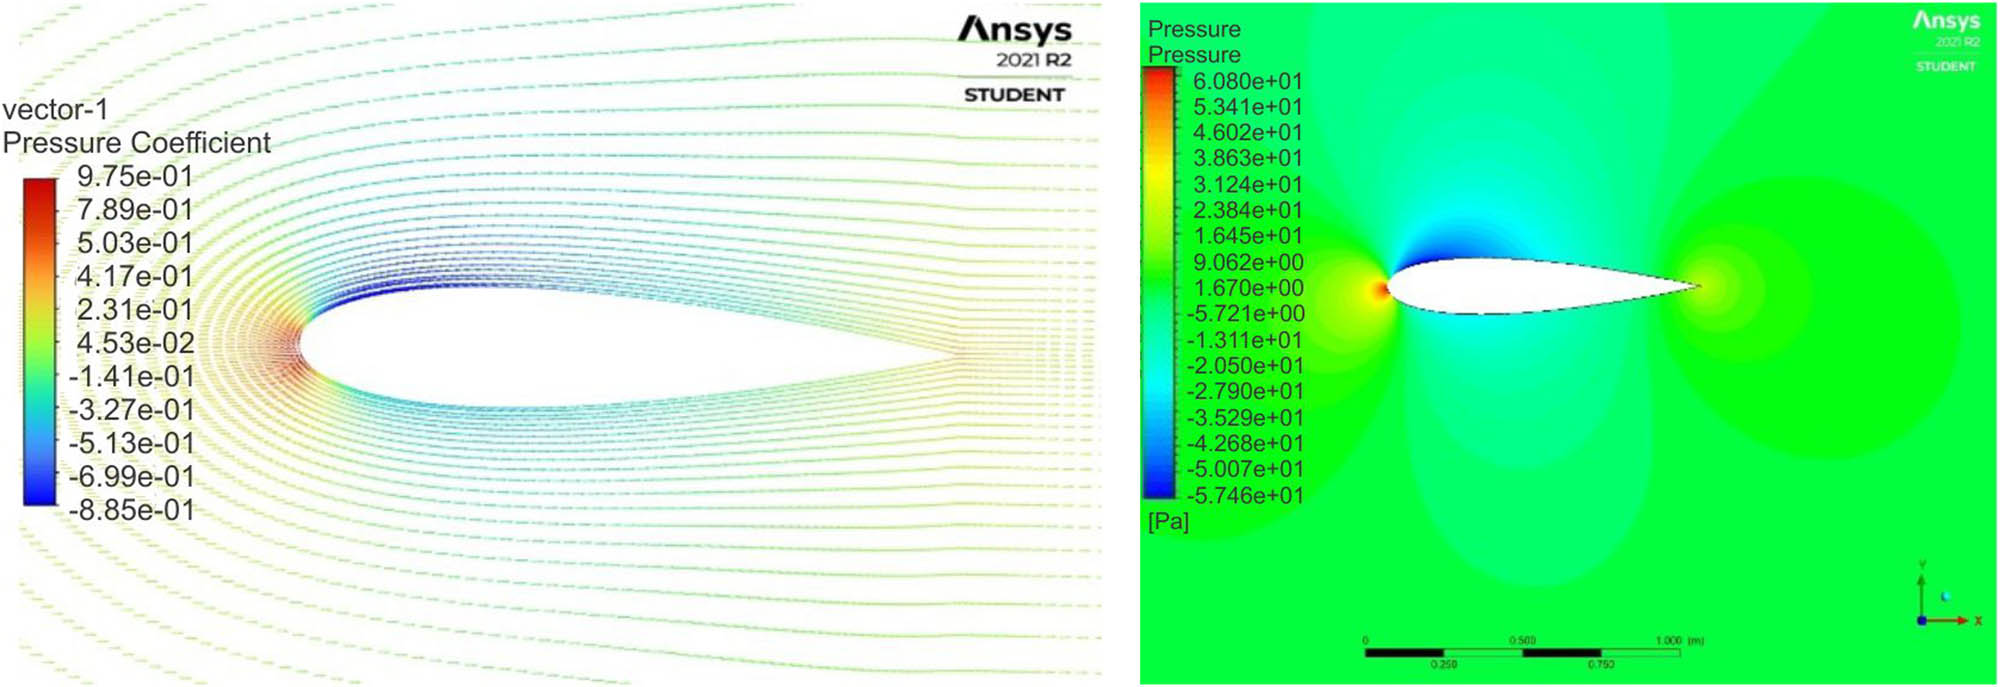
Distribution of pressure coefficient vectors around the airfoil.
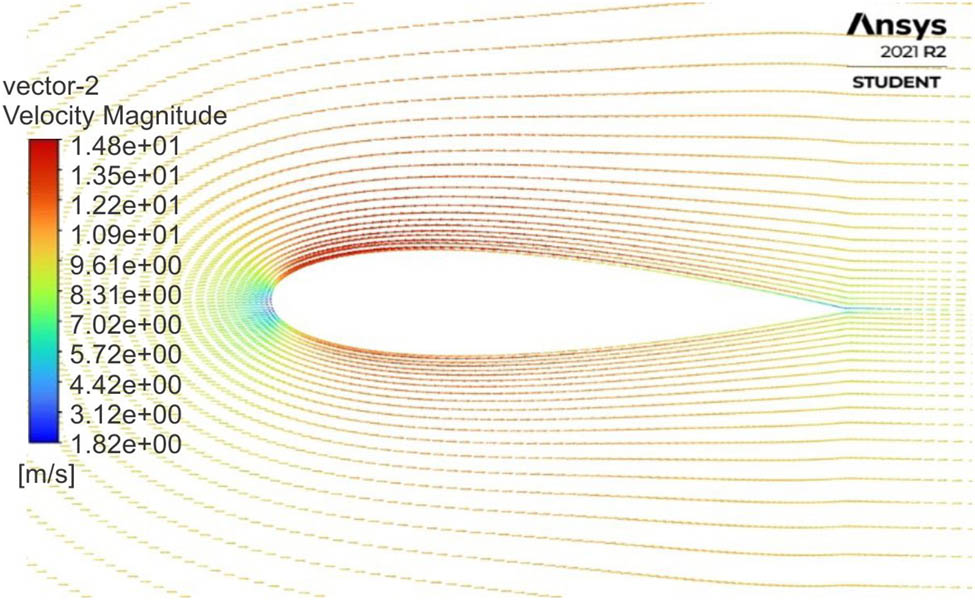
Distribution of velocity magnitude vectors around the airfoil.
The assembly parts, especially the bolts, in the wind turbine are subjected to excessive fatigue loads, and it is crucial to verify and schedule the fixation replacements to prevent premature damage to the wind turbine. The calculation of the radial forces applied to the bolts indicates the level of shear on the bolts and blade materials; the simulation results are shown in Figure 10.
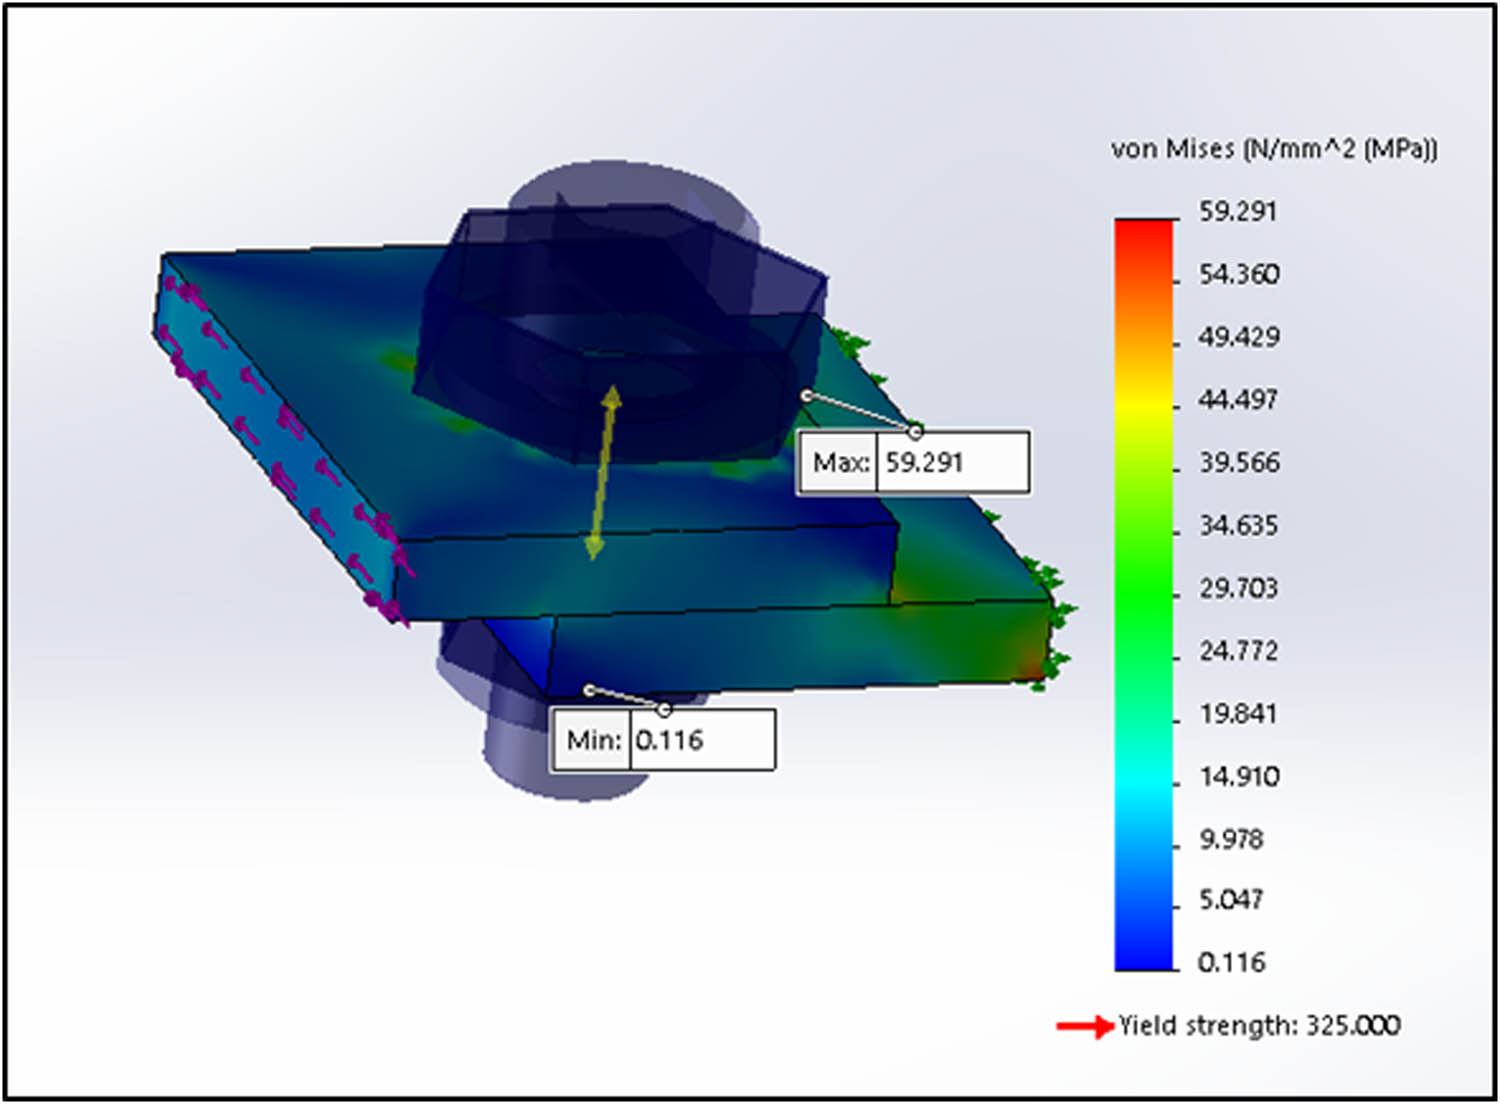
Simulation of shear forces applied at fixation bolts of the wind turbine blades.
As shown in Figure 10, the zones near the fixation present a high level of stress concentration. Based on the yield strength calculation, the damage and cracking will not take place at the bolts and blade structures.
To compare the experimental results with the simulation, a force simulation was conducted as shown in Figure 11.
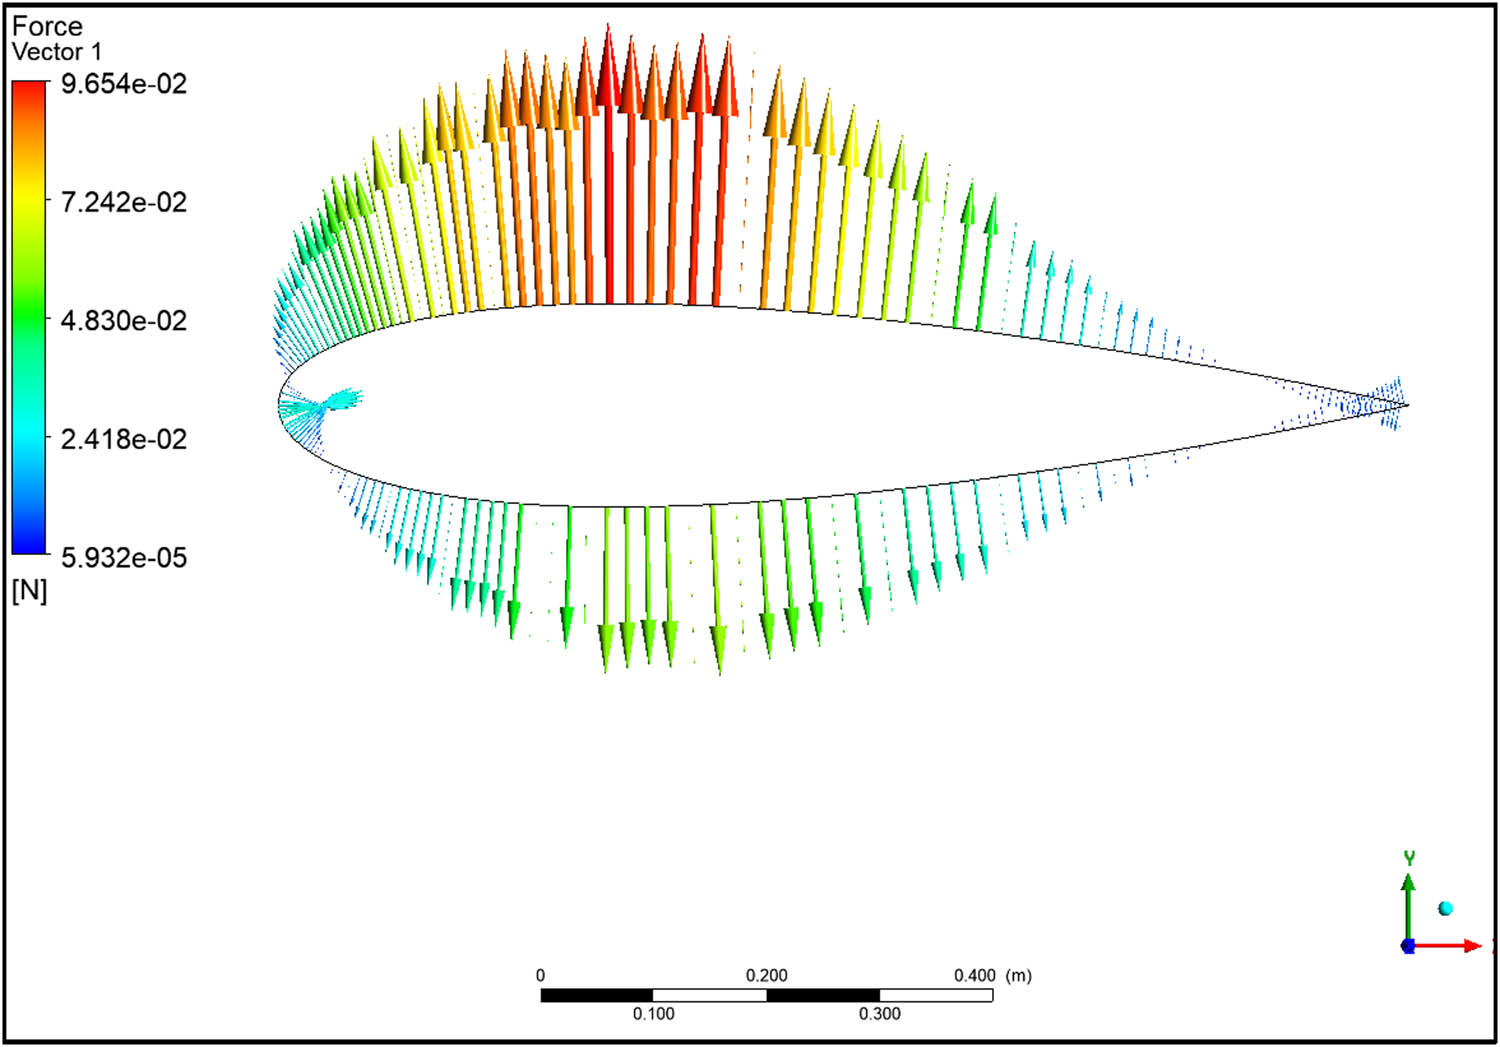
Forces on the airfoil.
The simulation results show a similarity with the experiments on the calculation of the forces on the airfoil; a torque of 3.2 N m at a wind speed of 10 m/s, and a rotor radius of 0.36 m resulted in a force of 8.8 N. The simulation equivalent force was about 2.8 N for a single blade, such as 8.5 N in total, which presents an error of about 3%. The CFD simulation and experimental tests on existing forces confirm that the VAWT structure’s resistance can be guaranteed at high wind speeds.
4 Conclusion
Based on the average wind speed in the Tabuk region of Saudi Arabia, the wind turbine was designed with an H-Darrius NACA 0018 airfoil. The turbine was tested in the Tabuk region at different wind speeds. It was observed that the mechanical power increases exponentially with increasing wind speed and so the wind turbine can reach high mechanical power at a high rotor speed. However, a maximum power coefficient of 1.94 corresponds to a rotary speed of about 450 rpm. The electrical power obtained after increasing the input rotary speed of the rotor via the gearbox increases linearly with the wind speed, and the wind turbine can reach high electrical power at high wind speeds. The maximum power coefficient obtained during testing was approximately 0.45 at a tip speed ratio of around 1.94. A verification CFD simulation was conducted on the airfoil at the maximum real-tested wind speed of 10 m/s obtained during experiments. The simulation equivalent force was about 2.8 N for a single blade, such as 8.5 N in total, which presents an error of about 3%. The efficiency of the top-roof VAWT presented in this work is dependent on the presence of a high wind flow.
-
Conflict of interest: Authors state no conflict of interest.
References
[1] Evans A, Strezov V, Evans JT. Assessment of sustainability indicators for renewable energy technologies. Renew Sustain Energy Rev 13(5):1082–8.10.1016/j.rser.2008.03.008Search in Google Scholar
[2] Leijon M, Dahlgren M, Walfridsson L, Ming L, Jaksts A. A recent development in the electrical insulation systems of generators and transformers. IEEE Electr Insul Mag. 2001;17(3):10–5.10.1109/57.925298Search in Google Scholar
[3] Ribrant J, Bertling LM. Survey of failures in wind power systems with focus on Swedish wind power plants during 1997–2005. IEEE Trans Energy Convers. 2007;22(1):167–73.10.1109/TEC.2006.889614Search in Google Scholar
[4] Jöckel S. Gearless wind energy converters with permanent magnet generators - an option for the future. European Union Wind Energy Conference EWEA. Göteborg, Sweden; 1996. p. 414–7.Search in Google Scholar
[5] Victor M, Ashvinkumar C, Anders G. Performance and wake comparison of horizontal and vertical axis wind turbines. Wind Energy. 2019;22:458–72.10.1002/we.2299Search in Google Scholar
[6] Alexander AD, Marius JS, Tania B. Performance and wake of a Savonius vertical‐axis wind turbine under different incoming conditions. Wind Energy. 2019;22:1260–73.10.1002/we.2358Search in Google Scholar
[7] Sander M, Gijs K, Gerard B. Performance of an H-Darrieus in the skewed flow on a roof. J Sol Energy Eng. 2003;125:433–40.10.1115/1.1629309Search in Google Scholar
[8] Haraldsdóttir H, Sandström M. Lifetime analysis of a wind turbine component. Gothenburg, Sweden: Chalmers University of Technology; 2016.Search in Google Scholar
[9] Brusca S, Lanzafame R, Messina M. Design of a vertical-axis wind turbine: How the aspect ratio affects the turbine’s performance. Int J Energy Environ Eng. 2014;5:333–40.10.1007/s40095-014-0129-xSearch in Google Scholar
[10] Tjiu W, Marnoto T, Mat S, Ruslan MH, Sopian K. Darrieus vertical axis wind turbine for power generation I: Assessment of Darrieus VAWT configurations. Renew Energy. 2015;75:50–67.10.1016/j.renene.2014.09.038Search in Google Scholar
[11] Gross A, Fase HF, Friederich T, Kloker MJ. Numerical investigation of rotational augmentation for S822 wind turbine airfoil. Wind Energy. 2012;15:983–1007.10.1002/we.540Search in Google Scholar
[12] Emmanuel OY, Richard O, Albert SK, Muyiwa S. Development of high-performance airfoils for application in small wind turbine power generation. J Energy. 2020;20:1–9.10.1155/2020/9710189Search in Google Scholar
[13] Bianchini A, Ferrara G, Ferrari L. Design guidelines for H-Darrieus wind turbines: Optimization of the annual energy yield. Energy Convers Manag. 2015;89:690–707.10.1016/j.enconman.2014.10.038Search in Google Scholar
[14] Migliore P. Comparison of NACA 6-series and 4-digit airfoils for Darrieus wind turbines. J Energy. 1983;7:291–2.10.2514/3.48083Search in Google Scholar
[15] Kline SJ, McClintock FA. Analysis of uncertainty in single-sample experiments. Mech Eng. 1953;75:3–8.Search in Google Scholar
[16] Gherissi A, Ali M. Superficial hardening improvement of nano and micro composite Al/TiC. J Silicate Based Compos Mater. 2019;72:25–9.10.14382/epitoanyag-jsbcm.2020.5Search in Google Scholar
[17] Ali M, Gherissi A. Synthesis and characterization of Al-SiO2 composites. J Ceram Process Res. 2019;20:259–63.10.36410/jcpr.2019.20.3.259Search in Google Scholar
[18] Ali M. Synthesis and characterization of epoxy matrix composites reinforced with various ratios of TiC. Jordan J Mech Ind Eng. 2016;10:231–7.Search in Google Scholar
[19] Allet A, Hallé S, Paraschivoiu I. Numerical simulation of dynamic stall around an airfoil in Darrieus motion. J Sol Energy Eng. 1999;121(1):69–76.10.1115/1.2888145Search in Google Scholar
[20] Zhang LX, Liang YB, Liu XH, Jiao QF, Guo J. Aerodynamic performance prediction of straight-bladed vertical axis wind turbine based on CFD. Adv Mech Eng. 2013;5:905379.10.1155/2013/905379Search in Google Scholar
© 2023 the author(s), published by De Gruyter
This work is licensed under the Creative Commons Attribution 4.0 International License.
Articles in the same Issue
- Regular Articles
- Design optimization of a 4-bar exoskeleton with natural trajectories using unique gait-based synthesis approach
- Technical review of supervised machine learning studies and potential implementation to identify herbal plant dataset
- Effect of ECAP die angle and route type on the experimental evolution, crystallographic texture, and mechanical properties of pure magnesium
- Design and characteristics of two-dimensional piezoelectric nanogenerators
- Hybrid and cognitive digital twins for the process industry
- Discharge predicted in compound channels using adaptive neuro-fuzzy inference system (ANFIS)
- Human factors in aviation: Fatigue management in ramp workers
- LLDPE matrix with LDPE and UV stabilizer additive to evaluate the interface adhesion impact on the thermal and mechanical degradation
- Dislocated time sequences – deep neural network for broken bearing diagnosis
- Estimation method of corrosion current density of RC elements
- A computational iterative design method for bend-twist deformation in composite ship propeller blades for thrusters
- Compressive forces influence on the vibrations of double beams
- Research on dynamical properties of a three-wheeled electric vehicle from the point of view of driving safety
- Risk management based on the best value approach and its application in conditions of the Czech Republic
- Effect of openings on simply supported reinforced concrete skew slabs using finite element method
- Experimental and simulation study on a rooftop vertical-axis wind turbine
- Rehabilitation of overload-damaged reinforced concrete columns using ultra-high-performance fiber-reinforced concrete
- Performance of a horizontal well in a bounded anisotropic reservoir: Part II: Performance analysis of well length and reservoir geometry
- Effect of chloride concentration on the corrosion resistance of pure Zn metal in a 0.0626 M H2SO4 solution
- Numerical and experimental analysis of the heat transfer process in a railway disc brake tested on a dynamometer stand
- Design parameters and mechanical efficiency of jet wind turbine under high wind speed conditions
- Architectural modeling of data warehouse and analytic business intelligence for Bedstead manufacturers
- Influence of nano chromium addition on the corrosion and erosion–corrosion behavior of cupronickel 70/30 alloy in seawater
- Evaluating hydraulic parameters in clays based on in situ tests
- Optimization of railway entry and exit transition curves
- Daily load curve prediction for Jordan based on statistical techniques
- Review Articles
- A review of rutting in asphalt concrete pavement
- Powered education based on Metaverse: Pre- and post-COVID comprehensive review
- A review of safety test methods for new car assessment program in Southeast Asian countries
- Communication
- StarCrete: A starch-based biocomposite for off-world construction
- Special Issue: Transport 2022 - Part I
- Analysis and assessment of the human factor as a cause of occurrence of selected railway accidents and incidents
- Testing the way of driving a vehicle in real road conditions
- Research of dynamic phenomena in a model engine stand
- Testing the relationship between the technical condition of motorcycle shock absorbers determined on the diagnostic line and their characteristics
- Retrospective analysis of the data concerning inspections of vehicles with adaptive devices
- Analysis of the operating parameters of electric, hybrid, and conventional vehicles on different types of roads
- Special Issue: 49th KKBN - Part II
- Influence of a thin dielectric layer on resonance frequencies of square SRR metasurface operating in THz band
- Influence of the presence of a nitrided layer on changes in the ultrasonic wave parameters
- Special Issue: ICRTEEC - 2021 - Part III
- Reverse droop control strategy with virtual resistance for low-voltage microgrid with multiple distributed generation sources
- Special Issue: AESMT-2 - Part II
- Waste ceramic as partial replacement for sand in integral waterproof concrete: The durability against sulfate attack of certain properties
- Assessment of Manning coefficient for Dujila Canal, Wasit/-Iraq
- Special Issue: AESMT-3 - Part I
- Modulation and performance of synchronous demodulation for speech signal detection and dialect intelligibility
- Seismic evaluation cylindrical concrete shells
- Investigating the role of different stabilizers of PVCs by using a torque rheometer
- Investigation of high-turbidity tap water problem in Najaf governorate/middle of Iraq
- Experimental and numerical evaluation of tire rubber powder effectiveness for reducing seepage rate in earth dams
- Enhancement of air conditioning system using direct evaporative cooling: Experimental and theoretical investigation
- Assessment for behavior of axially loaded reinforced concrete columns strengthened by different patterns of steel-framed jacket
- Novel graph for an appropriate cross section and length for cantilever RC beams
- Discharge coefficient and energy dissipation on stepped weir
- Numerical study of the fluid flow and heat transfer in a finned heat sink using Ansys Icepak
- Integration of numerical models to simulate 2D hydrodynamic/water quality model of contaminant concentration in Shatt Al-Arab River with WRDB calibration tools
- Study of the behavior of reactive powder concrete RC deep beams by strengthening shear using near-surface mounted CFRP bars
- The nonlinear analysis of reactive powder concrete effectiveness in shear for reinforced concrete deep beams
- Activated carbon from sugarcane as an efficient adsorbent for phenol from petroleum refinery wastewater: Equilibrium, kinetic, and thermodynamic study
- Structural behavior of concrete filled double-skin PVC tubular columns confined by plain PVC sockets
- Probabilistic derivation of droplet velocity using quadrature method of moments
- A study of characteristics of man-made lightweight aggregate and lightweight concrete made from expanded polystyrene (eps) and cement mortar
- Effect of waste materials on soil properties
- Experimental investigation of electrode wear assessment in the EDM process using image processing technique
- Punching shear of reinforced concrete slabs bonded with reactive powder after exposure to fire
- Deep learning model for intrusion detection system utilizing convolution neural network
- Improvement of CBR of gypsum subgrade soil by cement kiln dust and granulated blast-furnace slag
- Investigation of effect lengths and angles of the control devices below the hydraulic structure
- Finite element analysis for built-up steel beam with extended plate connected by bolts
- Finite element analysis and retrofit of the existing reinforced concrete columns in Iraqi schools by using CFRP as confining technique
- Performing laboratory study of the behavior of reactive powder concrete on the shear of RC deep beams by the drilling core test
- Special Issue: AESMT-4 - Part I
- Depletion zones of groundwater resources in the Southwest Desert of Iraq
- A case study of T-beams with hybrid section shear characteristics of reactive powder concrete
- Feasibility studies and their effects on the success or failure of investment projects. “Najaf governorate as a model”
- Optimizing and coordinating the location of raw material suitable for cement manufacturing in Wasit Governorate, Iraq
- Effect of the 40-PPI copper foam layer height on the solar cooker performance
- Identification and investigation of corrosion behavior of electroless composite coating on steel substrate
- Improvement in the California bearing ratio of subbase soil by recycled asphalt pavement and cement
- Some properties of thermal insulating cement mortar using Ponza aggregate
- Assessment of the impacts of land use/land cover change on water resources in the Diyala River, Iraq
- Effect of varied waste concrete ratios on the mechanical properties of polymer concrete
- Effect of adverse slope on performance of USBR II stilling basin
- Shear capacity of reinforced concrete beams with recycled steel fibers
- Extracting oil from oil shale using internal distillation (in situ retorting)
- Influence of recycling waste hardened mortar and ceramic rubbish on the properties of flowable fill material
- Rehabilitation of reinforced concrete deep beams by near-surface-mounted steel reinforcement
- Impact of waste materials (glass powder and silica fume) on features of high-strength concrete
- Studying pandemic effects and mitigation measures on management of construction projects: Najaf City as a case study
- Design and implementation of a frequency reconfigurable antenna using PIN switch for sub-6 GHz applications
- Average monthly recharge, surface runoff, and actual evapotranspiration estimation using WetSpass-M model in Low Folded Zone, Iraq
- Simple function to find base pressure under triangular and trapezoidal footing with two eccentric loads
- Assessment of ALINEA method performance at different loop detector locations using field data and micro-simulation modeling via AIMSUN
- Special Issue: AESMT-5 - Part I
- Experimental and theoretical investigation of the structural behavior of reinforced glulam wooden members by NSM steel bars and shear reinforcement CFRP sheet
- Improving the fatigue life of composite by using multiwall carbon nanotubes
- A comparative study to solve fractional initial value problems in discrete domain
- Assessing strength properties of stabilized soils using dynamic cone penetrometer test
- Investigating traffic characteristics for merging sections in Iraq
- Enhancement of flexural behavior of hybrid flat slab by using SIFCON
- The main impacts of a managed aquifer recharge using AHP-weighted overlay analysis based on GIS in the eastern Wasit province, Iraq