The nonlinear analysis of reactive powder concrete effectiveness in shear for reinforced concrete deep beams
-
Azhar Ayad Jaafar
 ,
Alyaa Abdulrazzaq Azeez
,
Alyaa Abdulrazzaq Azeez

Abstract
The aim of this article is to investigate the effect of using reactive powder concrete (RPC) for reinforcement concrete deep beams (CDBs) to study the shear effect by the numerical analysis. The method of finite element analysis model simulations using a program was used. The characteristics of RPC and the deep beam of reinforced concrete were obtained from previous scientific research. Non-linear analysis for two models of deep beams, one with RPC and the other without using it, was conducted to compare with experimental results from recent tests of deep concrete beams with RPC and loaded until failure. The data obtained from the specimens have many factors related to the effect of the strength and action of reinforcement CDBs such as shear load deflection, crack pattern, mode failure, and concrete strength. On the other hand, the mesh changing was investigated in terms of the maximum concrete strength and the running time by changing the mesh size to 50, 25, and 15. Models were simulated with a two-point load using a shear span-to-depth with an av/d ratio of 0.77. The difference in percentage deflection between the numerical and experimental models’ data was observed at 2.60 and 5.9% for concrete deep beam and RPC deep beam, respectively, and the maximum shear load was 2.27 and 5.40%. The importance of the outputs of this article lies in bridging the research gap of this new topic and identifying the shear behavior of deep beams reinforced with RPC due to the lack of research related to this topic. It was noted that the obtained data for finite element analysis are very consistent with the previous laboratory scientific research, while the error rate did not exceed 10%.
1 Introduction
Shear is one of the most dangerous types of failure that occurs in reinforced concrete members, especially in deep beams, because it occurs suddenly and without warning [1]. Therefore, it has become necessary to research and investigate materials and techniques for strengthening and repairing reinforced concrete parts. In recent years, new high-performance composite materials have been used, including reactive powder concrete (RPC), which meets the increasing requirements for high strength and durability, and provides superior ductility and workability. Because of the lack of research related to studying the effect of using RPC with deep beams, the importance of this research article is based on numerical analysis and comparing these results with the results of previous experimental work. Modeling simulation is adopted to verify laboratory results and perform a numerical study using nonlinear finite element analysis. To build strong, sustainable, and durable buildings, RPC is used, and it can be defined as modern cementitious composite materials with good toughness and high-performance properties [2]. As a result, RPC shows high compressive strength and flexural strength, high rigidity, and low porosity transmittance compared with high-performance concrete (HPC); it can be said that this is the fundamental and consistent difference between RPC and HPC [3]. The inventors of RPC did an important thing which is to avoid including coarse gravel in the mix which has to do with microstructure and RPC function which will reduce the heterogeneity in the mortar and aggregate mixture [4]. Sample modeling was performed using a computer program (ABAQUS 20.0). Non-linear numerical analysis was performed on deep beams to compare with experimental results. New cementitious material RPC high content container is made of short steel fibers with high strength and has an improved matrix density of packing and disposal of coarse aggregate [5]. The conclusions of this research show that the RPC mixture containing steel fibers added has no significant effect on the initial radial crushing load, but on the other hand, the maximum load capacity will be affected significantly. The ratio of maximum shear strength to radial crushing strength (Vu = Vcr) has an average ratio of about 2.5 and where was related to all examined beams of fibrous RPC [6]. The effect of the orientation of steel fibers on the bending ability in terms of load–deflection response has been demonstrated by a numerical study. The conclusions of this research indicate that the position of the steel fibers represents an important factor in the behavior of the models, and therefore it is typical. It was observed that the position of the fibers perpendicular to the longitudinal direction of the ultra-high-performance concrete (UHPC) beam will be in equal proportions [7]. A laboratory study was conducted and concluded that the addition of 2.5% mineral fibers in the RPC mixture gives a high compressive strength of 143.5 MPa at 60 days [8]. RPC is known as UHPC due to its superior mixture composition.
The RPC mixture is characterized by the absence of coarse aggregate as well as the presence of a large amount of cement (800–1,000 kg/m), silica fume, sand finer than 600 μm particle size or crushed quartz, fibers, and superplasticizers, usually with a water to cement ratio (w/c) less than 0.2 [9].
It has been shown that the failure mode of UHPC specimens changes from complete or sudden crushing to a somewhat elongated failure pattern by adding steel fibers so that the samples will remain intact without crushing or fragmentation [10].
Through the study and research, it was observed that the behavior of the linear elastic fracture, which reaches 80–90% of the maximum stress value, is related to the typical stress–strain curve of UHPC [11,12].
In addition, it was observed that adding 2% of steel fibers would increase and strengthen the crushing strength of radial shear by 95% [13].
Through a numerical study, it has been observed that the absolute shear strength and beam ductility can be improved more effectively by using the composite beam type UHPC-NC. On the other hand, the UHPC-NC composite beam will be weak at the end of the interfacial region and the mechanical properties of the composite beam will be adversely affected due to its fracture in that region, which must be considered in the structural design [14]. An experimental study was conducted on deep RPC, and it showed that the addition of 15–20 and 25% silica fume will increase the shear force by 11.5 and 18.3%, respectively. The reason for this may be that increasing steel fiber in the RPC mix will enhance particle packing, which will improve the RPC microstructure matrix and increases the strength of RPC [15].
2 Numerical analysis
In this scientific article, a numerical study was conducted using model simulations to study the behavior of RPC for reinforced deep beams. The results supporting this research work were adopted from previous new work. Figure 1 shows the deep beam as detailed and described which was used as a reference model as well as a model using RPC. Two specimens of profound beams were used for the same dimensions of 500 mm × 150 mm × 1200 mm and the shear span to effective depth ratio is 0.774. The control beams with stirrups and a diameter ø 12 mm by 200 mm spacing from the face of the beam. Other deep beam with RPC type. All RC deep beams have been validated by a new recent experiment and laboratory results have demonstrated that the use of RPC provides an improvement in shear strength within 68% compared to the deep reference beam. Finally, this research will study the behavior of RPC in shear for deep beams by the load–displacement response, crack pattern, mode failure, and the ultimate strength of concrete. Moreover, the numerical investigation of the mesh changing of the models by 50, 25, and 15 was carried out in terms of the running time, the ultimate concrete strength, crack pattern, and mode of failure.

Reference CDB and RPCDB.
2.1 Material modeling
In any numerical study, the simulation of any model under applied loads depends on the behavior and mechanical properties taken from the structural material used in construction. Different materials from which reinforced concrete members can be built (normal or reactive powder) concrete and steel will take collective behavior as a uniting rule. The stress–strain relationship will be similar in tension and compression when steel will be considered a homogeneous material.
On the contrary, the stress and tension behavior of concrete is different, as it is a heterogeneous semi-brittle material because its internal mixture is mainly dependent on the properties of all its mixtures. The RPC is cement mortar, steel fiber, silica fume, and air voids. The efficiency and accuracy of a computer model depend mainly on the appropriate modeling of material properties [15].
2.2 Numerical simulation of deep beams using ABAQUS
Considering the outlay of money and time involved, RC deep beam reactive concrete behaviors include many parameters: load–displacement response, crack pattern, mode of fraction, and the ultimate strength of concrete. Moreover, the numerical investigation of the lattice variability of the models by 50, 25, and 15 in terms of the running time, the maximum concrete strength, crack pattern, and mode of failure cannot be completely understood, and obtained by laboratory validation. Moreover, the numerical study can add information about RPC deep beams of shearing behavior. But the limitations of numerical analysis cannot fully solve the desired problem. Therefore, numerical analysis along with empirical validations is necessary for further study of the behavior of reinforced deep beams with RPC type.
The simulation of RPC-type reinforced deep beams was studied by ABAQUS software V20.0 using an advanced numerical model [16]. This research will study the behavior of non-linear concrete under compression and tension. The concrete damaged plasticity model from ABAQUS software was used to define the materials and extract data on stress and inelastic strain, which will be used as main inputs in the program to calculate other parameters such as the maximum shear strength and displacement in the compression and tensile regions of the concrete. Simulation data acquisition was evaluated using laboratory data that included two deep beam samples with the same dimensions (500 mm × 150 mm × 1200 mm) and the shear extent to effective depth ratio of 0.774 with the use of a four-point loading system for the reference and RPC deep beam.
2.3 Material properties
Accurate data on the mechanical properties of any material is an important key factor in any numerical analysis. The data obtained through the model’s simulation were compared with the data obtained with the previous experimental new research and the maximum error was kept less than or equal to 6%. The mechanical properties of normal concrete, RPC, and steel used to simulate the models in this research article are explained in Table 1.
Concrete, steel bar material properties
| Material | Parameter | Properties (MPa) |
|---|---|---|
| Normal concrete | Compressive strength | 25 |
| Young’s modulus | 23,500 | |
| Poisson’s ratio | 0.2 | |
| RPC | Compressive strength | 85 |
| Young’s modulus | 42,500 | |
| Poisson’s ratio | 0.2 | |
| Steel bar 16 mm | Young’s modulus | 200,000 |
| Yield stress | 483 | |
| Steel bar 12 mm | Young’s modulus | 200,000 |
| Yield stress | 338 |
Moreover, in the present simulation, the actual modulus of elasticity was computed based on ASTM C42/C42M-18a (drill core test) [17] The proposed stress–strain curve calculation was performed to select the uniaxial stress–strain values in the studies of Desayi and Krishnan and Gere and Timoshenko [18,19]. Using relationships and some equations, the damage coefficients for compression and tension behavior are calculated by Lubliner et al. and Lee and Fenves [20,21]. Plasticity will be the flow parameter as shown in Table 2.
| Parameters | Value |
|---|---|
| Dilation angle | 30–40 |
| Eccentricity | 0.1 |
| f b 0/f c 0 (i.e., σ b 0/σ c 0) | 1.16 |
| K | 2/3 |
| Viscosity parameter | 0.0 |
For compression damage, in ABAQUS, the user provides the d
c–
Depending on ABAQUS user manual will internally compute the plastic strain [21,22] as follows:
where
where σ i is the compressive stress at any point in the stress–strain curve; σ cu is the maximum compressive stress (i.e., crushing point), which can be deduced from the stress–strain curve; and E 0 is the initial modulus of elasticity for the material which the slope over the stress–strain curve.
Finally, it will obtain the value of plastic stress in compressive damage
For tension damage, in ABAQUS, the user provides the
where
ε
t is the tensile strain, which can be computed by the splitting tensile test (based on ASTM C496);
σ i is the tensile stress at any point in the stress–strain curve; and σ tu is the maximum tensile stress (i.e., crushing point), which can be deduced from the stress–strain curve.
Finally, we deduce the plastic strain in the tension damage
CDP values in compression damage for normal concrete
| ε c (%) | σ c (MPa) | d c |
|
|
|
|---|---|---|---|---|---|
| 0.00113 | 20 | 0 | 0.000851 | 0 | 0.00028 |
| 0.00206 | 22 | 0 | 0.000946 | 0.00111 | 0.00112 |
| 0.00326 | 24 | 0 | 0.00104 | 0.0022 | 0.00222 |
| 0.00386 | 25 | 0 | 0.001048 | 0.0028 | 0.00281 |
| 0.00446 | 22 | 0.09025 | 0.000953 | 0.0035 | 0.00341 |
| 0.00532 | 20 | 0.18773 | 0.000851 | 0.0044 | .00427 |
| 0.00585 | 18 | 0.27798 | 0.000757 | 0.0050 | 0.00481 |
| 0.00652 | 16 | 0.36823 | 0.000662 | 0.0058 | 0.00547 |
| 0.00712 | 14 | 0.44043 | 0.000586 | 0.00653 | 0.00607 |
CDP values in tension damage for normal concrete
| ε t (%) | σ t (MPa) | d t |
|
|
|
|---|---|---|---|---|---|
| 0 | 0 | 0 | 0 | 0 | 0 |
| 0.00058 | 2.5 | 0 | 0.000054 | 4.54 × 10⁻⁵ | 4.5 × 10⁻⁵ |
| 0.00083 | 2 | 0.24 | 0.00041 | 0.00042 | 0.00029 |
| 0.0013 | 1.15 | 0.51 | 0.00026 | 0.00104 | 0.00076 |
| 0.0021 | 0.46 | 0.76 | 0.00013 | 0.00197 | 0.00156 |
CDP values in compression damage for RPC
| ε c (%) | σ c (MPa) | d c |
|
|
|
|---|---|---|---|---|---|
| 0.0008 | 31 | 0 | 0.000732 | 0 | 0.00014 |
| 0.001 | 36 | 0 | 0.000837 | 0.000161 | 0.00018 |
| 0.0012 | 40 | 0 | 0.000941 | 0.000256 | 0.00028 |
| 0.00153 | 45 | 0 | 0.001046 | 0.00484 | 0.00112 |
| 0.002 | 49 | 0 | 0.001151 | 0.000845 | 0.00222 |
| 0.00273 | 53 | 0 | 0.001255 | 0.001473 | 0.00281 |
| 0.00319 | 55 | 0 | 0.00128 | 0.001913 | 0.00341 |
| 0.00353 | 51 | 0.060 | 0.001203 | 0.002323 | .00427 |
| 0.00399 | 47 | 0.142 | 0.001098 | 0.002894 | 0.00481 |
| 0.00452 | 42 | 0.223 | 0.000994 | 0.003531 | 0.00547 |
| 0.00519 | 38 | 0.3055 | 0.000889 | 0.004301 | 0.00607 |
CDP values in tension damage for RPC
| ε t (%) | σ t (MPa) | d t |
|
|
|
|---|---|---|---|---|---|
| 0 | 0 | 0 | 0 | 0 | 0 |
| 0.00075 | 2.75 | 0 | 0.000054 | 4.54 × 10⁻⁵ | 4.5 × 10⁻⁵ |
| 0.00088 | 2 | 0.24 | 0.00041 | 0.00042 | 0.00029 |
| 0.0017 | 1.34 | 0.51 | 0.00026 | 0.00104 | 0.00076 |
| 0.0025 | 0.65 | 0.76 | 0.00013 | 0.00197 | 0.00156 |
2.4 Constitutive models
2.4.1 Concrete model
The library of materials adopted in the ABAQUS software for concrete response modeling, such as the damaged plasticity model of concrete, has been shown to work in similar applications very perfectly [22].
2.4.2 Elements
An integrated engineering modeling capability is available in the ABAQUS Options Library. That’s why any collection of elements can be used to design the model. Item properties can be described as an important part of behaviors, or each item cross-section can be combined by numerical simulation so that the nonlinear response can be carefully followed when necessary [23].
2.4.3 Solid element
For linear and complex nonlinear analyses in the ABAQUS program, solid elements can be used, including contact, plasticity, and large distortions. For the numerical simulation presented in this article, the C3D8 – Bricks is used to model deep beam concrete and loading plates and endurance. The abbreviation represented by the term is shown in Figure 2 [23].

Abbreviation of the term C3D8.
2.4.4 Truss element
Other essential elements of this research are reinforcement rods for longitudinal reinforcement. Reinforcing bars are important for transmitting natural forces. For this, reinforcing bars in the form of three-dimensional gear elements are sufficient. The T3D2 – Truss is used to model the reinforcing rods in the numerical simulation of deep beam specimens. The abbreviation represented by the term is shown in Figure 3 [23].

Abbreviation of the term T3D2.
2.4.5 Meshing
To get accurate data from the finite element (FE) model, the model containing all the elements will intentionally allocate the same mesh size to ensure that in the same node two different materials will share it. For the modeling of concrete, loading, and support plates, the mesh element will be an eight-node brick element with three degrees of freedom of translation at each node (C3D8). In this article, three sizes of meshing were used (50, 25, 15), and the results were verified in terms of running time and maximum applied load. Figure 4 shows the typical mesh of a deep beam sampling numerical simulation model. Mesh and modeling generation were optimized using the same techniques for all specimens.

3-D meshing of deep beam concrete model in ABAQUS.
2.4.6 Loads and boundary conditions
For constraining the model and for a unique solution, the displacement boundary conditions will be needed. Constraints are put on a single line of nodes on the board in the UY and UX directions. The support case is shown in Figure 3. The force, P, is applied to the steel plate across the entire center line of the plate. Figure 5 shows the plate and the applied load.

Boundary conditions at support and applied load on the model.
3 Numerical analysis: verification of FE model
3.1 Load–deflection responses
For ABAQUS, displacements were computed at the same position. As for the numerical models, the mid-distance deviations were measured in the middle of the bottom face of the specimens and the experimental data were investigated and the following notes were made.
The numerical data for displacement were in good agreement with the laboratory data when the error rate did not exceed 10%.
We notice that the curve of the concrete deep beam (CDB) reference beam and the RPC deep beam (RPCDB) in the experimental work drops sharply from the top of the highest applied load while the decline in the finite element analysis is diagonal and less severe.
The deflection rate increased more at the maximum loads while the models showed an increase in the displacement rate close to the final load.

Load–displacement curve for reference deep beam (normal concrete) between experimental and FEA.

Load–displacement curve for deep beam (RPC) between experimental and FEA.
3.2 Numerical ultimate shear load
The results of the finite element analysis (FEA) of the maximum loads which the given element to the pilot loads corresponding deduced in Table 7 for deep beams and the following notes are inserted and implemented.
Through numerical simulation, we note that the maximum expected load obtained from ABAQUS software showed good agreement with the experimental data when the error rate did not exceed 10%.
For most of the beams, the maximum shear load in the numerical simulation was emphasized concentrically on the experimental data by 2% for the normal CDB and 5% for the RPCDB.
The numerical simulation reduced the strength of the deep beams by 2–3%. One reason for this difference was that the crack faces have reinforcement mechanisms which may also very slightly increase the failure of the lab beams before the complete collapse. The numerical simulation of the models had no such options.
To compare the beam carrying capacity, the finite element models had the same sequence as the actual beams. Comparison of the numerical results for CDB resulted in a 2% maximum load enhancement, with respect to reference deep beam CDB.
Comparison of the numerical results of RPCDB resulted in a maximum load enhancement of 5% with respect to the experimental RPCDB beam.
Experimental and numerical maximum shear load and displacement of beams CDB and RPCDB
| Specimens | Vu (theoretical) (kN) | Vu (laboratory) (kN) | Vu (theoretical)/Vu (laboratory) | Displacement (theoretical) (mm) | Displacement (laboratory) (mm) |
|---|---|---|---|---|---|
| CDB | 225 | 220 | 1.02 | 10.27 | 8.88 |
| RPCDB | 390 | 370 | 1.05 | 11.85 | 9.30 |
3.3 Radial crack load and crushing patterns
Through the data obtained from the numerical simulation using the ABAQUS program, we notice an increase in the radial crushing load when the load was gradually increased, where the crack seemed clear going from the support to the load point. The radial crushing load obtained from the laboratory results was lower than that taken out from the ABAQUS data by 2% for the normal CDB and 5% for the RPCDB. The difference between the ABAQUS data and the laboratory data was because of the comparison of the relative fit of the numerical simulation models with the relative covariance of the real beams. Using ABAQUS software, the crack patterns in each applied loading step have been recorded as shown in Figures 6 and 7, and these charts show the evolution of the crack patterns for each specimen. When the applied load became high, the appearance of tensile cracks was observed, and when the applied loads began to gradually increase, there were many radial cracks and additional bending; then compression cracks appeared when the applied load reached the final stages of failure [24].
For the two deep beams tested, the failure mode was as predicted. The laboratory deep beams that failed are documented by taking out pictures and the crack patterns are accurately determined to be then compared with numerical simulation models during the incremental loading phases. As for the CDB reference beam, by using ABAQUS software, the crack patterns for numerical simulation models and experimental beams have been well examined and studied. Through the experiment and examination in this research article, it has been observed that the radial shear cracks extend from the support toward the load point. The high shear stress region has been observed to have many cracks. The crack pattern at failure mode from the experimental work and simulation by the ABAQUS program of the deep beam of CBD can be observed in Figure 6. The comparison shows the same behavior where vertical cracks (flexural cracks) are observed at mid-span followed by the development of diagonal cracks within the critical shear region at the left and right side of the shear span of the beam.
Moreover, the shear cracks started close to the center of support as in laboratory work and gave a good validation for FEA that can help to use this software to make the new designation in the future for other variables such as shear span to effective depth ratio. Finally, the failure mode and crack pattern of the deep beam for a four-point load shows homogeneity depending on the crack distribution for both sides of the deep beam as experimental work.
A radial concrete tensile failure or splitting failure occurred in a reference beam and was a radial crack that formed at each shear interval from the inner edge of the support toward the inner edge of the point load. A diagonal crack extended above the diagonal line between the center lines of the point loads and the supports, and it is mentioned in Figure 8.

(a) Experimental crack pattern, (b) FEM-crack pattern, and (c) FEM-mode failure for deep beam (CDB).
It has been observed that the deep beam (RPCDB) has a very common failure mode, which is the shear compression failure. Shear compression failure has been described in the flexural compressive zone by cracking concrete at the tip of the main radial notch. The flexural compression zone was characterized by the extension of the main radial crack from the inner face of the support towards the inner face of the loading point. In this article, we note that the failure in the deep beams occurred suddenly without warning, and the movement would fail and extend along the oblique fissure. Figure 9 mentions a typical shear-compression failure.

(a) Experimental specimen, (b) FEM-Crack pattern, and (c) FEM-mode failure for deep beam (RPCDB).
3.4 Mesh changing effect
In this article, the mesh of the models was changed to three sizes (50, 25, 15) and this change was studied in terms of the maximum applied load and the time required to complete the simulation of the models. It has been observed that when the network size is reduced, the maximum applied load will also be reduced. The reference specimen CDB was taken as a model to observe the change of the mesh. The effect of the mesh changing is shown in Figures 10 and 11.

Changing mesh for control deep beam CDB.
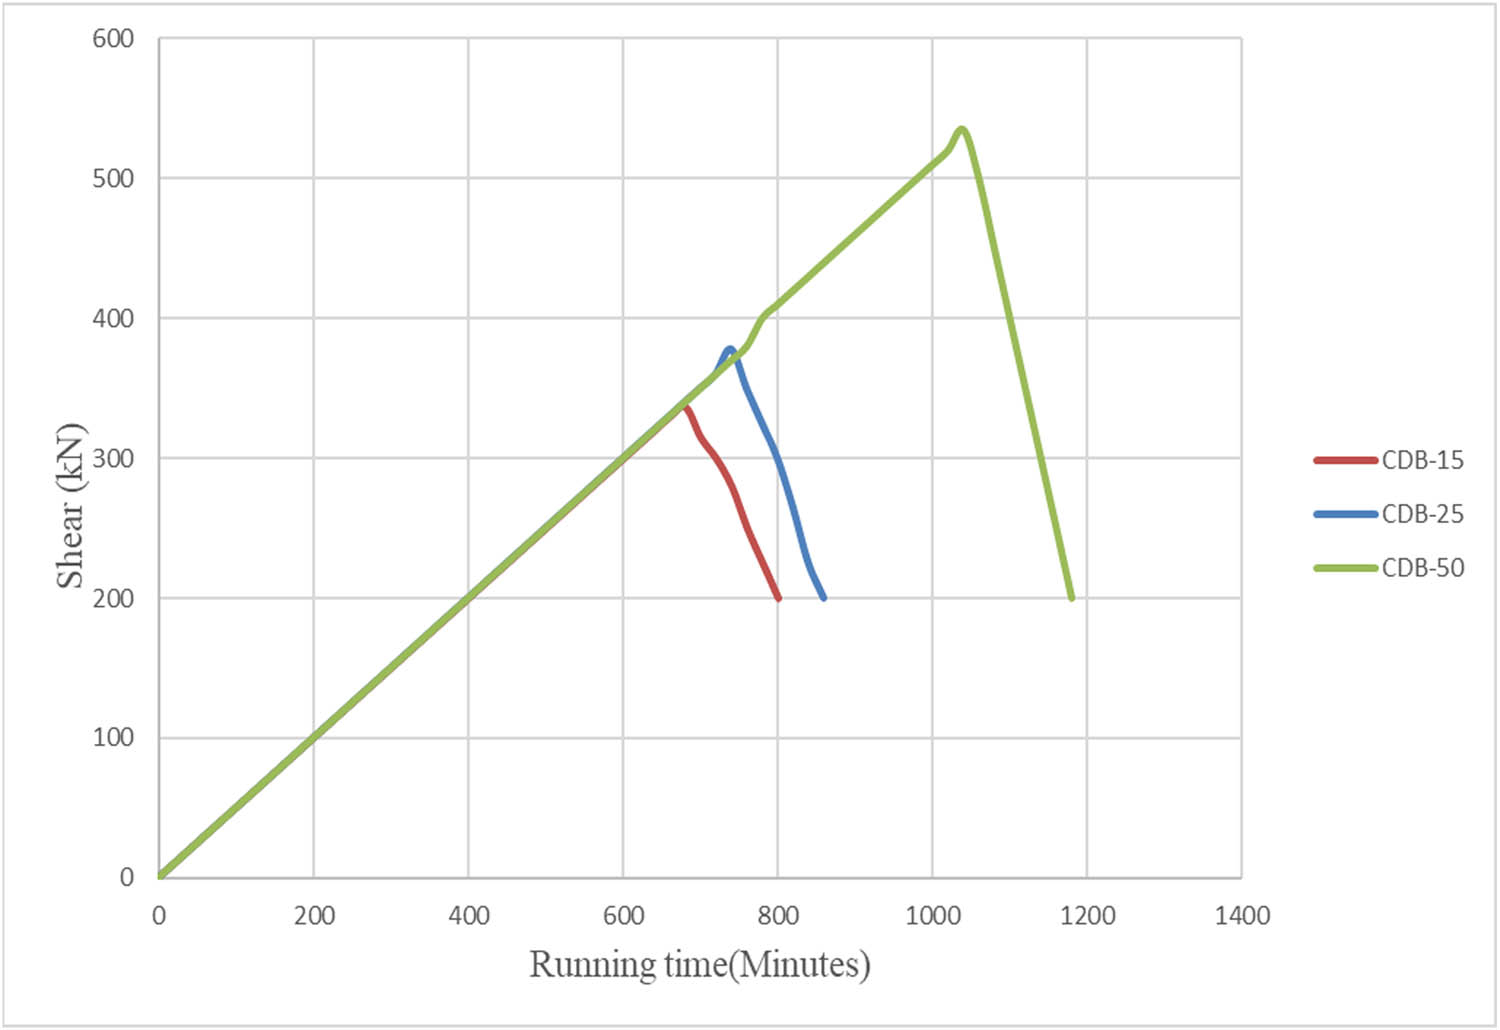
Comparison between the different meshing for control deep beam CDB.
It was noted that with the changing of mesh size of the reference model to 50, 25, and 15, it will require a running time of 16, 100, and 438 min, respectively. As for the maximum numerical shear load at a mesh size of 50, it was noticed that it increased by 2.27% compared to the shear load for experimental work. On the other hand, the numerical shear load decreased at sizes 25 and 15 by 16 and 30.4%, respectively, compared to the shear load for the previous experimental work. It is important to note that the finite element analysis study is approximate in nature due to several factors, the most important of which are [25] the following:
An approximation in material simulation related to concrete and steel plate.
An approximation was inherent in the simulation of the numerical model’s technique.
An approximation is used in the integral function in numerical simulation.
The approximation was presented due to the type of implementation option used to solve the nonlinear system of equations.
3.5 Dimension changing effect
In this article, the dimensions of the model were changed to an overall length of 1,700 mm, a depth of 400 mm, and a thickness of 150 mm, and this change was studied in terms of the maximum applied load, crack pattern, and mode of failure to complete the model simulation. The CDB and RPCDB models were taken as models to monitor the effect of dimensional change. The effect of changing dimensions is shown in Figure 12 and Table 8.
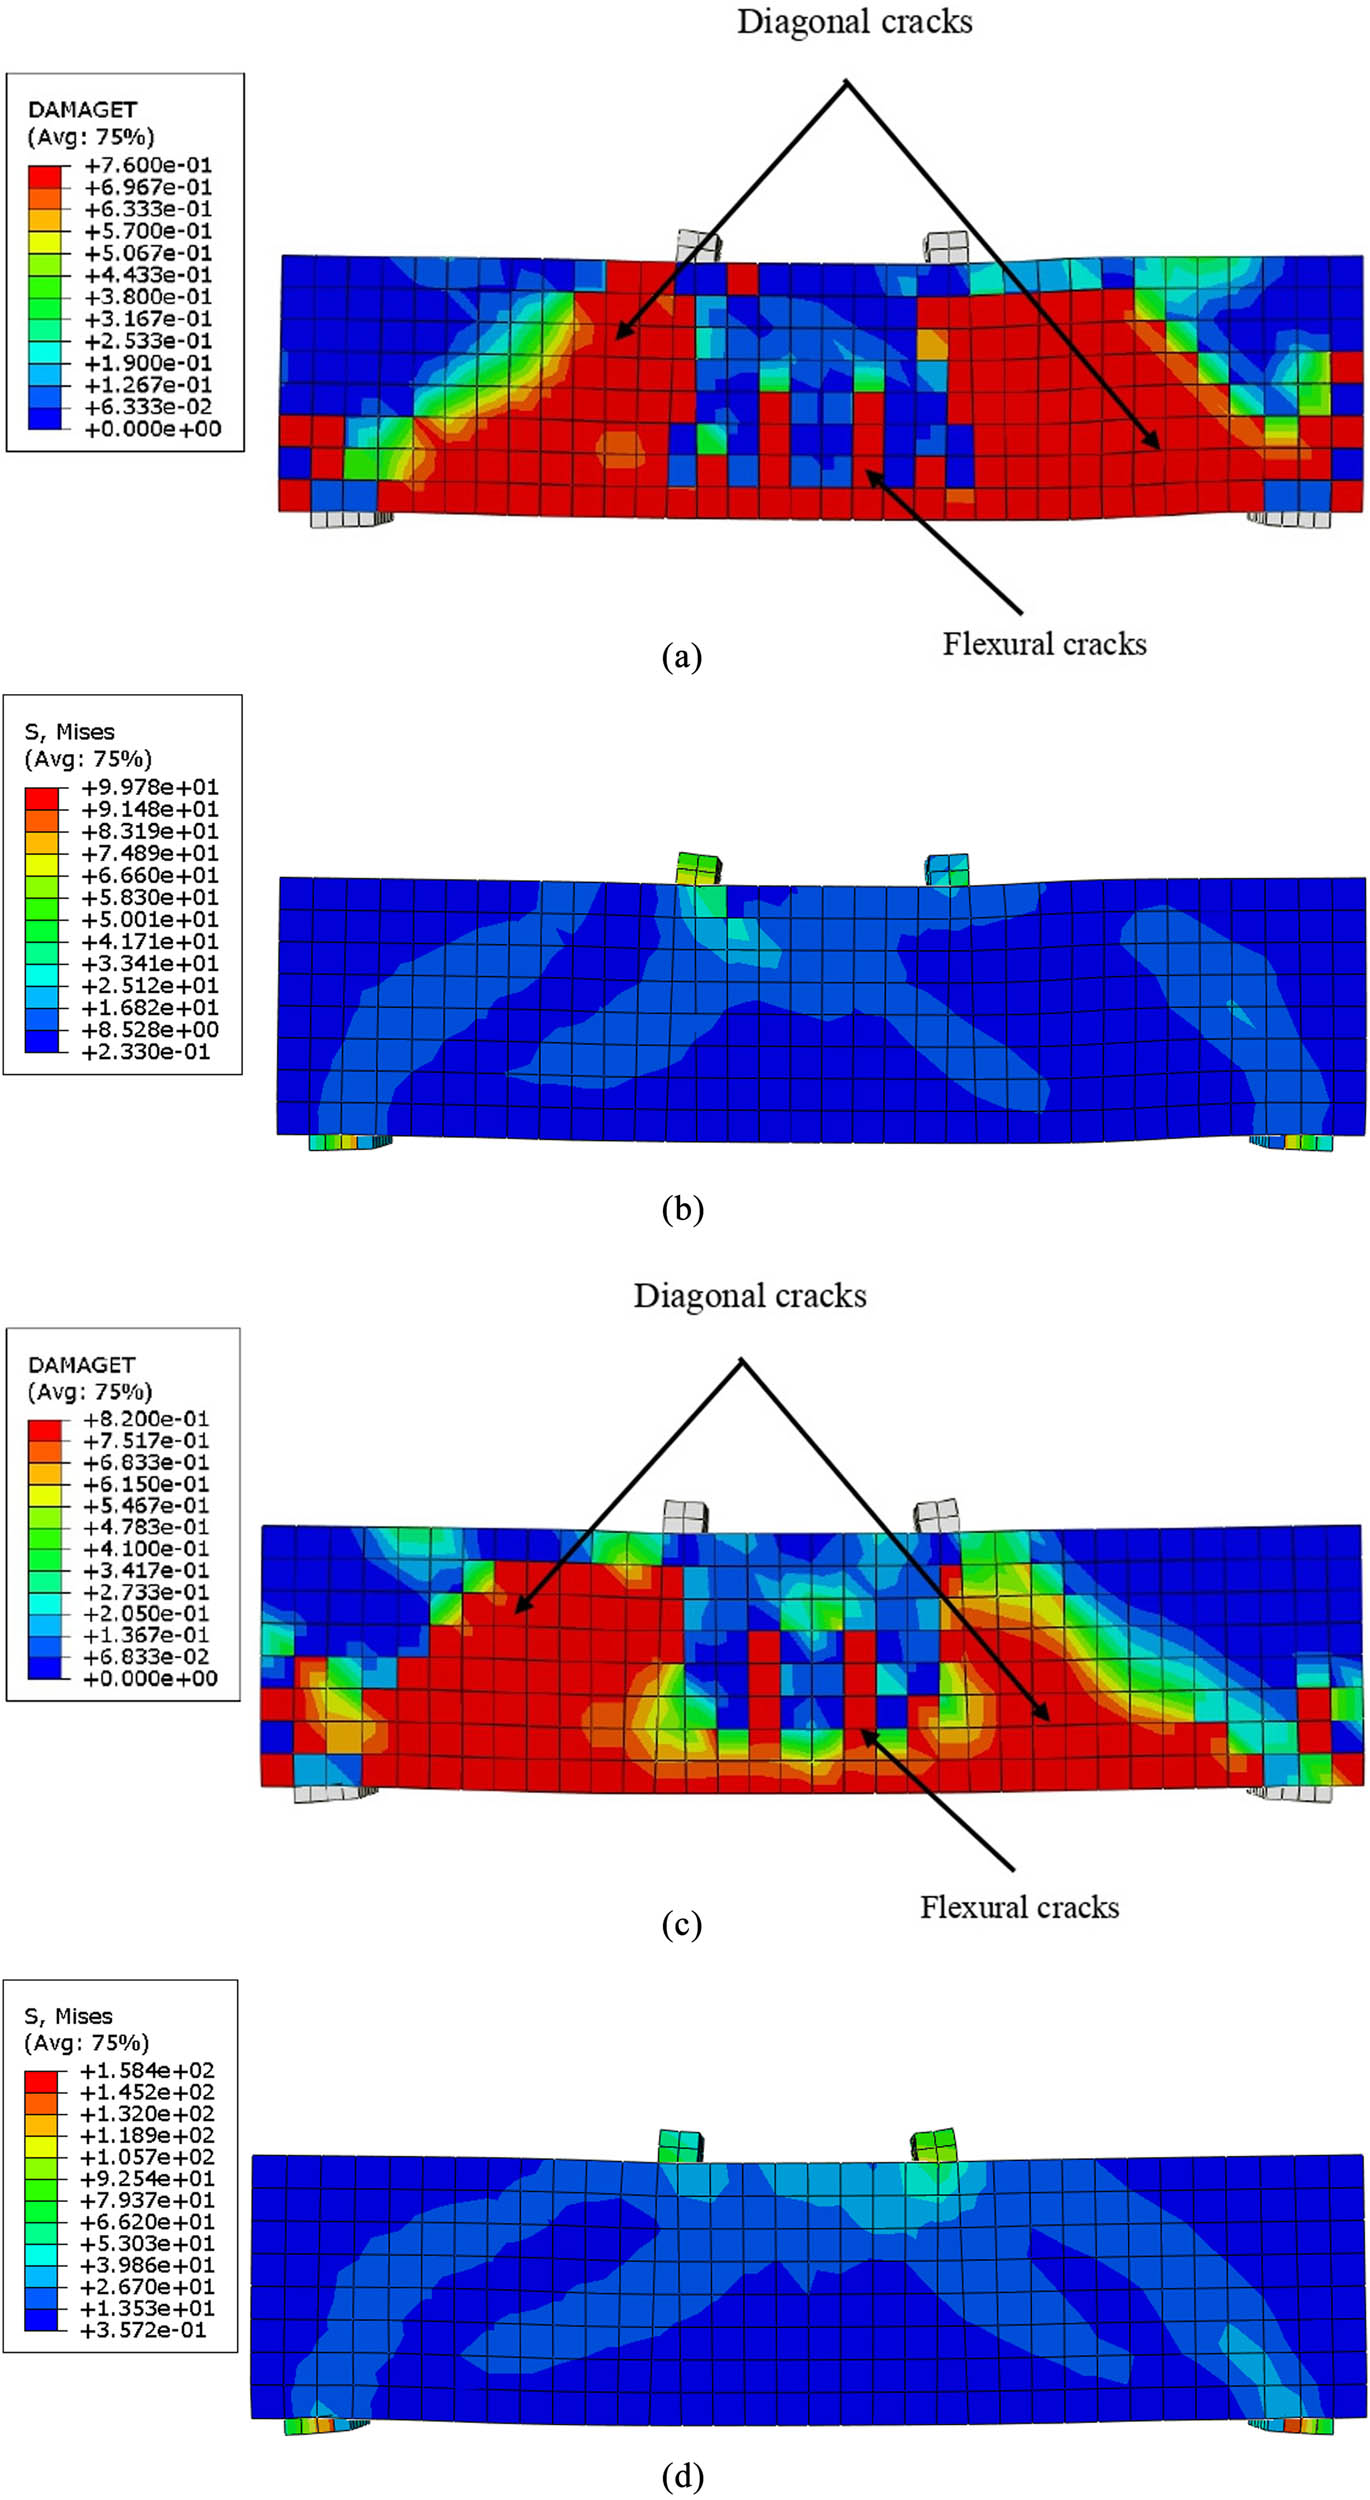
(a) FEM-crack pattern (CDB), (b) FEM-mode failure (CDB), (c) FEM-crack pattern (RPCDB), and (d) FEM-mode failure (RPCDB).
Effect of changing the dimensions on the additive numerical models of the maximum shear load and displacement of beams CDB and RPCDB
| Specimens | Vu (N.D)* (kN) | Vu (OD)** (kN) | Vu (ND)/Vu (OD) | Max. disp.*** (ND) (mm) | Max. disp.*** (OD) (mm) | Disp. (ND)/disp. (OD) |
|---|---|---|---|---|---|---|
| CDB | 259 | 225 | 1.15 | 13.8 | 10.27 | 1.29 |
| RPCDB | 348 | 390 | 0.89 | 13.3 | 11.85 | 1.12 |
*(OD) = Original dimensions. **(ND) = New dimensions. ***(disp.) = Maximum displacement.
It was observed that the maximum shear load increased by 15% for the reference model CDB when increasing the dimensions of the model, while there was an increase in the maximum displacement by 29%.
As for the RPC model (RPCDB), there was a decrease in the value of the maximum shear load by 11%. On the contrary, there was an increase in the maximum displacement by 12%.
For the reference model (CDB) with new dimensions, where the shear crack pattern was densely spread and extended from the support to the point load, and the mode of failure was a shear-compression failure, while the model with the old dimensions, the shear cracks were limited and extended from the support to the supporting load and mode of failure was a shear failure. The RPC (RPCDB) model with new dimensions was also similar to CDB in terms of the crack pattern and mode failure.
4 Conclusion
Through this scientific research, numerical simulation was carried out using the ABAQUS software to study the behavior of the deep beam with RPC in shear and to see the difference in the results with the deep control beam with ordinary concrete. ABAQUS software was used to simulate and study data from the recent laboratory research data. By comparing the results between laboratory data and simulation data, it was noted that the error rate did not exceed 6% of the maximum applied load. Some observations can be summarized as follows:
The data from numerical model simulations agree well with the laboratory results, especially regarding the load–deflection response, crack patterns, and failure modes. The error percentage was 2–5% for the maximum shear load and 2–6% for the displacement.
Based on the current article, the difference in percentage displacement between numerical model simulations and laboratory data was observed at 2.60% for the control RC deep beam (CDB) and 5.9% for the RC deep beam (RPCDB) with RPC.
Based on the present scientific article, the difference in the percentage of maximum shear load between numerical model simulation data and laboratory results was observed at 2.27% for the control deep beam (CDB) and 5.40% for RC deep beam with RPC.
ABAQUS can control, catch, and photograph the model from cracks during loading until crushing for concrete. Predictive failure patterns for all beams of the component agree well with the experimental results.
Based on the present scientific article, the increase in the percentage of maximum shear load between the numerical models for the new and original dimensions for CDB was observed at 15% and it was an 11% decrease in the amount of maximum shear load for the model of RPC (RPCDB).
Based on the present scientific article, the increase in the percentage of maximum displacement between the numerical models for the new and original dimensions for CDB was observed at 29% and it was 12% in the amount of maximum displacement for the model of RPC (RPCDB).
Acknowledgments
The authors wish to extend their thanks to the Fourth Dimension Contracting Company for their support, guidance, and expertise that greatly assisted the research, especially in preparing the research materials and laboratory.
-
Conflict of interest: The authors declare that they have no conflict of interest.
-
Data availability statement: Most datasets generated and analyzed in this study are comprised in this submitted manuscript. The other datasets are available on reasonable request from the corresponding author with the attached information.
References
[1] Rajapakse RMCM, Wijesundara KK, Nascimbene R, Bandara CS, Dissanayake R. Accounting axial-moment-shear interaction for force-based fiber modeling of RC frames. Eng Struct. 2019;184:15–36.10.1016/j.engstruct.2019.01.075Search in Google Scholar
[2] Hussain ZA, Aljalawi NMF. Behavior of reactive powder concrete containing recycled glass powder reinforced by steel fiber. J Mech Behav Mater. 2022;31(1):233–9.10.1515/jmbm-2022-0025Search in Google Scholar
[3] Sanjuán MÁ, Andrade C. Reactive powder concrete: Durability and applications. Appl Sci. 2021;11(12):5629.10.3390/app11125629Search in Google Scholar
[4] Abbas HS, Al-Rubaye MIS, Alkasassbeh A. Three-dimensional numerical study of the reactive powder concrete segments in tunnel lining. Curved Layer Struct. 2022;9(1):286–94.10.1515/cls-2022-0022Search in Google Scholar
[5] Shen L, Ding M, Chen K, Feng C, Yang B, Elchalakani M. The mechanical behavior of RPC under combined shear and compressive loads. Cem Concr Compos. 2021;121:104071.10.1016/j.cemconcomp.2021.104071Search in Google Scholar
[6] Ridha MM, Al-Shaarbaf IA, Sarsam KF. Experimental study on shear resistance of reactive powder concrete beams without stirrups. Mech Adv Mater Struct. 2020;27(12):1006–18.10.1080/15376494.2018.1504258Search in Google Scholar
[7] Said AI, Tu’ma NH. Numerical modeling for flexural behavior of UHPC beams reinforced with steel and sand-coated CFRP bars. IOP Conference Series: Earth and Environmental Science. Vol. 856, Issue 1. IOP Publishing; 2021, September. p. 012003.10.1088/1755-1315/856/1/012003Search in Google Scholar
[8] Chadli M, Mekki M, Mezghiche B. Formulation and study of metal fiber-reinforced reactive powder concrete. World J Eng. 2018;15(4):531–9.10.1108/WJE-04-2017-0094Search in Google Scholar
[9] Marzoq ZH, Borhan TM. Mechanical properties of reactive powder concrete: a comparison study. Al-Qadisiyah J Eng Sci. 2021;13(4):246–52.Search in Google Scholar
[10] El-Dieb AS. Mechanical, durability and microstructural characteristics of ultra-high-strength self-compacting concrete incorporating steel fibers. Mater & Des. 2009;30(10):4286–92.10.1016/j.matdes.2009.04.024Search in Google Scholar
[11] Xu J, Wu C, Xiang H, Su Y, Li ZX, Fang Q, et al. Behaviour of ultra high performance fibre reinforced concrete columns subjected to blast loading. Eng Struct. 2016;118:97–107.10.1016/j.engstruct.2016.03.048Search in Google Scholar
[12] Cheyrezy M. Structural applications of RPC. Concrete. 1999;33(1):20–3.Search in Google Scholar
[13] Bae BI, Lee MS, Choi CS, Jung HS, Choi HK. Evaluation of the ultimate strength of the ultra-high-performance fiber-reinforced concrete beams. Appl Sci. 2021;11(7):2951.10.3390/app11072951Search in Google Scholar
[14] He J, Chao L. Numerical analysis on shear resistance of ultra‐high performance concrete‐normal strength concrete composite beam. Struct Concr. 2021;22(2):1128–46.10.1002/suco.202000502Search in Google Scholar
[15] Makki RF, Jassem AT, Ridha AS. Theoretical study of reactive powder concrete deep beams. J Univ Babylon Eng Sci. 2018;26(7):299–313.Search in Google Scholar
[16] Manual AU. Dassault systems simulia corporation. Providence, USA; 2010.Search in Google Scholar
[17] ASTM. Standard test method for obtaining and testing drilled cores and sawed beams of concrete. ASTM C42/C42M-18a. West Conshohocken, PA: ASTM; 2018.Search in Google Scholar
[18] Desayi P, Krishnan S. The equation for the stress–strain curve of concrete. Journal Proceedings. Vol. 61. Issue 3; 1964, March. p. 345–50.10.14359/7785Search in Google Scholar
[19] Gere JM, Timoshenko SP. Mechanics of materials. PWS-KENT Publishing Company; 1997.Search in Google Scholar
[20] Lubliner J, Oliver J, Oller S, Oñate E. A plastic-damage model for concrete. Int J solids Struct. 1989;25(3):299–326.10.1016/0020-7683(89)90050-4Search in Google Scholar
[21] Lee J, Fenves GL. Plastic-damage model for cyclic loading of concrete structures. J Eng Mech. 1998;124(8):892–900.10.1061/(ASCE)0733-9399(1998)124:8(892)Search in Google Scholar
[22] Malm R. Predicting shear type crack initiation and growth in concrete with non-linear finite element method. Doctoral dissertation. KTH; 2009.Search in Google Scholar
[23] Metwally IM. Three-dimensional nonlinear finite element analysis of concrete deep beam reinforced with GFRP bars. HBRC J. 2017;13(1):25–38.10.1016/j.hbrcj.2015.02.006Search in Google Scholar
[24] Haseen DR. Shear strengthening and repair of deep beams with and without web reinforcement using near-surface mounted cfrp bars. Doctoral dissertation. Universiti Tun Hussein Onn Malaysia; 2018.Search in Google Scholar
[25] Cook RD. Concepts and applications of finite element analysis. Singapore: John Wiley & Sons; 2007.Search in Google Scholar
© 2023 the author(s), published by De Gruyter
This work is licensed under the Creative Commons Attribution 4.0 International License.
Articles in the same Issue
- Regular Articles
- Design optimization of a 4-bar exoskeleton with natural trajectories using unique gait-based synthesis approach
- Technical review of supervised machine learning studies and potential implementation to identify herbal plant dataset
- Effect of ECAP die angle and route type on the experimental evolution, crystallographic texture, and mechanical properties of pure magnesium
- Design and characteristics of two-dimensional piezoelectric nanogenerators
- Hybrid and cognitive digital twins for the process industry
- Discharge predicted in compound channels using adaptive neuro-fuzzy inference system (ANFIS)
- Human factors in aviation: Fatigue management in ramp workers
- LLDPE matrix with LDPE and UV stabilizer additive to evaluate the interface adhesion impact on the thermal and mechanical degradation
- Dislocated time sequences – deep neural network for broken bearing diagnosis
- Estimation method of corrosion current density of RC elements
- A computational iterative design method for bend-twist deformation in composite ship propeller blades for thrusters
- Compressive forces influence on the vibrations of double beams
- Research on dynamical properties of a three-wheeled electric vehicle from the point of view of driving safety
- Risk management based on the best value approach and its application in conditions of the Czech Republic
- Effect of openings on simply supported reinforced concrete skew slabs using finite element method
- Experimental and simulation study on a rooftop vertical-axis wind turbine
- Rehabilitation of overload-damaged reinforced concrete columns using ultra-high-performance fiber-reinforced concrete
- Performance of a horizontal well in a bounded anisotropic reservoir: Part II: Performance analysis of well length and reservoir geometry
- Effect of chloride concentration on the corrosion resistance of pure Zn metal in a 0.0626 M H2SO4 solution
- Numerical and experimental analysis of the heat transfer process in a railway disc brake tested on a dynamometer stand
- Design parameters and mechanical efficiency of jet wind turbine under high wind speed conditions
- Architectural modeling of data warehouse and analytic business intelligence for Bedstead manufacturers
- Influence of nano chromium addition on the corrosion and erosion–corrosion behavior of cupronickel 70/30 alloy in seawater
- Evaluating hydraulic parameters in clays based on in situ tests
- Optimization of railway entry and exit transition curves
- Daily load curve prediction for Jordan based on statistical techniques
- Review Articles
- A review of rutting in asphalt concrete pavement
- Powered education based on Metaverse: Pre- and post-COVID comprehensive review
- A review of safety test methods for new car assessment program in Southeast Asian countries
- Communication
- StarCrete: A starch-based biocomposite for off-world construction
- Special Issue: Transport 2022 - Part I
- Analysis and assessment of the human factor as a cause of occurrence of selected railway accidents and incidents
- Testing the way of driving a vehicle in real road conditions
- Research of dynamic phenomena in a model engine stand
- Testing the relationship between the technical condition of motorcycle shock absorbers determined on the diagnostic line and their characteristics
- Retrospective analysis of the data concerning inspections of vehicles with adaptive devices
- Analysis of the operating parameters of electric, hybrid, and conventional vehicles on different types of roads
- Special Issue: 49th KKBN - Part II
- Influence of a thin dielectric layer on resonance frequencies of square SRR metasurface operating in THz band
- Influence of the presence of a nitrided layer on changes in the ultrasonic wave parameters
- Special Issue: ICRTEEC - 2021 - Part III
- Reverse droop control strategy with virtual resistance for low-voltage microgrid with multiple distributed generation sources
- Special Issue: AESMT-2 - Part II
- Waste ceramic as partial replacement for sand in integral waterproof concrete: The durability against sulfate attack of certain properties
- Assessment of Manning coefficient for Dujila Canal, Wasit/-Iraq
- Special Issue: AESMT-3 - Part I
- Modulation and performance of synchronous demodulation for speech signal detection and dialect intelligibility
- Seismic evaluation cylindrical concrete shells
- Investigating the role of different stabilizers of PVCs by using a torque rheometer
- Investigation of high-turbidity tap water problem in Najaf governorate/middle of Iraq
- Experimental and numerical evaluation of tire rubber powder effectiveness for reducing seepage rate in earth dams
- Enhancement of air conditioning system using direct evaporative cooling: Experimental and theoretical investigation
- Assessment for behavior of axially loaded reinforced concrete columns strengthened by different patterns of steel-framed jacket
- Novel graph for an appropriate cross section and length for cantilever RC beams
- Discharge coefficient and energy dissipation on stepped weir
- Numerical study of the fluid flow and heat transfer in a finned heat sink using Ansys Icepak
- Integration of numerical models to simulate 2D hydrodynamic/water quality model of contaminant concentration in Shatt Al-Arab River with WRDB calibration tools
- Study of the behavior of reactive powder concrete RC deep beams by strengthening shear using near-surface mounted CFRP bars
- The nonlinear analysis of reactive powder concrete effectiveness in shear for reinforced concrete deep beams
- Activated carbon from sugarcane as an efficient adsorbent for phenol from petroleum refinery wastewater: Equilibrium, kinetic, and thermodynamic study
- Structural behavior of concrete filled double-skin PVC tubular columns confined by plain PVC sockets
- Probabilistic derivation of droplet velocity using quadrature method of moments
- A study of characteristics of man-made lightweight aggregate and lightweight concrete made from expanded polystyrene (eps) and cement mortar
- Effect of waste materials on soil properties
- Experimental investigation of electrode wear assessment in the EDM process using image processing technique
- Punching shear of reinforced concrete slabs bonded with reactive powder after exposure to fire
- Deep learning model for intrusion detection system utilizing convolution neural network
- Improvement of CBR of gypsum subgrade soil by cement kiln dust and granulated blast-furnace slag
- Investigation of effect lengths and angles of the control devices below the hydraulic structure
- Finite element analysis for built-up steel beam with extended plate connected by bolts
- Finite element analysis and retrofit of the existing reinforced concrete columns in Iraqi schools by using CFRP as confining technique
- Performing laboratory study of the behavior of reactive powder concrete on the shear of RC deep beams by the drilling core test
- Special Issue: AESMT-4 - Part I
- Depletion zones of groundwater resources in the Southwest Desert of Iraq
- A case study of T-beams with hybrid section shear characteristics of reactive powder concrete
- Feasibility studies and their effects on the success or failure of investment projects. “Najaf governorate as a model”
- Optimizing and coordinating the location of raw material suitable for cement manufacturing in Wasit Governorate, Iraq
- Effect of the 40-PPI copper foam layer height on the solar cooker performance
- Identification and investigation of corrosion behavior of electroless composite coating on steel substrate
- Improvement in the California bearing ratio of subbase soil by recycled asphalt pavement and cement
- Some properties of thermal insulating cement mortar using Ponza aggregate
- Assessment of the impacts of land use/land cover change on water resources in the Diyala River, Iraq
- Effect of varied waste concrete ratios on the mechanical properties of polymer concrete
- Effect of adverse slope on performance of USBR II stilling basin
- Shear capacity of reinforced concrete beams with recycled steel fibers
- Extracting oil from oil shale using internal distillation (in situ retorting)
- Influence of recycling waste hardened mortar and ceramic rubbish on the properties of flowable fill material
- Rehabilitation of reinforced concrete deep beams by near-surface-mounted steel reinforcement
- Impact of waste materials (glass powder and silica fume) on features of high-strength concrete
- Studying pandemic effects and mitigation measures on management of construction projects: Najaf City as a case study
- Design and implementation of a frequency reconfigurable antenna using PIN switch for sub-6 GHz applications
- Average monthly recharge, surface runoff, and actual evapotranspiration estimation using WetSpass-M model in Low Folded Zone, Iraq
- Simple function to find base pressure under triangular and trapezoidal footing with two eccentric loads
- Assessment of ALINEA method performance at different loop detector locations using field data and micro-simulation modeling via AIMSUN
- Special Issue: AESMT-5 - Part I
- Experimental and theoretical investigation of the structural behavior of reinforced glulam wooden members by NSM steel bars and shear reinforcement CFRP sheet
- Improving the fatigue life of composite by using multiwall carbon nanotubes
- A comparative study to solve fractional initial value problems in discrete domain
- Assessing strength properties of stabilized soils using dynamic cone penetrometer test
- Investigating traffic characteristics for merging sections in Iraq
- Enhancement of flexural behavior of hybrid flat slab by using SIFCON
- The main impacts of a managed aquifer recharge using AHP-weighted overlay analysis based on GIS in the eastern Wasit province, Iraq