Investigation of molecular regulation mechanism under the pathophysiology of subarachnoid hemorrhage
-
Yifei Weng


Abstract
This study aimed to investigate the molecular mechanism under the pathophysiology of subarachnoid hemorrhage (SAH) and identify the potential biomarkers for predicting the risk of SAH. Differentially expressed mRNAs (DEGs), microRNAs, and lncRNAs were screened. Protein–protein interaction (PPI), drug–gene, and competing endogenous RNA (ceRNA) networks were constructed to determine candidate RNAs. The optimized RNAs signature was established using least absolute shrinkage and selection operator and recursive feature elimination algorithms. A total of 124 SAH-related DEGs were identified, and were enriched in inflammatory response, TNF signaling pathway, and others. PPI network revealed 118 hub genes such as TNF, MMP9, and TLR4. Drug–gene network revealed that chrysin targeted more genes, such as TNF and MMP9. JMJD1C-AS-hsa-miR-204-HDAC4/SIRT1 and LINC01144-hsa-miR-128-ADRB2/TGFBR3 regulatory axes were found from ceRNA network. From these networks, 125 candidate RNAs were obtained. Of which, an optimal 38 RNAs signatures (2 lncRNAs, 1 miRNA, and 35 genes) were identified to construct a Support Vector Machine classifier. The predictive value of 38 biomarkers had an AUC of 0.990. Similar predictive performance was found in external validation dataset (AUC of 0.845). Our findings provided the potential for 38 RNAs to serve as biomarkers for predicting the risk of SAH. However, their application values should be further validated in clinical.
1 Introduction
Intracranial aneurysm (IA) is one of the common neurological diseases, and its incidence rate in the general population is approximately 5% [1]. IA is characterized by localized dilation or ballooning of a cerebral artery. Once an IA ruptures, a subarachnoid hemorrhage (SAH) typically develops [2,3]. SAH is a severe subtype of stroke, occurring in people about 50 years old [4]. Previous research revealed that environmental exposures and genetic predisposition play a role in the susceptibility of SAH, and the estimated heritability is about 40% [5]. Recently, despite considerable advances in therapy for IAs, SAH remains a highly challenging condition associated with a high socioeconomic burden [6,7]. SAH is a critical disease that has to be treated immediately. Therefore, an in-depth understanding of the molecular mechanism of SAH is necessary for the treatment of SAH. In addition, early screening and early active management and prevention of SAH help to reduce the mortality and disability rate of SAH patients. For these two purposes, this study was designed to investigate the molecular mechanism under the pathophysiology of SAH and to identify potential biomarkers that could predict the risk of SAH.
With the development of bioinformatics, gene expression profiling has been widely used to identify the biomarkers for the diagnosis and treatment of SAH [8]. Wang et al. found that six hub genes, BASP1, CEBPB, ECHDC2, GZMK, KLHL3, and SLC2A3, were determined as biomarkers to assess the progression and rupture of IAs [3]. It is known that long non-coding RNAs (lncRNAs) interact with mRNAs, and microRNAs (miRNAs) regulate many processes, such as transcription, translation, regulation of cell differentiation and cell cycle [9]. Interestingly, non-coding RNAs, comprising miRNAs and lncRNAs, play an important role in IAs and SAH [10]. Besides, lncRNAs detected from the biological fluids may be used as non-invasive biomarkers for the diagnosis and prognosis of IAs and SAH [11]. For instance, lncRNA MALAT1 expression was independently associated with the poor overall survival for IAs, and the overexpression of MALAT1 predicted an higher risk of death in IA patients [12]. Circulating miRNAs (such as miR-16 and miR-25) may be novel biological markers that are useful in assessing the likelihood of IA occurrence [13]. Unfortunately, because of poor understanding of the mechanisms of SAH, current diagnosis and treatment of SAH can be inconsistent and/or ineffective [14,15]. Especially, the effects of core RNAs on the progression and prognosis of SAH patients have not been fully identified.
In the present research, we aimed to screen the SAH-related RNAs as biomarkers to provide new insights for the early screening, diagnosis, and treatment of SAH. For this aim, GSE36791 [16] and GSE73378 [15] datasets from the Gene Expression Omnibus (GEO) database were reanalyzed. A flowchart presenting the experimental design of this study is illustrated in Figure 1.

Flow diagram of the present study.
2 Materials and methods
2.1 Data collection and preprocessing
The microarray datasets searched by terms of “subarachnoid hemorrhage” and “Homo sapiens” were acquired in the GEO database as of 2 January 2021. For the purpose of this research, the dataset screening criteria were as follows: (1) blood samples; (2) samples of SAH patients and controls; and (3) the total number of samples >50. There were two datasets meeting the screening criteria, GSE73378 [15] and GSE36791 [16] datasets. The GSE73378 dataset had a total of 226 samples, of which 210 blood samples including 103 SAH samples and 107 control samples were analyzed in this study. GSE36791 dataset had a total of 61 blood samples including 43 SAH samples and 18 control samples. The platform of these two datasets was GPL10558 Illumina HumanHT-12 V4.0 expression beadchip. The corresponding platform annotation files were downloaded from Ensembl genome browser 96 database. Then, the probes in the two datasets were annotated to lncRNAs, miRNAs, and mRNAs based on the annotation files. Of the two datasets, all the analyses were performed based on GSE73378 dataset, and GSE36791 was used just for validation of the expression and predictive performance of the selected feature RNAs.
2.2 Assessment of differentially expressed RNAs
In GSE73378 dataset, the differentially expressed mRNAs (DEGs), miRNAs (DEMs), and lncRNAs (DELs) from SAH samples and normal samples were analyzed using the limma package (Version 3.34.7) [17] in R 3.6.1 language. The cutoff for differentially expressed RNAs (RNAs) screening was a false discovery rate (FDR) < 0.05 and |log2 FC| > 0.263 (1.2 fold changes). Euclidean distance-based two-way hierarchical clustering analysis [18,19] was performed for the identified DERs using the pheatmap package (Version 1.0.8) [20] in R 3.6.1 language.
2.3 SAH-related DEGs screening and functional enrichment analysis
SAH-associated genes were downloaded from DisGeNET database [21] by term of “subarachnoid hemorrhage.” The SAH-associated genes from DisGeNET database were used as the reference gene sets, gene set enrichment analysis was performed for all genes detected in GSE73378 dataset (genes were ranked by corresponding log FC value) using GSEA software (http://software.broadinstitute.org/gsea/index.jsp) [22] to further identify SAH-associated genes from GSE73378 dataset. Then, the obtained SAH disease-related genes were merged with DEGs, and the overlapped genes were selected as the SAH-related DEGs. The SAH-related DEGs were used to perform Gene Ontology (GO) enrichment analysis (biological process) and Kyoto Encyclopedia of Genes and Genomes (KEGG) analyses with the DAVID online tool (version 6.8) [23,24]. FDR < 0.05 was considered to be significantly enriched.
2.4 Construction of protein–protein interaction (PPI) network
Interactions among the protein-coding genes in SAH-related DEGs were retrieved from the STRING database (Version 11.0) [25] with PPI score of 0.4. PPI network was visualized using Cytoscape software (Version 3.6.1) [26] based on interaction pairs.
2.5 Construction of the drug–gene network
Connectivity Map (CMap) resource was created to connect human diseases with the genes that underlie them and drugs that treat them. CMap is the first installment of a reference collection of gene-expression profiles from cultured human cells treated with small bioactive molecules, for uncovering the functional connections among diseases, genetic perturbation, and drug action [27,28]. The Comparative Toxicogenomics Database (CTD) is a public resource based on published literature, manually curated associations among genes, chemicals, phenotypes, diseases, and environmental exposures [29]. To predict the small molecule drugs that target the SAH-related DEGs, both CMap and CTD were used. First, SAH-related DEGs were searched from CMap database to obtain the drug molecule–gene interactions. Second, the SAH-related DEGs were uploaded to CTD database to obtain the drug molecule–gene interactions. Then, the overlapped drug molecule–gene interactions from the two databases were selected. Finally, the drug–gene network was visualized based on the selected drug molecule–gene interactions using Cytoscape 3.6.1 software.
2.6 Construction of competing endogenous RNA (CeRNA) network
The connection relationship between DELs and DEMs was constructed by the DIANA-LncBase v2 database [30], and the lncRNA–miRNA interactions with negative correlations of their expression level were selected. The DEMs-associated target genes (miRNA–mRNA) were predicted using five miRNA databases including TargetScan Version7.2 [31], picTar [32], miRanda [33], RNA22 [34], and PITA [35]. The miRNA–target gene interaction pairs were selected if they were predicted in more than three databases and were further filtered by SAH-related DEGs. Finally, the ceRNA network was established by integrating lncRNA–miRNA interactions and miRNA–mRNA interactions using Cytoscape 3.6.1 software.
2.7 Screening of optimal RNAs signature
All RNAs (mRNAs, miRNAs, and lncRNAs) contained in these three networks were used to screen characteristic RNAs by two different algorithms: least absolute shrinkage and selection operator (LASSO) and recursive feature elimination (RFE). In brief, R 3.6.1 lars package (Version 1.2, https://cran.r-project.org/web/packages/lars/index.html) [36] was used to perform the regression analysis to screen characteristic RNAs. The RFE algorithm in the R 3.6.1 caret package (Version 6.0-76, https://cran.r-project.org/web/packages/caret) [37] was also used to screen the optimal characteristic RNAs. Then, we compared the results of the two algorithms and selected the overlapping RNAs as the final feature RNAs signature.
2.8 Evaluation and validation of optimal RNAs signature
We first extracted the expression of the optimal feature RNAs from GSE73378 dataset and GSE36791 dataset. Their expression levels in SAH and normal samples were displayed. Afterward, the Support Vector Machine (SVM) from R 3.6.1 e1071 (Version 1.6-8, https://cran.r-project.org/web/packages/e1071) [38] was used to construct the SVM classifier based on the optimal feature RNAs signature (Core: Sigmoid Kernel; Cross: 100-fold cross-validation). Both GSE73378 dataset and GSE36791 dataset were used for classifier construction. Receiver operating characteristic (ROC) curve analysis was performed with R 3.6.1 pROC (Version 1.12.1, https://cran.r-project.org/web/packages/pROC/index.html) [39] to calculate the performance of the SVM classifier for SAH. The R codes used in this study have been provided in an additional file.
3 Results
3.1 Differentially expressed RNAs in SAH
A total of 920 lncRNAs, 351 miRNAs, and 14,898 mRNAs were annotated. Then, 663 differentially expressed RNAs (including 17 DELs, 25 DEMs, and 621 DEGs) were identified based on the cutoff value of |log2 FC| > 0.263 and FDR < 0.05. Of which 228 RNAs were upregulated, and 435 were downregulated (Figure 2a). The pheatmap showed samples could be obviously distinguished into SAH and normal groups based on the differential expression level of DERs (Figure 2b).
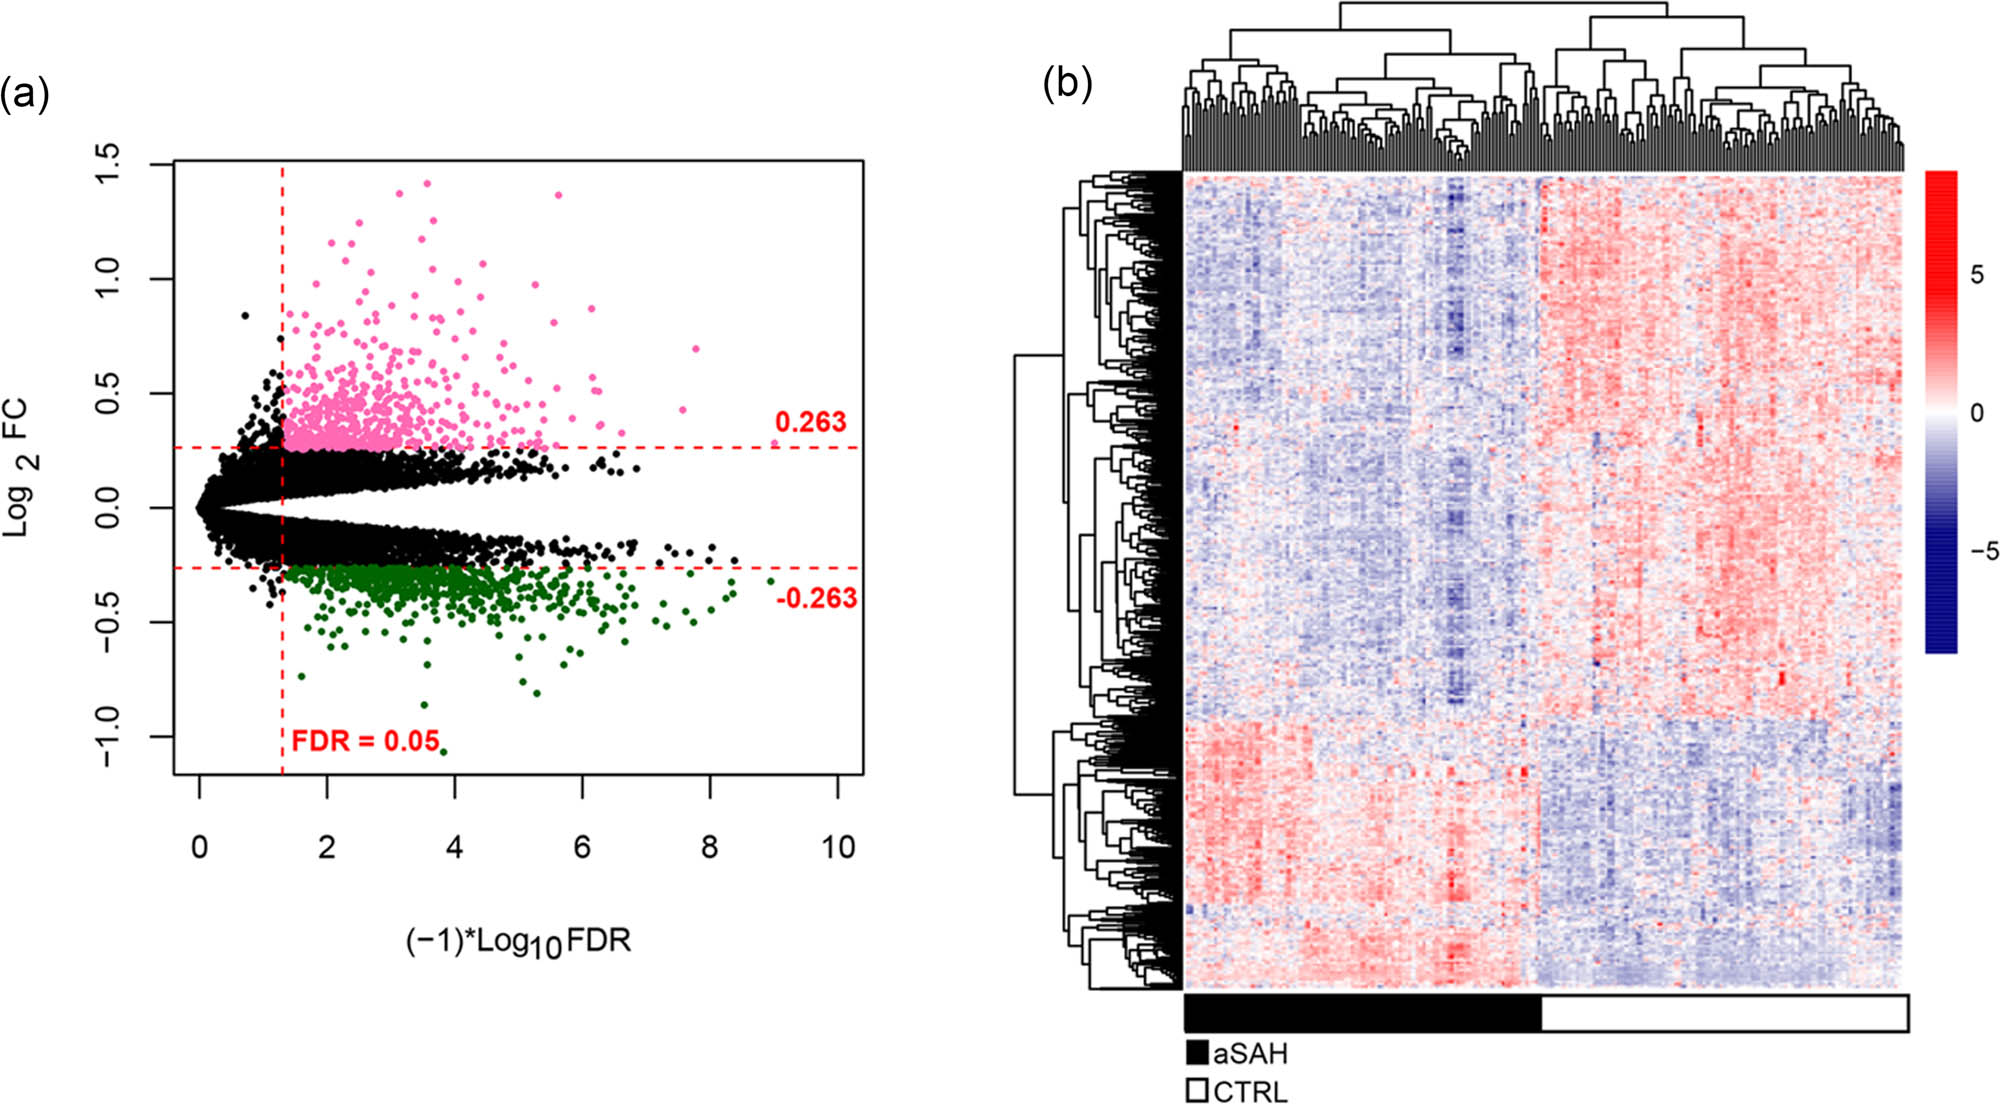
Differentially expressed RNAs analysis. (a) Volcano plot of DERs identified using the edgeR package. Red and green points indicated upregulated and downregulated DERs, respectively (|log2 FC| > 0.263), FC: fold change. (b) Pheatmap of DERs. Black and white color indicated the samples from patients with SAH and controls, respectively.
3.2 SAH-related DEGs identification and function enrichment
From the DisGeNET database, a total of 470 genes associated with SAH were obtained. Then, GSEA was performed for all genes in SAH with the reference gene sets of SAH-associated genes from DisGeNET, and a total of 354 SAH-related genes were obtained (Figure 3a). Next the 354 SAH-related genes were compared with 621 DEGs, and a total of 124 overlapping genes were obtained as SAH-related DEGs. Enrichment analysis showed that these genes were enriched in 106 GO-biological processes, such as GO:0071260 – cellular response to mechanical stimulus, GO:0045944 – positive regulation of transcription from RNA polymerase II promoter, GO:0048661 – positive regulation of smooth muscle cell proliferation, GO:0006954 – inflammatory response, and GO:0001666 – response to hypoxia (Figure 3b). In addition, 43 KEGG pathways were significantly enriched for these genes, including hsa05200: pathways in cancer, hsa04668: TNF signaling pathway, hsa04010: MAPK signaling pathway, hsa04066: HIF-1 signaling pathway, and hsa04068: FoxO signaling pathway (Figure 3c).

Identification of differentially expressed genes related with SAH. (a) Gene set enrichment analysis (GSEA) identified SAH-related genes. (b) The significantly enriched biological processes and (c) KEGG pathways.
3.3 Construction of PPI network
The SAH-related DEGs were entered into the STRING database, and a total of 830 PPI networks were generated. The PPI network, including 118 gene nodes, was constructed as shown in Figure 4a. The first ten hub genes, TNF, AKT1, TP53, MMP9, TLR4, STAT3, IL1B, TLR2, MYC, and CXCR4, were screened with the highest degree.

Networks construction. (a) The PPI network. The change in the color of the node from green to red indicates the change in the degree of significant difference from significantly down to up; the size of the node indicates the degree of connectivity of the node in the network. (b) The ceRNA network. Square, triangle, and circle represent lncRNA, miRNA, and mRNA, respectively. The change in the color of the node from green to red indicated the change in log FC from low to high.
3.4 Construction of the drug–gene network
From CMAP database, a total of 23 chemicals were obtained to target SAH-related DEGs with the threshold of |Pearson R| > 0.75 and P < 0.05. The drug–gene pairs related to these 23 chemicals were further selected from the CTD database, and a total of 22 drug–gene pairs were obtained to establish a drug–gene network (Figure A1, Table A1). The network contained ten upregulated genes, five downregulated genes, and five small molecule drugs (coralyne, alexidine, enilconazole, chrysin, and arachidonyltrifluoromethane). Chrysin was found to target more genes, such as TNF, AKT1, and MMP9.
3.5 CeRNA network construction
Using the DIANA-LncBase v2 database, seven lncRNA–miRNA interactions involving three miRNAs and five lncRNAs with the negative correlation of their expression levels were obtained. Then, the target genes were predicted for 3 miRNAs in lncRNA–miRNA interactions, and then the target genes were filtered by SAH-related DEGs, and a total of 21 pairs of miRNA–mRNA connections were found. The ceRNA network was established via integration with lncRNA–miRNA and miRNA–mRNA interactions (Figure 4b). The ceRNA network comprised 29 nodes, including 5 lncRNAs, 3 miRNAs, and 21 mRNAs. Notably, upregulated JMJD1C-AS1 may function as a ceRNA to suppress the inhibitory effects of hsa-miR-204 on HDAC4 and SIRT1, thus leading to their upregulated expression. Similarly, upregulated MEG3 may regulate the expression of TGFBR3 and GSK3B by binding to hsa-miR-128. In addition, LINC01144 – hsa-miR-128 – ADRB2/TGFBR3 regulatory axis was found. We further performed correlation analysis for lncRNA and their associated mRNAs in ceRNA network (Table A2), and weak positive correlations were found. There was a significant positive correlation between LINC01287 and STAT3 (r = 0.35; p < 0.01), indicating that LINC01287 – hsa-miR-204 – STAT3 was a potential important ceRNA regulatory axis.
3.6 Screening and verification of SAH-related RNAs
LASSO and RFE algorithms were used to screen characteristic RNAs signatures from all RNAs in the three networks. In the training set (GSE73378), a total of 90 RNAs and 52 RNAs were obtained using LASSO and RFE, respectively (Figure 5a and b). Furthermore, a total of 38 overlapping RNAs were obtained as optimal characteristic RNAs signature, including 2 lncRNAs (JMJD1C-AS1 and LINC01144), 1 miRNA (hsa-miR-510), and 35 genes (TLR4, MMP9, ADRB2, TGFBR3, among others) (Table 1). The expression levels of the optimal characteristic RNAs signature in SAH and normal samples are displayed in Figure 6a and b. Only the two lncRNAs, one miRNA, and top ten mRNAs (ranking by log FC) were displayed. In the GSE73378 dataset, all the 13 RNAs were significantly differentially expressed in the SAH sample compared to that of control samples (Figure 6a). While, in the GSE36791 dataset, the two lncRNAs (JMJD1C-AS1 and LINC01144), hsa-miR-510, and mRNAs (KLF4 and TRPM4) showed no statistical difference on their expression levels between SAH and normal samples (Figure 6b).

The optimal RNAs signature screened by the LASSO and RFE algorithms. (a) The standardized coefficients in LASSO algorithm; (b) cross-validation showed best accuracy at the variables of 90 in RFE.
The optimal 38 RNAs signature (including 2 lncRNAs, 1 miRNA, and 35 genes) screened by LASSO and RFE algorithms
| ID | Symbol | Type | Log2 FC | P value | FDR | Regulation (up/down) |
|---|---|---|---|---|---|---|
| ILMN_1677589 | JMJD1C-AS1 | lncRNA | 0.297887125 | 5.10 × 10⁶ | 0.004133736 | Up |
| ILMN_1690382 | LINC01144 | lncRNA | −0.269639525 | 2.14 × 10⁶ | 0.00173673 | Down |
| ILMN_3310690 | hsa-miR-510 | miRNA | −0.28978015 | 5.83 × 10⁶ | 0.004725453 | Down |
| ILMN_1662809 | SETD2 | mRNA | −0.273252525 | 0.000143801 | 0.009318308 | Down |
| ILMN_1666924 | PINK1 | mRNA | 0.349209875 | 0.000468661 | 0.030369229 | Up |
| ILMN_1671054 | HLA-A | mRNA | 0.27793335 | 0.000577726 | 0.037436671 | Up |
| ILMN_1671818 | UTS2 | mRNA | −0.304786475 | 0.000176825 | 0.011458233 | Down |
| ILMN_1677511 | PTGS2 | mRNA | 0.2805209 | 0.000522788 | 0.033876642 | Up |
| ILMN_1677532 | TARDBP | mRNA | −0.3606863 | 9.19 × 10⁵ | 0.005955158 | Down |
| ILMN_1679401 | TRPM4 | mRNA | 0.350872575 | 1.62 × 10⁵ | 0.001051006 | Up |
| ILMN_1680424 | CTSG | mRNA | −0.425172725 | 0.000364996 | 0.023651752 | Down |
| ILMN_1680453 | ITM2C | mRNA | −0.50531015 | 4.88 × 10⁵ | 0.039519664 | Down |
| ILMN_1680618 | MYC | mRNA | 0.2905886 | 0.000607897 | 0.039391751 | Up |
| ILMN_1689734 | IL1RN | mRNA | 0.341397425 | 0.000695521 | 0.045069739 | Up |
| ILMN_1695590 | ADRB2 | mRNA | −0.3777768 | 0.000218822 | 0.014179666 | Down |
| ILMN_1703617 | AHSA1 | mRNA | −0.271606475 | 0.000419963 | 0.027213615 | Down |
| ILMN_1706217 | TLR4 | mRNA | 0.464493425 | 9.57 × 10⁵ | 0.006198665 | Up |
| ILMN_1708934 | ADM | mRNA | 0.772645425 | 1.71 × 10⁵ | 0.013866249 | Up |
| ILMN_1710410 | CHRM3 | mRNA | −0.27857305 | 7.68 × 10⁵ | 0.004974289 | Down |
| ILMN_1715715 | CEBPA | mRNA | −0.304131125 | 0.000418064 | 0.027090539 | Down |
| ILMN_1722622 | CD163 | mRNA | 0.27239935 | 0.000605937 | 0.039264732 | Up |
| ILMN_1728197 | CLDN5 | mRNA | 0.32183615 | 0.000479949 | 0.031100715 | Up |
| ILMN_1729161 | NOTCH1 | mRNA | 0.30529195 | 5.49 × 10⁵ | 0.044479822 | Up |
| ILMN_1734830 | MTHFR | mRNA | −0.28369415 | 3.74 × 10⁵ | 0.03025829 | Down |
| ILMN_1748661 | AKT1 | mRNA | 0.276206975 | 0.000242712 | 0.015727718 | Up |
| ILMN_1760778 | ENG | mRNA | −0.2935118 | 0.000170384 | 0.011040888 | Down |
| ILMN_1779857 | KLF4 | mRNA | 0.374529375 | 0.000160395 | 0.010393626 | Up |
| ILMN_1783889 | PRKAA1 | mRNA | 0.2661743 | 1.77 × 10⁵ | 0.014369739 | Up |
| ILMN_1784287 | TGFBR3 | mRNA | −0.509380675 | 0.0001915 | 0.01240917 | Down |
| ILMN_1787386 | ADAMTS13 | mRNA | 0.2707362 | 4.82 × 10⁵ | 0.003125726 | Up |
| ILMN_1791847 | DAPK2 | mRNA | −0.297182 | 0.000465953 | 0.030193776 | Down |
| ILMN_1796180 | CRY2 | mRNA | −0.294307375 | 4.04 × 10⁶ | 0.003268646 | Down |
| ILMN_1796316 | MMP9 | mRNA | −0.6874905 | 0.000225147 | 0.01458955 | Down |
| ILMN_1800425 | SLC9A1 | mRNA | −0.319644675 | 0.000369868 | 0.023967444 | Down |
| ILMN_1809613 | NGEF | mRNA | −0.28343285 | 9.99 × 10⁵ | 0.006473637 | Down |
| ILMN_1814327 | AGTR1 | mRNA | −0.29794675 | 9.43 × 10⁵ | 0.006112184 | Down |
| ILMN_1815057 | PDGFRB | mRNA | −0.338885 | 3.48 × 10⁵ | 0.002256956 | Down |
| ILMN_2267914 | CD68 | mRNA | −0.305515875 | 0.000622021 | 0.040306975 | Down |

Screening and verification of SAH-related RNAs. The expression of SAH-related RNAs in the (a) GSE73378 and (b) GSE36791 datasets. *P < 0.05; 0.005 <**P < 0.05; ***P < 0.005. ROC curves for SVM classifier constructed by 38 RNAs in the (c) GSE73378 and (d) GSE36791 datasets, respectively.
To validate the diagnostic ability of the optimal characteristic RNAs signature, the SVM classifier were constructed in GSE73378 dataset, which showed well predictive value for SAH patients with an AUC of 0.990 (Figure 6c). The predictive value of these optimal characteristic RNAs signature was further validated in an external independent dataset (GSE36791). The SVM classifier still showed better performance with an AUC of 0.845 (Figure 6d). The results showed that the RNAs had a robust and stable predictive ability for SAH.
4 Discussion
This study aimed to discover effective diagnosis biomarkers for SAH by the analysis of sequencing data, which have the potential to guide future clinical and basic medical studies. In the present research, we first identified 621 DEGs, of which 124 SAH-related DEGs were obtained using DisGeNET and GSEA. These genes were enriched in the inflammatory response, cellular response to mechanical stimulus, TNF signaling pathway, and cancer-related pathways. Increasing studies have revealed that IA is closely related to the inflammatory response [40,41]. Moreover, inflammation and immune response have also been found to potentially contribute to the formation of IA [42]. Among these pathways associated with SAH, some studies have also confirmed the role of the TNF signaling pathway in diseases including SAH. The potential of TNF-α inhibitors has been reported to impact the pathogenesis of aneurismal SAH, and the TNF-α signaling pathway has been found to play an important role in the pathogenesis of SAH [43]. In IAs, TNF-α was up-expressed in wall tissues and associated with the type and diameter of the aneurysm [44]. According to these studies, we speculated that the TNF signaling pathway was implicated in SAH development.
PPI network for SAH-related DEGs showed that TNF, MMP9, and TLR4 were hub genes. It has been reported that venous levels of TNF-R1 were associated with poor outcomes at 6 months for SAH [45], and down-regulating TNF-α can inhibit the formation of IAs in vivo [44]. Thus, decreasing TNF expression may have the potential to inhibit SAH. MMP9 was found to be associated with TLR4 signaling activation, and downregulating MMP9 induced by LPS has a neuroprotective effect on brain injury caused by SAH [46]. In addition, TLR4 is a key player in the regulation of inflammation, and it has been found to be correlated with poor prognosis in SAH [47]. Our present results also confirmed that TLR4 was up-expressed in SAH. Subsequently, by constructing a ceRNA network, it was suggested that the downregulated lncRNA MEG3 may be particularly important for SAH, as it may function as a ceRNA for upregulating hsa-miR-128 expression, thus leading to the downregulation of ADRB2 and TGFBR3. Previous studies have shown that MEG3 is highly expressed in SAH, and MEG3 may promote SAH-induced neuronal cell injury by inhibiting the PI3K/AKT signaling pathway [48]. However, MEG3 has also been found to promote platelet phagocytosis by decreasing miR-128 expression to protect VECs from senescence [49]. To the best of our knowledge, the regulatory mechanisms of MEG3 in SAH need further experimental confirmation. Furthermore, TGFBR3 is involved in the activation of the TGF-β signaling pathway, and TGFBR3 is downregulated in pancreatic ductal adenocarcinoma cells [50]. In present data, TGFBR3 was downregulated in SAH, and overexpression of TGRBR3 may be an important therapeutic target in SAH treatment.
We identified 38 optimal characteristic RNAs signatures from the RNAs in these networks, which were used to construct the SVM classifier. The results of ROC curves investigated that these RNAs (such as JMJD1C-AS1, LINC01144, hsa-miR-510, TLR4, ADRB2, TGFBR3, and so on) were potential biomarkers for predicting SAH. MiR-510 has been reported to be significantly downregulated in ovarian serous carcinoma (OSC), and it is a novel candidate biomarker for predicting the symptoms of OSC [51]. However, the role of miR-510 and lncRNAs, JMJD1C-AS1 and LINC01144, in SAH has not been reported. LINC01144-hsa-miR-128-ADRB2/TGFBR3 regulatory axis was found from our ceRNA network, LINC01144 may play a role in SAH by regulating ADRB2 and TGFBR3 expression. ADRB2 encodes adrenoceptor beta 2. Adrenoceptor polymorphisms are associated with an increased risk of cardiac abnormalities after SAH [52], β-adrenoceptor antagonists have been found to suppress the elevation of IL-6 after SAH in rats [53]. TGFBR3 is a transforming growth factor (TGF) beta receptor. TGF-β1/Smad/CTGF pathway was inhibited by rhDecorin to prevent development of hydrocephalus after SAH [54]. Knockdown of TGF-β1 in human umbilical cord-derived mesenchymal stem cells could attenuate SAH-induced chronic hydrocephalus, upregulation of inflammatory cytokines, and other behavioral changes [55]. Considering the important role of ADRB2 and TGFBR3 in SAH, we speculated that LINC01144 was involved in the development of SAH. However, elucidation of the roles of these lncRNAs associated with the screening and prevention of patients with SAH requires further investigation.
We suggested that these identified RNA biomarkers could help doctors to predict the risk of SAH and intervene as soon as possible. Although the feature RNAs were identified just based on the GSE73378 dataset, these feature RNAs still showed well predictive performance in another dataset with different inclusion criteria for patients (patients had the last episode of aneurysmal SAH at least two years in GSE73378 dataset, while this is not mentioned in GSE36791 dataset), which further indicated the stability and reliability of feature RNAs in predicting risk of SAH. Additionally, though the expression and predictive value of these feature RNAs have been validated using another external independent dataset (GSE36791), experimental verification is still indispensable in the future. In addition, the clinical value of these biomarkers should be further confirmed.
5 Conclusion
In summary, gene expression profile analysis revealed a large scale of expression pattern changes in RNAs under the pathophysiology of SAH, and they were mainly implicated in the inflammatory response, TNF signaling pathway. We further identified 38 RNAs, including 2 lncRNAs (JMJD1C-AS1 and LINC01144), 1 miRNA (hsa-miR-510), and 35 genes (TLR4, ADRB2, TGFBR3, among others) as potential blood biomarkers for screening patients with SAH. This 38 RNAs signature had a better predictive performance for SAH risk. LINC01144 might regulate ADRB2/TGFBR3 expression by sponging hsa-miR-128. These findings of the present study contributed to understanding the molecular mechanism of SAH deeply and also provided the potential biomarkers for the screening and prevention of SAH. However, their application values should be further validated in clinical.
-
Funding information: The authors state no funding involved.
-
Conflict of interest: The authors state no conflict of interest.
-
Data availability statement: The datasets generated during and/or analyzed during the current study are available from the corresponding author on reasonable request.
Appendix
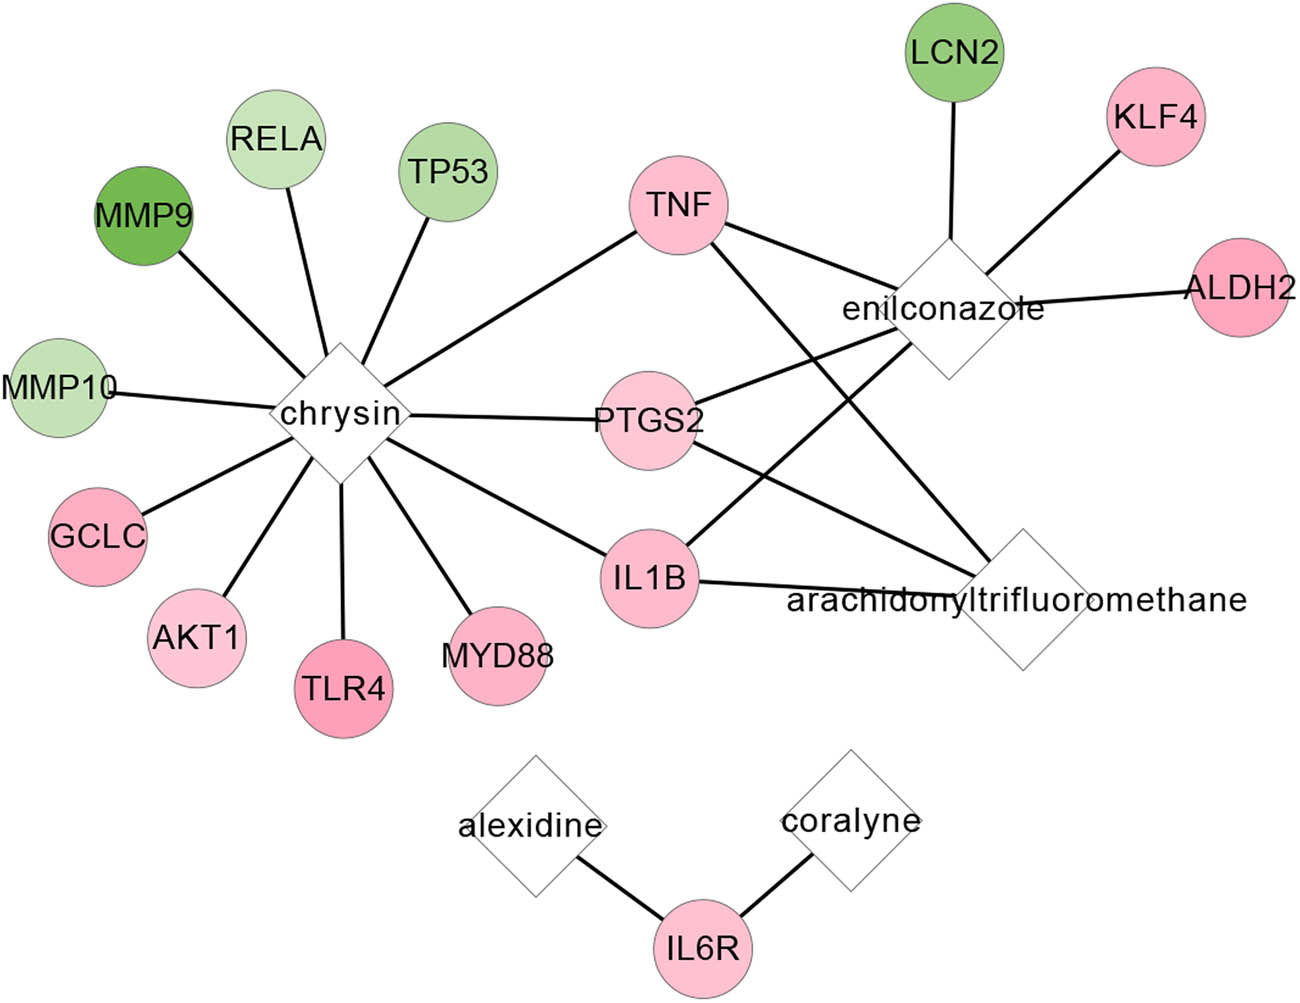
The drug–gene network. Circles and diamonds represent genes and chemicals, respectively. Red color represented the upregulated gene, and green represented a downregulated gene.
The detailed information for the predicted drug–gene interactions
| # Chemical name | Gene symbol | Chemical ID | Gene ID | Organism | Organism ID | Interaction | Interaction actions | PubMed IDs |
|---|---|---|---|---|---|---|---|---|
| Coralyne | IL6R | C000666 | 3570 | Homo sapiens | 9606 | Coralyne results in decreased expression of IL6R protein modified form | Decreases expression | 20116850 |
| Alexidine | IL6R | C001570 | 3570 | Homo sapiens | 9606 | Alexidine results in decreased expression of IL6R protein modified form | Decreases expression | 20116850 |
| Enilconazole | ALDH2 | C017435 | 217 | Homo sapiens | 9606 | Enilconazole results in decreased expression of ALDH2 mRNA | Decreases expression | 32201337 |
| Enilconazole | IL1B | C017435 | 3553 | Mus musculus | 10090 | Enilconazole results in increased expression of IL1B mRNA | Increases expression | 27393971 |
| Enilconazole | KLF4 | C017435 | 9314 | Mus musculus | 10090 | Enilconazole affects the expression of KLF4 mRNA | Affects expression | 29106682 |
| Enilconazole | LCN2 | C017435 | 3934 | Mus musculus | 10090 | Enilconazole results in increased expression of LCN2 | Increases expression | 27393971 |
| Enilconazole | PTGS2 | C017435 | 5743 | Mus musculus | 10090 | Enilconazole binds to and results in decreased activity of PTGS2 protein which results in decreased chemical synthesis of and results in decreased secretion of Prostaglandin D2 | Affects binding|decreases activity|decreases chemical synthesis|decreases secretion | 26359731 |
| Enilconazole | TNF | C017435 | 7124 | Mus musculus | 10090 | Enilconazole results in increased expression of TNF mRNA | Increases expression | 27393971 |
| Chrysin | AKT1 | C043561 | 207 | Homo sapiens | 9606 | Chrysin inhibits the reaction [AKT1 protein results in increased expression of MMP10 protein] | Decreases reaction|increases expression | 24122885 |
| Chrysin | GCLC | C043561 | 2729 | Rattus norvegicus | 10116 | Chrysin dose-dependently up-regulated the protein expression of glutamate cysteine ligase (GCL) catalytic (GCLC) and modifier subunit (GCLM) | Affects binding|decreases activity|decreases reaction|increases chemical synthesis | 22864849 |
| Chrysin | IL1B | C043561 | 3553 | Homo sapiens | 9606 | Chrysin inhibits the reaction [nickel chloride results in increased expression of IL1B protein] | Decreases reaction|increases expression | 30016632 |
| Chrysin | MMP10 | C043561 | 4319 | Homo sapiens | 9606 | Chrysin inhibits the reaction [AKT1 protein results in increased expression of MMP10 protein] | Decreases reaction|increases expression | 24122885 |
| Chrysin | MMP9 | C043561 | 4318 | Homo sapiens | 9606 | Chrysin inhibits the reaction [nickel chloride results in increased expression of and results in increased activity of MMP9 protein] | Decreases reaction|increases activity|increases expression | 30016632 |
| Chrysin | MYD88 | C043561 | 4615 | Homo sapiens | 9606 | Chrysin inhibits the reaction [nickel chloride results in increased expression of MYD88 mRNA] | Decreases reaction|increases expression | 30016632 |
| Chrysin | PTGS2 | C043561 | 5743 | Rattus norvegicus | 10116 | Chrysin inhibits the reaction [Freund’s Adjuvant results in increased expression of PTGS2 protein] | Decreases reaction|increases expression | 24932515 |
| Chrysin | RELA | C043561 | 5970 | Homo sapiens | 9606 | Chrysin results in decreased expression of RELA protein | Decreases expression | 30578657 |
| Chrysin | TLR4 | C043561 | 7099 | Rattus norvegicus | 10116 | Chrysin inhibits the reaction [Thioacetamide results in increased expression of TLR4 mRNA] | Decreases reaction|increases expression | 30500344 |
| Chrysin | TNF | C043561 | 7124 | Rattus norvegicus | 10116 | Silymarin promotes the reaction (chrysin inhibits the reaction [Acetaminophen results in increased expression of TNF protein]) | Decreases reaction|increases expression|increases reaction | 31625388 |
| Chrysin | TP53 | C043561 | 7157 | Rattus norvegicus | 10116 | Chrysin inhibits the reaction [Testosterone results in decreased expression of TP53 mRNA] | Decreases expression|decreases reaction | 29247772 |
| Arachidonyltrifluoromethane | IL1B | C081565 | 3553 | Homo sapiens | 9606 | Arachidonyltrifluoromethane inhibits the reaction (NAD inhibits the reaction [3′-O-(4-benzoyl)benzoyladenosine 5’-triphosphate results in increased secretion of IL1B protein]) | Decreases reaction|increases secretion | 29642561 |
| Arachidonyltrifluoromethane | PTGS2 | C081565 | 5743 | Mus musculus | 10090 | Arachidonyltrifluoromethane inhibits the reaction [tetrachlorodibenzodioxin results in increased activity of PTGS2 protein] | Decreases reaction|increases activity | 19063610 |
| Arachidonyltrifluoromethane | TNF | C081565 | 7124 | Homo sapiens | 9606 | Arachidonyltrifluoromethane inhibits the reaction [TNF protein results in increased expression of SOD2] | Decreases reaction|increases expression | 11264281 |
Correlation analysis results for lncRNA and their associated mRNAs in ceRNA network
| DElncRNA | DEmRNA | P value | Cor |
|---|---|---|---|
| LINC01287 | STAT3 | 0.002185022 | 0.346095443 |
| LINC01144 | RABGEF1 | 0.01566732 | 0.076406814 |
| MEG3 | ENO2 | 0.035022817 | 0.0051276 |
| LINC00305 | DENR | 0.07519792 | 0.171671465 |
| LINC01144 | GORASP1 | 0.103475631 | 0.012136242 |
| MEG3 | GSK3B | 0.115897555 | 0.22090058 |
| JMJD1C-AS1 | HDAC4 | 0.132741279 | 0.146195814 |
| LINC01287 | CXCR4 | 0.147614043 | 0.146372974 |
| LINC01144 | SETD2 | 0.154924645 | 0.031606782 |
| LINC00305 | CD44 | 0.16762594 | 0.030003851 |
| MEG3 | MNT | 0.194071109 | 0.17576912 |
| LINC00305 | RPS6KA5 | 0.29245268 | 0.015048382 |
| LINC00305 | TXNIP | 0.412733498 | 0.015264142 |
| MEG3 | GORASP1 | 0.414505273 | 0.214254126 |
| JMJD1C-AS1 | CXCR4 | 0.425698672 | 0.192223608 |
| MEG3 | ADRB2 | 0.439984979 | 0.254273266 |
| JMJD1C-AS1 | BIRC2 | 0.472841434 | 0.170991838 |
| LINC00305 | SIRT1 | 0.538544746 | 0.00332312 |
| JMJD1C-AS1 | STAT3 | 0.554945082 | 0.086126879 |
| JMJD1C-AS1 | HIF1A | 0.695596063 | 0.035741985 |
| MEG3 | RABGEF1 | 0.708916655 | 0.175062031 |
| LINC00305 | CXCR4 | 0.746472986 | 0.199083358 |
| LINC00305 | TGFBR2 | 0.759578309 | 0.038602594 |
| LINC00305 | BIRC2 | 0.8264802 | 0.066127226 |
| MEG3 | TGFBR3 | 0.862145773 | 0.160751671 |
References
[1] Carpenter CR, Hussain AM, Ward MJ, Zipfel GJ, Fowler S, Pines JM, et al. Spontaneous subarachnoid hemorrhage: a systematic review and meta-analysis describing the diagnostic accuracy of history, physical examination, imaging, and lumbar puncture with an exploration of test thresholds. Academic Emerg Med Off J Soc Academic Emerg Med. 2016;23(9):963–1003.10.1111/acem.12984Search in Google Scholar
[2] Bederson JB, Connolly Jr. ES, Batjer HH, Dacey RG, Dion JE, Diringer MN, et al. Guidelines for the management of aneurysmal subarachnoid hemorrhage: a statement for healthcare professionals from a special writing group of the Stroke council, American Heart Association. Stroke. 2009;40(3):994–1025.10.1161/STROKEAHA.108.191395Search in Google Scholar
[3] Wang Q, Luo Q, Yang Z, Zhao YH, Li J, Wang J, et al. Weighted gene co-expression network analysis identified six hub genes associated with rupture of intracranial aneurysms. PLoS One. 2020;15(2):e0229308.10.1371/journal.pone.0229308Search in Google Scholar
[4] Nieuwkamp DJ, Setz LE, Algra A, Linn FH, de Rooij NK, Rinkel GJ. Changes in case fatality of aneurysmal subarachnoid haemorrhage over time, according to age, sex, and region: a meta-analysis. Lancet Neurol. 2009;8(7):635–42.10.1016/S1474-4422(09)70126-7Search in Google Scholar
[5] Korja M, Silventoinen K, McCarron P, Zdravkovic S, Skytthe A, Haapanen A, et al. Genetic epidemiology of spontaneous subarachnoid hemorrhage: Nordic twin study. Stroke. 2010;41(11):2458–62.10.1161/STROKEAHA.110.586420Search in Google Scholar PubMed
[6] Skodvin T, Evju Ø, Sorteberg A, Isaksen JG. Prerupture intracranial aneurysm morphology in predicting risk of rupture: a matched case-control study. Neurosurgery. 2019;84(1):132–40.10.1093/neuros/nyy010Search in Google Scholar PubMed
[7] Rivero-Arias O, Gray A, Wolstenholme J. Burden of disease and costs of aneurysmal subarachnoid haemorrhage (aSAH) in the United Kingdom. Cost Effectiveness Resour Allocat C/E. 2010;8(1):1–2.10.1186/1478-7547-8-6Search in Google Scholar PubMed PubMed Central
[8] Wang J, Wang Y, Kong F, Han R, Song W, Chen D, et al. Identification of a six-gene prognostic signature for oral squamous cell carcinoma. J Cell Physiol. 2020;235(3):3056–68.10.1002/jcp.29210Search in Google Scholar PubMed
[9] Zhang X, Wang W, Zhu W, Dong J, Cheng Y, Yin Z, et al. Mechanisms and functions of long non-coding RNAs at multiple regulatory levels. Int J Mol Sci. 2019;20(22):5573.10.3390/ijms20225573Search in Google Scholar PubMed PubMed Central
[10] Huang F, Yi J, Zhou T, Gong X, Jiang H, Yao X. Toward understanding non-coding RNA roles in intracranial aneurysms and subarachnoid hemorrhage. Transl Neurosci. 2017;8:54–64.10.1515/tnsci-2017-0010Search in Google Scholar PubMed PubMed Central
[11] Gareev I, Beylerli O, Aliev G, Pavlov V, Izmailov A, Zhang Y, et al. The role of long non-coding RNAs in intracranial aneurysms and subarachnoid hemorrhage. Life (Basel, Switzerland). 2020;10(9):155.10.3390/life10090155Search in Google Scholar PubMed PubMed Central
[12] Ouyang Y, Jiang Y, Yu M, Zhang M, Tan Z. Upregulation of MALAT1 expression predicts a poor prognosis in the development of intracranial aneurysm (IA). Int J Clin Exp Pathol. 2017;10(5):5907–12.Search in Google Scholar
[13] Li P, Zhang Q, Wu X, Yang X, Zhang Y, Li Y, et al. Circulating microRNAs serve as novel biological markers for intracranial aneurysms. J Am Heart Assoc. 2014;3(5):e000972.10.1161/JAHA.114.000972Search in Google Scholar PubMed PubMed Central
[14] Przybycien-Szymanska MM, Ashley Jr. WW. Biomarker discovery in cerebral vasospasm after aneurysmal subarachnoid hemorrhage. J Stroke Cerebrovasc Diseases Off J Natl Stroke Assoc. 2015;24(7):1453–64.10.1016/j.jstrokecerebrovasdis.2015.03.047Search in Google Scholar PubMed
[15] van’t Hof FN, Ruigrok YM, Medic J, Sanjabi B, van der Vlies P, Rinkel GJ, et al. Whole blood gene expression profiles of patients with a past aneurysmal subarachnoid hemorrhage. PLoS One. 2015;10(10):e0139352.10.1371/journal.pone.0139352Search in Google Scholar PubMed PubMed Central
[16] Pera J, Korostynski M, Golda S, Piechota M, Dzbek J, Krzyszkowski T, et al. Gene expression profiling of blood in ruptured intracranial aneurysms: in search of biomarkers. J Cereb Blood Flow Metab Off J Int Soc Cereb Blood Flow Metabolism. 2013;33(7):1025–31.10.1038/jcbfm.2013.37Search in Google Scholar PubMed PubMed Central
[17] Ritchie ME, Phipson B, Wu D, Hu Y, Law CW, Shi W, et al. limma powers differential expression analyses for RNA-sequencing and microarray studies. Nucleic Acids Res. 2015;43(7):e47.10.1093/nar/gkv007Search in Google Scholar PubMed PubMed Central
[18] Szekely GJ, Rizzo ML. Hierarchical clustering via joint between-within distances: extending ward’s minimum variance method. J Classification. 2005;22(2):151–83.10.1007/s00357-005-0012-9Search in Google Scholar
[19] Oh SJ, Joung JG, Chang JH, Zhang BT. Construction of phylogenetic trees by kernel-based comparative analysis of metabolic networks. BMC Bioinform. 2006;7:284.10.1186/1471-2105-7-284Search in Google Scholar PubMed PubMed Central
[20] Wang L, Cao C, Ma Q, Zeng Q, Wang H, Cheng Z, et al. RNA-seq analyses of multiple meristems of soybean: novel and alternative transcripts, evolutionary and functional implications. BMC Plant Biol. 2014;14:169.10.1186/1471-2229-14-169Search in Google Scholar PubMed PubMed Central
[21] Piñero J, Bravo À, Queralt-Rosinach N, Gutiérrez-Sacristán A, Deu-Pons J, Centeno E, et al. DisGeNET: a comprehensive platform integrating information on human disease-associated genes and variants. Nucleic Acids Res. 2017;45(D1):D833–9.10.1093/nar/gkw943Search in Google Scholar PubMed PubMed Central
[22] Subramanian A, Tamayo P, Mootha VK, Mukherjee S, Ebert BL, Gillette MA, et al. Gene set enrichment analysis: a knowledge-based approach for interpreting genome-wide expression profiles. Proc Natl Acad Sci U S Am. 2005;102(43):15545–50.10.1073/pnas.0506580102Search in Google Scholar PubMed PubMed Central
[23] Huang da W, Sherman BT, Lempicki RA. Systematic and integrative analysis of large gene lists using DAVID bioinformatics resources. Nat Protoc. 2009;4(1):44–57.10.1038/nprot.2008.211Search in Google Scholar PubMed
[24] Huang da W, Sherman BT, Lempicki RA. Bioinformatics enrichment tools: paths toward the comprehensive functional analysis of large gene lists. Nucleic Acids Res. 2009;37(1):1–13.10.1093/nar/gkn923Search in Google Scholar PubMed PubMed Central
[25] Szklarczyk D, Morris JH, Cook H, Kuhn M, Wyder S, Simonovic M, et al. The STRING database in 2017: quality-controlled protein–protein association networks, made broadly accessible. Nucleic Acids Res. 2017;45(D1):D362–d8.10.1093/nar/gkw937Search in Google Scholar PubMed PubMed Central
[26] Shannon P, Markiel A, Ozier O, Baliga NS, Wang JT, Ramage D, et al. Cytoscape: a software environment for integrated models of biomolecular interaction networks. Genome Res. 2003;13(11):2498–504.10.1101/gr.1239303Search in Google Scholar PubMed PubMed Central
[27] Lamb J, Crawford ED, Peck D, Modell JW, Blat IC, Wrobel MJ, et al. The connectivity map: using gene-expression signatures to connect small molecules, genes, and disease. Sci (N York, NY). 2006;313(5795):1929–35.10.1126/science.1132939Search in Google Scholar PubMed
[28] Lamb J. The connectivity map: a new tool for biomedical research. Nat Rev Cancer. 2007;7(1):54–60.10.1038/nrc2044Search in Google Scholar PubMed
[29] Davis AP, Wiegers TC, Grondin CJ, Johnson RJ, Sciaky D, Wiegers J, et al. Leveraging the comparative toxicogenomics database to fill in knowledge gaps for environmental health: a test case for air pollution-induced cardiovascular disease. Toxicol Sci Off J Soc Toxicol. 2020;177(2):392–404.10.1093/toxsci/kfaa113Search in Google Scholar PubMed PubMed Central
[30] Paraskevopoulou MD, Vlachos IS, Karagkouni D, Georgakilas G, Kanellos I, Vergoulis T, et al. DIANA-LncBase v2: indexing microRNA targets on non-coding transcripts. Nucleic Acids Res. 2016;44(D1):D231–8.10.1093/nar/gkv1270Search in Google Scholar PubMed PubMed Central
[31] Agarwal V, Bell GW, Nam JW, Bartel DP. Predicting effective microRNA target sites in mammalian mRNAs. eLife. 2015;4:e05005.10.7554/eLife.05005Search in Google Scholar PubMed PubMed Central
[32] Lu T, Chen S, Qu L, Wang Y, Chen HD, He C. Identification of a five-miRNA signature predicting survival in cutaneous melanoma cancer patients. PeerJ. 2019;7:e7831.10.7717/peerj.7831Search in Google Scholar PubMed PubMed Central
[33] Deng Z, Wang Y, Fang X, Yan F, Pan H, Gu L, et al. Research on miRNA-195 and target gene CDK6 in oral verrucous carcinoma. Cancer Gene Ther. 2017;24(7):282–8.10.1038/cgt.2017.18Search in Google Scholar PubMed
[34] Loher P, Rigoutsos I. Interactive exploration of RNA22 microRNA target predictions. Bioinforma (Oxford, Engl). 2012;28(24):3322–3.10.1093/bioinformatics/bts615Search in Google Scholar PubMed
[35] Chen B, Liu B. miRNA-381 inhibits the invasion of renal carcinoma and the underlying mechanisms. J Cent South Univ Med Sci. 2015;40(10):1053–9.Search in Google Scholar
[36] Efron B, Hastie T, Johnstone I, Tibshirani R. Least angle regression (with discussions). Ann Stat. 2004;32(2):409–99.10.1214/009053604000000067Search in Google Scholar
[37] Kuhn. M. Building predictive models in R using the caret package. J Stat Softw. 2008;28:1–26.10.18637/jss.v028.i05Search in Google Scholar
[38] Meyer D. Support vector machines: the interface to libsvm in package e1071. R N. 2013;1:1–3.Search in Google Scholar
[39] Robin X, Turck N, Hainard A, Tiberti N, Lisacek F, Sanchez JC, et al. pROC: an open-source package for R and S + to analyze and compare ROC curves. BMC Bioinforma. 2011;12:77.10.1186/1471-2105-12-77Search in Google Scholar PubMed PubMed Central
[40] Kleinloog R, Verweij BH, van der Vlies P, Deelen P, Swertz MA, de Muynck L, et al. RNA sequencing analysis of intracranial aneurysm walls reveals involvement of lysosomes and immunoglobulins in rupture. Stroke. 2016;47(5):1286–93.10.1161/STROKEAHA.116.012541Search in Google Scholar PubMed
[41] Pera J, Korostynski M, Krzyszkowski T, Czopek J, Slowik A, Dziedzic T, et al. Gene expression profiles in human ruptured and unruptured intracranial aneurysms: what is the role of inflammation? Stroke. 2010;41(2):224–31.10.1161/STROKEAHA.109.562009Search in Google Scholar PubMed
[42] Xu Z, Li H, Song J, Han B, Wang Z, Cao Y, et al. Meta-analysis of microarray-based expression profiles to identify differentially expressed genes in intracranial aneurysms. World Neurosurg. 2017;97:661–8.10.1016/j.wneu.2016.10.093Search in Google Scholar PubMed
[43] Young AM, Karri SK, You W, Ogilvy CS. Specific TNF-alpha inhibition in cerebral aneurysm formation and subarachnoid hemorrhage. Curr Drug Saf. 2012;7(3):190–6.10.2174/157488612803251315Search in Google Scholar PubMed
[44] Fan W, Liu Y, Li C, Qu X, Zheng G, Zhang Q, et al. microRNA-331-3p maintains the contractile type of vascular smooth muscle cells by regulating TNF-α and CD14 in intracranial aneurysm. Neuropharmacology. 2020;164:107858.10.1016/j.neuropharm.2019.107858Search in Google Scholar PubMed
[45] Fragata I, Bustamante A, Penalba A, Ferreira P, Nunes AP, Canhão P, et al. TNF-R1 correlates with cerebral perfusion and acute Ischemia following subarachnoid hemorrhage. Neurocritical Care. 2020;33(3):679–87.10.1007/s12028-020-01082-3Search in Google Scholar PubMed
[46] Wang WW, Chen B, Lei CB, Liu GX, Wang YG, Yi C, et al. miR-582-5p inhibits invasion and migration of salivary adenoid cystic carcinoma cells by targeting FOXC1. Jpn J Clin Oncol. 2017;47(8):690–8.10.1093/jjco/hyx073Search in Google Scholar PubMed
[47] Ma C, Zhou W, Yan Z, Qu M, Bu X. Toll-like receptor 4 (TLR4) is correlated with delayed cerebral ischemia (DCI) and poor prognosis in aneurysmal subarachnoid hemorrhage. J Neurological Sci. 2015;359(1–2):67–71.10.1016/j.jns.2015.10.018Search in Google Scholar PubMed
[48] Liang Z, Chi YJ, Lin GQ, Xiao LF, Su GL, Yang LM. LncRNA MEG3 participates in neuronal cell injury induced by subarachnoid hemorrhage via inhibiting the Pi3k/Akt pathway. Eur Rev Med Pharmacol Sci. 2018;22(9):2824–31.Search in Google Scholar
[49] Lan Y, Li YJ, Li DJ, Li P, Wang JY, Diao YP, et al. Long non-coding RNA MEG3 prevents vascular endothelial cell senescence by impairing miR-128-dependent Girdin downregulation. Am J Physiol Cell Physiol. 2019;316(6):C830–43.10.1152/ajpcell.00262.2018Search in Google Scholar PubMed
[50] Yin Z, Ma T, Huang B, Lin L, Zhou Y, Yan J, et al. Macrophage-derived exosomal microRNA-501-3p promotes progression of pancreatic ductal adenocarcinoma through the TGFBR3-mediated TGF-β signaling pathway. J Exp Clin Cancer Res CR. 2019;38(1):310.10.1186/s13046-019-1313-xSearch in Google Scholar PubMed PubMed Central
[51] Yu X, Zhang X, Bi T, Ding Y, Zhao J, Wang C, et al. MiRNA expression signature for potentially predicting the prognosis of ovarian serous carcinoma. Tumour Biol J Int Soc Oncodev Biol Med. 2013;34(6):3501–8.10.1007/s13277-013-0928-3Search in Google Scholar PubMed
[52] Zaroff JG, Pawlikowska L, Miss JC, Yarlagadda S, Ha C, Achrol A, et al. Adrenoceptor polymorphisms and the risk of cardiac injury and dysfunction after subarachnoid hemorrhage. Stroke. 2006;37(7):1680–5.10.1161/01.STR.0000226461.52423.ddSearch in Google Scholar PubMed PubMed Central
[53] Kato H, Kawaguchi M, Inoue S, Hirai K, Furuya H. The effects of beta-adrenoceptor antagonists on proinflammatory cytokine concentrations after subarachnoid hemorrhage in rats. Anesthesia Analgesia. 2009;108(1):288–95.10.1213/ane.0b013e318187bb93Search in Google Scholar PubMed
[54] Yan H, Chen Y, Li L, Jiang J, Wu G, Zuo Y, et al. Decorin alleviated chronic hydrocephalus via inhibiting TGF-β1/Smad/CTGF pathway after subarachnoid hemorrhage in rats. Brain Res. 2016;1630:241–53.10.1016/j.brainres.2015.11.004Search in Google Scholar PubMed
[55] Chen H, Chen L, Xie D, Niu J. Protective effects of transforming growth factor-β1 knockdown in human umbilical cord mesenchymal stem cells against subarachnoid hemorrhage in a rat model. Cerebrovascular Diseases (Basel, Switzerland). 2020;49(1):79–87.10.1159/000505311Search in Google Scholar PubMed
© 2021 Yifei Weng, published by De Gruyter
This work is licensed under the Creative Commons Attribution 4.0 International License.
Articles in the same Issue
- Biomedical Sciences
- Research progress on the mechanism of orexin in pain regulation in different brain regions
- Adriamycin-resistant cells are significantly less fit than adriamycin-sensitive cells in cervical cancer
- Exogenous spermidine affects polyamine metabolism in the mouse hypothalamus
- Iris metastasis of diffuse large B-cell lymphoma misdiagnosed as primary angle-closure glaucoma: A case report and review of the literature
- LncRNA PVT1 promotes cervical cancer progression by sponging miR-503 to upregulate ARL2 expression
- Two new inflammatory markers related to the CURB-65 score for disease severity in patients with community-acquired pneumonia: The hypersensitive C-reactive protein to albumin ratio and fibrinogen to albumin ratio
- Circ_0091579 enhances the malignancy of hepatocellular carcinoma via miR-1287/PDK2 axis
- Silencing XIST mitigated lipopolysaccharide (LPS)-induced inflammatory injury in human lung fibroblast WI-38 cells through modulating miR-30b-5p/CCL16 axis and TLR4/NF-κB signaling pathway
- Protocatechuic acid attenuates cerebral aneurysm formation and progression by inhibiting TNF-alpha/Nrf-2/NF-kB-mediated inflammatory mechanisms in experimental rats
- ABCB1 polymorphism in clopidogrel-treated Montenegrin patients
- Metabolic profiling of fatty acids in Tripterygium wilfordii multiglucoside- and triptolide-induced liver-injured rats
- miR-338-3p inhibits cell growth, invasion, and EMT process in neuroblastoma through targeting MMP-2
- Verification of neuroprotective effects of alpha-lipoic acid on chronic neuropathic pain in a chronic constriction injury rat model
- Circ_WWC3 overexpression decelerates the progression of osteosarcoma by regulating miR-421/PDE7B axis
- Knockdown of TUG1 rescues cardiomyocyte hypertrophy through targeting the miR-497/MEF2C axis
- MiR-146b-3p protects against AR42J cell injury in cerulein-induced acute pancreatitis model through targeting Anxa2
- miR-299-3p suppresses cell progression and induces apoptosis by downregulating PAX3 in gastric cancer
- Diabetes and COVID-19
- Discovery of novel potential KIT inhibitors for the treatment of gastrointestinal stromal tumor
- TEAD4 is a novel independent predictor of prognosis in LGG patients with IDH mutation
- circTLK1 facilitates the proliferation and metastasis of renal cell carcinoma by regulating miR-495-3p/CBL axis
- microRNA-9-5p protects liver sinusoidal endothelial cell against oxygen glucose deprivation/reperfusion injury
- Long noncoding RNA TUG1 regulates degradation of chondrocyte extracellular matrix via miR-320c/MMP-13 axis in osteoarthritis
- Duodenal adenocarcinoma with skin metastasis as initial manifestation: A case report
- Effects of Loofah cylindrica extract on learning and memory ability, brain tissue morphology, and immune function of aging mice
- Recombinant Bacteroides fragilis enterotoxin-1 (rBFT-1) promotes proliferation of colorectal cancer via CCL3-related molecular pathways
- Blocking circ_UBR4 suppressed proliferation, migration, and cell cycle progression of human vascular smooth muscle cells in atherosclerosis
- Gene therapy in PIDs, hemoglobin, ocular, neurodegenerative, and hemophilia B disorders
- Downregulation of circ_0037655 impedes glioma formation and metastasis via the regulation of miR-1229-3p/ITGB8 axis
- Vitamin D deficiency and cardiovascular risk in type 2 diabetes population
- Circ_0013359 facilitates the tumorigenicity of melanoma by regulating miR-136-5p/RAB9A axis
- Mechanisms of circular RNA circ_0066147 on pancreatic cancer progression
- lncRNA myocardial infarction-associated transcript (MIAT) knockdown alleviates LPS-induced chondrocytes inflammatory injury via regulating miR-488-3p/sex determining region Y-related HMG-box 11 (SOX11) axis
- Identification of circRNA circ-CSPP1 as a potent driver of colorectal cancer by directly targeting the miR-431/LASP1 axis
- Hyperhomocysteinemia exacerbates ischemia-reperfusion injury-induced acute kidney injury by mediating oxidative stress, DNA damage, JNK pathway, and apoptosis
- Potential prognostic markers and significant lncRNA–mRNA co-expression pairs in laryngeal squamous cell carcinoma
- Gamma irradiation-mediated inactivation of enveloped viruses with conservation of genome integrity: Potential application for SARS-CoV-2 inactivated vaccine development
- ADHFE1 is a correlative factor of patient survival in cancer
- The association of transcription factor Prox1 with the proliferation, migration, and invasion of lung cancer
- Is there a relationship between the prevalence of autoimmune thyroid disease and diabetic kidney disease?
- Immunoregulatory function of Dictyophora echinovolvata spore polysaccharides in immunocompromised mice induced by cyclophosphamide
- T cell epitopes of SARS-CoV-2 spike protein and conserved surface protein of Plasmodium malariae share sequence homology
- Anti-obesity effect and mechanism of mesenchymal stem cells influence on obese mice
- Long noncoding RNA HULC contributes to paclitaxel resistance in ovarian cancer via miR-137/ITGB8 axis
- Glucocorticoids protect HEI-OC1 cells from tunicamycin-induced cell damage via inhibiting endoplasmic reticulum stress
- Prognostic value of the neutrophil-to-lymphocyte ratio in acute organophosphorus pesticide poisoning
- Gastroprotective effects of diosgenin against HCl/ethanol-induced gastric mucosal injury through suppression of NF-κβ and myeloperoxidase activities
- Silencing of LINC00707 suppresses cell proliferation, migration, and invasion of osteosarcoma cells by modulating miR-338-3p/AHSA1 axis
- Successful extracorporeal membrane oxygenation resuscitation of patient with cardiogenic shock induced by phaeochromocytoma crisis mimicking hyperthyroidism: A case report
- Effects of miR-185-5p on replication of hepatitis C virus
- Lidocaine has antitumor effect on hepatocellular carcinoma via the circ_DYNC1H1/miR-520a-3p/USP14 axis
- Primary localized cutaneous nodular amyloidosis presenting as lymphatic malformation: A case report
- Multimodal magnetic resonance imaging analysis in the characteristics of Wilson’s disease: A case report and literature review
- Therapeutic potential of anticoagulant therapy in association with cytokine storm inhibition in severe cases of COVID-19: A case report
- Neoadjuvant immunotherapy combined with chemotherapy for locally advanced squamous cell lung carcinoma: A case report and literature review
- Rufinamide (RUF) suppresses inflammation and maintains the integrity of the blood–brain barrier during kainic acid-induced brain damage
- Inhibition of ADAM10 ameliorates doxorubicin-induced cardiac remodeling by suppressing N-cadherin cleavage
- Invasive ductal carcinoma and small lymphocytic lymphoma/chronic lymphocytic leukemia manifesting as a collision breast tumor: A case report and literature review
- Clonal diversity of the B cell receptor repertoire in patients with coronary in-stent restenosis and type 2 diabetes
- CTLA-4 promotes lymphoma progression through tumor stem cell enrichment and immunosuppression
- WDR74 promotes proliferation and metastasis in colorectal cancer cells through regulating the Wnt/β-catenin signaling pathway
- Down-regulation of IGHG1 enhances Protoporphyrin IX accumulation and inhibits hemin biosynthesis in colorectal cancer by suppressing the MEK-FECH axis
- Curcumin suppresses the progression of gastric cancer by regulating circ_0056618/miR-194-5p axis
- Scutellarin-induced A549 cell apoptosis depends on activation of the transforming growth factor-β1/smad2/ROS/caspase-3 pathway
- lncRNA NEAT1 regulates CYP1A2 and influences steroid-induced necrosis
- A two-microRNA signature predicts the progression of male thyroid cancer
- Isolation of microglia from retinas of chronic ocular hypertensive rats
- Changes of immune cells in patients with hepatocellular carcinoma treated by radiofrequency ablation and hepatectomy, a pilot study
- Calcineurin Aβ gene knockdown inhibits transient outward potassium current ion channel remodeling in hypertrophic ventricular myocyte
- Aberrant expression of PI3K/AKT signaling is involved in apoptosis resistance of hepatocellular carcinoma
- Clinical significance of activated Wnt/β-catenin signaling in apoptosis inhibition of oral cancer
- circ_CHFR regulates ox-LDL-mediated cell proliferation, apoptosis, and EndoMT by miR-15a-5p/EGFR axis in human brain microvessel endothelial cells
- Resveratrol pretreatment mitigates LPS-induced acute lung injury by regulating conventional dendritic cells’ maturation and function
- Ubiquitin-conjugating enzyme E2T promotes tumor stem cell characteristics and migration of cervical cancer cells by regulating the GRP78/FAK pathway
- Carriage of HLA-DRB1*11 and 1*12 alleles and risk factors in patients with breast cancer in Burkina Faso
- Protective effect of Lactobacillus-containing probiotics on intestinal mucosa of rats experiencing traumatic hemorrhagic shock
- Glucocorticoids induce osteonecrosis of the femoral head through the Hippo signaling pathway
- Endothelial cell-derived SSAO can increase MLC20 phosphorylation in VSMCs
- Downregulation of STOX1 is a novel prognostic biomarker for glioma patients
- miR-378a-3p regulates glioma cell chemosensitivity to cisplatin through IGF1R
- The molecular mechanisms underlying arecoline-induced cardiac fibrosis in rats
- TGF-β1-overexpressing mesenchymal stem cells reciprocally regulate Th17/Treg cells by regulating the expression of IFN-γ
- The influence of MTHFR genetic polymorphisms on methotrexate therapy in pediatric acute lymphoblastic leukemia
- Red blood cell distribution width-standard deviation but not red blood cell distribution width-coefficient of variation as a potential index for the diagnosis of iron-deficiency anemia in mid-pregnancy women
- Small cell neuroendocrine carcinoma expressing alpha fetoprotein in the endometrium
- Superoxide dismutase and the sigma1 receptor as key elements of the antioxidant system in human gastrointestinal tract cancers
- Molecular characterization and phylogenetic studies of Echinococcus granulosus and Taenia multiceps coenurus cysts in slaughtered sheep in Saudi Arabia
- ITGB5 mutation discovered in a Chinese family with blepharophimosis-ptosis-epicanthus inversus syndrome
- ACTB and GAPDH appear at multiple SDS-PAGE positions, thus not suitable as reference genes for determining protein loading in techniques like Western blotting
- Facilitation of mouse skin-derived precursor growth and yield by optimizing plating density
- 3,4-Dihydroxyphenylethanol ameliorates lipopolysaccharide-induced septic cardiac injury in a murine model
- Downregulation of PITX2 inhibits the proliferation and migration of liver cancer cells and induces cell apoptosis
- Expression of CDK9 in endometrial cancer tissues and its effect on the proliferation of HEC-1B
- Novel predictor of the occurrence of DKA in T1DM patients without infection: A combination of neutrophil/lymphocyte ratio and white blood cells
- Investigation of molecular regulation mechanism under the pathophysiology of subarachnoid hemorrhage
- miR-25-3p protects renal tubular epithelial cells from apoptosis induced by renal IRI by targeting DKK3
- Bioengineering and Biotechnology
- Green fabrication of Co and Co3O4 nanoparticles and their biomedical applications: A review
- Agriculture
- Effects of inorganic and organic selenium sources on the growth performance of broilers in China: A meta-analysis
- Crop-livestock integration practices, knowledge, and attitudes among smallholder farmers: Hedging against climate change-induced shocks in semi-arid Zimbabwe
- Food Science and Nutrition
- Effect of food processing on the antioxidant activity of flavones from Polygonatum odoratum (Mill.) Druce
- Vitamin D and iodine status was associated with the risk and complication of type 2 diabetes mellitus in China
- Diversity of microbiota in Slovak summer ewes’ cheese “Bryndza”
- Comparison between voltammetric detection methods for abalone-flavoring liquid
- Composition of low-molecular-weight glutenin subunits in common wheat (Triticum aestivum L.) and their effects on the rheological properties of dough
- Application of culture, PCR, and PacBio sequencing for determination of microbial composition of milk from subclinical mastitis dairy cows of smallholder farms
- Investigating microplastics and potentially toxic elements contamination in canned Tuna, Salmon, and Sardine fishes from Taif markets, KSA
- From bench to bar side: Evaluating the red wine storage lesion
- Establishment of an iodine model for prevention of iodine-excess-induced thyroid dysfunction in pregnant women
- Plant Sciences
- Characterization of GMPP from Dendrobium huoshanense yielding GDP-D-mannose
- Comparative analysis of the SPL gene family in five Rosaceae species: Fragaria vesca, Malus domestica, Prunus persica, Rubus occidentalis, and Pyrus pyrifolia
- Identification of leaf rust resistance genes Lr34 and Lr46 in common wheat (Triticum aestivum L. ssp. aestivum) lines of different origin using multiplex PCR
- Investigation of bioactivities of Taxus chinensis, Taxus cuspidata, and Taxus × media by gas chromatography-mass spectrometry
- Morphological structures and histochemistry of roots and shoots in Myricaria laxiflora (Tamaricaceae)
- Transcriptome analysis of resistance mechanism to potato wart disease
- In silico analysis of glycosyltransferase 2 family genes in duckweed (Spirodela polyrhiza) and its role in salt stress tolerance
- Comparative study on growth traits and ions regulation of zoysiagrasses under varied salinity treatments
- Role of MS1 homolog Ntms1 gene of tobacco infertility
- Biological characteristics and fungicide sensitivity of Pyricularia variabilis
- In silico/computational analysis of mevalonate pyrophosphate decarboxylase gene families in Campanulids
- Identification of novel drought-responsive miRNA regulatory network of drought stress response in common vetch (Vicia sativa)
- How photoautotrophy, photomixotrophy, and ventilation affect the stomata and fluorescence emission of pistachios rootstock?
- Apoplastic histochemical features of plant root walls that may facilitate ion uptake and retention
- Ecology and Environmental Sciences
- The impact of sewage sludge on the fungal communities in the rhizosphere and roots of barley and on barley yield
- Domestication of wild animals may provide a springboard for rapid variation of coronavirus
- Response of benthic invertebrate assemblages to seasonal and habitat condition in the Wewe River, Ashanti region (Ghana)
- Molecular record for the first authentication of Isaria cicadae from Vietnam
- Twig biomass allocation of Betula platyphylla in different habitats in Wudalianchi Volcano, northeast China
- Animal Sciences
- Supplementation of probiotics in water beneficial growth performance, carcass traits, immune function, and antioxidant capacity in broiler chickens
- Predators of the giant pine scale, Marchalina hellenica (Gennadius 1883; Hemiptera: Marchalinidae), out of its natural range in Turkey
- Honey in wound healing: An updated review
- NONMMUT140591.1 may serve as a ceRNA to regulate Gata5 in UT-B knockout-induced cardiac conduction block
- Radiotherapy for the treatment of pulmonary hydatidosis in sheep
- Retraction
- Retraction of “Long non-coding RNA TUG1 knockdown hinders the tumorigenesis of multiple myeloma by regulating microRNA-34a-5p/NOTCH1 signaling pathway”
- Special Issue on Reuse of Agro-Industrial By-Products
- An effect of positional isomerism of benzoic acid derivatives on antibacterial activity against Escherichia coli
- Special Issue on Computing and Artificial Techniques for Life Science Applications - Part II
- Relationship of Gensini score with retinal vessel diameter and arteriovenous ratio in senile CHD
- Effects of different enantiomers of amlodipine on lipid profiles and vasomotor factors in atherosclerotic rabbits
- Establishment of the New Zealand white rabbit animal model of fatty keratopathy associated with corneal neovascularization
- lncRNA MALAT1/miR-143 axis is a potential biomarker for in-stent restenosis and is involved in the multiplication of vascular smooth muscle cells