High-performance WC–Co coatings via HVOF: Mechanical properties of steel surfaces
-

 and
and

Abstract
This study aims to investigate the microstructural and wear properties of tungsten carbide and cobalt (WC–Co) coating deposited by high-velocity oxy-fuel spraying (HVOF) by optimising powders with different content ratios. Two different powders were used as coating powders, one containing 50 wt% Sulzer Metco 5810 (WC, 12 wt% cobalt powder) and 50 wt% Amdry 960 (nickel, chromium, and aluminium) and the other containing 50 wt% Woka 3653 and 50 wt% Amdry 960. The coating layer was examined using scanning electron microscopy–energy dispersive spectroscopy (SEM–EDS), and X-ray diffraction analysis was performed on the coated surface. The hard phases occurred after the HVOF process, and the hardness values were measured on the cross-section of the coating layer. The coated surface’s hardness was found to be increased by five times (from 200 HV to 1,250 HV). The CSM wear test machine examined the changes in the wear properties of coated surfaces according to the ASTM G133 standard. Both coatings positively affected wear, and the wear resistance of the coated surface was increased after the HVOF process. The friction coefficients of samples decreased after the coating process. SEM–EDS analyses of worn surfaces were conducted, and a 3D surface topography test was applied to worn surfaces. Abrasive and adhesive wear were seen on the surface. It was observed that the mechanical and surface properties of the two groups of powder coatings were different.
Graphical abstract
1 Introduction
Several thermal spray processes are available for coating metallic parts to improve their surface properties [1,2,3]. Among these processes, the high-velocity oxygen fuel (HVOF) method is widely used to provide protective coatings for various components across numerous industrial sectors [3,4,5,6,7,8]. HVOF is used in various industries, including mould manufacturing, where it is applied in creating hot forging punches, aluminium injection moulds, and graphite moulds. In the automotive sector, the technology is utilised for components such as gas turbines and diesel engines. The petroleum and natural gas industries also employ HVOF for gas turbines that operate on coal-burning natural gas and transportation pipelines [9]. Additionally, it finds applications in the aircraft industry, particularly for aircraft landing gears, and in power plant industries for boiler tubing and coal-fired boilers [10]. HVOF is considered an ideal alternative to hard chrome plating due to its environmental benefits and safety, as well as its ability to produce high-quality results, reduce energy consumption, and lower capital costs [11,12].
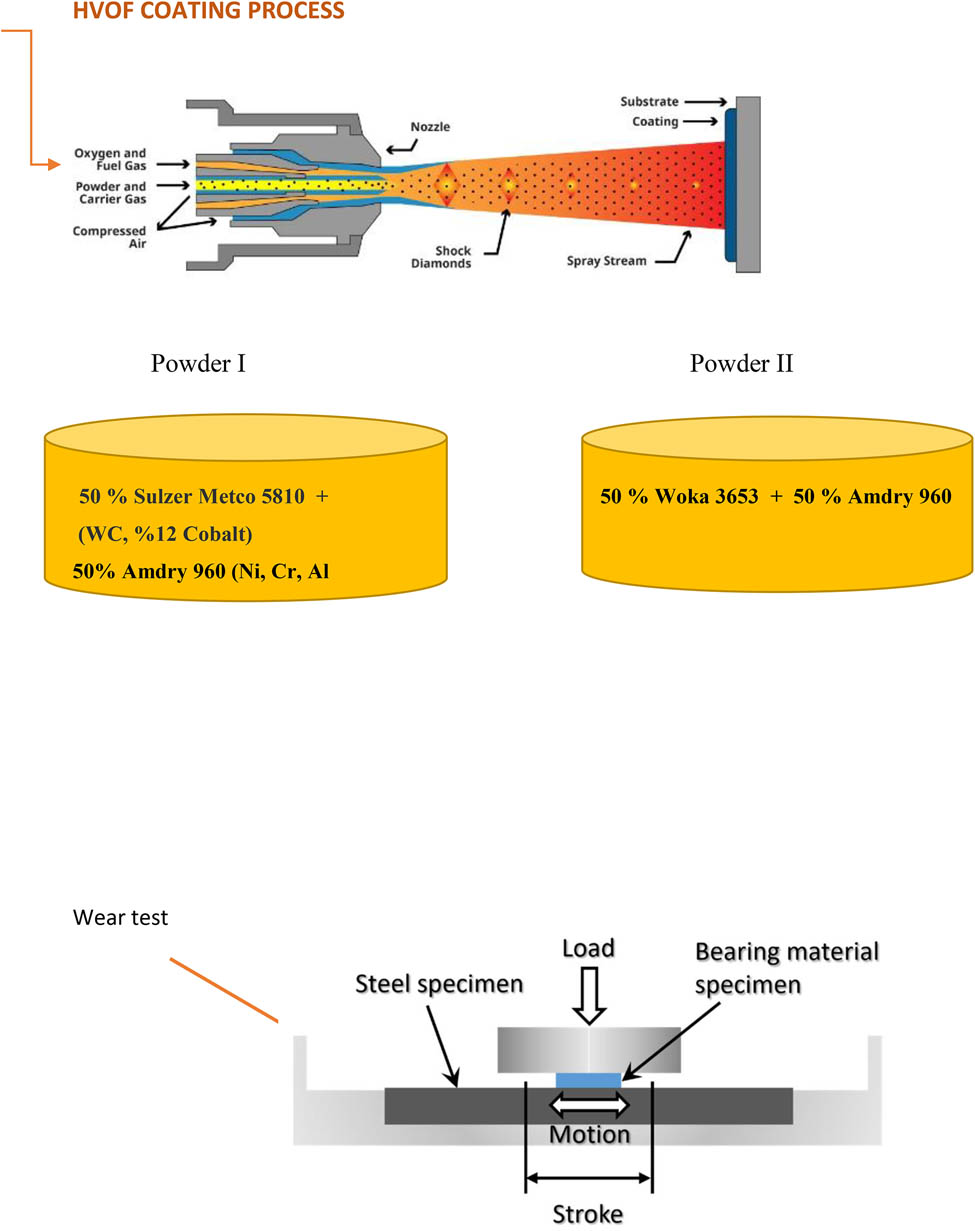
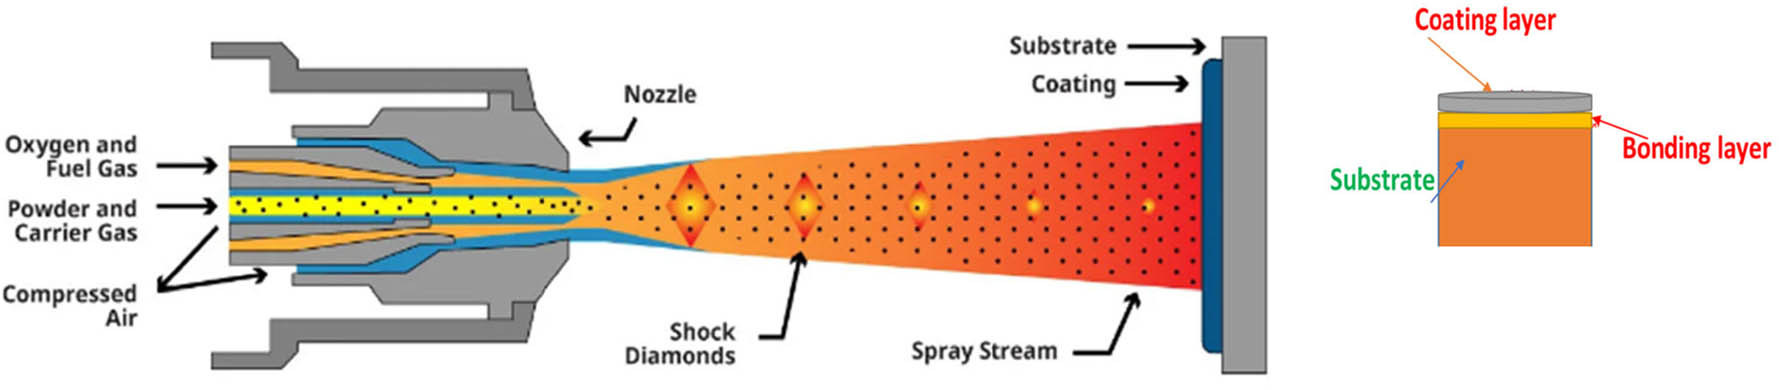
The schematic image of the HVOF coating system is given in Figure 1, and the cross-sectional diagram of the coating is presented in Figure 1 [13]. In the HVOF method, the combustion fuel and oxygen are directed to the combustion chamber and the spray powder. The chamber has high heat and pressure, allowing gases to pass through the spray and create supersonic flow [8,9]. The dust particles melt during the flame temperature, passing through the combustion chamber and flowing through the spray. In the HVOF process, particles may be completely or partially melted, depending on the flame temperature and the melting point of the coated material.
HVOF system for coating.
The HVOF thermal spraying process is more suitable for obtaining dense structures with low contamination [5,10]. The high impact velocity of particles in this process causes them to be in a plastic state rather than being melted, creating dense coatings [13]. Several factors come into play when forming HVOF thermal spray coatings [9,13,17]. These include the spray system used, raw material properties like particle size distribution and composition, and process parameters like spray type, fuel, oxygen–fuel ratio, spray distance, and powder feed rate [8,9]. The HVOF process involves melting and accelerating dust particles using thermal and kinetic energies to create the desired coatings [17,18,19,20]. The coating is designed to withstand damage and maintain its structural strength and integrity. Its hardness enables it to resist plastic deformation [16,20,21,22]. These parameters influence the properties of the coating and can be adjusted under controlled conditions [11,12,13,14,15,16].
The HVOF thermal spray process has emerged as a superior technique for depositing tungsten carbide–cobalt (WC–Co)-based coatings, particularly in applications demanding exceptional wear resistance. The high particle velocities and relatively low thermal input characteristic of HVOF facilitate the retention of the WC phase and minimise decarburisation, thereby preserving the intrinsic hardness of the carbide. Simultaneously, the cobalt binder phase ensures adequate toughness and load distribution, mitigating crack propagation under cyclic or abrasive stress [23,24,25].
The properties of HVOF-sprayed WC–Co coatings are significantly influenced by the amount and distribution of WC particles and the amount of the Co-binder phase [14,15]. Many surface coating studies have been carried out using the HVOF method [20,21,22,23,24,25,26]. Coating powders and their contents have affected the surface properties differently.
Zheng et al., Leyland and Matthews, and Abbasi et al. have demonstrated that HVOF-sprayed WC–Co coatings exhibit significantly lower porosity and higher adhesive strength compared to those produced by conventional plasma spray methods, resulting in enhanced tribological performance. The synergistic interaction between the hard WC particles and the ductile Co matrix contributes to a refined microstructure capable of resisting both adhesive and abrasive wear mechanisms, making these coatings ideal for high-performance engineering components subjected to severe contact conditions [18,24,25]. Other authors, whose contents are generally similar to our study, have reached favourable results in terms of mechanical properties due to the new hard phases formed on the surface.
For example, Picas et al. [19] examined the potential of three new types of coatings, tungsten carbide–nickel–molybdenum–chromium–iron–cobalt (WC–NiMoCrFeCo), WC–CrC–Ni, and tungsten carbide–iron–chromium–aluminium (WC–FeCrAl), as alternatives to the conventional WC–CoCr coating. They found that the WC–CoCr coating has a slightly higher hardness than the WC–NiMoCrFeCo and WC–FeCrAl coatings. The researchers also discovered that the WC–CrC–Ni coating was significantly the softest and least wear-resistant due to a high percentage of lower-hardness CrC particles. Nahvi and colleagues studied the microstructural and mechanical properties of HVOF-sprayed coatings made of WC–FeCrAl, WC–NiMoCrFeCo, and the traditional WC–Co. They found that while the WC–FeCrAl coating had the highest hardness, the conventional WC–Co coating had the highest fracture toughness amongst the tested coatings [10]. Bolelli and colleagues compared the WC–FeCrAl coating to the WC–CoCr coating. They found that while the sliding wear and ball impact resistance were comparable, the WC–FeCrAl coating showed inferior resistance to dry particle abrasion due to brittleness induced by oxide inclusions [17]. Mahade et al. conducted a study on the effect of laser remelting on a plasma-sprayed coating layer of WC with a 12% Co content. Numerous studies have highlighted the significance of process parameters in achieving the desired outcomes [13,14,16]. Abbasi et al. used HVOF coating (WC–75Cr3C2–25NiCr) on stainless steel. After the experimental studies, they also saw that the steel surface properties improved. Numerous studies have shown that the coating process enhances workpiece surface mechanical and tribological properties [24,25,26]. Finding the optimal composition ratio of the hard phase and the best spraying process is essential for enhancing the wear resistance of WC-based coatings. According to various studies, the impact of carbides on the microstructure and performance of these coatings has been thoroughly examined [15,16,17,18].
The aim of this study is to see the effect of pure and mixed or content differences on surface mechanical properties. Since stainless steel is used extensively in the sector, improving the surface properties of this steel will be important and valuable for many sectors. It will be an important output of this study to improve the mechanical properties of this intensively used steel group and to find the ideal content and ideal parameters in this regard. The coating layer’s hardness and microstructure images were examined in detail. The thickness of the coated layer was measured, and the effect of process parameters on hardness and mechanical properties was investigated. The CSM apparatus performed the linear wear test, while surface roughness measurements were done using a 3D (MAHR) surface profilometer. The wear test measured the coated surface’s wear volume, wear rate (WR), and friction coefficient. The surface changes after the wear test were interpreted based on the scanning electron microscopy–energy dispersive spectroscopy (SEM–EDS) images obtained.
2 Experimental procedures
2.1 HVOF coating process
The surface of AISI 304 stainless steel was coated using HVOF technology with two different powder mixtures, and the resulting effects on the surface properties were examined. The first mixture (P1) consisted of 50 wt% Metco5810 and 50 wt% Amdry960. This material had a spherical composite morphology and produced smooth, hard, wear-resistant surfaces. The second mixture was composed of (P2) 50 wt% Woka 3653 and 50 wt% Amdry 960. The powder was supplied by Sulzer Metco (Oerlikon), Germany. The grain size of Sulzer Metco’s 5810 powder was −63 + 11 mm, while that of Woka 3653 was −45 + 15 mm. Amdry 960 powder was a binder powder that could also be used at high temperatures. The density of Sulzer Metco 5810 powder was much higher than that of other powders. The powders were agglomerated and sintered.
To prepare the metal samples for HVOF treatment, the AISI 304 stainless steel was cut into 30 mm × 40 mm sizes and divided into 12 groups. Holes were drilled in each sample to fix it in place. Sandblasting was then applied to improve the surface coating quality. Before spraying, all powders were oven-dried at 90°C for 2 h to remove moisture. The coating–spraying processes were carried out using a robot arm at a constant speed of 200 mm·s−1. Steel samples were coated with two different powder mixtures, P1 and P2, with varying contents.
The HVOF process includes spraying time, temperature, gas pressure, and powder feed rate. These parameters can significantly influence the coating quality and overall performance, and therefore their selection must be justified. The details of powder contents are provided in Table 1, the parameters for carrying out the HVOF treatment are outlined in Table 2, and sample codes (z1–z12) are listed in Table 3.
Chemical compositions of coating powders
| Powders | P-1 (Sulzer Metco 5810) | P-2 (Woka 3653) | Binding (Amdry 960) |
|---|---|---|---|
| Composition | WC–12Co | 86WC–10Co–4Cr | NiCrAl |
| Grain size (μm) | −63 + 11 | −45 + 15 | −125 + 45 |
| Service temperature (°C) | 500 | 500 | 980°C |
| Density (g·cm−3) | 4.6–5.4 | 2.9–5.8 | 1.4–4 |
| Morphology | Spherical | Spherical | Spherical |
Deposition parameters of the HVOF process
| Combustion gases | H2 and O2 |
|---|---|
| Powder carrier gas | N2 |
| Substrate pre-heating | 150°C |
| Flame temperature | 3,000°C |
| Powder feeling rate | 30 g·min−1 |
| Powder feed gas flow | 12 slpm |
| Number of spray passes | 10–15–20 |
| Gun movement speed | 100–500 mm·s−1 |
| Coating distance | 200–300 mm |
Powder content and process parameters
| Sample code | Powders | Mass ratios of the powders | Spray distance (mm) | Passes |
|---|---|---|---|---|
| z1 | P-1 | 50 wt% Sulzer Metco 5810 (WC and 12% Co) | 200 | 10 |
| 50 wt% Amdry 960 (Ni, Cr, and Al) | ||||
| z2 | P-1 | 50 wt% Sulzer Metco 5810 (WC and 12% Co) | 300 | 10 |
| 50 wt% 960 (Ni, Cr, and Al) | ||||
| z3 | P-1 | 50 wt% Sulzer Metco 5810 (WC and 12% Co) | 200 | 15 |
| 50 wt% Amdry 960 (Ni, Cr, and Al) | ||||
| z4 | P-1 | 50 wt% Sulzer Metco 5810 (WC and 12% Co) | 300 | 15 |
| 50 wt% Amdry 960 (Ni, Cr, and Al) | ||||
| z5 | P-1 | 50 wt% Sulzer Metco 5810 (WC and 12% Co) | 200 | 20 |
| 50 wt% Amdry 960 (Ni, Cr, and Al) | ||||
| z6 | P-1 | 50 wt% Sulzer Metco 5810 (WC and 12% Co) | 300 | 20 |
| 50 wt% Amdry 960 (Ni, Cr, and Al) | ||||
| z7 | P-2 | 50 wt% Woka 3653 (WC–10%Co–4%–Cr) | 200 | 10 |
| 50 wt% Amdry 960 (Ni, Cr, and Al) | ||||
| z8 | P-2 | 50 wt% Woka 3653 (WC–10%Co–4%Cr) | 300 | 10 |
| 50 wt% Amdry 960 (Ni, Cr, and Al) | ||||
| z9 | P-2 | 50 wt% Woka 3653 (WC–10%Co–4%Cr) | 200 | 15 |
| 50 wt% Amdry 960 (Ni, Cr, and Al) | ||||
| z10 | P-2 | 50 wt% Woka 3653 (WC–10%Co–4%Cr) | 300 | 15 |
| 50 wt% Amdry 960 (Ni, Cr, and Al) | ||||
| z11 | P-2 | 50 wt% Woka 3653 (WC–10%Co–4%Cr) | 200 | 20 |
| 50 wt% Amdry 960 (Ni, Cr, and Al) | ||||
| z12 | P-2 | 50 wt% Woka 3653 (WC–10%Co–4%Cr) | 300 | 20 |
| 50 wt% Amdry 960 (Ni, Cr, and Al) |
The High Velocity Oxy-Fuel (HVOF) thermal spray process was performed using oxygen (O2) and methane (CH4) as combustion gases, with nitrogen (N₂) serving as the powder carrier gas. Prior to coating, the substrate was pre-heated to a temperature range of 100–200°C to enhance adhesion. The flame temperature during spraying reached up to 3,000°C. The powder feed rate was maintained at 25 g/min, with a corresponding powder feed gas flow of 12.5 slpm. Coating deposition was achieved through 15–30 spray passes, while the gun traverse speed was controlled between 100–500 mm/s. The standoff (spray) distance was fixed at approximately 200 mm to ensure optimal coating morphology and density
After the coating treatment (Sulzer Metco HVOF apparatus), the samples were cut in half to obtain a cross-sectional image, and metallographic preparation was initiated. The surface was cleaned using MetaServ SiC abrasives ranging from 60 to 1,200 mesh. Once the desired surface cleaning was achieved, the samples were polished. The morphology of the coated samples was analysed using SEM–EDS analysis conducted with a JEOL LV scanning electron microscope. X-ray diffraction (XRD) analysis was performed on the coated samples using a RIGAKU D/MAX/2200/PC X-ray diffractometer at a scanning speed of 2°·min−1 and a scanning angle range of 0–90° with a Cu–K beam having a wavelength of ≈1.54056.
The wear tests using CSM were conducted according to ASTM G133 standards using a wear device. The experiments were carried out at an ambient temperature of 25°C and an ambient humidity of 35%. The linear wear (reciprocating) method was applied, and the tests were performed using an Al ball with 6 mm diameter. The wear test parameters are listed in Table 4. The loads applied during the experiment were 2, 3, and 4 N, and the speeds were 0.1 and 0.2 m·s−1. The wear paths were 400 m. The ball’s position changed in each wear test. The data obtained were collected using a data acquisition card. The system can measure time-dependent depth profiles by using sensitive transducers. The depth transducer was positioned vertically on top of the sample.
Parameters of the wear test
| No. | Load (N) | Velocity (m·s−1) | Distance (m) |
|---|---|---|---|
| 1 | 2 | 0.1 | 400 |
| 2 | 2 | 0.2 | 400 |
| 3 | 3 | 0.1 | 400 |
| 4 | 3 | 0.2 | 400 |
| 5 | 4 | 0.1 | 400 |
| 6 | 4 | 0.2 | 400 |
After each test, the wear on the surface was calculated by measuring the wear width, depth, and surface roughness with a surface profilometer and low-magnification optical micrographs.
To calculate the wear volume loss of a hard-facing layer, we need to measure the track line (l) formed on the worn surface in millimetres and the crosscut track area (A) of the worn path in square millimetres using a 3D profilometer. This measurement should be taken after a specific time interval. We can then calculate the hard-facing layer’s WR via an Al ball using the formula WR = V/S, where V is the wear volume and S is the sliding distance in metres. To ensure accurate WR calculations, we should input the wear track width, surface roughness, and depth values into the wear test software in the CSM wear device. The worn surfaces were analysed using SEM and EDS, while a 3D profilometer was used to measure the surface roughness post-test.
3 Results and discussion
The SEM micrographs of the cross-sectional surfaces of samples (z1 and z7) are shown in Figure 2a and b, respectively. Some porosity was observed on the coating layer. There are two possible reasons for the formation of these porosities. First, the roughness on the metal surface during the spraying of the powder may have obstructed the flow, causing the sudden solidification of the powder [9,10,11,12,13,14]. Second, insufficient wetting on the metal surface may have caused the formation of oxides, oils, and stains on the surface. The grain size of powders can significantly affect the quality of coating formation under the same spraying conditions. Coatings formed with larger grain powders tend to have higher porosity compared to those formed with smaller grain powders [15,16,19]. This is because larger grains create more voids and gaps during the spraying process, leading to increased porosity in the final coating. If coatings made with large-grain powders exhibit higher porosity, then larger-grain powders result in more porous coatings [19,20]. Smaller particles generally establish better interfacial contact with the substrate, which enhances metallurgical or mechanical bonding and improves adhesion. In contrast, larger particles may not fully melt or deform upon impact, resulting in higher porosity, weaker inter-particle cohesion, and less effective bonding with the substrate. Research has demonstrated that optimising the particle size distribution can significantly enhance coating performance by balancing the deposition efficiency, thermal behaviour, and bonding characteristics [21,22].
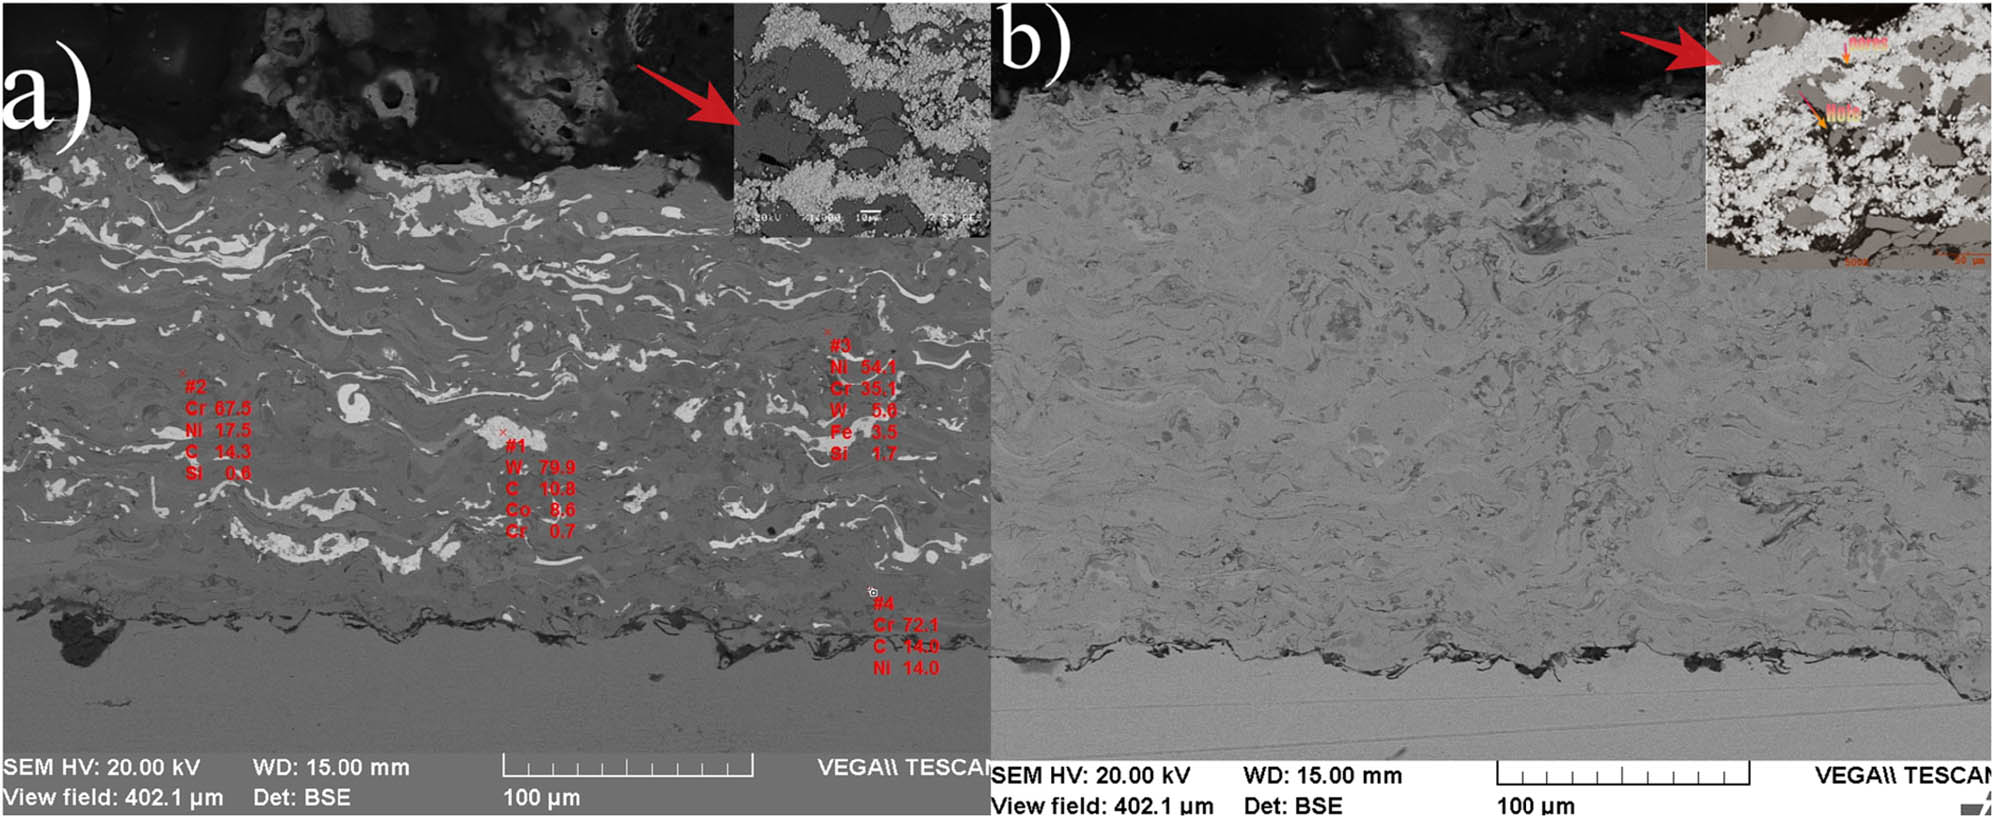
SEM micrographs of the cross-section of (a) sample z1 and (b) sample z7.

EDS analyses of (a) sample z3 (wt%) and (b) sample z9 (wt%).
The varied process temperature range resulted in minor pores on the substrate surface. The type and shape of the powder material, the coating production method, and the production parameters determine the formation of porosity in the coating.
The structure shows porosity, which is ideal for wear applications [14,15,16]. Hajare and their colleagues discovered that temperature differences could exist between the substrate and coating layers during a particular process. This disparity might be due to quick and unregulated cooling between the two layers, leading to a particle structure divergence. This situation can cause a delay in bonding [20,21]. The even distribution of the material on the powder structure results in more substantial and more consistent interactions between the powders and substrate, leading to a more durable bond [11,12]. This is particularly desirable in many industrial and technical applications. However, some microcracks were observed in specific structures in SEM images of the samples. These are very fine cracks of capillary size in the coating structure, which may have resulted from thermal differences caused by the high process temperature [12,13].
In Figure 3, EDS analyses of sample z3 and sample z9 are performed. The difference between P1 and P2 powder contents is seen from EDS analyses. Upon examining the composition by EDS analyses, it is evident that W is the dominant element in the first region. The second region primarily comprises Co and Ni, while the third region comprises Cr and Al. The tungsten phase is relatively abundant in the first region. In the dark grey area, we can consider oxidation, as discussed in the work of Hajare et al. [20,21,22,25]. Capillary microcracks observed in HVOF coatings typically originate from a combination of three primary mechanisms: thermal mismatch, shrinkage-induced stress, and phase transformation. The difference in thermal expansion coefficients between the coating and the substrate can lead to residual tensile stresses during cooling, which may exceed the material’s fracture strength and initiate microcracks [26]. Additionally, rapid solidification and particle consolidation during spraying can cause volumetric shrinkage; when constrained by the substrate, this shrinkage generates tensile stress and promotes crack formation [27]. Furthermore, certain coating materials may undergo phase transformations during or after spraying, resulting in volume changes and internal stresses that contribute to crack development. A comprehensive understanding of these mechanisms is essential for optimising process parameters and improving coating integrity [19–21]. In a study conducted by Hajare and colleagues, it was noted that dust particles cause less particle melting and dissolution of carbides due to their high velocity [19,21]. In Figure 2, the dark grey area is densely located in the structure, which suggests oxidation, as demonstrated in the work of Hajare et al. [20]. As such, it can be assumed that the metal binder phase melted entirely, while the WC particles remained solid during spraying [20,22,24,25]. In a study conducted by Noblea and his colleagues, it was found that perfect bonding between Co and WC results in a denser structure in the decking of WC–Co compared to WC–10Co–4Cr. This structure has grey and dark spots that indicate the presence of Co and unresolved Cr phases, while the bright spots represent [21,30].
The coating thickness is one of the most significant factors affecting the mechanical and wear properties [31]. The thickness of coatings on the samples was measured by SEM. To begin with, the changes in coating thickness were analysed while keeping the number of passes constant and altering the spray distance, as shown in Figure 4. The coating thickness changes were observed when the number of passes was 10–15–20, and the spray distance was increased from 200 to 300 mm. It is important to note that coating thickness may not always progress symmetrically and can deviate due to spray mouth angle errors during the coating process, depending on the distance [12,24]. In sample z5, the highest coating thickness of 426 µm was achieved at a spray distance of 200 mm with several 20 passes. The coating thickness for the z1 sample was 392 µm, whereas the z2 sample’s coating thickness was 290 µm. The results indicate that experimental parameters like distance and number of passes significantly impact the coating thickness and structure [23,24,31]. In thermal spray coating processes, the spray-to-substrate distance, often referred to as standoff distance, is a critical parameter that significantly influences the hardness of the resulting coating. This distance directly affects the thermal and kinetic energies of the particles upon impact. In the material and spray technique, particles retain sufficient velocity and temperature to flatten effectively on the substrate, forming a dense and well-adhered microstructure with enhanced hardness. If the spray is positioned too close, particles may overheat or oxidise, potentially causing microstructural defects and reducing mechanical integrity. Conversely, excessive spray distance can lead to premature cooling and reduced particle velocity, resulting in poor bonding, increased porosity, and lower hardness values. Therefore, precise control of spray distance is essential to optimise coating properties, as supported by experimental studies, showing peak hardness values at specific spray distances [20,21].
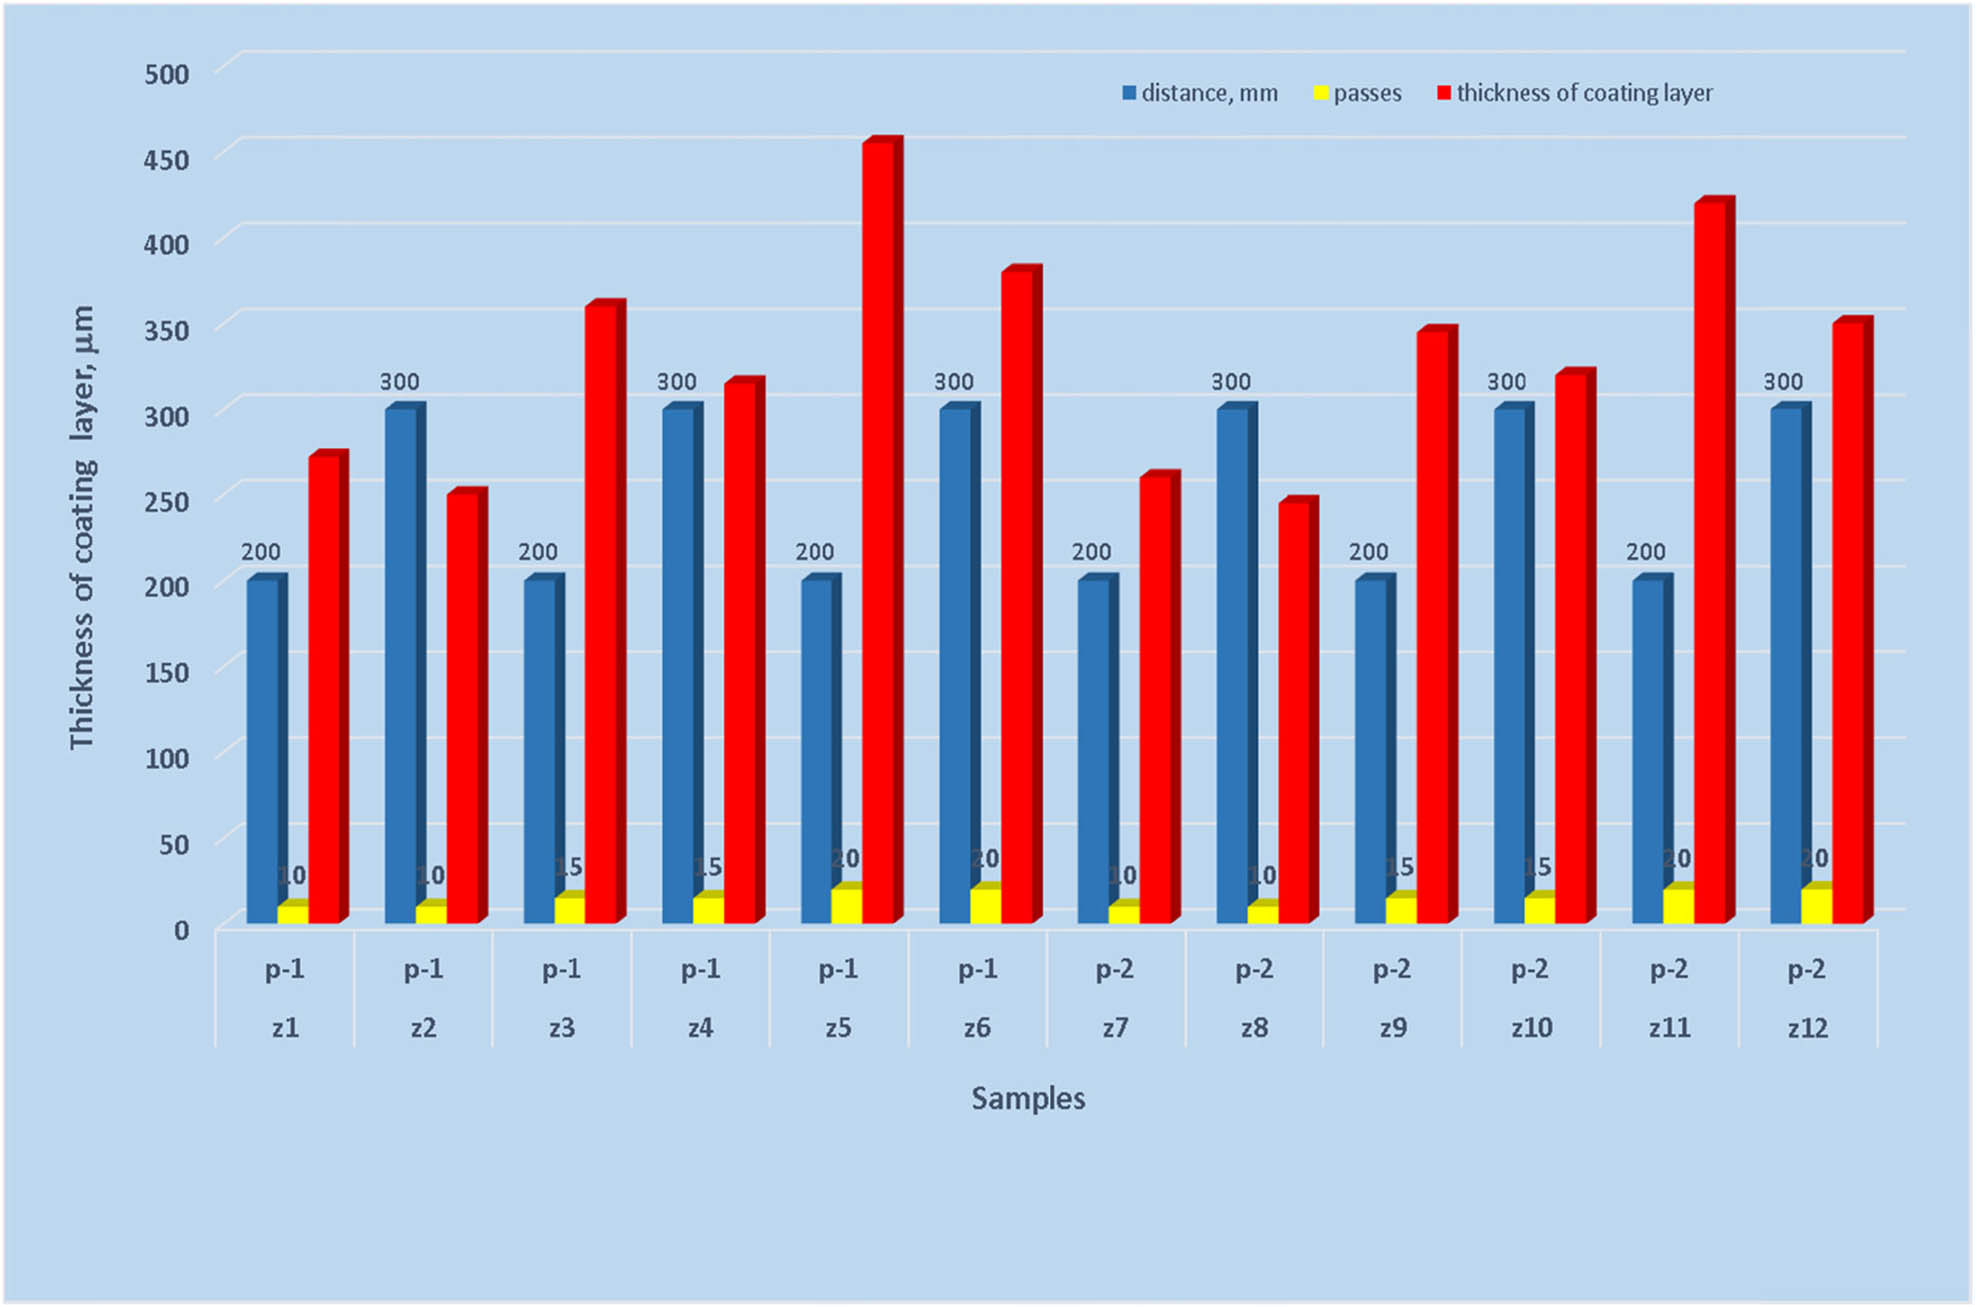
Variation of coating thickness according to parameters of HVOF-coated samples.
Further analysis showed that the most efficient coating thickness was achieved with a spray distance of 200 mm. Reducing the distance causes a greater amount of dust to come into contact with the surface, which in turn increases the coating thickness. This finding is supported by previous research [17,19,21]. Conversely, increasing the distance can lead to melting issues with the powders, which may affect the homogeneity of the coating before it reaches the surface [11,18,22,25]. Regarding coating application, increasing the number of passes results in a more uniform thickness. As the number of passes increases, more coating powder reaches the surface, leading to a thicker and more consistent coating structure [18,19,24].
The two powders, P1 and P2, have different compositions. P2 contains a higher proportion of Cr and Co phases, making Co an effective binder for coating powders [20,21]. In contrast, P1 has a higher W phase content, which offers high hardness and strong bonding to the surface [15,23,30]. The differences in the number and ratio of phases in P2 may result in thinner coating thicknesses. Additionally, the density of P1 is higher than that of P2, which may lead to higher coating thicknesses with P1. When the size of the powder used in the coating is small, its speed increases. When the powder size changes, the energy on the surface changes. fine powder size reduces the energy. The coatings (P2) deposited parameters were porous and rougher compared to P1, owing to excessive oxidation. This showed that fine-cut size powder with reduced energy parameters was smoother than the sprayed surface finish [30,31,34].
The XRD analysis graphs of samples z1–z6 and samples z7–z12 can be found in Figure 5a and b, respectively. During the XRD analysis, it was discovered that the coated samples with P1 powder contained Cr, W2C, Cr2Ni3, and WC crystalline phases. On the other hand, the samples coated with P2 contained WC, W, and W2C phases on the surface. These phases are crucial in enhancing resistance to wear and corrosion [24,26,28,29]. The analysis also revealed the presence of crystallisation of amorphous and nanostructured phases [16,18]. It was observed that the WC peak intensities increased at 2θ angles of 34° and 47°, with an increase in spray distance. Additionally, the coating surface had W2C phases formed. According to Mahade and colleagues’ study, a decrease in WC phases saw the emergence of W2C phases [13]. They also found the same phases in their studies. During thermal spray processes, it has been observed that Picas et al. found that the WC particles can undergo decarburisation and oxidation, which leads to the formation of oxycarbides, metallic tungsten (W), and tungsten carbide (W2C). According to their research, the addition of chromium (WC–CoCr) can modify the decomposition of the WC grains in a way that prevents decarburisation and enhances the binding of the coating’s matrix, thereby improving its mechanical properties [19]. Zheng and his colleagues have claimed that during the HVOF process, powders are exposed to oxygen at high temperatures, causing chemical changes. The W and C phases react to form a brittle structure, like the W2C phase. The source of the W2C phase, which was also observed in a study conducted by Wei and his team [15], is a type of decarburisation of WC that occurs during the HVOF process. These brittle structures (W2C) tend to form weak bonds and can reduce the erosion wear resistance of the coating. The presence of cracks in the structure is mainly associated with the size of the powder, the gas flow rate, and the spray temperature. The WC phases, on the other hand, have improved the structure against erosive wear and have advanced mechanical properties in the coating process [15,16,17,18,29].
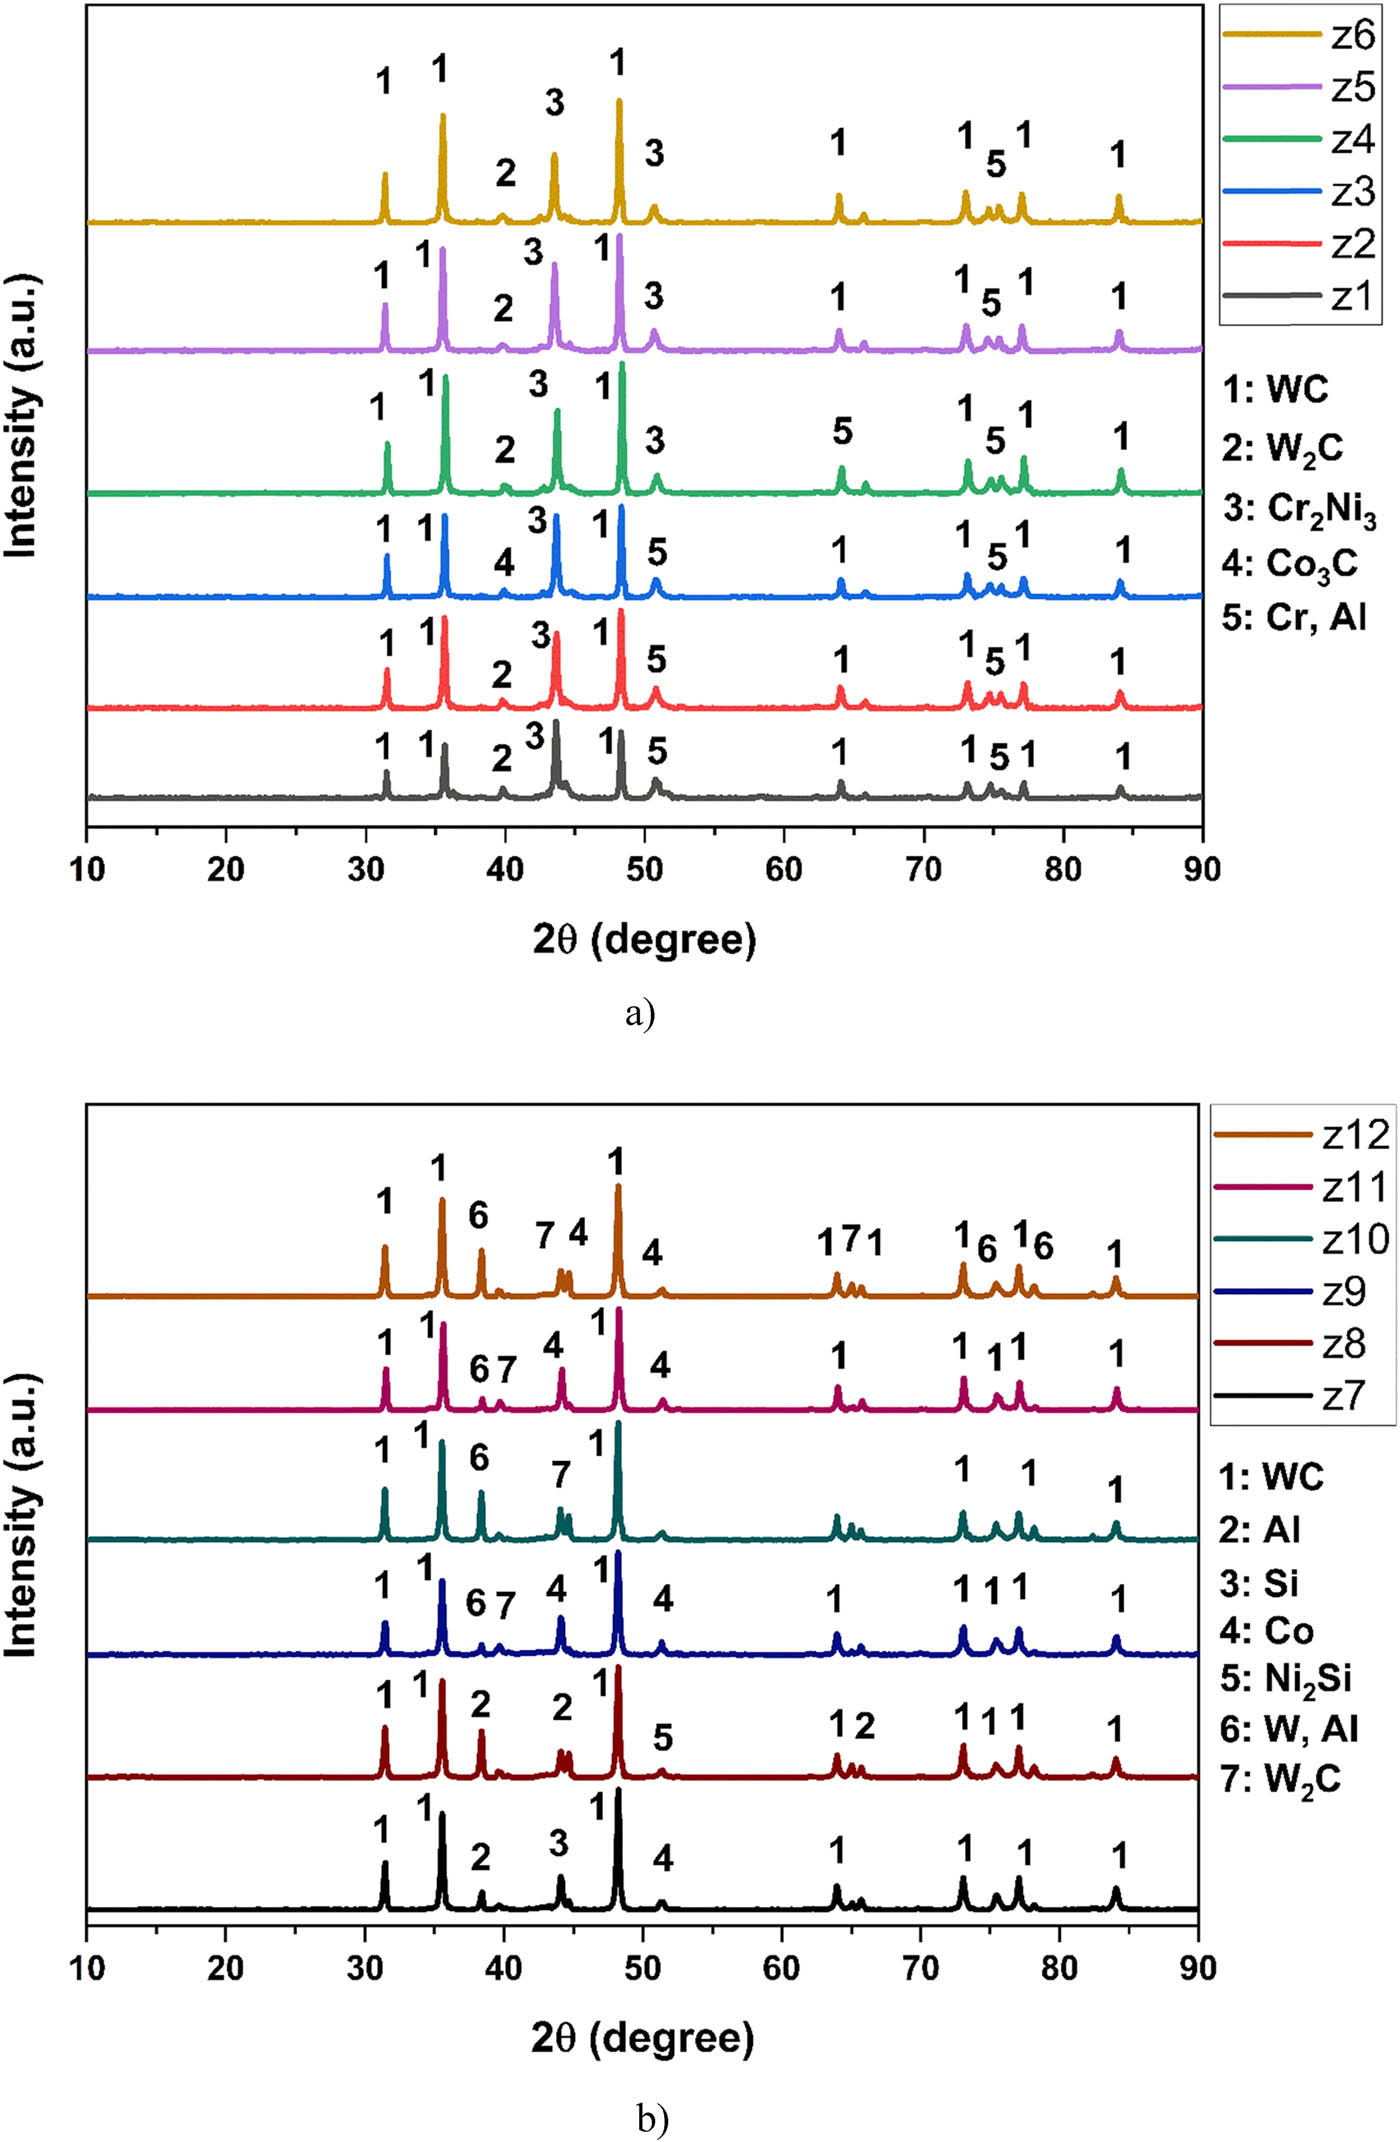
XRD analysis of samples after HVOF process samples (a) z1–z6 and (b) z7–z12.
Figure 6 illustrates the change in hardness with parameters. The measurements were obtained from three different regions of z1–z12 samples after coating. The hardness values varied with the difference in powder contents. Specifically, the coatings coated with P1 powder exhibited higher hardness values. This can be attributed to the higher density of P1 powder and the presence of hard phases (WC) in its content, as indicated in Somasundaram et al., Picas et al., and Hajare and Gogte [16,19,20]. Changes in process parameters have been found to affect the hardness values of coatings [29,30]. Specifically, an increase in the number of passes in the coating process led to an increase in the amount of hard powders on the surface, increasing the coating hardness [20,23]. With each additional pass, the coating thickness increases, leading to a denser and harder coating. This is because multiple passes ensure that more material is deposited, filling in any voids and creating a more uniform and compact layer. Also, more passes mean more particles impacting the surface, which can lead to work hardening. This process increases the hardness of the coating as the particles deform the surface and create a denser structure. Additional passes help in reducing porosity by filling in gaps and voids in the coating. A lower porosity level generally correlates with higher hardness, as the material is more compact and less prone to deformation [22,30,33].
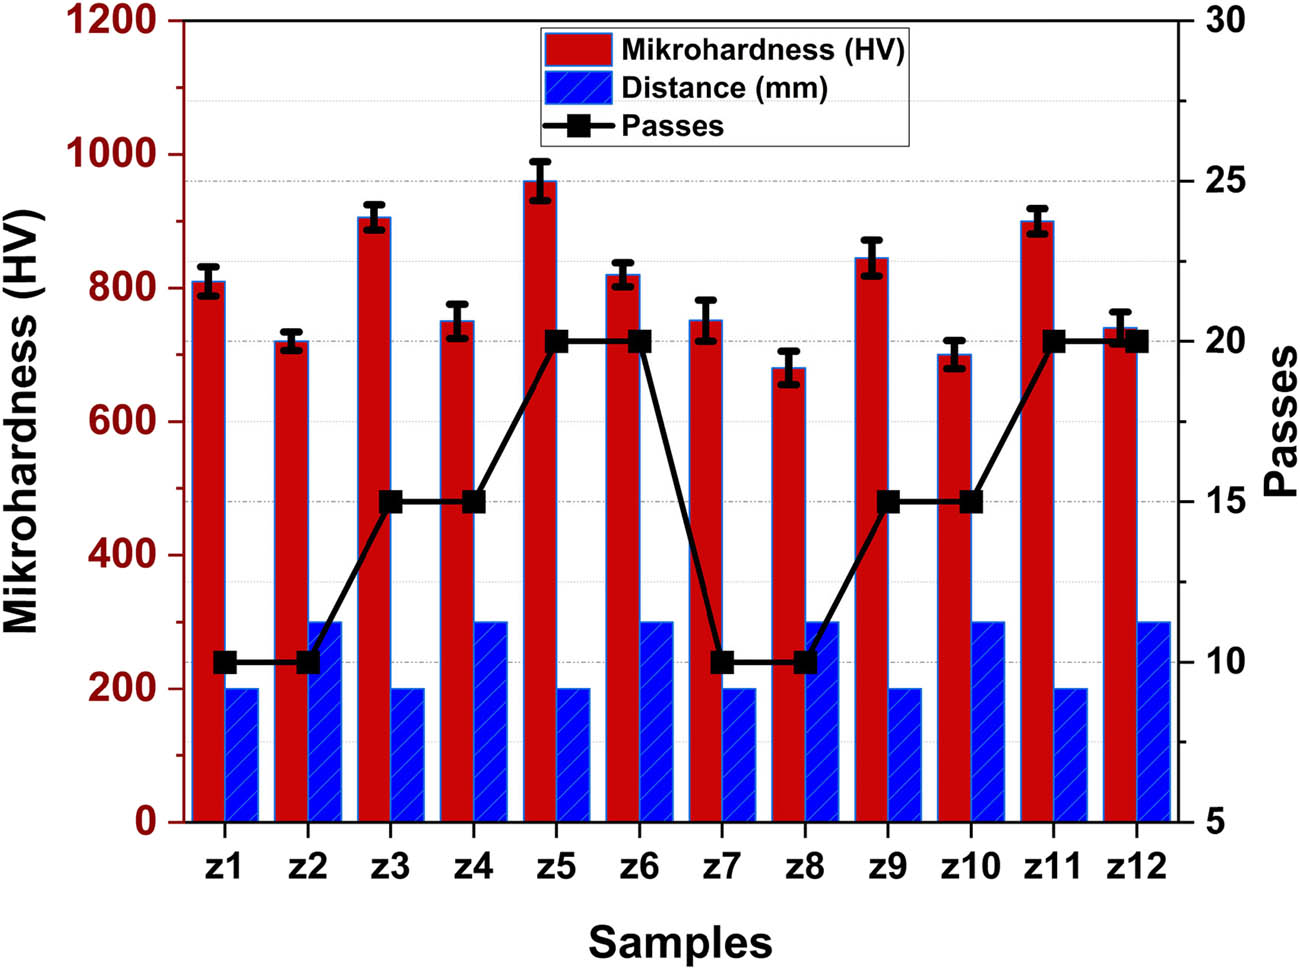
Hardness values of coated samples for different parameters.
On the other hand, changes in spray distance were also found to impact hardness values. An increase in spray distance decreased hardness values because it reduced the density of coating powders [20,25,26]. The highest average hardness values were measured for samples z5 and z11, which were 960 and 900 HV, respectively. These values were obtained at a spray distance of 200 mm and after 20 passes. For example, a decrease in the spray distance from 300 to 200 m in the z6 sample increased the hardness from 820 HV to 960 HV [25]. Some researchers claim that the difference is due to issues with the focus between the sample and the spray [5,15]. It has been observed that changes in the chemical composition can affect the hardness values [17,18,19,20,25]. The hardness value of a coating layer increases due to the formation of new, complex and brittle phases. However, the presence of oxidised and carbide phases on the surface improves the mechanical properties of the coating layer [10,12]. According to the literature, a homogeneous and dense coating that is well bonded to the substrate contributes to high hardness. The WC hard phase has H and E values of approximately 24 and 680 GPa, respectively. Additionally, the coating layer has fewer internal defects and lower porosity values, which are crucial in achieving high hardness values [29,30,31].
Figure 7a and b illustrates the results of the samples’ friction coefficient and WR calculations. The key finding from these results is that varying surface hardness values contribute to differences in surface wear resistance and friction coefficients. The friction coefficient values range from 0.3 to 0.59. The lowest coefficient of friction was observed in sample Z5, while the highest values were found in samples Z2 (P1 powder) and Z8 (P2 powder). In the wear tests, the increase in load had an impact on the friction coefficient values. As the WR increased, the coefficient also increased, reaching a maximum value of 0.57. Initially, WC coating showed an increasing trend followed by a steady-state rate. While this coating increases initially, a decreasing trend occurs, and subsequently it becomes stable. An increment in the friction coefficient can be associated with higher shear stresses at the initial stage due to a smaller contact area between the two mating surfaces. As the sliding time increases, the actual contact area increases, resulting in a stable coefficient of friction [21,26,33]. It is not always the case that increases in the wear load and WR will lead to higher friction coefficient values. The opposite can happen, where the worn products get plastered on the surface, causing a decrease in wear values [27,34].
Previous studies have indicated that oxide wear products often adhere to the surface during testing, which lowers the friction coefficient values [25,26,27,28,29,30,31,32,33,34]. While experimental conditions may show a slight increase in the friction coefficient with higher loads and speeds, this increase is generally not significant. In some cases, research findings indicate a decreasing trend instead [15,19,21,29]. Recent studies have demonstrated that the rate at which materials wear down largely depends on the roughness of their surfaces [27,30,31]. As wear increases, surface roughness typically decreases, which in turn affects the coefficient of friction. When conducting wear tests, it is observed that the coefficient of friction tends to rise with an increase in load. However, this trend does not always hold at higher wear speeds. At elevated speeds, there is often reduced contact with the surface, which can lead to a slight decrease or stabilisation of the coefficient of friction. Additionally, the adhesion of wear products to the surface can complicate the establishment of contact [35,36].
In terms of the influence of load and speed on wear, it has been found that load has a more significant effect on the WR than speed [24,25,26]. In our study, while the coefficient of friction increased with higher loads, it either remained the same or decreased with increasing speed.
Hardness (H) is the primary mechanical property that determines the wear resistance of materials, while the modulus of elasticity (E) also plays a role in this resistance. A high H/E ratio indicates that a material has good wear resistance. An appropriate combination of hardness and modulus can help minimise interfacial stress discontinuities in a layer/substrate system. This allows the layer to flex in unison with the substrate when applying a normal load. A greater H/E ratio increases the potential for elastic deformation, which can enhance the tribological performance [30,34].
After examining the WR values of several samples, it was found that the z5 and z11 samples had the lowest WR values. This was because the z5 sample was coated under ideal coating parameters. The tests were conducted under specific conditions involving a sliding distance of 400 m, a 2 N load, and a velocity of 0.1 m·s−1. The WR increased when the test conditions were modified [15,19]. Additionally, there was a noticeable change in the wear resistance with increased speed. The z2 (P1) and z11 (P2) samples had the highest WR when tested at a speed of 0.2 m·s−1 under a 3N. After examining the WR values of several samples, it was determined that the z5 and z11 samples exhibited the lowest WRs. The z5 sample achieved this due to being coated under optimal coating conditions. The tests were conducted under controlled conditions, which included a specific sliding distance of 400 m. Under the applied load, samples z5 (P1) and z11 (P2) exhibited the lowest wear rates. After examining the WR values of several samples, it was found that the z5 and z11 samples exhibited the lowest WRs. This was attributed to the z5 sample being coated under ideal coating parameters. The tests were conducted under specific conditions, which included a sliding distance of 400 m, a load of 2 N, and a velocity of 0.1 m·s−1. When the test conditions were modified, the WR increased [15,19]. Additionally, a noticeable change in wear resistance was observed with increased speed. The z2 (P1) and z11 (P2) samples showed the highest WRs when tested at a speed of 0.2 m·s−1 under a 3 N load, whereas the z5 (P1) and z11 (P2) samples maintained the lowest WRs.
During the wear tests, it was observed that an increase in speed resulted in greater surface deformation, which in turn led to elevated wear values. The hard and brittle nature of the surfaces also contributed slightly to the higher wear values. Previous studies have demonstrated that increasing the load results in a higher WR [29,31]. As the load was increased during the experiment, particles from the oxide coating broke away from the surface and became embedded, causing a slight decrease in wear values [20,27]. However, the oxide particles embedded on the surface and the increasing wear products tended to reduce wear over time. This phenomenon is illustrated in Figure 7 and is supported by previous studies [7,8,12,18,22,35].
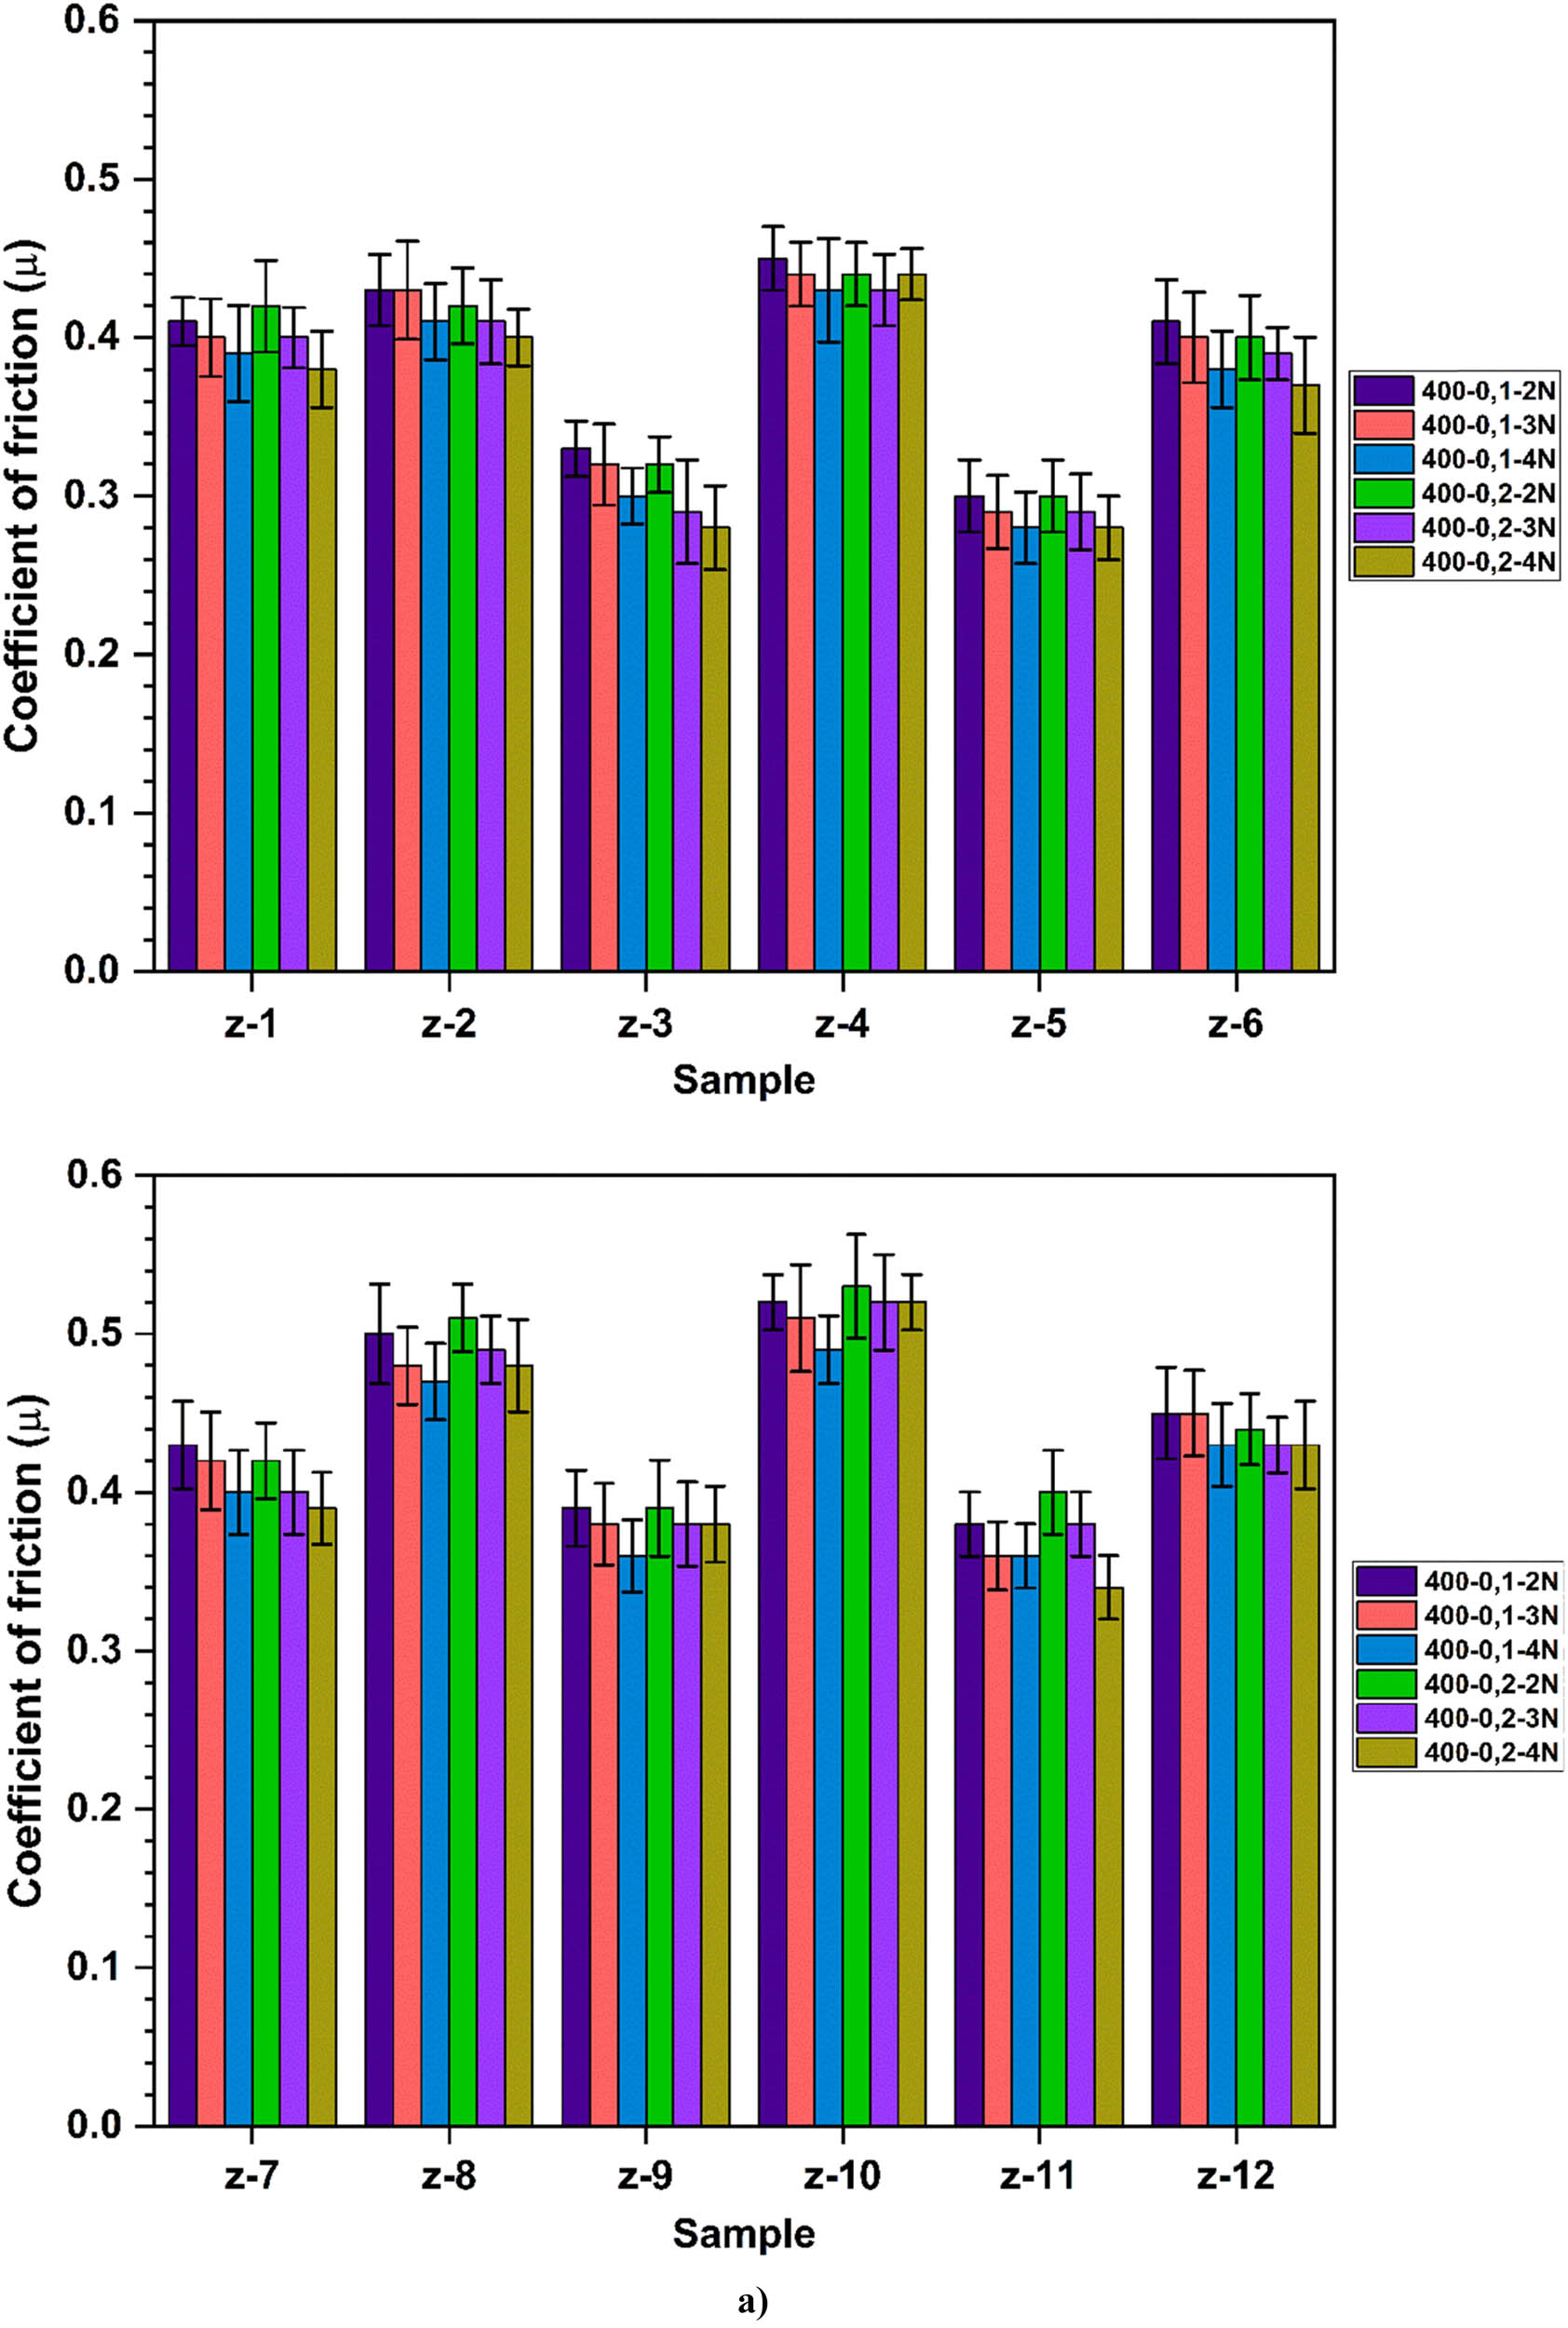
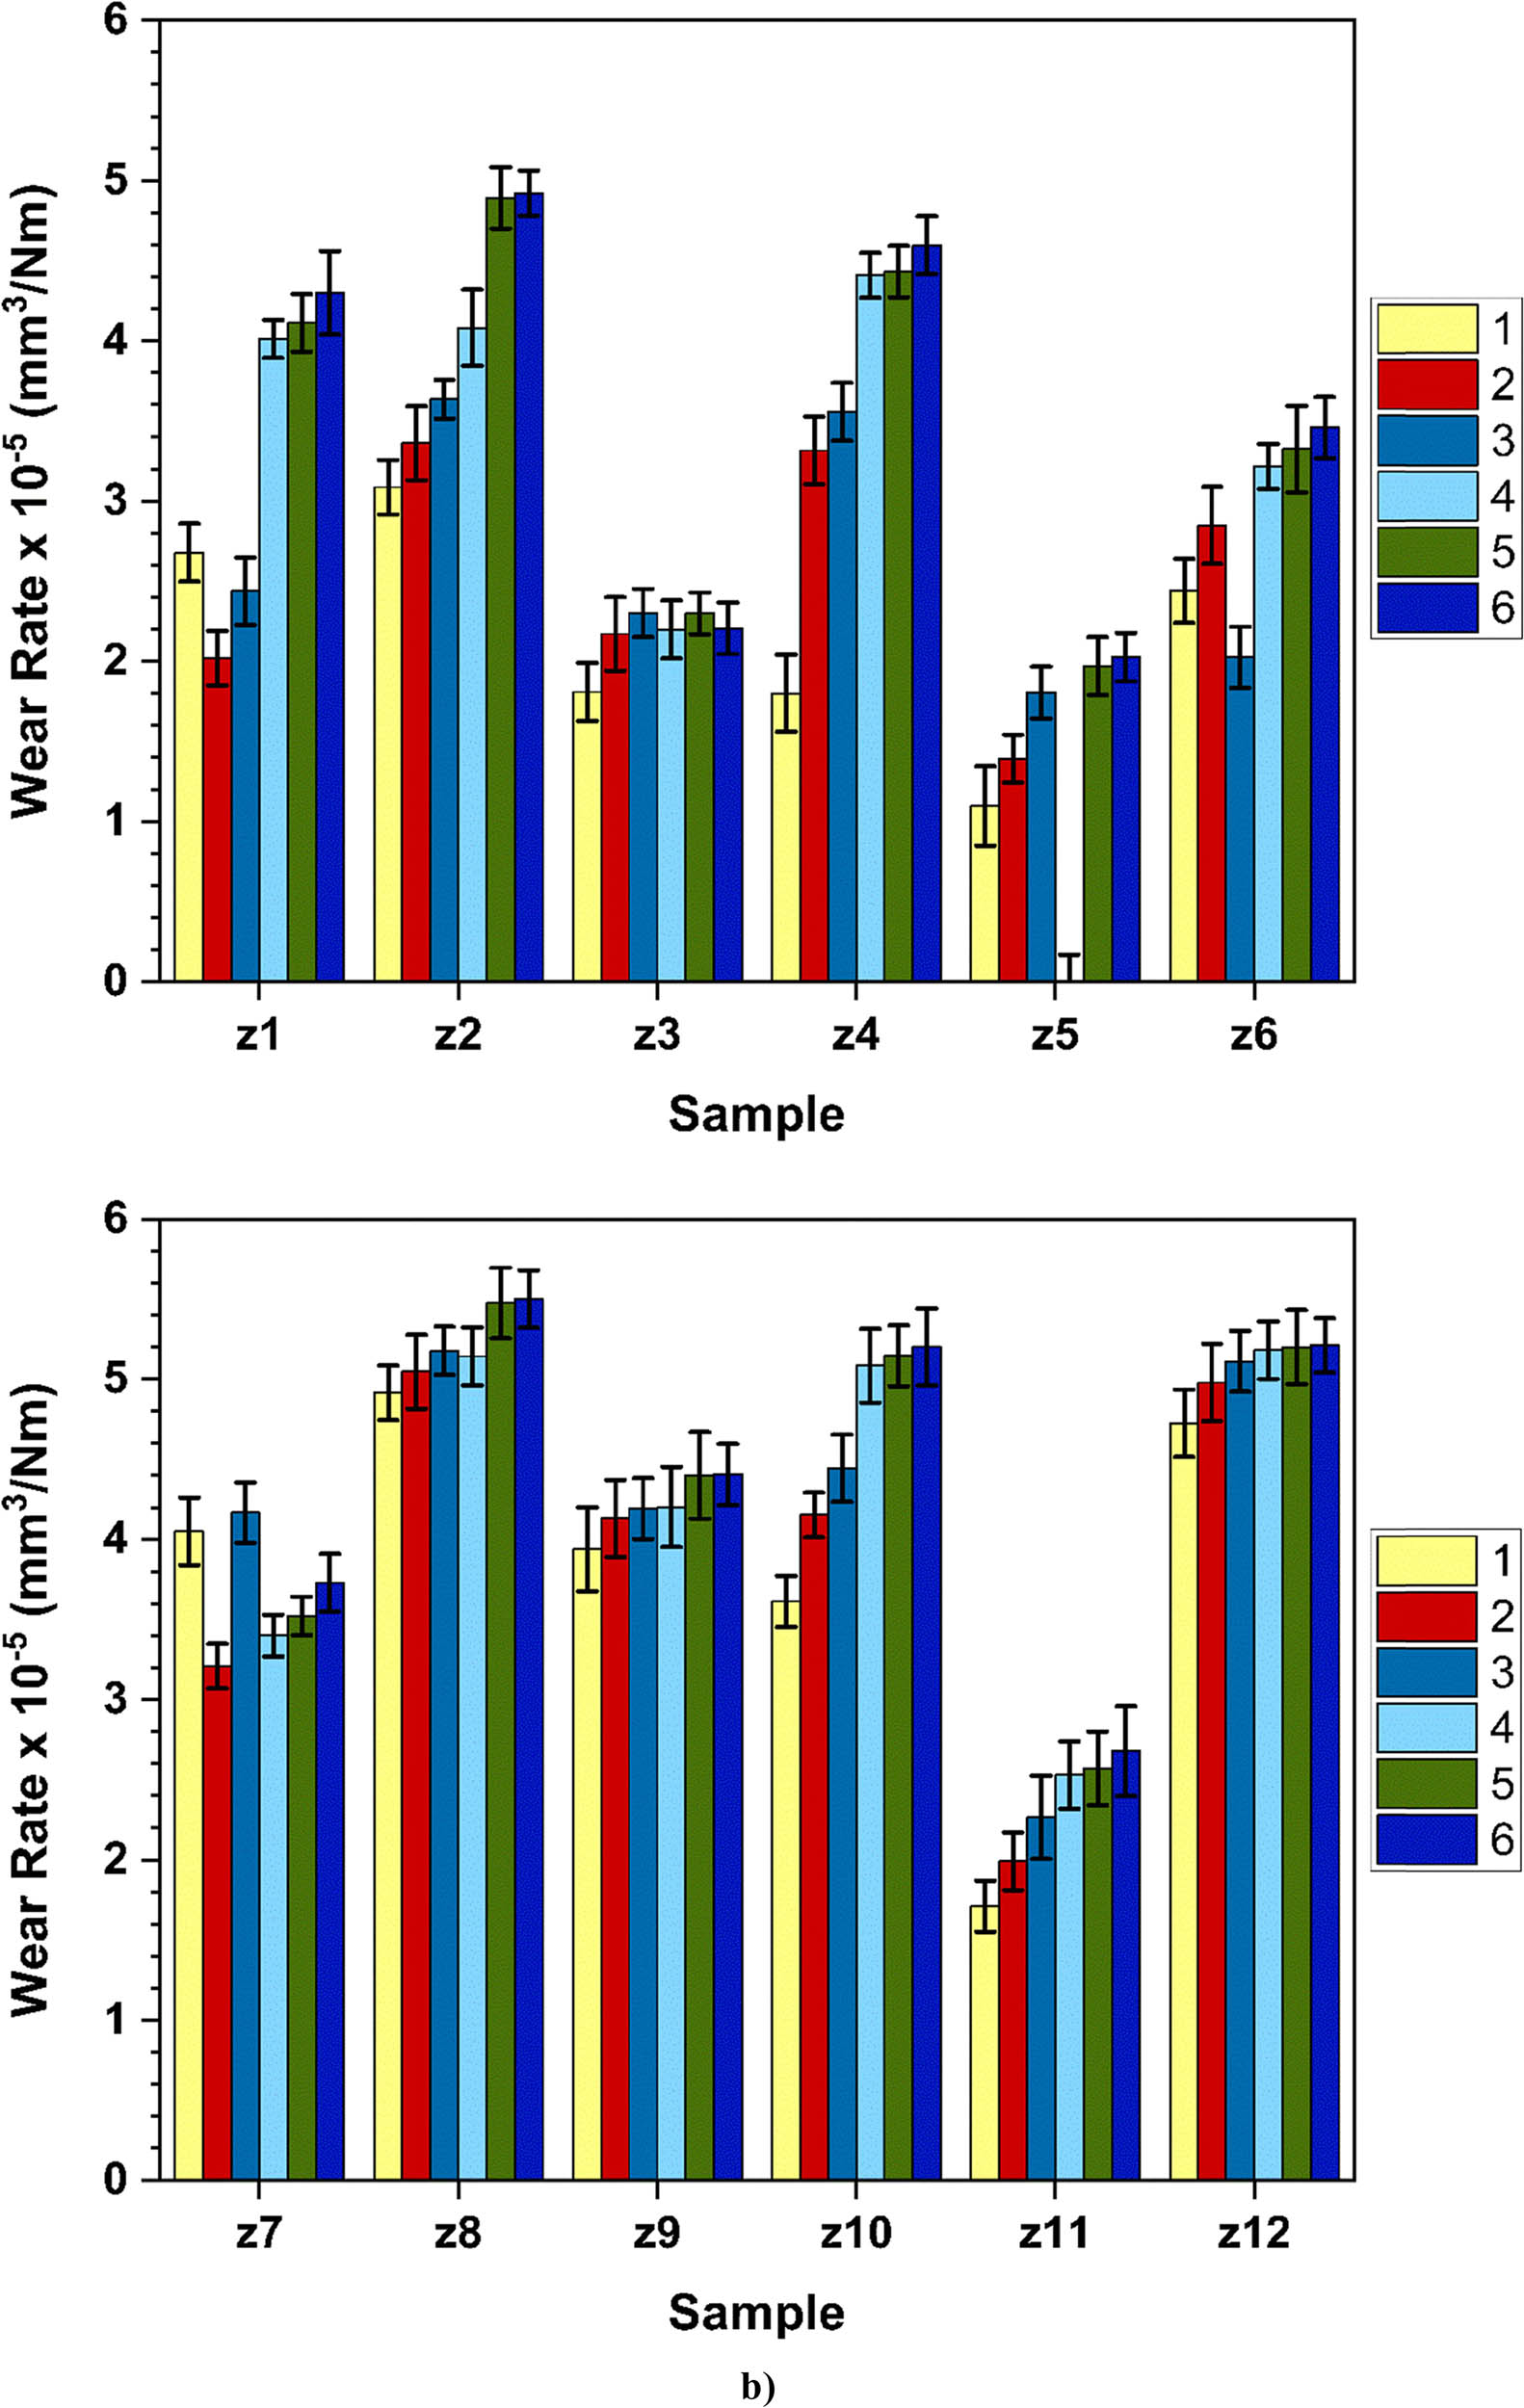
(a) Results of the friction coefficient-sliding distance of samples after the wear test (distance, rate, and load) and (b) WR of coated samples.
The inclusion of hard phases like WC in coating powders enhances performance. Furthermore, phases high in Cr and Co have been shown to improve the wear resistance. For WC–Co-based powders, tribo-films made up of tungsten trioxide (WO3) were noted on the surface. The oxidised tribo-film creates a layer over the wear tracks, effectively filling any delaminated areas and pores within the coating. The presence of oxygen suggests that oxidation could play a role in forming wear debris. This tribo-film helps reduce friction and wear by offering low shear strength during sliding movements [36]. Compounds such as WO3 exhibit excellent lubricating properties. Furthermore, the wear products that detach from the surface often appear as oxides, which are thought to enhance the wear resistance. The single-phase oxides such as Cr2O3, WO3, and CoO, along with binary-phase oxides like CoWO4, Cr2WO6, CrWO4, and NiWO4, are frequently observed in WC-based coatings [37,38]. The single-phase oxides, such as Cr2O3, WO3, and CoO, along with binary-phase oxides like CoWO4, Cr2WO6, CrWO4, and NiWO4, are commonly found in WC-based coatings. With reduced friction, a smaller force is applied to the surface of the sample, resulting in less energy being released as heat. Excessive heating due to friction can raise component surface temperatures to dangerous levels, resulting in softening and deformation. When the load or speed is increased during a wear experiment, the temperature rises due to the sliding motion. This increase in temperature causes the material in the matrix to soften. As the temperature continues to rise, an oxide layer forms on the surface, composed of various metals such as W, Co, and Cr [39]. This oxide layer smooths the surface and reduces the friction coefficient, as noted in studies of Wei et al., Picas et al., Wang et al., Russel et al., and Song et al. [15,19,23,27,30]. When we look at the wear results of the z9 and z11 samples, there is not a slight difference. z11 WR is much lower than that of z9. According to the Archard equation (V = {K W L}/{H}), the coefficient of friction is not the only factor influencing the amount of wear. Hardness and the wear products that detach from the surface also play significant roles in determining the wear quantity. Consequently, excessive fragmentation of coating powders on the surface during wear can sometimes lead to discrepancies in the wear amounts predicted by formulas [37,40].
During wear tests, several observations were made regarding the wear trace, as illustrated in Figure 8a–f. It was noted that tiny shivers and transverse microcracks appeared on the wear surface. Additionally, some plastic deformation was observed on the worn area. The tests also resulted in the formation of long, thin grooves, and images revealed the presence of generated wear debris (Figure 8a–c). Furthermore, it was noted that a small amount of adhesion wear occurred due to the rapid removal of carbide particles, as depicted in Figure 8e and f. The worn surface of the coated steel exhibits flakes, oxides, and minor scars in certain areas, which can be attributed to adhesion and tribo-oxidation interactions. Studies have shown that hard surfaces treated with coatings can develop surface cracks and ruptures due to their brittle nature [38,39,40]. Even a few cracks can lead to delamination layers, resulting in the creation of fine wear debris. In contrast, relatively coarse and coaxial debris can also be observed on the surface (Figure 8c and d). [10,12,29]. Hard phases within the coating layer are essential for reducing wear, as highlighted in Tribhuwan and Mishra, Wang et al., and Leyland and Mathews [22,23,24]. Worn surface images (Figure 8e and f) reveal flattened asperities and areas that have undergone plastic deformation. Additionally, ploughing and abrasion features are evident in Figure 8g. This can be explained by the occurrence of debris particles that become trapped between the pin and the groove. These particles can lead to increased volume loss due to their rolling and rubbing actions [29,30,31,32]. Hanief et al. observed that carbide oxidation occurred during sliding tests [35,36,37,38]. This oxidation may lead to the formation of a thin protective film on the coating. Furthermore, increased heating at the interface promotes oxidation at higher loads. Consequently, developing a protective oxide layer under high loads can result in a reduced friction coefficient [36,39,40].
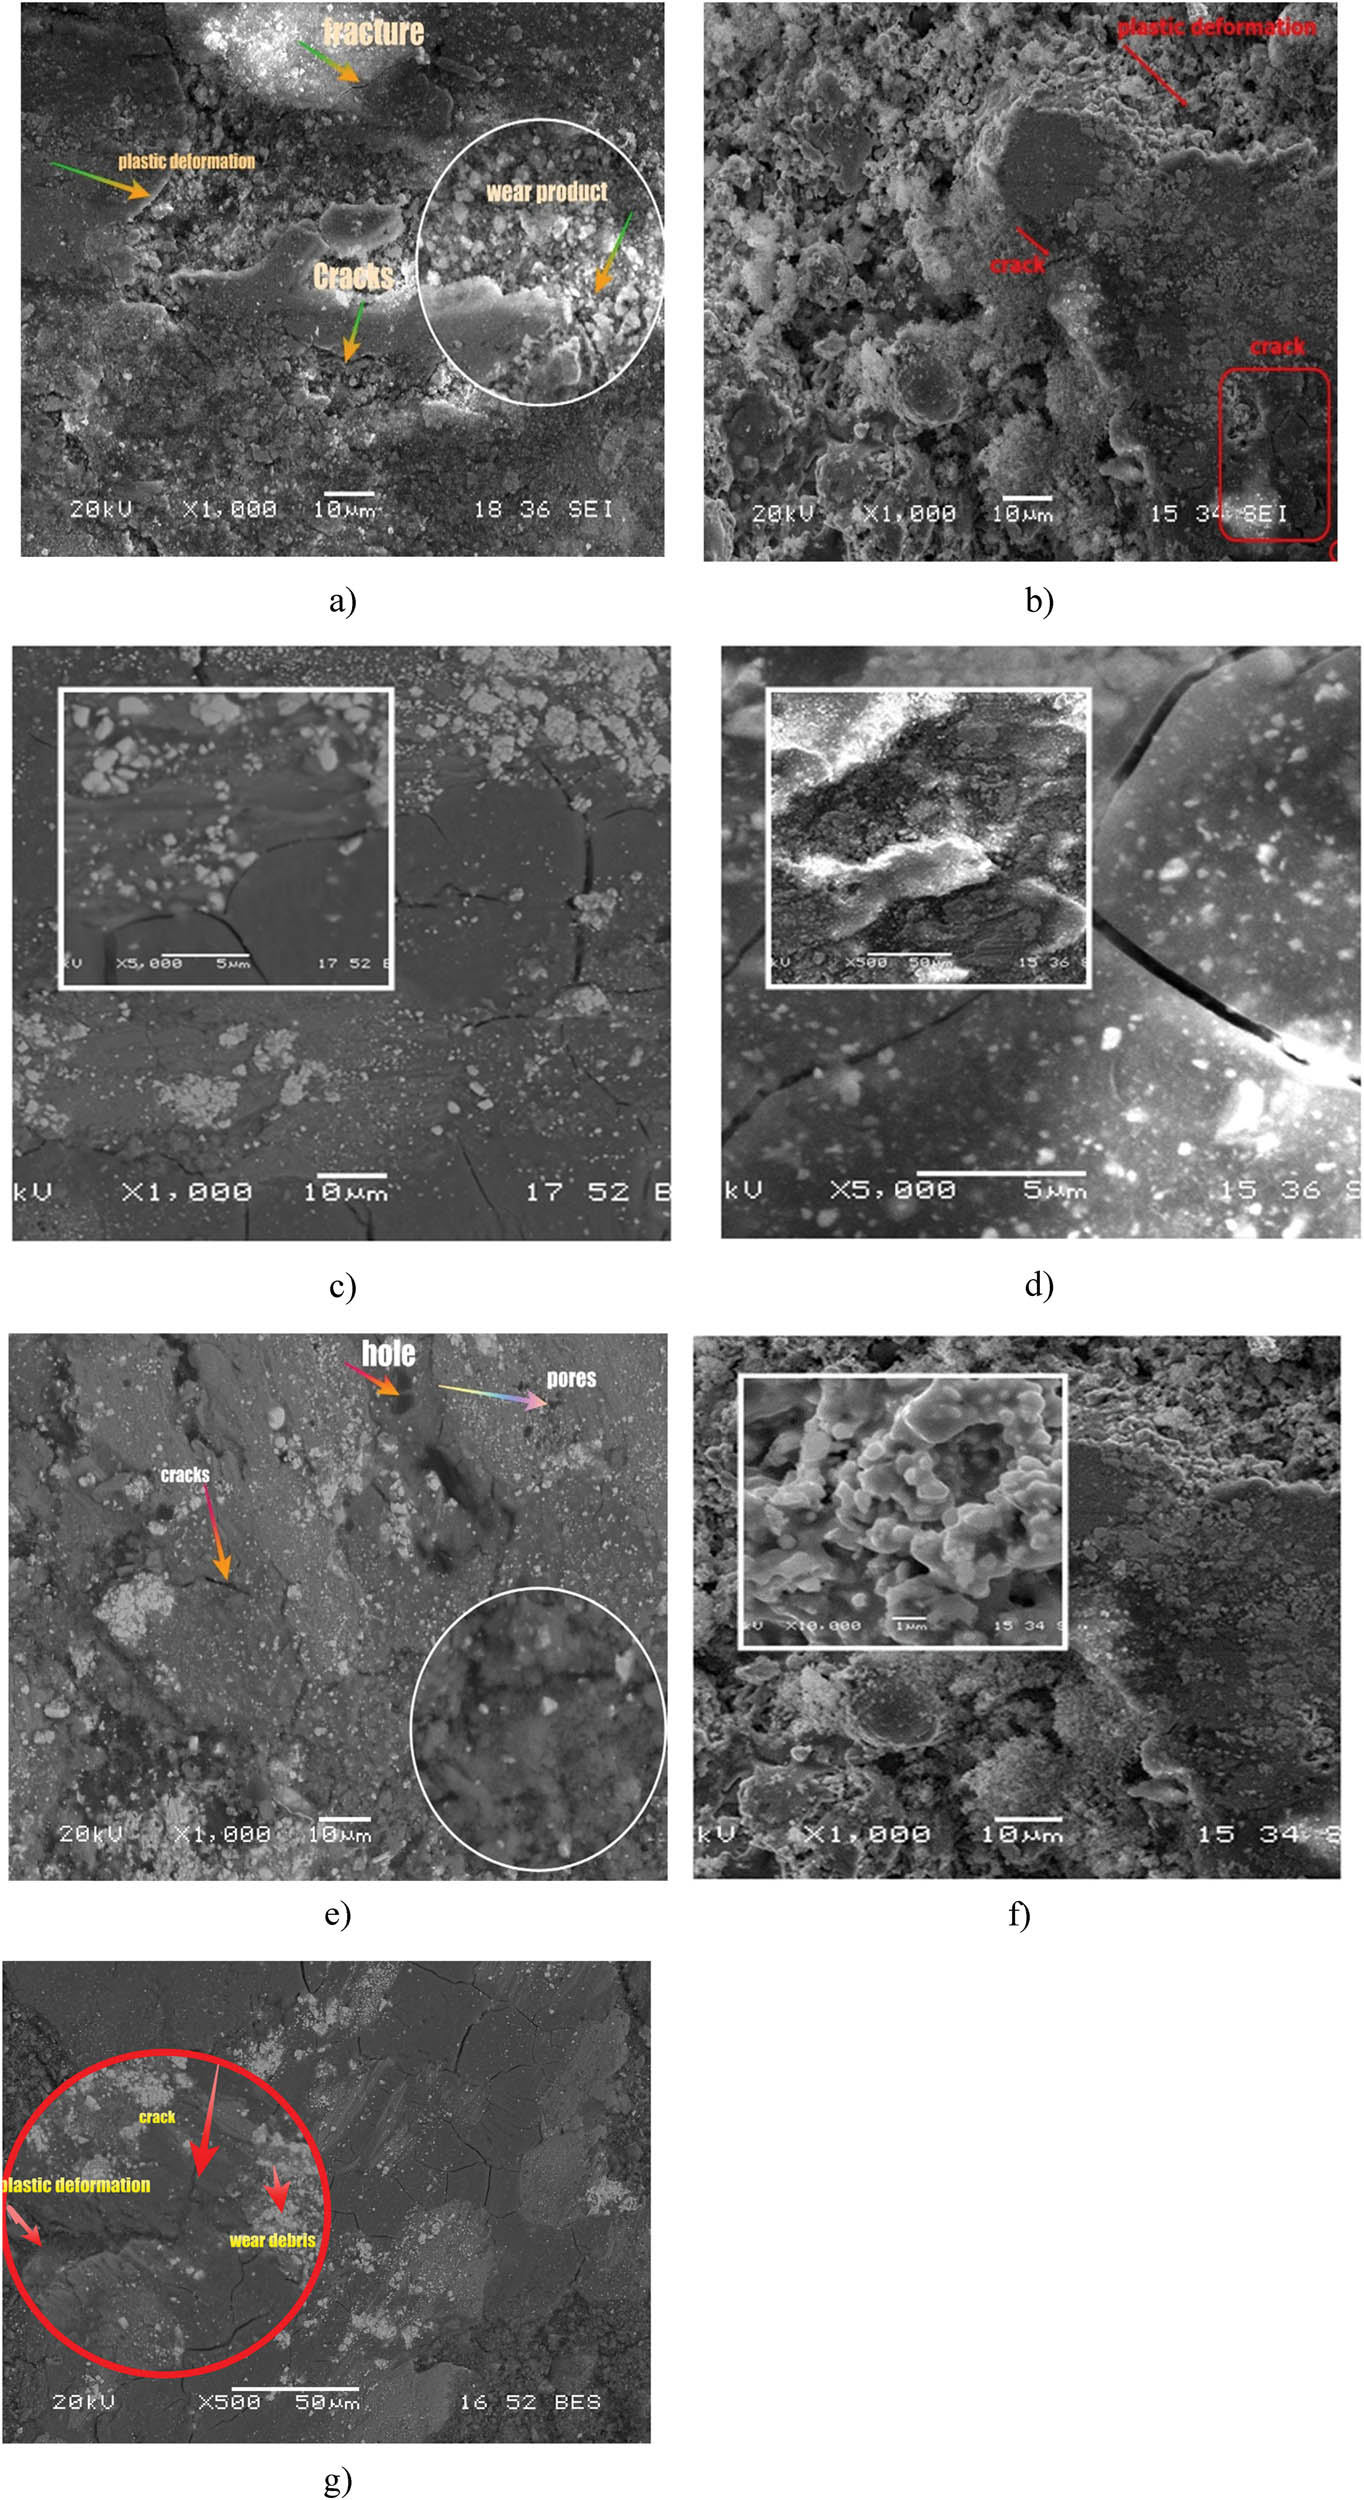
SEM images of the worn surface of samples (a) z1, (b) z3, (c) z4, (d) z7, (e) z8, (f) z9, and (g) z10.
Tribo-oxidation mechanisms contribute to surface protection during sliding by forming oxide layers that act as solid lubricants, thermal barriers, and wear-resistant films. Under sliding contact, frictional heating promotes the formation of oxides such as Cr₂O₃, depending on the material system. These oxides can reduce direct metal-to-metal contact, thereby lowering friction and WRs [41,42]. Additionally, some tribo-oxidised surfaces exhibit self-healing behaviour, where the oxide layer fills microcracks or defects, maintaining surface integrity during prolonged sliding. The formation of quasi-viscous transfer layers and partially ductile subsurface oxides further enhances the material’s ability to adapt to harsh tribological conditions, offering both mechanical protection and chemical stability [42,43].
We can see the surface deformation patterns after examining the 3D profilometer images of the wear marks shown in Figure 9a and b. The x-axis typically denotes the length, while the y-axis denotes the width. Together, they form a grid that maps the surface area. The z-axis represents the vertical dimension, indicating the height or depth of the surface features. The z-axis measures the deviations from a reference plane, showing the peaks and valleys of the surface.
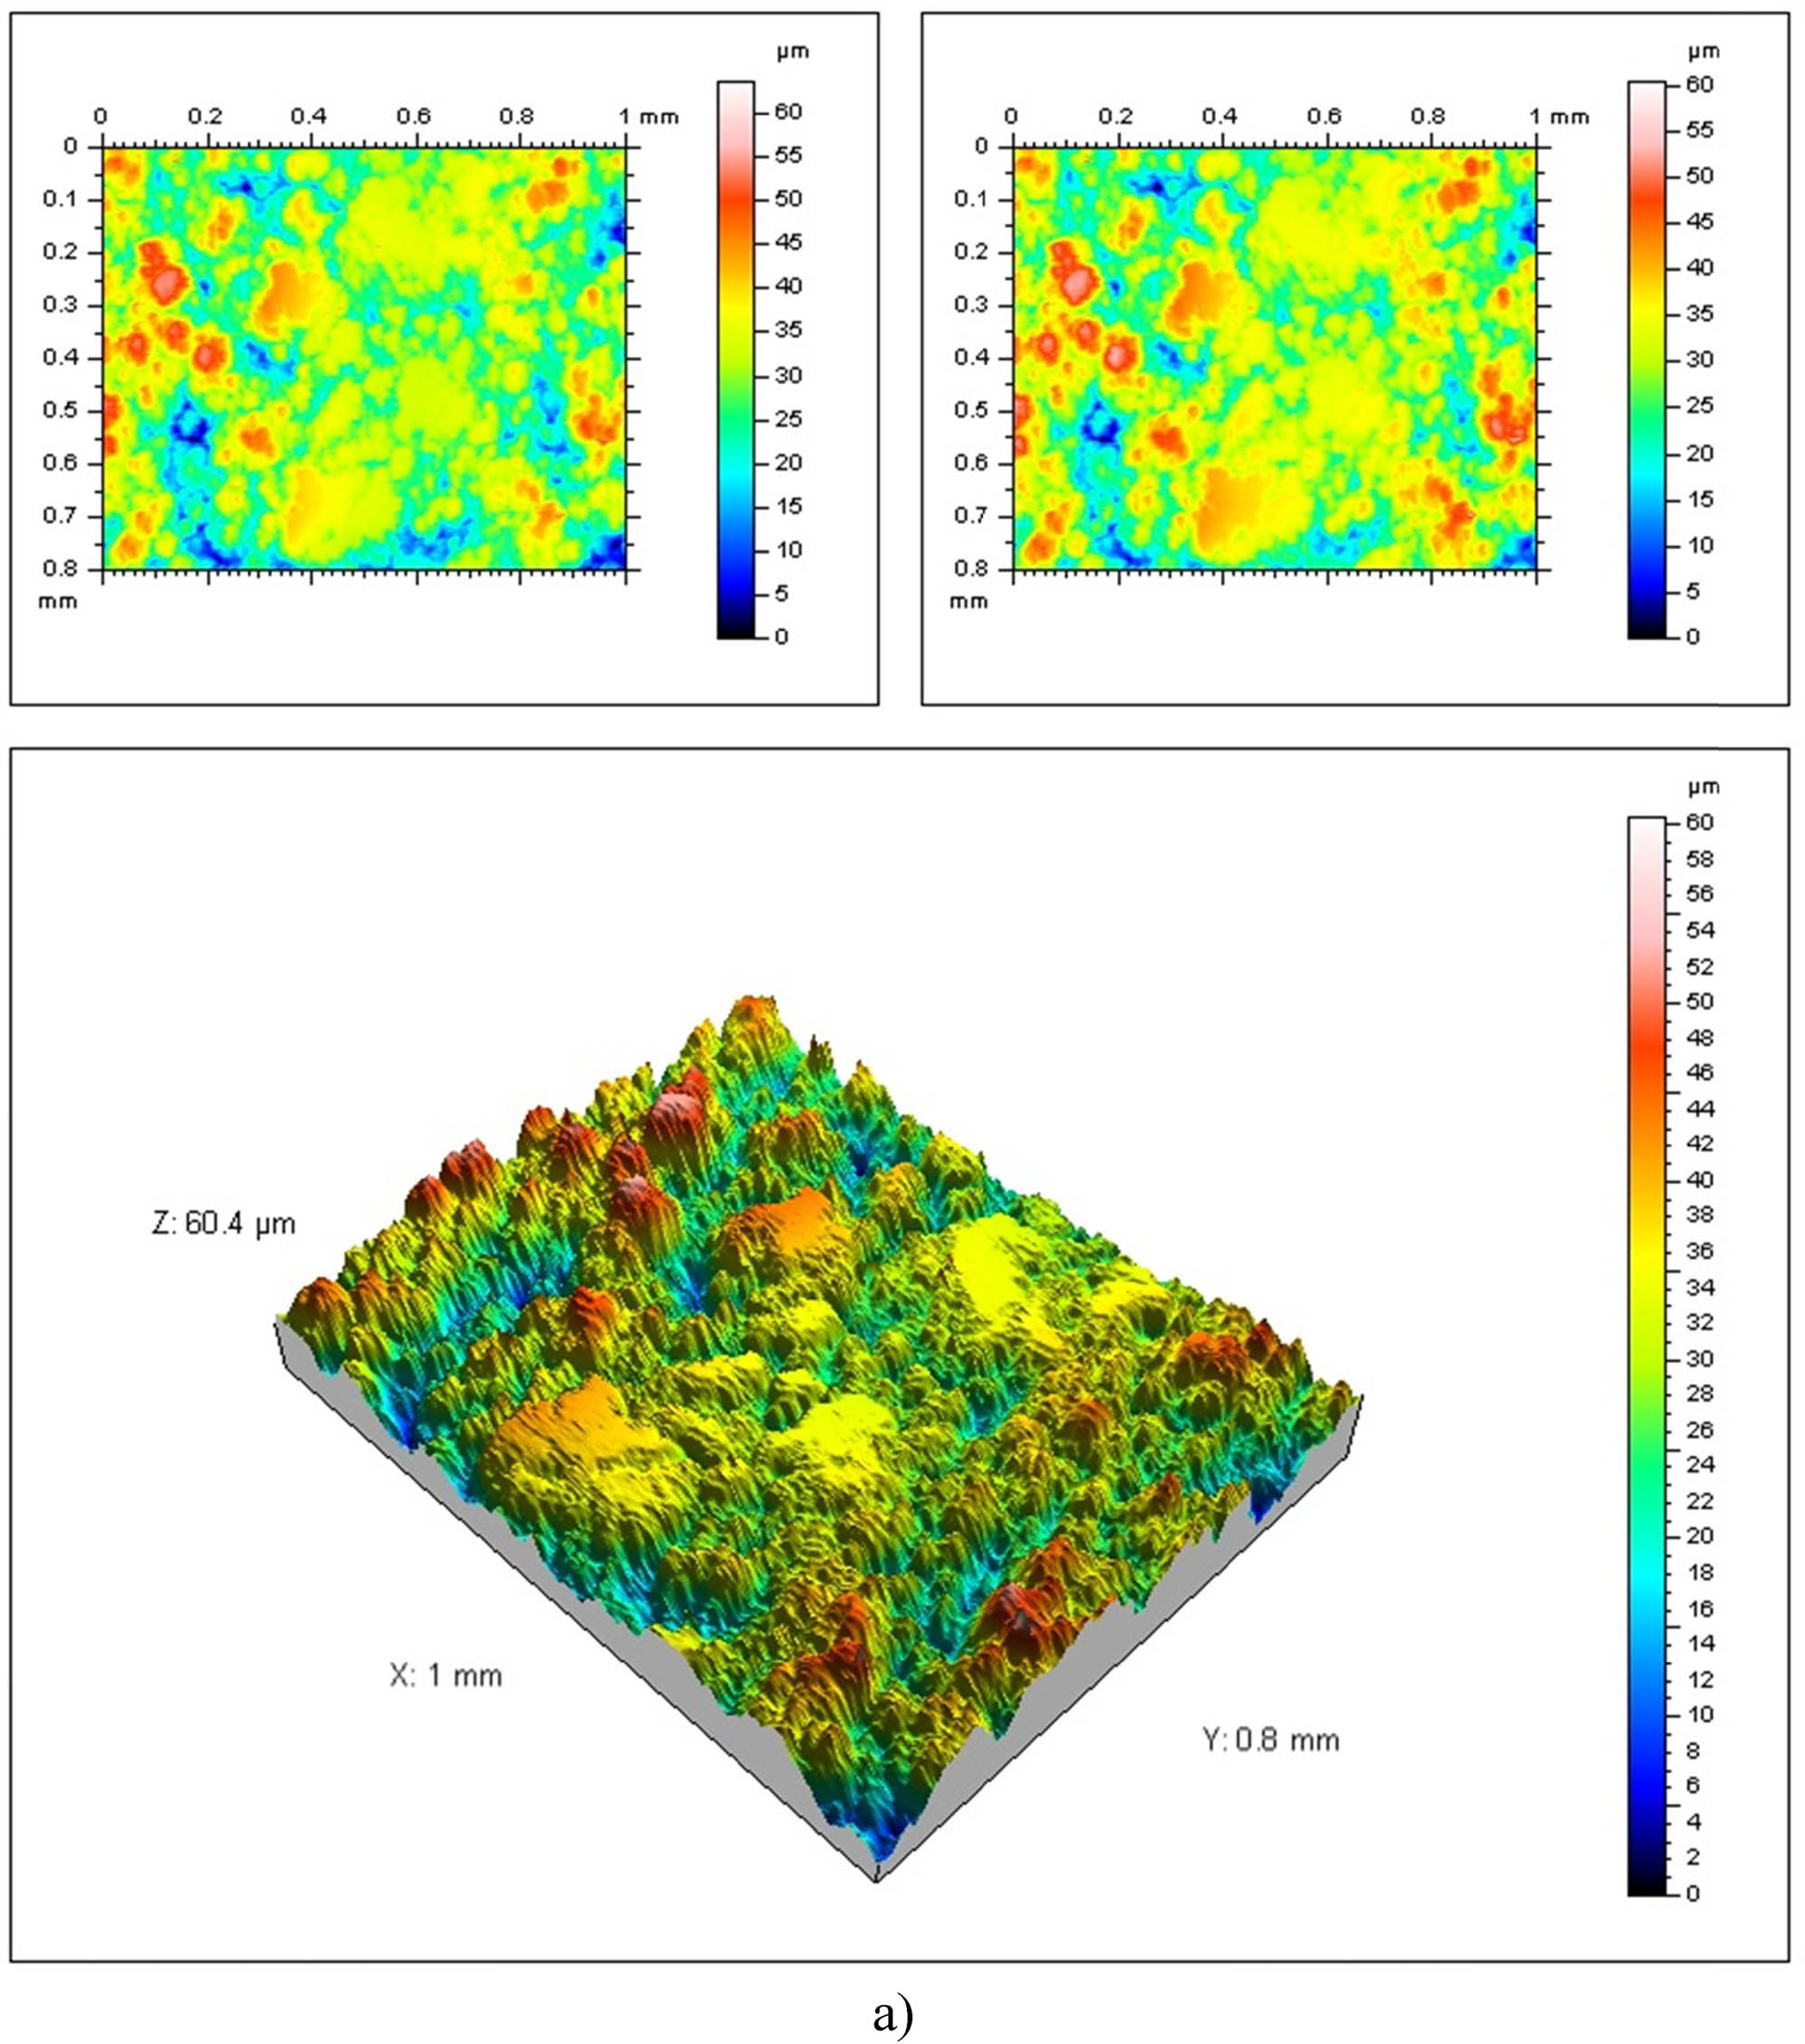
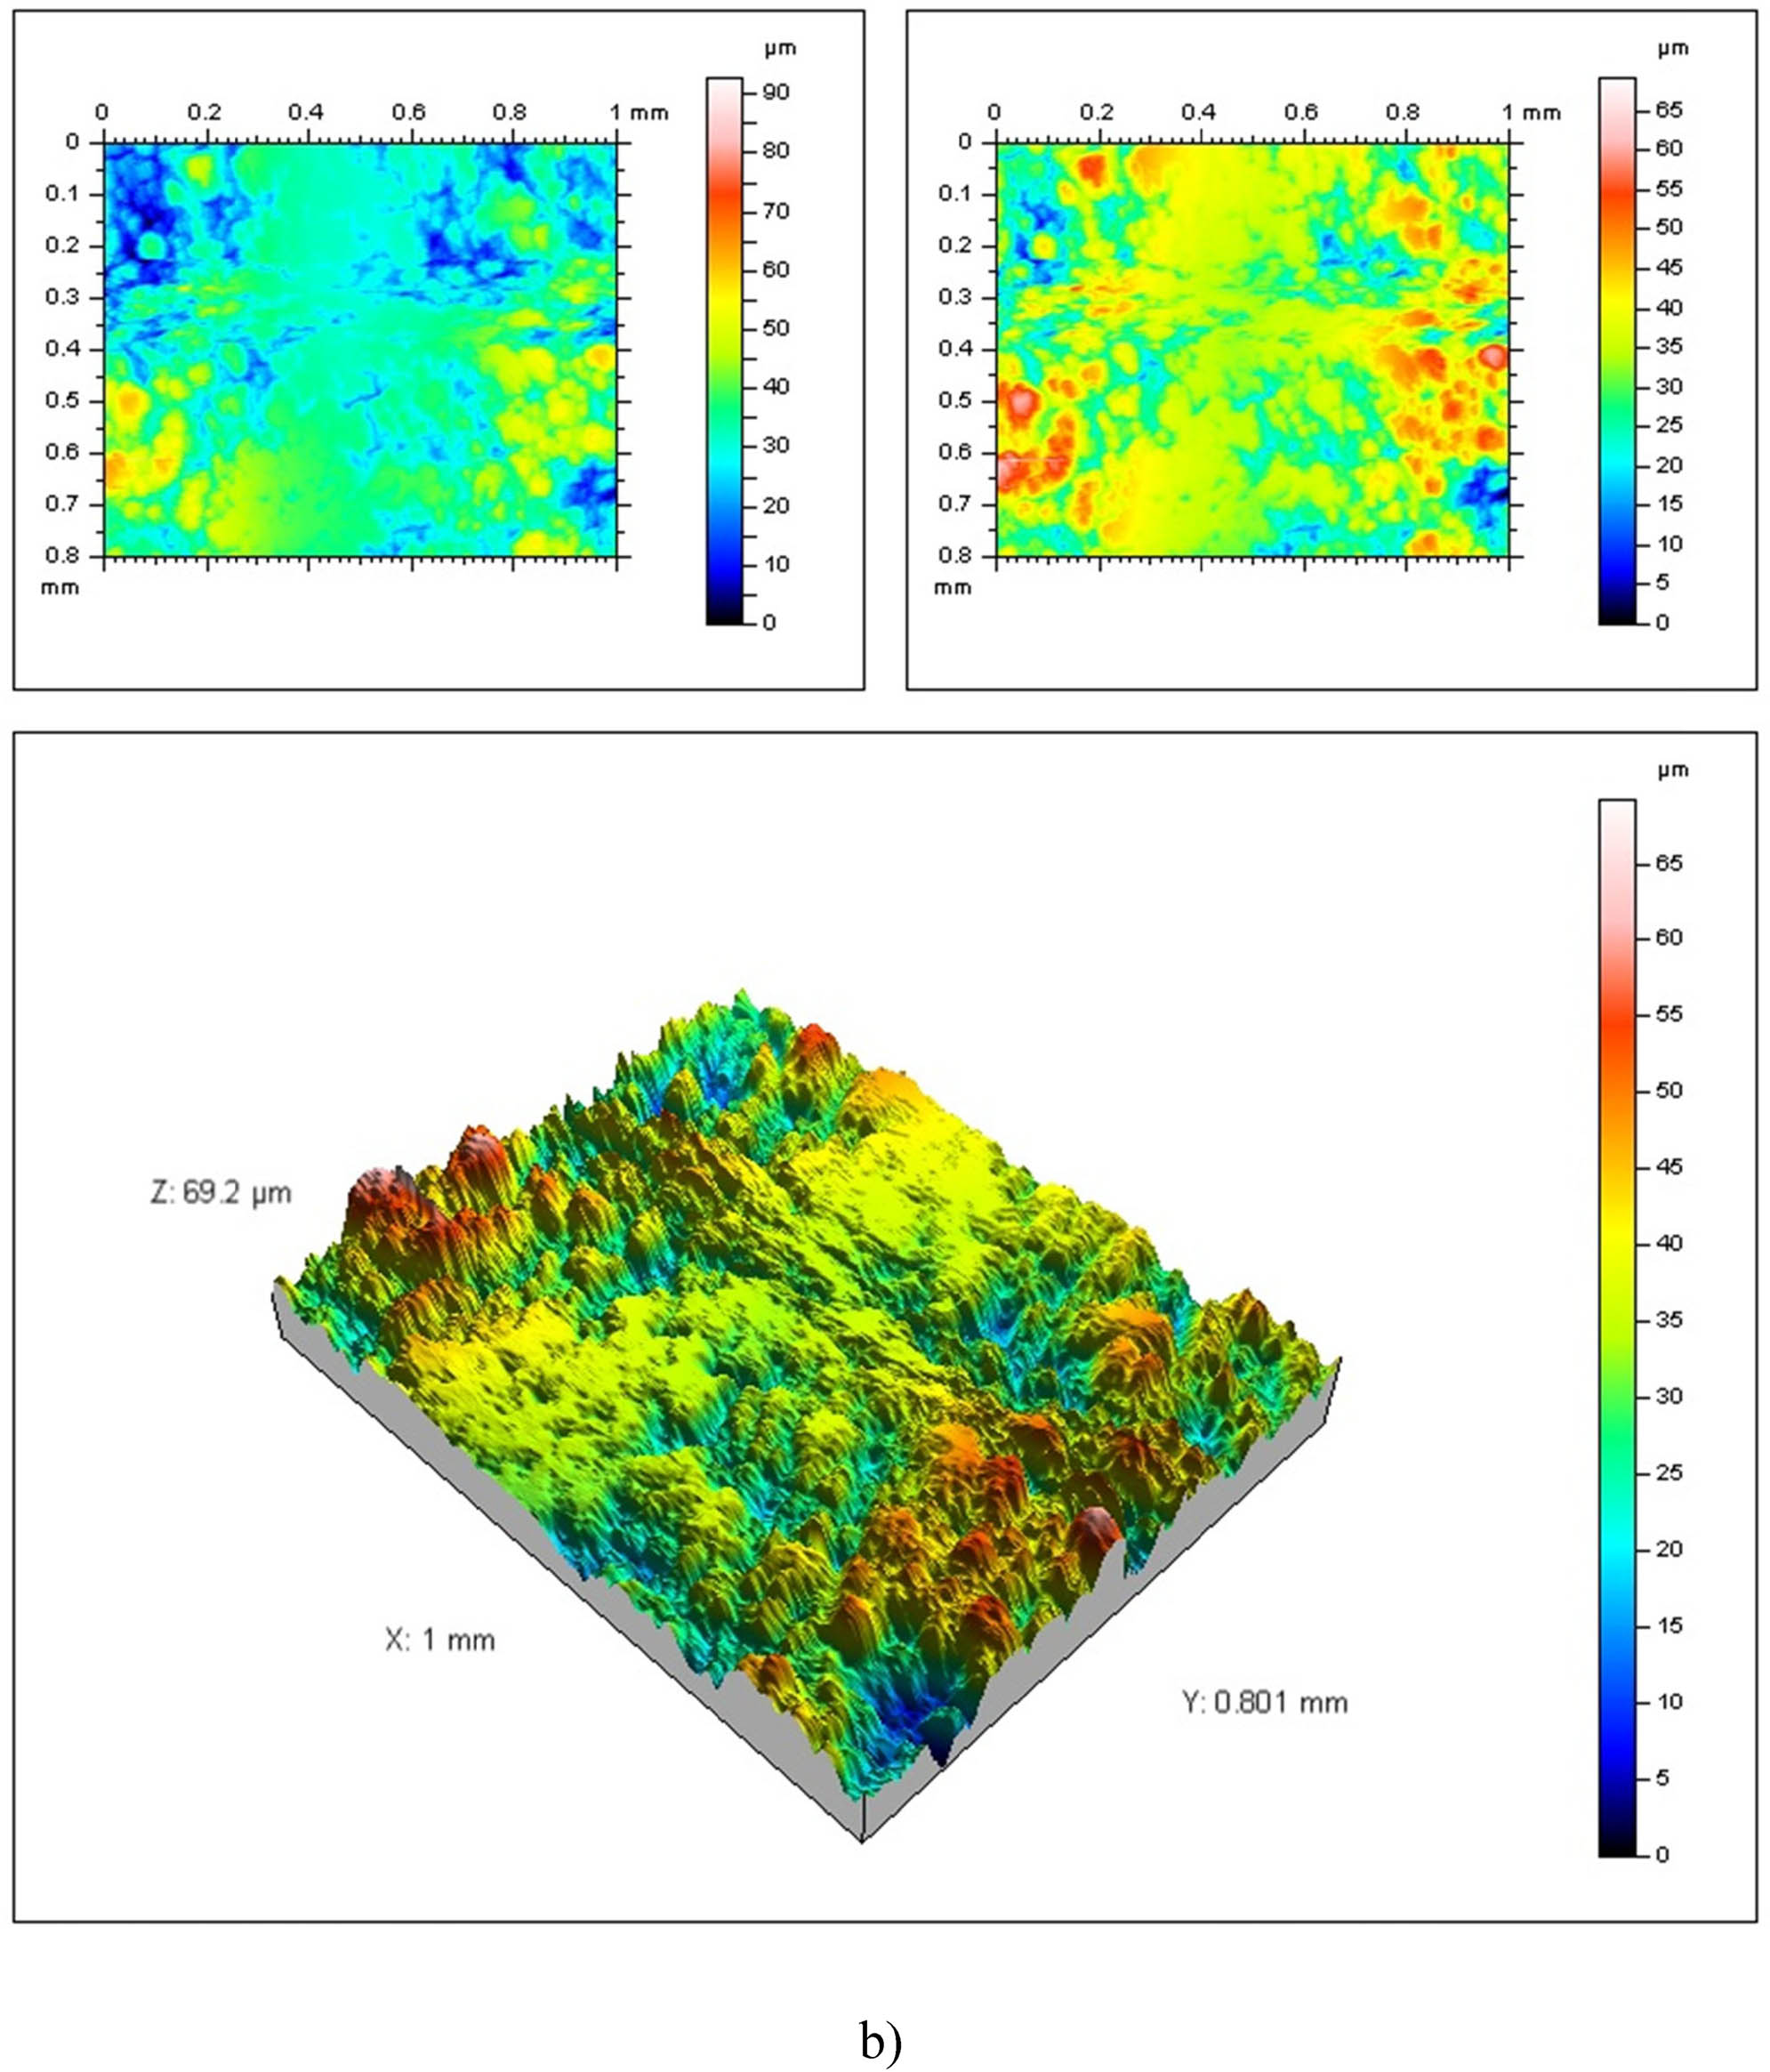
3D profilometer of the worn surface of (a) sample z1 (2 N load in wear test) and (b) sample z7.
It was noted that the depth of the wear marks increased with higher intensity [34,35,36,41,42,43]. The wear heights of the coatings, observed in the x-, y-, and z-planes, varied, with the WR being greatest in the z-direction. In contrast, wear was less pronounced in other directions, particularly in the y direction, where the least amount of wear occurred. The wear depths on the affected surfaces are illustrated using different colours, accompanied by a numeric scale bar on the side [32,34,37,38,43,44].
Upon examining the coating layer, it was found that there were no significant losses, and excessive wear pits could not form. Notably, the scarcity of deep red areas in the top picture is striking. The relationship between wear depths and the amount of wear resulted in significant findings regarding the creation of wear-resistant coatings. It has been observed that coatings made with P1 powder exhibit better wear resistance than those made with P2 powder. The wear on the surface of the sample made with P2 powder was more severe, and the surface losses were more significant (Figure 9b). Different wear patterns were observed depending on the direction of the wear. Overall, it has been noted that there was no severe wear under the experimental conditions. Additionally, the structure of the powder and the differences in the hard phases play a crucial role in determining the characteristics of wear observed on the surface [36,45].
4 Conclusions
The study aimed to enhance the surface properties of stainless steel materials, which are extensively utilised in various industries, yielding valuable results. This improvement will help extend the lifespan of stainless steel surfaces across multiple sectors. Achieving the right powder content and coating parameters will significantly benefit the study’s users. Two powder mixtures were used as coating powder, one containing 50 wt% Sulzer Metco 5810 (WC and 12 wt% Co powder) and 50 wt% Amdry 960 (Ni, Cr, and Al), and the other containing 50 wt% Woka 3653 and 50 wt% Amdry 960 (P1 and P2). Coatings made with 50 wt% Sulzer Metco 5810 (WC and 12 wt% Co powder) and 50 wt% Amdry 960 (P1) powder were denser and less porous compared to those created with 50 wt% Woka 3653 and 50 wt% Amdry 960 (P2) powders. It is believed that the powders’ particle size distributions and densities influence the porosity, affecting the coating layer’s morphology. The P1 powders achieved a coating thickness of 416 μm when using a spray distance of 200 mm and applying 20 passes. As the number of passes increases and the spray distance decreases, more coating powder reaches the surface, thereby altering both the thickness and structure of the coating.
The coated surface revealed the presence of hard phases, including WC, W, W2C, Cr2Ni3, Co3C, and Cr. These hard phases significantly contributed to the mechanical properties of the coating. The z5 sample, created using P1 powder at a spray distance of 200 mm over 20 passes, recorded the highest average hardness value of 960 HV. In contrast, the coated layer produced by HVOF exhibited the lowest hardness value at 631 HV. When comparing the 50 wt% Sulzer Metco 5810 (WC and 12 wt% Co powder) and 50 wt% Amdry 960 (Ni, Cr, and Al) and the other containing 50 wt% Woka 3653 and 50 wt% Amdry 960 (P1 and P2) powders, it was noted that coatings made with P1 powder generally exhibited slightly higher hardness values.
Overall, both coatings enhanced the wear resistance of the surfaces. Variations in parameters influenced wear and hardness values. As the spray distance decreased and the number of passes increased, there were positive improvements in surface mechanical values. Notably, the wear resistance of coatings using P1 powder appears to be somewhat better than that of those made with P2. The overall amount of wear increased with the WR and load for both powders. Additionally, the friction coefficient values displayed a trend that was proportional to the amount of wear. The WRs and friction coefficient values decreased due to the oxidation that occurs on the surface during wear and the adhesion of wear products to the surface.
Acknowledgments
We would like to sincerely thank Prof. Dr Fatih Üstel and Sakarya University for supporting us in the coating processes in our experimental studies. The name of funding organisation: Sakarya University.
-
Funding information: This study was financially supported by Sakarya University.
-
Author contributions: All authors have accepted responsibility for the entire content of this manuscript and approved its submission.
-
Conflict of interest: The authors state no conflict of interest.
-
Data availability statement: All data generated or analysed during this study are included in this published article.
References
[1] Singh, J., S. Kumar, and S. K. Mohapatra. Tribological analysis of WC–10Co–4Cr and Ni–20Cr₂O₃ coating on stainless steel 304. Wear, Vol. 376–377, 2017, pp. 1105–1111.10.1016/j.wear.2017.01.032Search in Google Scholar
[2] Michalak, M., L. Łatka, P. Sokołowski, F.-L. Toma, and H. Myalska. Microstructural, mechanical and tribological properties of finely grained Al2O3 coatings obtained by SPS and S-HVOF methods. Surface & Coatings Technology, Vol. 404, 2020, id. 126463.10.1016/j.surfcoat.2020.126463Search in Google Scholar
[3] Bai, M., L. Reddy, and T. Hussain. Corrosion behaviour of NiCrAlY and NiCrMo thermal spray coatings in NaCl solution. Corrosion Science, Vol. 135, 2018, pp. 147–157.10.1016/j.corsci.2018.02.047Search in Google Scholar
[4] Saharkhiz, R., Z. Valefi, M. Mirjani, and A. Mirak. Wear and oxidation behaviour of WC–CoCr coatings reinforced by CeO₂ nanoparticles. Surface & Coatings Technology, Vol. 473, 2023, id. 129951.10.1016/j.surfcoat.2023.129951Search in Google Scholar
[5] Dwivedi, S. P., S. Sharma, A. P. Srivastava, et al. Microstructural and mechanical characterization of NiCrBSi coatings deposited by HVOF process. Journal of Materials Engineering and Performance, Vol. 18, 2009, pp. 1060–1066.Search in Google Scholar
[6] Lindner, T., M. Lobel, R. Hunger, R. Berger, and T. Lampke. Microstructural design of HVOF-sprayed WC–CoCr coatings by variation of feedstock and process parameters. Surface & Coatings Technology, Vol. 404, 2020, id. 126456.10.1016/j.surfcoat.2020.126456Search in Google Scholar
[7] Javed, M. Investigation of WC-based HVOF coatings for erosion and wear resistance. Surface & Coatings Technology, Vol. 418, 2021, id. 127239.10.1016/j.surfcoat.2021.127239Search in Google Scholar
[8] Oksa, M., P. Auerkari, J. Salonen, and T. Varis. Optimization and characterization of HVOF sprayed NiCrBSi coatings. Fuel Processing Technology, Vol. 125, 2014, pp. 236–245.10.1016/j.fuproc.2014.04.006Search in Google Scholar
[9] Varis, T., T. Suhonen, M. Lokipii, and P. Vuoristo. Structure–property correlation of WC-10Co-4Cr coatings deposited by HVAF process. Surface & Coatings Technology, Vol. 388, 2020, id. 125604.10.1016/j.surfcoat.2020.125604Search in Google Scholar
[10] Nahvi, S. M. and M. Jafari. Microstructural and mechanical properties of advanced HVOF-sprayed WC-based cermet coatings. Surface & Coatings Technology, Vol. 286, 2016, pp. 95–102.10.1016/j.surfcoat.2015.12.016Search in Google Scholar
[11] Tyagi, A., S. Chourasia, K. Vats, et al. Comparative study on HVOF and plasma-sprayed WC-CoCr coatings. Materials Today: Proceedings, Vol. 50, 2021, pp. 2376–2380.10.1016/j.matpr.2021.10.252Search in Google Scholar
[12] Gong, T., P. Yao, X. Zuo, Z. Zhang, Y. Xiao, L. Zhao, et al. Erosive wear behavior of WC–10Co4Cr coatings under different impact conditions. Wear, Vol. 362–363, 2016, pp. 135–145.10.1016/j.wear.2016.05.022Search in Google Scholar
[13] Mahade, S., A. Mulone, S. Bjorklund, et al. High-velocity oxy-fuel sprayed WC–CoCr coatings: effect of feedstock morphology on wear resistance. Journal of Materials Research and Technology, Vol. 5, 2021, pp. 4595–4609.Search in Google Scholar
[14] Liu, S., H. Wu, S. Xie, M. P. Planche, D. Rivolet, M. Moliere, et al. Influence of carbide grain size on wear behavior of WC–CoCr coatings. Surface & Coatings Technology, Vol. 408, 2021, id. 126805.10.1016/j.surfcoat.2020.126805Search in Google Scholar
[15] Wei, Z., Y. Wu, S. Hong, and S. Cheng. Corrosion and wear behavior of Cr₃C₂-NiCr coatings. Ceramics International, Vol. 47, 2021, pp. 15121–15128.10.1016/j.ceramint.2021.02.070Search in Google Scholar
[16] Somasundaram, B., V. Patil, M. R. Ramesh, et al. Characterization of WC-CoCr coatings deposited by HVOF process for wear resistance. Materials Today: Proceedings, Vol. 54, 2021, pp. 566–571.10.1016/j.matpr.2021.09.310Search in Google Scholar
[17] Bolelli, G., T. Börner, A. Milanti, L. Lusvarghi, J. Laurila, H. Koivuluoto, et al. Wear behavior of HVOF-sprayed cermet coatings under different testing conditions. Surface & Coatings Technology, Vol. 248, 2014, pp. 104–112.10.1016/j.surfcoat.2014.03.037Search in Google Scholar
[18] Zheng, C., Y. Liu, J. Qin, W. Ji, S. Zhang, R. Ji, et al. Effect of process parameters on microstructure of WC-CoCr coatings. Powder Technology, Vol. 318, 2017, pp. 383–389.10.1016/j.powtec.2017.06.022Search in Google Scholar
[19] Picas, J. A., S. Menargues, E. Martin, and M. T. Baile. Tribological performance of HVOF-sprayed carbide coatings under sliding wear. Surface & Coatings Technology, Vol. 456, 2023, id. 129243.10.1016/j.surfcoat.2023.129243Search in Google Scholar
[20] Hajare, A. S. and C. L. Gogte. Microstructural analysis and hardness evaluation of HVOF-sprayed Cr₃C₂–NiCr coatings. Materials Today: Proceedings, Vol. 5, 2018, pp. 6924–6933.10.1016/j.matpr.2017.11.354Search in Google Scholar
[21] Noblea, N., N. Radhikaa, M. Sathishkumarb, and B. Saleh. Wear and friction behavior of HVOF-sprayed WC–10Co–4Cr coatings. Tribology International, Vol. 185, 2023, id. 108525.Search in Google Scholar
[22] Tribhuwan, K. and K. Mishra. A comparative study of WC-Co and Cr₃C₂–NiCr coatings for wear resistance. Materials Today: Proceedings, Vol. 5, 2018, pp. 19539–19546.10.1016/j.matpr.2018.06.315Search in Google Scholar
[23] Wang, P., H. Liang, L. Jiang, and L. Qian. Sliding wear performance of WC–CoCr coatings under high load conditions. Wear, Vol. 530–531, 2023, id. 204995.10.1016/j.wear.2023.204995Search in Google Scholar
[24] Leyland, A. and A. Matthews. On the significance of the H/E ratio in wear control: a review. Wear, Vol. 246, No. 1–2, 2000, pp. 9–19.10.1016/S0043-1648(00)00488-9Search in Google Scholar
[25] Abbasi, Z. A., A. Mateen, M. Abbas, M. A. U. Rehman, and A. Wadood. Microstructural and mechanical characterization of HVOF-sprayed WC–10Co–4Cr coatings. Journal of Materials Research and Technology, Vol. 26, 2023, pp. 9079–9094.10.1016/j.jmrt.2023.09.169Search in Google Scholar
[26] Ozbek, Y. Y. Characterization of HVOF-sprayed WC–10Co–4Cr coatings for erosion resistance. Journal of Materials Research and Technology, Vol. 9, 2020, pp. 2176–2185.Search in Google Scholar
[27] Russell, Z., M. Gaier, M. J. Froning, and K. P. Plucknet. Microstructural evolution and tribological behavior of thermally sprayed coatings. Surface & Coatings Technology, Vol. 473, 2023, id. 130018.10.1016/j.surfcoat.2023.130018Search in Google Scholar
[28] Özbek, Y. Y., M. Durman, and H. Akbulut. Tribological behavior of thermally sprayed WC-based coatings. Tribology Transactions, Vol. 52, 2009, pp. 213–222.10.1080/10402000802369721Search in Google Scholar
[29] Behera, N., M. R. Ramesh, and M. R. Rahman. Influence of process parameters on mechanical performance of HVOF coatings. Materials Characterization, Vol. 215, 2024, id. 114207.10.1016/j.matchar.2024.114207Search in Google Scholar
[30] Song, P., D. Kong, T. Huang, and Q. Ji. High-temperature tribological performance of Cr₃C₂–NiCr coatings. Journal of Materials Research and Technology, Vol. 29, 2024, pp. 78–89.Search in Google Scholar
[31] Rabinowicz, E. The wear coefficient – magnitude, scatter, uses. Journal of Lubrication Technology, Vol. 103, 1981, pp. 188–193.10.1115/1.3251624Search in Google Scholar
[32] Straffelini, G. Friction. In Friction and Wear - Methodologies for Design and Control, Springer International Publishing, Cham, Switzerland, 2015, pp. 21–60.10.1007/978-3-319-05894-8_2Search in Google Scholar
[33] Gehlen, L. R., G. Bolelli, P. Puddu, E. Forlin, A. Colella, G. Pintaude, et al. Erosive wear behavior of thermally sprayed coatings under slurry flow. Surface & Coatings Technology, Vol. 474, 2023, id. 130098.10.1016/j.surfcoat.2023.130098Search in Google Scholar
[34] Singh, S., A. Osi, V. V. Joshi, S. Wade, C. C. Berndt, T. Schlӓfer, et al. High-temperature corrosion and oxidation behavior of carbide-based coatings. International Journal of Refractory Metals and Hard Materials, Vol. 121, 2024, id. 106667.10.1016/j.ijrmhm.2024.106667Search in Google Scholar
[35] Hanief, M. and M. S. Charoo. Mechanical and wear properties of NiCrAlY coatings deposited by HVOF technique. Materials Today: Proceedings, Vol. 47, 2021, pp. 5598–5600.10.1016/j.matpr.2021.03.475Search in Google Scholar
[36] Cooke, K. O. Tribological performance of hard-faced/thermally sprayed coatings for increased wear resistance of cutting blades used in harvesting sugarcane. Annals of Agricultural & Crop Sciences, Vol. 4, 2019, pp. 1–7.Search in Google Scholar
[37] Paredes, R. S. C., W. Nikkel, G. B. Sucharski, and P. P. B. Costa. Evaluation of thermally sprayed coatings for mechanical performance. Journal of the Brazilian Society of Mechanical Sciences and Engineering, Vol. 41, 2019, pp. 1–9.10.1007/s40430-019-1719-6Search in Google Scholar
[38] Marques, A. S., L. D. L. de Costa, G. R. dos Santos, and A. da Silva Rocha. Influence of HVOF process parameters on coating properties. International Journal of Advanced Manufacturing Technology, Vol. 100, 2019, pp. 3–11.10.1007/s00170-018-2693-3Search in Google Scholar
[39] Gibbons, G. J. and R. G. Hansell. Laser processing of thermally sprayed coatings: effects on microstructure and wear. Journal of Material Processing Technology, Vol. 204, 2008, pp. 14–19.10.1016/j.jmatprotec.2007.11.032Search in Google Scholar
[40] Gerner, D., F. Azarmi, M. McDonnell, and U. Okeke. Microstructural optimization of HVOF coatings through process control. Journal of Thermal Spray Technology, Vol. 33, 2024, pp. 504–514.10.1007/s11666-023-01682-3Search in Google Scholar
[41] Khuengpukheiw, R., C. Saikaew, A. Wisitsoraat, and K. Kaen. Evaluation of mechanical performance of HVOF coatings. Materials Testing, Vol. 63, 2021, id. 1.10.1515/mt-2020-0009Search in Google Scholar
[42] Savchenko, N. L., Y. A. Mirovoy, A. S. Buyakova, A. G. Burlachenko, M. Rudmin, I. N. Sevostyanov, et al. Friction and wear of WC–CoCr coatings under different conditions. Wear, Vol. 20, 2020, id. 203204.10.1016/j.wear.2020.203204Search in Google Scholar
[43] Staia, M. H., T. Valente, C. Bartuli, D. B. Lewis, C. P. Constable, A. Roman, et al. Mechanical and tribological evaluation of WC-based coatings produced by HVOF. Surface & Coatings Technology, 146–, Vol. 147, 2001, pp. 563–570. Search in Google Scholar
[44] Guilemany, J. M. Influence of HVOF parameters on WC–Co coatings. Journal of Thermal Spray Technology, Vol. 15, 2006, pp. 676–682.10.1361/105996306X147072Search in Google Scholar
[45] Bolelli, G. Tribological and mechanical characterization of WC–CoCr coatings. Surface & Coatings Technology, Vol. 203, 2009, pp. 609–620.Search in Google Scholar
© 2025 the author(s), published by De Gruyter
This work is licensed under the Creative Commons Attribution 4.0 International License.
Articles in the same Issue
- Review Articles
- Utilization of steel slag in concrete: A review on durability and microstructure analysis
- Technical development of modified emulsion asphalt: A review on the preparation, performance, and applications
- Recent developments in ultrasonic welding of similar and dissimilar joints of carbon fiber reinforcement thermoplastics with and without interlayer: A state-of-the-art review
- Unveiling the crucial factors and coating mitigation of solid particle erosion in steam turbine blade failures: A review
- From magnesium oxide, magnesium oxide concrete to magnesium oxide concrete dams
- Properties and potential applications of polymer composites containing secondary fillers
- A scientometric review on the utilization of copper slag as a substitute constituent of ordinary Portland cement concrete
- Advancement of additive manufacturing technology in the development of personalized in vivo and in vitro prosthetic implants
- Recent advance of MOFs in Fenton-like reaction
- A review of defect formation, detection, and effect on mechanical properties of three-dimensional braided composites
- Non-conventional approaches to producing biochars for environmental and energy applications
- Review of the development and application of aluminum alloys in the nuclear industry
- Advances in the development and characterization of combustible cartridge cases and propellants: Preparation, performance, and future prospects
- Recent trends in rubberized and non-rubberized ultra-high performance geopolymer concrete for sustainable construction: A review
- Cement-based materials for radiative cooling: Potential, material and structural design, and future prospects
- A comprehensive review: The impact of recycling polypropylene fiber on lightweight concrete performance
- A comprehensive review of preheating temperature effects on reclaimed asphalt pavement in the hot center plant recycling
- Exploring the potential applications of semi-flexible pavement: A comprehensive review
- A critical review of alkali-activated metakaolin/blast furnace slag-based cementitious materials: Reaction evolution and mechanism
- Dispersibility of graphene-family materials and their impact on the properties of cement-based materials: Application challenges and prospects
- Research progress on rubidium and cesium separation and extraction
- A step towards sustainable concrete with the utilization of M-sand in concrete production: A review
- Studying the effect of nanofillers in civil applications: A review
- Studies on the anticorrosive effect of phytochemicals on mild steel, carbon steel, and stainless-steel surfaces in acid and alkali medium: A review
- Nanotechnology for calcium aluminate cement: thematic analysis
- Towards sustainable concrete pavements: a critical review on fly ash as a supplementary cementitious material
- Optimizing rice husk ash for ultra-high-performance concrete: a comprehensive review of mechanical properties, durability, and environmental benefits
- Research Articles
- Investigation of the corrosion performance of HVOF-sprayed WC-CoCr coatings applied on offshore hydraulic equipment
- A systematic review of metakaolin-based alkali-activated and geopolymer concrete: A step toward green concrete
- Evaluation of color matching of three single-shade composites employing simulated 3D printed cavities with different thicknesses using CIELAB and CIEDE2000 color difference formulae
- Novel approaches in prediction of tensile strain capacity of engineered cementitious composites using interpretable approaches
- Effect of TiB2 particles on the compressive, hardness, and water absorption responses of Kulkual fiber-reinforced epoxy composites
- Analyzing the compressive strength, eco-strength, and cost–strength ratio of agro-waste-derived concrete using advanced machine learning methods
- Tensile behavior evaluation of two-stage concrete using an innovative model optimization approach
- Tailoring the mechanical and degradation properties of 3DP PLA/PCL scaffolds for biomedical applications
- Optimizing compressive strength prediction in glass powder-modified concrete: A comprehensive study on silicon dioxide and calcium oxide influence across varied sample dimensions and strength ranges
- Experimental study on solid particle erosion of protective aircraft coatings at different impact angles
- Compatibility between polyurea resin modifier and asphalt binder based on segregation and rheological parameters
- Fe-containing nominal wollastonite (CaSiO3)–Na2O glass-ceramic: Characterization and biocompatibility
- Relevance of pore network connectivity in tannin-derived carbons for rapid detection of BTEX traces in indoor air
- A life cycle and environmental impact analysis of sustainable concrete incorporating date palm ash and eggshell powder as supplementary cementitious materials
- Eco-friendly utilisation of agricultural waste: Assessing mixture performance and physical properties of asphalt modified with peanut husk ash using response surface methodology
- Benefits and limitations of N2 addition with Ar as shielding gas on microstructure change and their effect on hardness and corrosion resistance of duplex stainless steel weldments
- Effect of selective laser sintering processing parameters on the mechanical properties of peanut shell powder/polyether sulfone composite
- Impact and mechanism of improving the UV aging resistance performance of modified asphalt binder
- AI-based prediction for the strength, cost, and sustainability of eggshell and date palm ash-blended concrete
- Investigating the sulfonated ZnO–PVA membrane for improved MFC performance
- Strontium coupling with sulphur in mouse bone apatites
- Transforming waste into value: Advancing sustainable construction materials with treated plastic waste and foundry sand in lightweight foamed concrete for a greener future
- Evaluating the use of recycled sawdust in porous foam mortar for improved performance
- Improvement and predictive modeling of the mechanical performance of waste fire clay blended concrete
- Polyvinyl alcohol/alginate/gelatin hydrogel-based CaSiO3 designed for accelerating wound healing
- Research on assembly stress and deformation of thin-walled composite material power cabin fairings
- Effect of volcanic pumice powder on the properties of fiber-reinforced cement mortars in aggressive environments
- Analyzing the compressive performance of lightweight foamcrete and parameter interdependencies using machine intelligence strategies
- Selected materials techniques for evaluation of attributes of sourdough bread with Kombucha SCOBY
- Establishing strength prediction models for low-carbon rubberized cementitious mortar using advanced AI tools
- Investigating the strength performance of 3D printed fiber-reinforced concrete using applicable predictive models
- An eco-friendly synthesis of ZnO nanoparticles with jamun seed extract and their multi-applications
- The application of convolutional neural networks, LF-NMR, and texture for microparticle analysis in assessing the quality of fruit powders: Case study – blackcurrant powders
- Study of feasibility of using copper mining tailings in mortar production
- Shear and flexural performance of reinforced concrete beams with recycled concrete aggregates
- Advancing GGBS geopolymer concrete with nano-alumina: A study on strength and durability in aggressive environments
- Leveraging waste-based additives and machine learning for sustainable mortar development in construction
- Study on the modification effects and mechanisms of organic–inorganic composite anti-aging agents on asphalt across multiple scales
- Morphological and microstructural analysis of sustainable concrete with crumb rubber and SCMs
- Structural, physical, and luminescence properties of sodium–aluminum–zinc borophosphate glass embedded with Nd3+ ions for optical applications
- Eco-friendly waste plastic-based mortar incorporating industrial waste powders: Interpretable models for flexural strength
- Bioactive potential of marine Aspergillus niger AMG31: Metabolite profiling and green synthesis of copper/zinc oxide nanocomposites – An insight into biomedical applications
- Preparation of geopolymer cementitious materials by combining industrial waste and municipal dewatering sludge: Stabilization, microscopic analysis and water seepage
- Seismic behavior and shear capacity calculation of a new type of self-centering steel-concrete composite joint
- Sustainable utilization of aluminum waste in geopolymer concrete: Influence of alkaline activation on microstructure and mechanical properties
- Optimization of oil palm boiler ash waste and zinc oxide as antibacterial fabric coating
- Tailoring ZX30 alloy’s microstructural evolution, electrochemical and mechanical behavior via ECAP processing parameters
- Comparative study on the effect of natural and synthetic fibers on the production of sustainable concrete
- Microemulsion synthesis of zinc-containing mesoporous bioactive silicate glass nanoparticles: In vitro bioactivity and drug release studies
- On the interaction of shear bands with nanoparticles in ZrCu-based metallic glass: In situ TEM investigation
- Developing low carbon molybdenum tailing self-consolidating concrete: Workability, shrinkage, strength, and pore structure
- Experimental and computational analyses of eco-friendly concrete using recycled crushed brick
- High-performance WC–Co coatings via HVOF: Mechanical properties of steel surfaces
- Mechanical properties and fatigue analysis of rubber concrete under uniaxial compression modified by a combination of mineral admixture
- Experimental study of flexural performance of solid wood beams strengthened with CFRP fibers
- Eco-friendly green synthesis of silver nanoparticles with Syzygium aromaticum extract: characterization and evaluation against Schistosoma haematobium
- Predictive modeling assessment of advanced concrete materials incorporating plastic waste as sand replacement
- Self-compacting mortar overlays using expanded polystyrene beads for thermal performance and energy efficiency in buildings
- Enhancing frost resistance of alkali-activated slag concrete using surfactants: sodium dodecyl sulfate, sodium abietate, and triterpenoid saponins
- Equation-driven strength prediction of GGBS concrete: a symbolic machine learning approach for sustainable development
- Empowering 3D printed concrete: discovering the impact of steel fiber reinforcement on mechanical performance
- Advanced hybrid machine learning models for estimating chloride penetration resistance of concrete structures for durability assessment: optimization and hyperparameter tuning
- Influence of diamine structure on the properties of colorless and transparent polyimides
- Post-heating strength prediction in concrete with Wadi Gyada Alkharj fine aggregate using thermal conductivity and ultrasonic pulse velocity
- Experimental and RSM-based optimization of sustainable concrete properties using glass powder and rubber fine aggregates as partial replacements
- Special Issue on Recent Advancement in Low-carbon Cement-based Materials - Part II
- Investigating the effect of locally available volcanic ash on mechanical and microstructure properties of concrete
- Flexural performance evaluation using computational tools for plastic-derived mortar modified with blends of industrial waste powders
- Foamed geopolymers as low carbon materials for fire-resistant and lightweight applications in construction: A review
- Autogenous shrinkage of cementitious composites incorporating red mud
- Mechanical, durability, and microstructure analysis of concrete made with metakaolin and copper slag for sustainable construction
- Special Issue on AI-Driven Advances for Nano-Enhanced Sustainable Construction Materials
- Advanced explainable models for strength evaluation of self-compacting concrete modified with supplementary glass and marble powders
- Analyzing the viability of agro-waste for sustainable concrete: Expression-based formulation and validation of predictive models for strength performance
- Special Issue on Advanced Materials for Energy Storage and Conversion
- Innovative optimization of seashell ash-based lightweight foamed concrete: Enhancing physicomechanical properties through ANN-GA hybrid approach
- Production of novel reinforcing rods of waste polyester, polypropylene, and cotton as alternatives to reinforcement steel rods