Analyzing the compressive strength, eco-strength, and cost–strength ratio of agro-waste-derived concrete using advanced machine learning methods
-
Muhammad Nasir Amin
 ,
Bawar Iftikhar
,
Kaffayatullah Khan
,
Bawar Iftikhar
,
Kaffayatullah Khan

Abstract
Agro-waste like eggshell powder (ESP) and date palm ash (DPA) are used as supplementary cementitious materials (SCMs) in concrete because of their pozzolanic and cementitious attributes as well as environmental and cost benefits. In addition, performing lab tests to optimize mixed proportions of concrete with different SCMs takes considerable time and effort. Therefore, the creation of estimation models for such purposes is vital. This study aimed to create interpretable prediction models for the compressive strength (CS), eco-strength (ECR), and cost–strength ratio (CSR) of DPA–ESP concrete. Gene expression programming (GEP) was employed for model generation via the hyperparameter optimization method. Also, the importance of input features was determined via SHapley Additive exPlanations (SHAP) analysis. The GEP models accurately matched experimental results for the CS, ECR, and CSR of DPA–ESP concrete. These models can be used for future predictions, reducing the need for additional tests and saving effort, time, and costs. The model’s accuracy was confirmed by an R 2 value of 0.94 for CS, as well as high values of 0.91 for ECR and 0.92 for CSR, as well as lower values for statistical checks. The SHAP analysis suggested that test age was the most critical factor in all outcomes.
1 Introduction
The yearly production of concrete continues to increase rapidly as a result of the worldwide need for infrastructure construction. The worldwide utilization of concrete surpasses 25 gigatons per year [1,2]. The construction sector is a main contributor to global greenhouse gas (GHG) emissions, with a major portion arising from concrete manufacture, including both the materials used and the building activities involved [3,4]. During the building process, two types of GHG CO2 emissions are generated: embodied CO2 and operational CO2. The CO2 emissions that are directly associated with transportation, manufacture of materials, maintenance, and demolition contribute to the overall carbon footprint. The operational CO2 emissions are derived from the energy utilized during the operational period [5,6]. The primary source of CO2 emissions in the construction sector is cement manufacturing. Specifically, the cement industries are accountable for around 7–8% of the worldwide CHG CO2 emissions [7]. The manufacturing of 1 kg of cement results in the release of about 1 kg of CO2 into the atmosphere, which varies depending on the type and amount of clinker [8]. The primary source of CO2 emissions in cement manufacture occurs during the clinker-forming process. The clinker is produced by the process of calcination when limestone and clay are heated to temperatures exceeding 1,500°C in a furnace. This causes the transition of CaCO3 into CaO and CO2. During calcination, around 50% of the overall CO2 generated during cement manufacturing is released into the environment [9]. Given the rising demand for cement, with a yearly manufacturing rate surpassing 4.4 billion tons and projected to surpass 5.5 billion tons by 2050 [10], reducing cement manufacture and demand will effectively decrease worldwide CO2 emissions from the construction sector. This, in turn, will mitigate the long-term risk of global warming [11]. One method of reducing cement usage is by using supplementary cementitious materials (SCMs) derived from industrial or agricultural byproducts [12,13,14,15].
Agro-based byproducts such as eggshell powder (ESP) and date palm ash (DPA) are utilized as SCMs in cementitious composites because of their pozzolanic characteristics [16,17]. DPA is acquired by the incineration of all parts of the date tree, containing its leaves, fronds, stems, and mesh, at elevated temperatures, followed by the process of grinding them into extremely small particles [18,19]. Studies have shown that the DPA contains a significant amount of silica, which is responsible for its pozzolanic response [20]. Prior research has demonstrated the effectiveness of DPA as a pozzolanic substance in cementitious composites. It has been seen to improve the mechanical characteristics and long-lasting nature of cementitious composites [16,21]. DPA might be used with other SCMs, such as fly ash, to improve the performance of cementitious composite [20,22]. In addition, ESP has a significant amount of CaO, which enhances its cementing characteristics along with its pozzolanic characteristics [23]. ESP is acquired by the process of pulverizing poultry eggshells into a finely powdered state. Prior to grinding, eggshells are obtained from various sources such as chicken farms, bakeries, and restaurants. They undergo a thorough process of washing and drying before being further processed [24]. The ESP is typically mixed with other SCMs that have a high content of SiO2 and Al2O3. CaO in the ESP facilitates the production of more Ca(OH)2, which then combines with SiO2 and Al2O3 to generate an excess of calcium silicate hydrate (C–S–H) gel [23]. The C–S–H gel is primarily important for the formation of concrete strength [25]. ESP has a role in stabilizing ettringites and mono-carbonates in the cementitious composite when it undergoes hydration. This leads to enhanced mechanical strength and resilience characteristics [26]. ESP has been used with other agricultural-based SCMs, such as straw and rice husk ashes [27,28] and DPA [29,30], and the resulting combined SCMs were observed to improve the performance of cementitious composites.
Researchers are now developing estimating models to evaluate the properties of materials and structures in order to reduce the requirement for extensive laboratory experiments [31,32,33,34]. Artificial intelligence (AI) strategies, like machine learning (ML), are presently at the forefront of the development of modeling techniques in this field [35,36,37]. In recent years, there has been a growing recognition of the application of ML approaches in evaluating the performance of building materials [38,39,40,41,42]. Gene expression programming (GEP) is an advantageous multiphysics model since it disregards previously established relationships while developing a model [43,44]. The GEP algorithm represents a program using a linear chromosome with a fixed length [45]. It can offer a mathematical formula for predicting behavior that can be applied in practical situations [46,47,48]. Unlike neural networks, GEP has several advantages. When discussing artificial neural network algorithms, they lack practical value, as they are unable to generate a functional relationship or framework. In contrast, GEP produces output in the form of an expression tree (ET), which can be decoded to obtain a mathematical relationship. This relationship is user-friendly and can be effectively utilized to make future predictions. GEP possesses the unique capability of establishing frameworks, which showcases its novelty through the provision of dependable models [49]. This characteristic enhances the reliability of GEP in generating precise predictions for the future. In contrast, all other techniques, with the exception of genetic programming (GP), are solely employed as predictors. Due to their limitations, neural networks are classified as black-box algorithms, which restrict their practical use. As a result, GEP emerges as a viable alternative to these methods, surpassing other approaches in addressing technical and complex problems, including SHapley Additive exPlanations (SHAP)-based studies, while outperforming traditional methods like LR [50,51,52].
The aim of this research is to create and evaluate GEP-based models for the compressive strength (CS), eco-strength (ECR), and cost–strength ratio (CSR) of DPA–ESP concrete while also investigating the impact of input components. The aim was accomplished by pursuing the following objectives: (i) optimizing hyperparameters for GEP using experimental data to build prediction models, (ii) verifying the accuracy of the constructed GEP prediction models using statistical measures and analyzing deviations among actual and predicted outcomes, and (iii) examining the influence of input components through SHAP analysis. Conducting studies on materials necessitates a significant investment of time, money, and effort, as it involves acquiring materials, creating samples, allowing them to cure, and subsequently assessing them through testing. These problems can be overcome using innovative techniques, such as ML, which would be advantageous for the construction sector. The characteristics of concrete are also influenced by several factors, and it is challenging to accurately measure their collective impact using experimental techniques. SHAP analysis is a valuable method for examining the influence and correlation between input characteristics and outputs. The necessary data for constructing the ML model and conducting SHAP analysis can be obtained from previous research or laboratory experiments. Consequently, the obtained database may be used to implement ML algorithms, predict material characteristics, and analyze the impact of inputs. The results of this study have the potential to enhance the flexibility of SCMs (DPA and ESP) composites in the construction sector, hence benefiting green building programs.
2 Data collection and analysis
The dataset was collected from the published literature [53] and includes five input variables: cement (C), DPA, superplasticizer (SP), ESP, and test age (A). The corresponding output variables are CS, ECR, and CSR. The ECR of DPA–ESP concrete is calculated using Eq. (1), and CSR is calculated by dividing the cost of concrete in $/m3 by CS in MPa. The dataset was increased from its initial 28 data points to 560 data points with the aid of a Python code that operated in accordance with a strategy that had been established beforehand. The user is given the opportunity to pick a database file via a Tkinter-based file dialog box, which leads to the beginning of the code. A Pandas DataFrame was used to import the file, and then the code checked the current point count once it was imported. A freshly formed file that included synthetic and original data was then used to hold the upgraded dataset after it had been created. The script provides incisive statements as it supplements the data. The declarations include a variety of information, including the precise location of the saved file, the number of synthetic data elements added, and the total number of data elements added. Furthermore, the script accommodates scenarios in which resampling is necessary, or no file is selected. This method was also utilized in earlier studies in order to enhance the number of data points included inside a database [54,55]. In order to develop models, the data are allocated as follows: 70% is allotted for the training phase, while 30% is set aside for the testing phase. Data preparation facilitated the acquisition and organization of the data. Commonly, data preparation is employed as a buffer to surmount a substantial impediment in the well-established method for deriving novel insights from old data [54]:
where
The primary characteristics of the dataset were summarized using descriptive statistics, and the results are summarized in Table 1. Table 1 contains critical metrics for the input and output variables, including the mean, median, standard deviation, minimum, and maximum values. These statistics reveal the central tendencies, variability, and overall distribution patterns of the variables, which provide a comprehensive overview of the data. The correlation coefficients among the variables were calculated to evaluate the intensity and direction of their linear relationships, in addition to descriptive statistics. The correlation between the variables is denoted by these coefficients, which vary from −1 to 1. A direct relationship is suggested by a positive coefficient, while an inverse relationship is indicated by a negative coefficient. The correlations between each pair of input and output variables are visually represented in Figure 1(a)–(c). This figure offers valuable insights into the interdependencies within the dataset by identifying the inputs that have the most significant impact on the outputs. For example, test age was the crucial parameter with the highest positive values of 0.71 and 0.72 for CS and ECS, respectively, and −0.69 for the CSR.
Descriptive statistics of all input and output variables
| Parameter | Cement (kg·m−3) | DPA (kg·m−3) | ESP (kg·m−3) | SP (kg·m−3) | Age (days) | CS (MPa) | ECR (MPa/kg CO2/m3) | CSR ($/MPa·m−3) |
|---|---|---|---|---|---|---|---|---|
| Mean | 396.37 | 72.22 | 8.76 | 4.77 | 16.60 | 40.50 | 0.106 | 2.97 |
| Standard error | 2.1869 | 1.6870 | 0.2100 | 0.005 | 0.44 | 0.44 | 0.001 | 0.032 |
| Median | 392 | 75.6 | 9.4 | 4.77 | 7 | 39.36 | 0.1 | 2.89 |
| Mode | 392 | 75.6 | 9.4 | 4.77 | 7 | 34.74 | 0.1 | 4.075 |
| Standard deviation | 51.7512 | 39.92 | 4.96 | 0.12 | 10.47 | 10.58 | 0.027 | 0.759 |
| Sample variance | 2678.19 | 1593.79 | 24.68 | 0.0146 | 109.63 | 112.06 | 0.0007 | 0.576 |
| Kurtosis | −0.11 | −0.11 | −0.10 | −0.39 | −1.97 | −0.52 | −0.525 | −0.150 |
| Skewness | 0.12 | −0.12 | 0.03 | −0.08 | 0.17 | 0.38 | 0.564 | 0.501 |
| Range | 196 | 151.2 | 18.7 | 0.46 | 21 | 42.72 | 0.102 | 3.14 |
| Minimum | 294 | 0 | 0 | 4.54 | 7 | 20.53 | 0.06 | 1.73 |
| Maximum | 490 | 151.2 | 18.7 | 5 | 28 | 63.25 | 0.16 | 4.879 |
| Sum | 221,970 | 40,446 | 4,910 | 2673.39 | 9,296 | 22685.33 | 59.34 | 1666.54 |
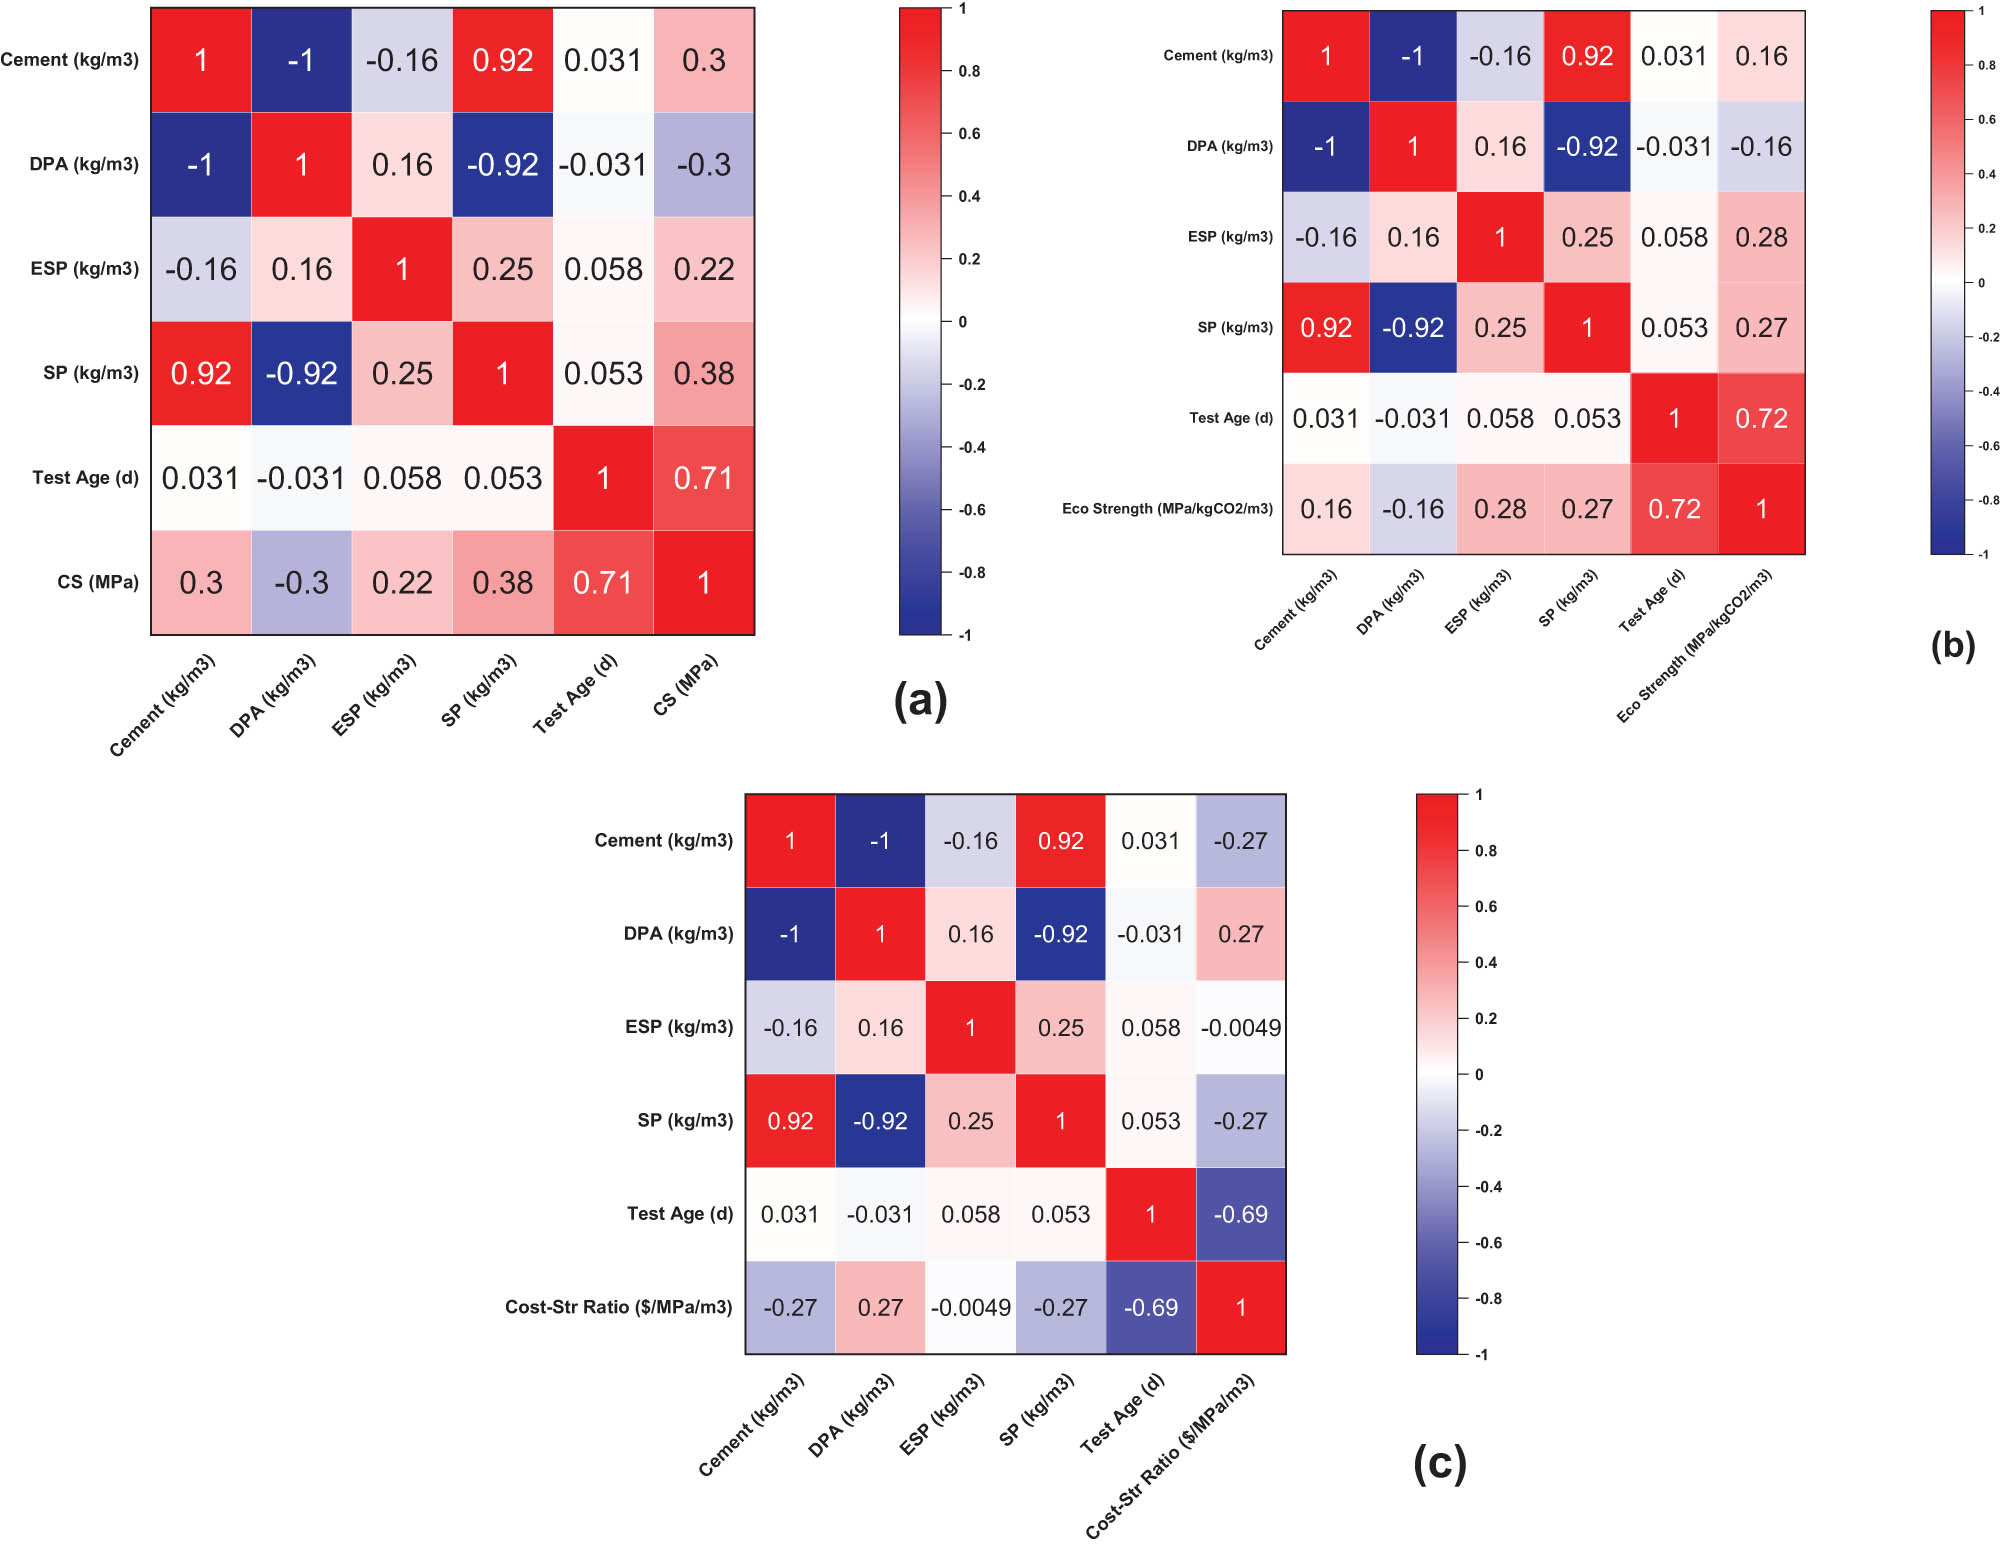
Correlation coefficient of the dataset: (a) CS, (b) ECR, and (c) CSR.
3 Methodology
The methodology involved the implementation of advanced modeling techniques to examine the correlations between the input variables (C, DPA, SP, ESP, and Age) and the output variables (CS, ECR, and CSR). After that, the models were fine-tuned for optimal performance by employing the modeling approach GEP to create the predictive models. This allowed for the correct prediction of output variables from each input. Figure 2 illustrates the flow chart of this study, which includes the sequential phases of data acquisition, model development, and validation. This methodical approach facilitated the identification of critical input variables and the development of predictive models that were both accurate and robust.

Flow chart of the study.
3.1 GEP
GEP is an expanded version of GP and genetic algorithms (GAs), which was initially presented by Koza [56,57]. In the field of domain-independent problem-solving, GP is defined as a strategy in which computer programs are progressed to resolve problems on the basis of the Darwinian principle of reproduction and fittest survival, as well as similarities of naturally occurring genetic processes like mutation crossover. The GA relies on a population of potential solutions known as individuals. Individuals are typically made up of a single chromosome, and each individual may have one or more genes that are separated into tail and head segments. The selection process continues by picking individuals based on their fitness, and genetic diversity is initiated by employing one or more genetic operators to resolve optimization problems. The majority of the genetic operators that are utilized in GAs are also capable of being executed in GEPs with very few modifications. These GEPs are composed of five primary components: fitness function, function set, control parameters, ending condition, and terminal set [58,59]. Figure 3 shows a flowchart illustrating a method for gene expression. For the purpose of representing solutions to issues, GEP makes use of character strings of a predetermined length. These solutions are then described as parse trees of varying sizes and forms. These trees are referred to as GEP ETs and other formulations that are linked to them can be created by following the approach, as shown in Figure 4. This technique is capable of performing well for the explicit formulation and predicting mechanical characteristics. In this method, all of the issues are denoted by ETs, which are made up of operators, constants, functions, and variables [60,61].
![Figure 3
GEP algorithm flowchart [62].](/document/doi/10.1515/rams-2025-0091/asset/graphic/j_rams-2025-0091_fig_003.jpg)
GEP algorithm flowchart [62].
![Figure 4
Decoding of the chromosome in GEP, containing two genes [63].](/document/doi/10.1515/rams-2025-0091/asset/graphic/j_rams-2025-0091_fig_004.jpg)
Decoding of the chromosome in GEP, containing two genes [63].
3.2 Developing GEP models
To establish a generalized connection, an exhaustive analysis was conducted on each parameter in the database, and the outcomes of an extensive number of preliminary trials were also analyzed. This was undertaken to acquire a comprehensive comprehension of the parameters that have the most substantial influence. As a result, it is assumed that the CS, ECS, and CSR are influenced by the parameters given in Eqs. (2)–(4):
When it comes to the process of developing reliable and all-encompassing models, it is of utmost importance to have a firm awareness of the significance of relevant variables. Both the findings of prior research and the outcomes of several test runs were taken into consideration when determining the parameters that were utilized for fitting the GEP technique. There is a correlation between the size of the population and the length of time it takes to complete the procedure. In the same way that the complexity of each term is dictated by the program, the number of sub-ETs can be determined by the size of the head. Control and regulation of the structure of the model created by the software are accomplished via the use of the head size. GeneXpro software was used to perform GEP simulation. The parameters that were employed in the GEP modeling are presented in Table 2, where parameters were chosen based on a previous study [64].
Parameter set for optimized GEP models (parameters similar to those in the study of Guan et al. [64]
| Parameters | Settings |
|---|---|
| General | CS, ECS, CSR |
| Linking function | Addition |
| Function set | Ln, √, +, −, ×, ÷ |
| Constant per gene | 10 |
| Head size | 7 |
| Chromosomes | 250 |
| Genes | 3 |
| Data type | Floating number |
| Inversion rate | 0.00546 |
| Mutation rate | 0.00138 |
| Gene transposition rate | 0.00277 |
| Stumbling mutation | 0.00141 |
| RIS transposition rate | 0.00546 |
| Gene recombination rate | 0.00277 |
| Lower bound | −10 |
| Upper bound | 10 |
| Random chromosomes | 0.0026 |
In order to prevent overfitting, GEP implements mechanisms such as controlled genetic operations and multi-population strategies. The GEP models are intended to prevent excessive complexity by employing fitness functions that penalize excessively intricate solutions, thereby promoting the development of simplified, more generalizable models in the specific context of this study. The derived equations are guaranteed to maintain interpretability and robustness while achieving high predictive accuracy through the use of adaptive selection pressures in conjunction with this approach. Furthermore, GEP inherently evaluates model stability and mitigates the risk of overfitting the training data by utilizing internal cross-validation during the training phase.
3.3 Model validation
The accuracy and reliability of the predictive models were evaluated by the implementation of numerous statistical tests during model validation. The coefficient of determination (R 2), mean absolute error (MAE), root mean square error (RMSE), and root mean squared logarithmic error (RMSLE) were the performance metrics employed for validation. The overall fit of the model is indicated by the proportion of the variance in the output variables that is predictable from the input variables, which is calculated using Eq. (5). It is denoted as R 2. Eq. (6) defines MAE as the average absolute variance among estimated and actual values, which provides insight into the model’s prediction accuracy. RMSE, as delineated in Eq. (7), is used to calculate the average magnitude of prediction errors, emphasizing larger errors as a result of its squaring effect. On the other hand, RMSLE, as given in Eq. (8), is employed to penalize underestimation errors more than overestimation errors, with an emphasis on the relative differences between estimated and actual values. The model’s efficacy in accurately anticipating the output variables was confirmed by the exhaustive evaluation of its performance, which these metrics collectively assured. A thorough examination of the numerous statistical parameters is provided in Table 3 based on a recent study [64]:
Numerous statistical metrics correlated with varying error ranges [64]
| Evaluation criteria | Range | Model accuracy |
|---|---|---|
| RMSE | (0, ∞) | Greater precision if lesser |
| R 2 value | (0, 1) | Greater precision if higher |
| MAE | (0, ∞) | Greater precision if lesser |
| RMSLE | (0, ∞) | Greater precision if lesser |
Here,
4 Results
The prediction of CS, ECR, and CSR was assessed using the GEP model. ETs were constructed for each output variable, and the accuracy of the predictions was evaluated by calculating R 2. The following subsections provide a detailed discussion of these evaluations, which include the derived ETs and their corresponding R 2 values. These analyses offer a thorough examination of the model’s ability to exactly predict each of the output variables.
4.1 GEP CS model
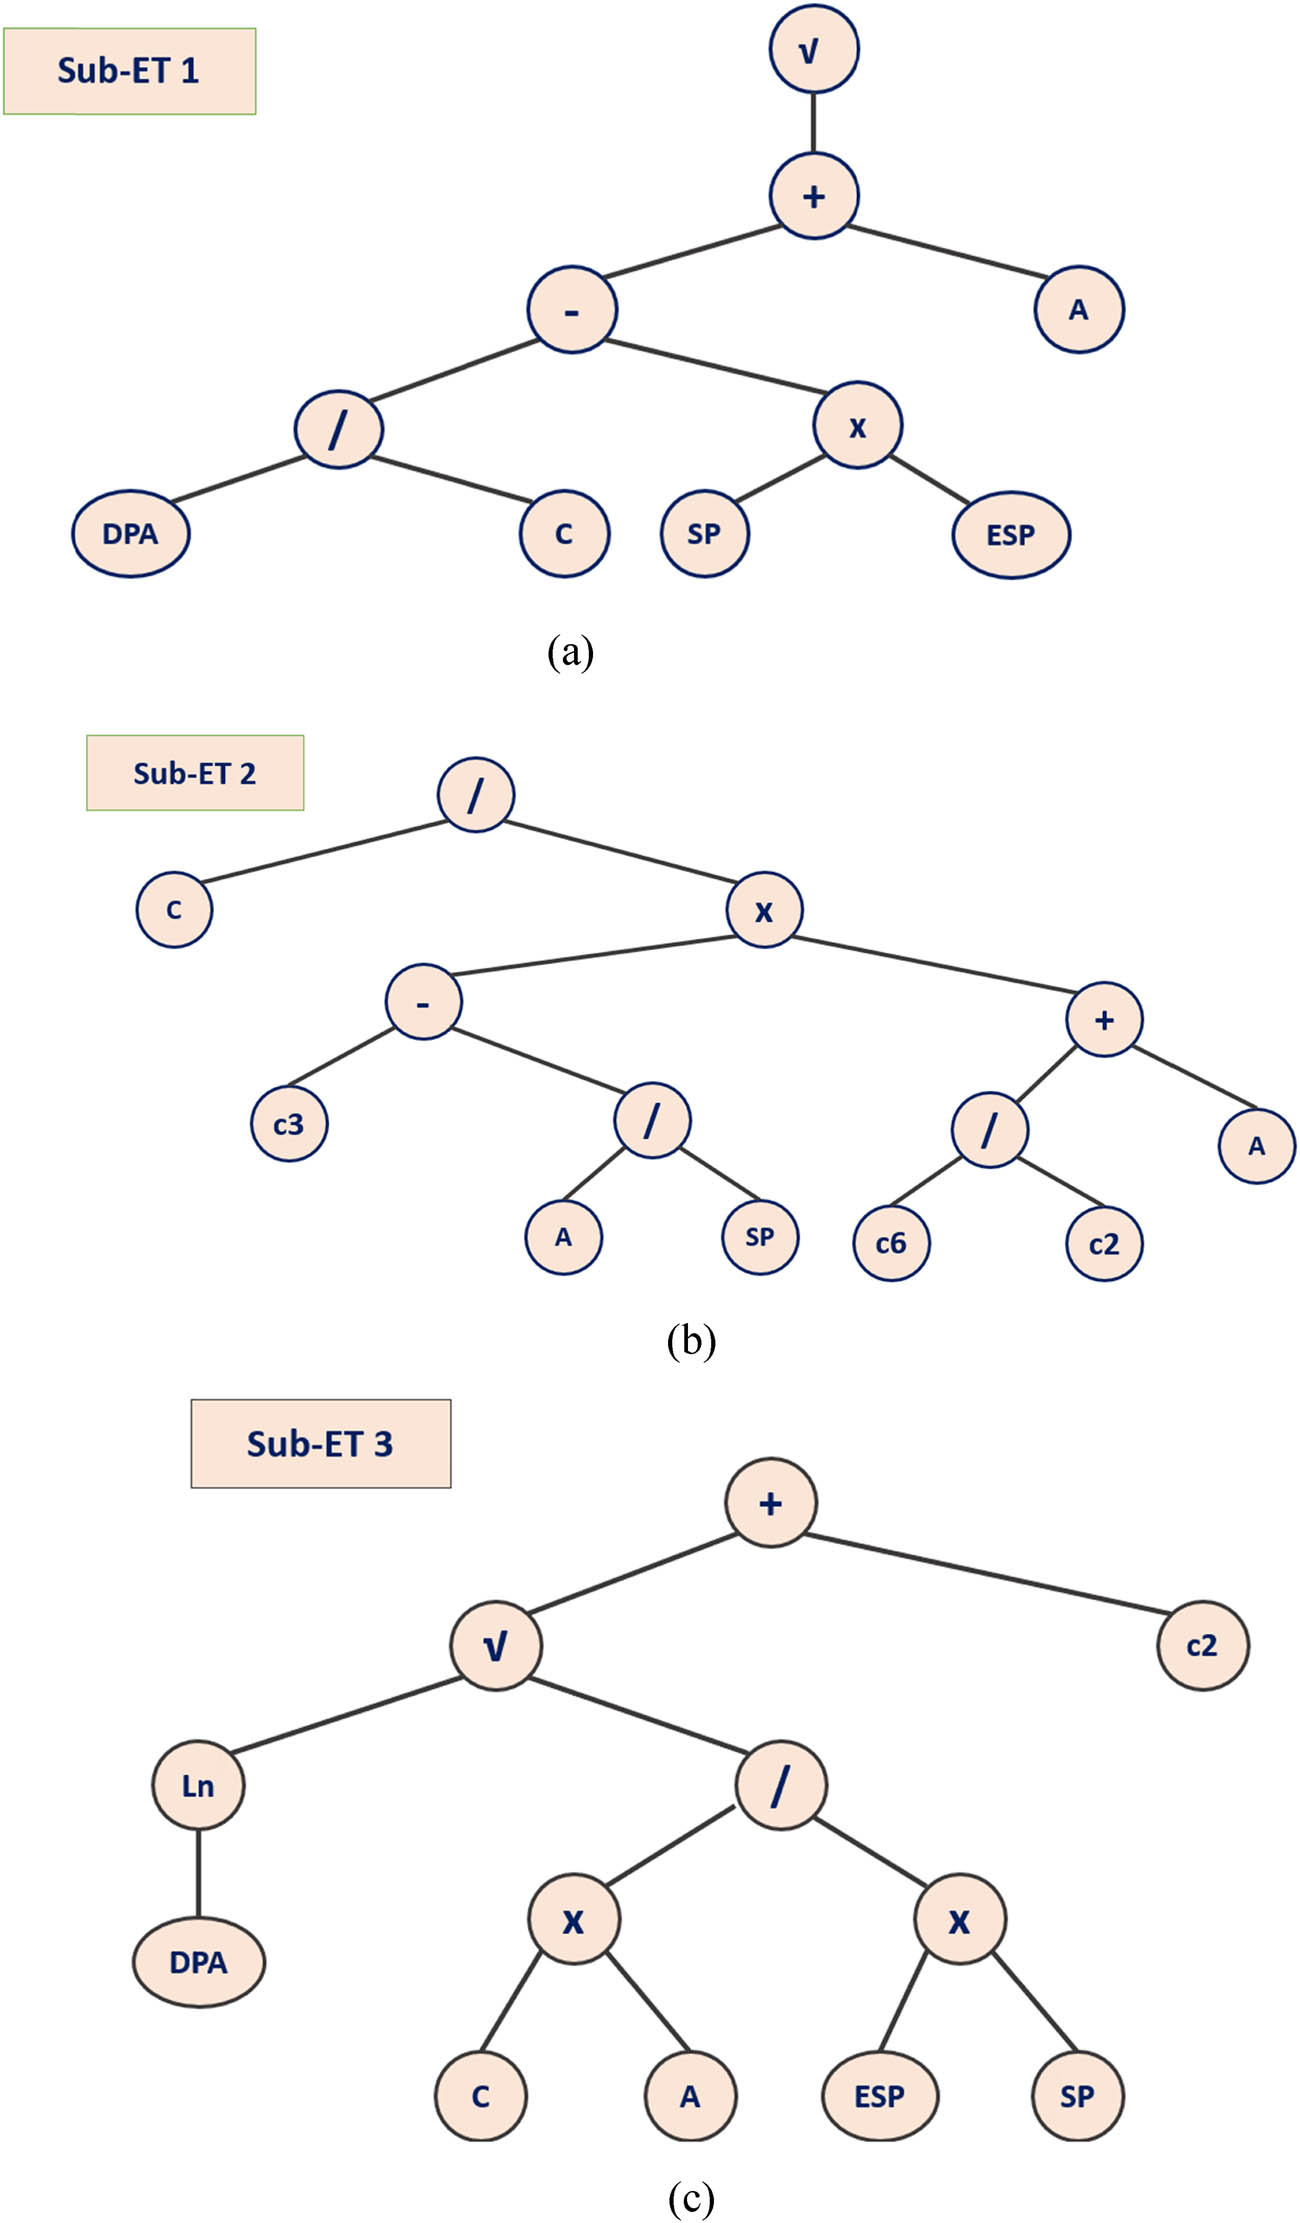
The output of the ideal GEP model is represented by the ET for predicting CS, as demonstrated in Figure 5(a)–(c). The model equation for predicting CS was obtained by decoding the ET. Eq. (9) is a fundamental forecasted formula which utilizes fundamental arithmetic operators, including Ln, +, −, /, √, and ×. From Sub-ETs 1, 2, and 3, three discrete variables are extracted and used in this equation. The decoded equation provides a clear and interpretable model for prediction by effectively capturing the connection between the inputs and CS. Eq. (9a) suggests that the impact of DPA and SP on cement can be represented through a logarithmic and inverse relationship, indicating a sensitive dependence of the blend’s properties on the ratio of these components. In Eq. (9b), the nested square root term involving ESP implies that even minor variations in ESP content may have a non-linear effect on certain material characteristics, possibly related to flowability or structural integrity. Eq. (9c) reveals that the DPA-to-cement ratio, when combined with the additive effects of ESP, can significantly influence the final material properties, emphasizing a need for a careful balance in the mix design. These equations, therefore, not only capture the mathematical interactions but also offer a deeper understanding of how each component contributes to the overall behavior of the material:
where

ETS of the GEP model for CS. (a) Sub-ET 1; (b) Sub-ET 2; (c) Sub-ET 3.
The GEP model’s ability to predict CS was demonstrated by an R 2 value of 0.94, which suggests that the model accurately predicted the data, as illustrated in Figure 6. An error analysis was also performed to compare the experimental values with the predicted values, as illustrated in Figure 7. According to the analysis, 40.5% of the forecasts had an error of less than 1 MPa, while 45.2% of the predictions were within the range of 1–4 MPa. A total of 14.3% of the results were predictions, with errors exceeding 4. The error statistics consist of an average error of 1.92 MPa, a lowest error of 0.47 MPa, and a maximum error of 5.41 MPa. The model’s efficacy is underscored by this exhaustive error analysis, which also pinpoints potential areas for enhancement. The high R 2 value confirms that, overall, the model is well-tuned for CS predictions, though certain cases may still benefit from additional fine-tuning to improve consistency across all data points.

Correlation among the actual and predicted CS for the GEP model.

Error analysis for the CS.
4.2 GEP ECR model
Figure 8(a)–(c) illustrates the ET for ECR. This ET is the output of the optimal GEP model and was decoded to create a mathematical equation for predicting ECR, as shown in Eq. (10). Basic arithmetic operations and specific variables obtained from the ETs are incorporated into the derived equation, as was done in the previous case. A transparent and comprehensible model for ECR prediction is provided by this mathematical formula, which encapsulates the interactions between input variables to accurately forecast ECR. Eq. (10a) suggests that the interaction between SP, C, and A relative to ESP and DPA affects the material properties in a non-linear fashion. Eq. (10b) reveals a logarithmic relationship involving the combination of SP and DPA with cement, modified by the presence of SP and A. This implies that changes in the ratios between these components can significantly influence the material’s behavior, possibly affecting flowability or bonding. Eq. (10c) indicates a complex interplay between cement, SP, and ESP relative to DPA, where the interaction between these parameters and a logarithmic term involving A can have substantial implications for the material’s stability and performance. Together, these equations highlight the intricate relationships among these components, emphasizing the importance of the precise mix design to achieve the desired material properties.
where

ETS of the GEP model for ECR. (a) Sub-ET 1; (b) Sub-ET 2; (c) Sub-ET 3.
As shown in Figure 9, the performance of the GEP model for predicting ECR resulted in an R 2 value of 0.91, which indicates that the model’s predictions are accurate to a high degree. In addition, an error analysis was carried out in order to compare the values obtained from the experiment with those predicted, as shown in Figure 10. According to the findings of the investigation, 39.8% of the forecasts had errors that were less than 0.003, and 36.3% of the forecasts had errors between 0.003 and 0.010. A total of 23.9% of the findings were composed of predictions that had errors greater than 0.10. According to the data on errors, the highest error is 0.015, the lowest error is 0.001, and the average error is 0.006, respectively. Similarly, the predominance of green markers in the figure aligns with this high R 2, showing that the model can reliably predict ECR in most cases. The few red markers representing error-prone cases are relatively isolated, suggesting the model effectively handles ECR predictions overall, with minor opportunities for improvement under special conditions.

Correlation among the actual and predicted ECR for the GEP model.

Error analysis for the ECR.
4.3 GEP CSR model
The optimal GEP model generates the ETs for predicting the CSR, as illustrated in Figure 11(a)–(c). The model equation for CSR prediction was obtained by decoding the ET, as illustrated in Eq. (11). The formula that results from this process employs fundamental arithmetic operations and variables from the decoded ET. The cost-effectiveness of the ESP–DPA concrete formulations can be accurately and interpretably predicted by this equation, which depicts the relationship between CSR and the input factors. Eq. (11a) describes a non-linear interaction involving DPA, C, SP, ESP, and A, affecting the resulting CSR. Eq. (11b) emphasizes the role of cement relative to SP and A, where the ratio of cement to a modified SP term directly impacts CSR. Eq. (11c) introduces a logarithmic dependency on DPA, modulated by the combination of C, A, ESP, and SP, suggesting that these components collectively influence CSR through sensitive variations. Together, these equations provide a structured approach to predicting CSR:
where
ETS of the GEP model for CSR. (a) Sub-ET 1; (b) Sub-ET 2; (c) Sub-ET 3.
Figure 12 illustrates that the GEP model’s CSR predictions were highly accurate, as evidenced by an R 2 value of 0.92. In order to compare the experimental values with the predicted values, an error analysis was also performed, as illustrated in Figure 13. Based on the analysis, 47% of the predictions had errors of less than 0.15, while 41.7% of the predictions had errors in the range of 0.15–0.4. Only 11.3% of the results were predictions, with errors exceeding 0.4. In terms of error statistics, the highest error is 0.58, the lowest error is 0.02, and the average error is 0.17. The distribution of red markers indicates certain complexities in predicting CSR accurately, possibly due to fluctuating cost factors. These error-prone areas suggest that while the model effectively captures the overall relationship, enhancing it to account for specific cost variations could further reduce prediction discrepancies and improve accuracy across all cases.
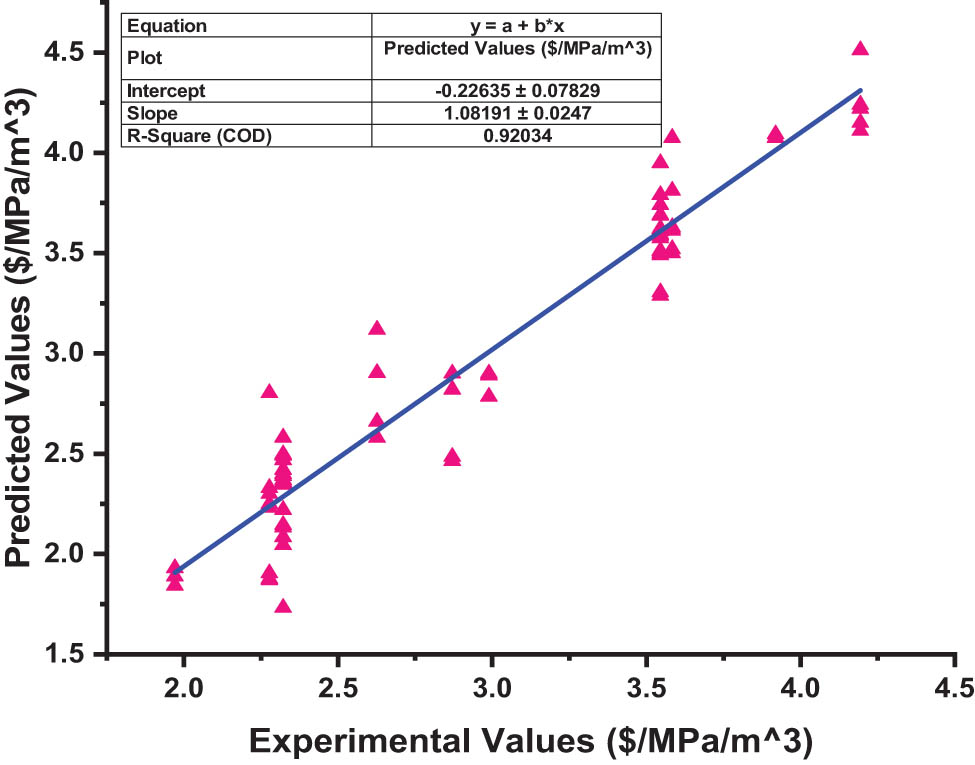
Correlation among the actual and predicted CSR for the GEP model.

Error analysis for the CSR.
4.4 Model validation
The GEP model’s predictions for CS, CSR, and ECR were thoroughly evaluated using an extensive variety of statistical checks to determine their accuracy and reliability. The checks that were included in this analysis were MAE, RMSE, and RMSLE. The specifics of the statistical tests are illustrated in Figure 14. The GEP model for CS achieved an MAE of 1.915, indicating that the average absolute variance among the estimated and actual values was 1.915. The RMSE for CS was 2.37, which was used to determine the standard deviation of the prediction errors. This value highlights the squaring effect, which results in greater discrepancies. The RMSLE value for CS was 0.063, and its primary focus was on the relative differences between predicted and actual values. These results suggest that the model is capable of reliably predicting CS with relatively low errors. The CSR GEP model demonstrated an MAE of 0.177, which suggests a small average absolute variance between the predicted and actual values. An RMSLE of 0.073 and an RMSE of 0.23, which indicate a low standard deviation of the prediction errors, exemplify the model’s ability to effectively manage both small and large values. These metrics assure the reliability of cost-effectiveness assessments of the ESP-DPA concrete mixtures, underscoring the model’s capacity to accurately predict CSR. The GEP model achieved an MAE of 0.04, which is an exceptionally low value for ECR. This value denotes the smallest average absolute variance among the predicted and actual values. An RMSE of 0.073 for ECR, which indicates very small standard deviations of the prediction errors, and an RMSLE of 0.072 demonstrated the model’s precision in capturing the relative differences between the predicted and actual values. These findings support the model’s robustness and accuracy in predicting ECR. The results demonstrated low error values across these metrics, indicating strong predictive accuracy and reinforcing the reliability of the models. In general, the statistical evaluations for CS, CSR, and ECR suggest that the GEP model produces predictions that are both precise and dependable, with negligible errors in all metrics. This comprehensive evaluation underscores the model’s capacity to accurately represent the complex relationships among the input variables and their corresponding output variables, ensuring confidence in their predictive capabilities.

Comparative analysis of statistical check results for CS, CSR, and ECR.
5 Outcomes of SHAP analysis
The SHAP study offers a thorough approach for evaluating ML models [65]. The Shapely score is an approach used to quantify the comparative impact and influence of each input parameter on the final model outcome. It is similar to parametric evaluation, where all parameters, excluding one, are kept continual, and the effect of the parameter in a query on the output characteristic is noted. The model generates a predicted result for each expected sample, and the SHAP score represents the amount assigned to each feature in the supplied sample [66]. This study investigated how input factors affect the CS, CSR, and ECR of DPA–ESP concrete. The entire data sample utilizes the SHAP tree explainer to provide a detailed depiction of localized SHAP explanations and the overall impact of characteristics.
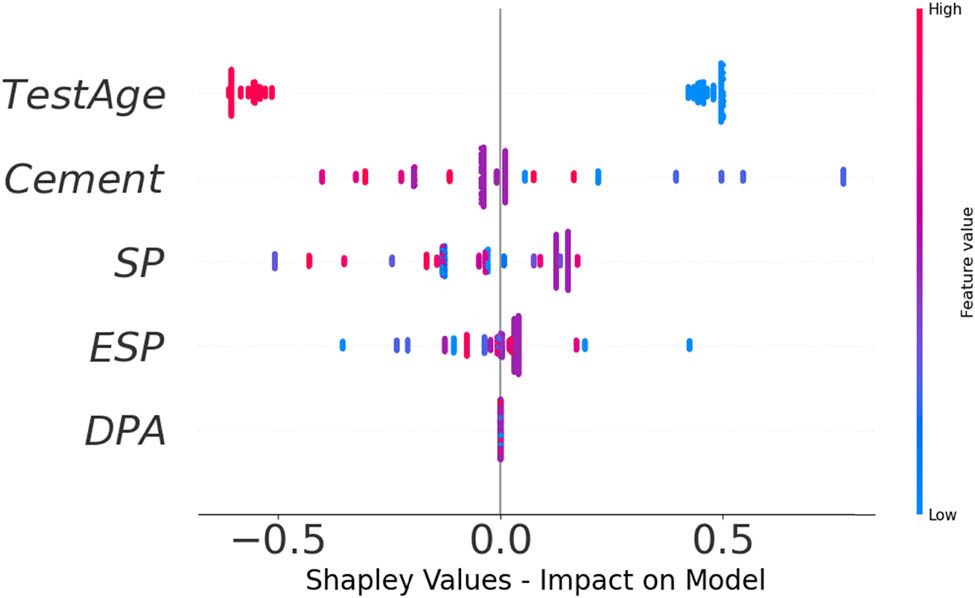
The SHAP plot results are illustrated in Figure 15, which illustrates the impact of input parameters on the CS of DPA–ESP concrete. The x-axis of the SHAP diagram indicates the impact of each factor, while the values of each input element are displayed using a color spectrum. The analysis establishes that the specimen’s age (test age) is the primary determinant of CS, with cement quantity, ESP, SP, and DPA following in that order. The CS is positively influenced by the test age and cement quantity, indicating that an increase in either factor can increase the strength. ESP and SP, on the other hand, demonstrate both positive and negative effects, suggesting that their impact on CS can fluctuate based on their interactions and levels. The impact of DPA, however, remains uncertain as a result of the dataset’s limited variation, which implies that additional research may be necessary to gain a comprehensive understanding of its role. These insights emphasize the potential of ESP and DPA as partial cement replacements, which may have a beneficial impact on environmental sustainability and concrete performance.

SHAP values for the CS.
Figure 16 illustrates the SHAP plot for the ECR of DPA–ESP concrete. The most significant factors in this study were test age and ESP, which suggest a primarily positive influence on ECR. This influence may be associated with the curing process and material properties. The order of influencing factors is as follows: test age, ESP, cement, SP, and DPA. Cement and SP have both positive and negative effects on ECR, indicating that their impact may be contingent upon specific conditions. It is important to note that the limited variation in DPA data hindered the ability to draw definitive conclusions regarding its influence on ECR. The results of this analysis emphasize that, although test age and ESP have a positive impact on ECR, it is crucial to balance other components, particularly cement and SP, in order to optimize ECR performance in DPA–ESP concrete.

SHAP values for the ECR.
The test age is once again the most influential factor in the SHAP plot for CSR of DPA–ESP concrete, as illustrated in Figure 17. This finding is consistent with its significance in CS and ECR. In descending order of impact, the remaining influencing factors are SP, DPA, ESP, and cement. It is intriguing that the test age and cement exhibit a more negative correlation with CSR, indicating that, despite their importance, their impact may potentially diminish CSR under specific circumstances. The impacts of SP and ESP on CSR are both positive and negative. The DPA dataset’s impact was equivocal due to its limited variation. It is evident from this analysis that the substitution of cement with ESP and DPA in DPA–ESP concrete can result in economic and environmental benefits in addition to its performance benefits.
SHAP values for the CSR.
6 Discussion
This study aimed to develop ML forecast models for the CS, ECR, and CSR of DPA-ESP concrete. In cases where the R 2 value is low, experimental validation should be preferred over model predictions, as a lower R 2 suggests that the model may not fully capture the complexity of the data, leading to potential inaccuracies. For applications requiring precise predictions, especially in high-stakes or safety-critical environments, validation through experimental testing can ensure accuracy and mitigate risks associated with model limitations. However, in this case, the R 2 values for all three models are high (0.94 for CS, 0.91 for ECR, and 0.92 for CSR), indicating strong predictive reliability. Also, the statistical check values are lower. Thus, the models can be applied confidently, although conservative interpretation is recommended in cases where larger deviations may impact critical decisions. The GEP ML method is used for this purpose as it provides model equations for future use. Additionally, the SHAP analysis method was employed to determine the importance of different features on the model outputs. The results of this study yielded GEP estimation models that closely aligned with experimental findings. These models can be utilized to calculate the CS, ECR, and CSR of DPA–ESP concrete using various input components, thereby decreasing the time, effort, and cost required for further experiments. Furthermore, the SHAP study showed the effect of input features on the CS, ECR, and CSR of DPA–ESP concrete, providing valuable insights for academics and industry in selecting the quantity of raw ingredients during DAP–ESP concrete production. The prediction models will be limited to the CS, ECR, and CSR of DPA–ESP concrete since the GEP models developed in this research can only receive values from a certain set of five inputs. The dependability of predictions is guaranteed due to the utilization of uniform units and test techniques across all models in the database. To gain a deeper understanding of the mix proportions and the impact of each aspect, the models yielded mathematical equations. The output models will not work if the analysis has less or more than five inputs. The accuracy of the model’s predictions in this study relies on the consistency of input units. Previous studies using experimental and ML approaches to analyze alternative materials emphasize the importance of precise inputs and robust methodologies to ensure reliable and insightful results [67,68,69].
ML-based prediction models have various practical applications in the construction sector, such as predicting the strength of materials, conducting predictive maintenance, assessing risks, ensuring quality control, and optimizing energy efficiency. However, ML models do have certain limitations, including challenges related to accessing data, achieving high accuracy, managing costs, and requiring human interaction. Future research should prioritize the incorporation of the Internet of Things, the creation of hybrid models, the implementation of Explainable AI methods, the inclusion of sustainability aspects, and the establishment of standardized data collection and sharing practices within the industry. These efforts will help overcome existing limitations and enhance the efficiency of ML-based results. These advancements have the potential to provide more precise and up-to-date information, improve productivity, increase transparency, facilitate understanding, and enable well-informed decision-making. As a consequence, they may help reduce project delays, enhance safety, and promote sustainability in the construction sector.
7 Conclusions
GEP was implemented in this research to generate predictive models for three critical performance metrics of DPA and ESP-modified concrete, including CS, ECR, and CSR. The selection of GEP, a type of evolutionary algorithm, was based on its capacity to develop mathematical expressions that accurately represent the intricate relationships between numerous input variables. Moreover, the SHAP analysis yielded the impact of each input on model outputs. The main findings of this study are as follows:
The mathematical equation-based GEP models for the CS, ECR, and CSR of DPA-ESP concrete agreed well with the experimental findings and can be used for future predictions, thereby reducing the time, effort, and cost required for further experiments.
The model’s accuracy was confirmed with an R 2 value of 0.94 for CS and similarly high values of 0.91 for ECR and 0.92 for CSR.
The absolute error analysis for CS revealed that 45.2% of the predictions were between 1 and 4, 14.3% were greater than 4, and 40.5% had errors of less than 1. The error distribution for CSR was similarly low, and for ECR, the errors were minimal, suggesting robust predictive performance across all variables.
The reliability and accuracy of the models for CS, CSR, and ECR were also verified through statistical evaluations such as MAE, RMSE, and RMSLE. For example, MAE, RMSE, and RMSLE for the CS GEP model were 1.915, 2.37, and 0.063 MPa, respectively.
SHAP study exhibited that the age of the specimen (test age) was the crucial factor for all outputs (CS, ECR, and CSR), exhibiting a positive impact on CS and ECR and a negative impact on CSR. The impact of cement was found to be more positive with the CS, more negative with the CSR, and both negative and positive with the ECR. This implies that cement replacement with ESP and DPA may have both cost and environmental benefits.
The model predictions are adapted to the dataset and five input variables, predicting DPA–ESP concrete CS, ECR, and CSR in this structured input framework. Nevertheless, this specificity also implies that the model may become ineffective or lose accuracy if it is used with fewer or additional variables or if inconsistent units are applied to the inputs. Although the model exhibits high R 2 values (0.94 for CS, 0.91 for ECR, and 0.92 for CSR), which suggest strong reliability within these constraints, future research could seek to broaden the model to include additional SCMs or environmental factors. The model’s adaptability to various concrete compositions would be enhanced by the inclusion of SCMs such as fly ash, silica fume, and slag cement. Furthermore, customizing the model to suit a variety of geographical regions would take into account environmental factors such as temperature, humidity, and the availability of raw materials. This would increase the model’s efficacy in a variety of construction settings and climates, thereby expanding its application to a wider range of contexts.
Acknowledgments
The authors acknowledge the Deanship of Scientific Research, Vice Presidency for Graduate Studies and Scientific Research, King Faisal University, Saudi Arabia (Grant No. KFU250366). The authors extend their appreciation for the financial support that made this study possible.
-
Funding information: This work was supported by the Deanship of Scientific Research, Vice Presidency for Graduate Studies and Scientific Research, King Faisal University, Saudi Arabia (Grant No. KFU250366).
-
Author contributions: M.N.A.: supervision, project administration, investigation, funding acquisition, writing, reviewing, and editing. B.I.: software, validation, methodology, writing-original draft, reviewing, and editing. K.K.: formal analysis, funding acquisition, methodology, writing, reviewing, and editing. M.T.Q.: investigation, resources, funding acquisition, writing, reviewing, and editing. All authors have accepted responsibility for the entire content of this manuscript and approved its submission.
-
Conflicts of interest: The authors state no conflict of interest.
-
Data availability statement: The datasets generated and/or analyzed during the current study are available from the corresponding author upon reasonable request.
References
[1] Watson, R., B. Abbassi, and Z. S. Abu-Hamatteh. Life cycle analysis of concrete and asphalt used in road pavements. Environmental Engineering Research, Vol. 25, 2020, pp. 52–61.10.4491/eer.2018.399Search in Google Scholar
[2] Vázquez-Calle, K., V. Guillén-Mena, and F. Quesada-Molina. Analysis of the embodied energy and CO2 emissions of ready-mixed concrete: a case study in Cuenca, Ecuador. Materials, Vol. 15, 2022, id. 4896.10.3390/ma15144896Search in Google Scholar PubMed PubMed Central
[3] Liu, Y., B. Wang, Z. Qian, J. Yu, T. Shi, Y. Fan, et al. State-of-the art on preparation, performance, and ecological applications of planting concrete. Case Studies in Construction Materials, Vol. 20, 2024, id. e03131.10.1016/j.cscm.2024.e03131Search in Google Scholar
[4] Zhao, H., Y. Wang, X. Liu, X. Wang, Z. Chen, Z. Lei, et al. Review on solid wastes incorporated cementitious material using 3D concrete printing technology. Case Studies in Construction Materials, Vol. 21, 2024, id. e03676.10.1016/j.cscm.2024.e03676Search in Google Scholar
[5] Ibn-Mohammed, T., R. Greenough, S. Taylor, L. Ozawa-Meida, and A. Acquaye. Operational vs embodied emissions in buildings – A review of current trends. Energy and Buildings, Vol. 66, 2013, pp. 232–245.10.1016/j.enbuild.2013.07.026Search in Google Scholar
[6] Chen, S., Y. Teng, Y. Zhang, C. K. Y. Leung, and W. Pan. Reducing embodied carbon in concrete materials: A state-of-the-art review. Resources, Conservation and Recycling, Vol. 188, 2023, id. 106653.10.1016/j.resconrec.2022.106653Search in Google Scholar
[7] Bekun, F. V., A. A. Alola, B. A. Gyamfi, P. A. Kwakwa, and G. Uzuner. Econometrics analysis on cement production and environmental quality in European Union countries. International Journal of Environmental Science and Technology, Vol. 20, 2023, pp. 4265–4280.10.1007/s13762-022-04302-9Search in Google Scholar
[8] Mossie, A. T., D. Khatiwada, B. Palm, and G. Bekele. Investigating energy saving and climate mitigation potentials in cement production – A case study in Ethiopia. Energy Conversion and Management, Vol. 287, 2023, id. 117111.10.1016/j.enconman.2023.117111Search in Google Scholar
[9] Maddalena, R., J. J. Roberts, and A. Hamilton. Can Portland cement be replaced by low-carbon alternative materials? A study on the thermal properties and carbon emissions of innovative cements. Journal of Cleaner Production, Vol. 186, 2018, pp. 933–942.10.1016/j.jclepro.2018.02.138Search in Google Scholar
[10] Kumar, M., S. Prashant, and M. V. Kamath. Enhancing the sustainability of high strength concrete in terms of embodied energy and carbon emission by incorporating sewage sludge and fly ash. Innovative Infrastructure Solutions, Vol. 7, 2022, id. 240.10.1007/s41062-022-00837-5Search in Google Scholar
[11] Shah, B., M. Shah, V. Shah, and M. Prajapati. An Anatomized study on the progress and prospects of CO2 utilization technology. Case Studies in Chemical and Environmental Engineering, Vol. 8, 2023, id. 100381.10.1016/j.cscee.2023.100381Search in Google Scholar
[12] Li, X., D. Qin, Y. Hu, W. Ahmad, A. Ahmad, F. Aslam, et al. A systematic review of waste materials in cement-based composites for construction applications. Journal of Building Engineering, Vol. 45, 2021, id. 103447.10.1016/j.jobe.2021.103447Search in Google Scholar
[13] Datta, S. D., M. J. Rana, M. N. Assafi, N. J. Mim, and S. Ahmed. Investigation on the generation of construction wastes in Bangladesh. International Journal of Construction Management, Vol. 23, 2023, pp. 2260–2269.10.1080/15623599.2022.2050977Search in Google Scholar
[14] Hossain, M. A., S. D. Datta, A. S. M. Akid, M. H. R. Sobuz, and M. S. Islam. Exploring the synergistic effect of fly ash and jute fiber on the fresh, mechanical and non-destructive characteristics of sustainable concrete. Heliyon, Vol. 9, 2023, id. e21708.10.1016/j.heliyon.2023.e21708Search in Google Scholar PubMed PubMed Central
[15] Datta, S. D., M. A. Al Meyad, F. A. B. Hoque, M. F. H. Anik, D. M. F. S. Shafi, and M. S. Abdullah. Strategic formulation of ultra-high performance concrete emphasizing compressive strength analysis and sustainability evaluation. In 7th International Conference on Civil Engineering for Sustainable Development (ICCESD 2024), 2024, p. 4.10.2991/978-94-6463-478-5_2Search in Google Scholar
[16] Al-Kutti, W., A. B. M. Saiful Islam, and M. Nasir. Potential use of date palm ash in cement-based materials. Journal of King Saud University – Engineering Sciences, Vol. 31, 2019, pp. 26–31.10.1016/j.jksues.2017.01.004Search in Google Scholar
[17] Amin, M. N., W. Ahmad, K. Khan, S. Nazar, A. M. A. Arab, and A. F. Deifalla. Evaluating the relevance of eggshell and glass powder for cement-based materials using machine learning and SHapley Additive exPlanations (SHAP) analysis. Case Studies in Construction Materials, Vol. 19, 2023, id. e02278.10.1016/j.cscm.2023.e02278Search in Google Scholar
[18] Sobuz, M. H., M. S. Islam, A. S. Akid, S. D. Datta, T. S. Alahmari, N. M. S. Hasan, et al. Mechanical properties and flexural response of palm shell aggregate lightweight reinforced concrete beam. Sustainability, Vol. 15, 2023, id. 15783.10.3390/su152215783Search in Google Scholar
[19] Hasan, N. M. S., M. H. R. Sobuz, N. M. N. Shaurdho, M. M. Meraz, S. D. Datta, F. S. Aditto, et al. Eco-friendly concrete incorporating palm oil fuel ash: Fresh and mechanical properties with machine learning prediction, and sustainability assessment. Heliyon, Vol. 9, 2023, id. e22296.10.1016/j.heliyon.2023.e22296Search in Google Scholar PubMed PubMed Central
[20] Al-Kutti, W., M. Nasir, M. A. Megat Johari, A. B. M. S. Islam, A. A. Manda, and N. I. Blaisi. An overview and experimental study on hybrid binders containing date palm ash, fly ash, OPC and activator composites. Construction and Building Materials, Vol. 159, 2018, pp. 567–577.10.1016/j.conbuildmat.2017.11.017Search in Google Scholar
[21] Blaisi, N. I. Environmental assessment of utilizing date palm ash as partial replacement of cement in mortar. Journal of Hazardous Materials, Vol. 357, 2018, pp. 175–179.10.1016/j.jhazmat.2018.06.013Search in Google Scholar PubMed
[22] Nasir, M. and W. Al-Kutti. Performance of date palm ash as a cementitious material by evaluating strength, durability, and characterization. Buildings, Vol. 9, 2018, id. 6.10.3390/buildings9010006Search in Google Scholar
[23] Yang, D., J. Zhao, W. Ahmad, M. Nasir Amin, F. Aslam, K. Khan, et al. Potential use of waste eggshells in cement-based materials: A bibliographic analysis and review of the material properties. Construction and Building Materials, Vol. 344, 2022, id. 128143.10.1016/j.conbuildmat.2022.128143Search in Google Scholar
[24] Zaid, O., S. R. Zamir Hashmi, M. H. El Ouni, R. Martínez-García, J. de Prado-Gil, and S. E. A. S. Yousef. Experimental and analytical study of ultra-high-performance fiber-reinforced concrete modified with egg shell powder and nano-silica. Journal of Materials Research and Technology, Vol. 24, 2023, pp. 7162–7188.10.1016/j.jmrt.2023.04.240Search in Google Scholar
[25] Sohu, S., N. Bheel, A. A. Jhatial, A. A. Ansari, and I. A. Shar. Sustainability and mechanical property assessment of concrete incorporating eggshell powder and silica fume as binary and ternary cementitious materials. Environmental Science and Pollution Research, Vol. 29, 2022, pp. 58685–58697.10.1007/s11356-022-19894-5Search in Google Scholar PubMed
[26] Nandhini, K. and J. Karthikeyan. Sustainable and greener concrete production by utilizing waste eggshell powder as cementitious material – A review. Construction and Building Materials, Vol. 335, 2022, id. 127482.10.1016/j.conbuildmat.2022.127482Search in Google Scholar
[27] Jhatial, A. A., W. I. Goh, K. H. Mo, S. Sohu, and I. A. Bhatti. Green and sustainable concrete–the potential utilization of rice husk ash and egg shells. Civil Engineering Journal, Vol. 5, 2019, pp. 74–81.10.28991/cej-2019-03091226Search in Google Scholar
[28] Hakeem, I. Y., M. Amin, I. S. Agwa, M. H. Abd-Elrahman, O. M. O. Ibrahim, and M. Samy. Ultra-high-performance concrete properties containing rice straw ash and nano eggshell powder. Case Studies in Construction Materials, Vol. 19, 2023, id. e02291.10.1016/j.cscm.2023.e02291Search in Google Scholar
[29] Hamada, H., B. Tayeh, F. Yahaya, K. Muthusamy, and A. Al-Attar. Effects of nano-palm oil fuel ash and nano-eggshell powder on concrete. Construction and Building Materials, Vol. 261, 2020, id. 119790.10.1016/j.conbuildmat.2020.119790Search in Google Scholar
[30] Rasid, N. N., N. H. Khalid, A. Mohamed, A. R. Sam, Z. A. Majid, and G. F. Huseien. Ground palm oil fuel ash and calcined eggshell powder as SiO2–CaO based accelerator in green concrete. Journal of Building Engineering, Vol. 65, 2023, id. 105617.10.1016/j.jobe.2022.105617Search in Google Scholar
[31] Deifalla, A. F., A. G. Zapris, and C. E. Chalioris. Multivariable regression strength model for steel fiber-reinforced concrete beams under torsion. Materials, Vol. 14, 2021, id. 3889.10.3390/ma14143889Search in Google Scholar PubMed PubMed Central
[32] Emad, W., A. S. Mohammed, A. Bras, P. G. Asteris, R. Kurda, Z. Muhammed, et al. Metamodel techniques to estimate the compressive strength of UHPFRC using various mix proportions and a high range of curing temperatures. Construction and Building Materials, Vol. 349, 2022, id. 128737.10.1016/j.conbuildmat.2022.128737Search in Google Scholar
[33] Huang, H., M. Guo, W. Zhang, J. Zeng, K. Yang, and H. Bai. Numerical investigation on the bearing capacity of RC columns strengthened by HPFL-BSP under combined loadings. Journal of Building Engineering, Vol. 39, 2021, id. 102266.10.1016/j.jobe.2021.102266Search in Google Scholar
[34] Guo, M., H. Huang, W. Zhang, C. Xue, and M. Huang. Assessment of RC frame capacity subjected to a loss of corner column. Journal of Structural Engineering, Vol. 148, 2022, id. 04022122.10.1061/(ASCE)ST.1943-541X.0003423Search in Google Scholar
[35] Datta, S. D., M. Islam, M. H. Rahman Sobuz, S. Ahmed, and M. Kar. Artificial intelligence and machine learning applications in the project lifecycle of the construction industry: A comprehensive review. Heliyon, Vol. 10, 2024, id. e26888.10.1016/j.heliyon.2024.e26888Search in Google Scholar PubMed PubMed Central
[36] Ebid, A. M. and A. Deifalla. Prediction of shear strength of FRP reinforced beams with and without stirrups using (GP) technique. Ain Shams Engineering Journal, Vol. 12, 2021, pp. 2493–2510.10.1016/j.asej.2021.02.006Search in Google Scholar
[37] Fan, S., T. He, W. Li, C. Zeng, P. Chen, L. Chen, et al. Machine learning-based classification of quality grades for concrete vibration behaviour. Automation in Construction, Vol. 167, 2024, id. 105694.10.1016/j.autcon.2024.105694Search in Google Scholar
[38] Khan, K., A. Ahmad, M. N. Amin, W. Ahmad, S. Nazar, and A. M. Arab. Comparative study of experimental and modeling of fly ash-based concrete. Materials, Vol. 15, 2022, id. 3762.10.3390/ma15113762Search in Google Scholar PubMed PubMed Central
[39] Ahmed, H. U., A. S. Mohammed, R. H. Faraj, S. M. A. Qaidi, and A. A. Mohammed. Compressive strength of geopolymer concrete modified with nano-silica: Experimental and modeling investigations. Case Studies in Construction Materials, Vol. 16, 2022, id. e01036.10.1016/j.cscm.2022.e01036Search in Google Scholar
[40] Shafighfard, T., F. Bagherzadeh, R. A. Rizi, and D.-Y. Yoo. Data-driven compressive strength prediction of steel fiber reinforced concrete (SFRC) subjected to elevated temperatures using stacked machine learning algorithms. Journal of Materials Research and Technology, Vol. 21, 2022, pp. 3777–3794.10.1016/j.jmrt.2022.10.153Search in Google Scholar
[41] Nazar, S., J. Yang, X.-E. Wang, K. Khan, M. N. Amin, M. F. Javed, et al. Estimation of strength, rheological parameters, and impact of raw constituents of alkali-activated mortar using machine learning and SHapely Additive exPlanations (SHAP). Construction and Building Materials, Vol. 377, 2023, id. 131014.10.1016/j.conbuildmat.2023.131014Search in Google Scholar
[42] Nazar, S., J. Yang, M. N. Amin, K. Khan, M. F. Javed, and F. Althoey. Formulation of estimation models for the compressive strength of concrete mixed with nanosilica and carbon nanotubes. Developments in the Built Environment, Vol. 13, 2023, id. 100113.10.1016/j.dibe.2022.100113Search in Google Scholar
[43] Gandomi, A. H., S. K. Babanajad, A. H. Alavi, and Y. Farnam. Novel approach to strength modeling of concrete under triaxial compression. Journal of Materials in Civil Engineering, Vol. 24, 2012, pp. 1132–1143.10.1061/(ASCE)MT.1943-5533.0000494Search in Google Scholar
[44] Gandomi, A. H., G. J. Yun, and A. H. Alavi. An evolutionary approach for modeling of shear strength of RC deep beams. Materials and Structures, Vol. 46, 2013, pp. 2109–2119.10.1617/s11527-013-0039-zSearch in Google Scholar
[45] Ferreira, C. Gene expression programming: mathematical modeling by an artificial intelligence, Vol. 21, Springer, Berlin, Germany, 2006.10.1007/3-540-32498-4_2Search in Google Scholar
[46] Tian, Q., Y. Lu, J. Zhou, S. Song, L. Yang, T. Cheng, et al. Supplementary cementitious materials-based concrete porosity estimation using modeling approaches: A comparative study of GEP and MEP. Reviews on Advanced Materials Science, Vol. 63, 2024, id. 20230189.10.1515/rams-2023-0189Search in Google Scholar
[47] Tian, Q., Y. Lu, J. Zhou, S. Song, L. Yang, T. Cheng, et al. Compressive strength of waste-derived cementitious composites using machine learning. Reviews on Advanced Materials Science, Vol. 63, 2024, id. 20240008.10.1515/rams-2024-0008Search in Google Scholar
[48] Tian, Q., Y. Lu, J. Zhou, S. Song, L. Yang, T. Cheng, et al. Exploring the viability of AI-aided genetic algorithms in estimating the crack repair rate of self-healing concrete. Reviews on Advanced Materials Science, Vol. 63, 2024, id. 20230179.10.1515/rams-2023-0179Search in Google Scholar
[49] Jalal, F. E., Y. Xu, M. Iqbal, M. F. Javed, and B. Jamhiri. Predictive modeling of swell-strength of expansive soils using artificial intelligence approaches: ANN, ANFIS and GEP. Journal of Environmental Management, Vol. 289, 2021, id. 112420.10.1016/j.jenvman.2021.112420Search in Google Scholar PubMed
[50] Kashem, A., R. Karim, S. C. Malo, P. Das, S. D. Datta, and M. Alharthai. Hybrid data-driven approaches to predicting the compressive strength of ultra-high-performance concrete using SHAP and PDP analyses. Case Studies in Construction Materials, Vol. 20, 2024, id. e02991.10.1016/j.cscm.2024.e02991Search in Google Scholar
[51] Karim, R., M. H. Islam, S. D. Datta, and A. Kashem. Synergistic effects of supplementary cementitious materials and compressive strength prediction of concrete using machine learning algorithms with SHAP and PDP analyses. Case Studies in Construction Materials, Vol. 20, 2024, id. e02828.10.1016/j.cscm.2023.e02828Search in Google Scholar
[52] Kashem, A., R. Karim, P. Das, S. D. Datta, and M. Alharthai. Compressive strength prediction of sustainable concrete incorporating rice husk ash (RHA) using hybrid machine learning algorithms and parametric analyses. Case Studies in Construction Materials, Vol. 20, 2024, id. e03030.10.1016/j.cscm.2024.e03030Search in Google Scholar
[53] Adamu, M. and Y. E. Ibrahim. Environmental sustainability and cost-benefit analysis of concrete containing date palm ash and eggshell powder: A response surface methodology approach. Case Studies in Chemical and Environmental Engineering, Vol. 9, 2024, id. 100636.10.1016/j.cscee.2024.100636Search in Google Scholar
[54] Chen, Z. Application of machine learning boosting and bagging methods to predict compressive and flexural strength of marble cement mortar. Materials Today Communications, Vol. 39, 2024, id. 108600.10.1016/j.mtcomm.2024.108600Search in Google Scholar
[55] Liu, H., S. A. Khan, M. N. Amin, F. Althoey, and M. T. Qadir. Evaluating the strength loss and the effectiveness of glass and eggshell powder for cement mortar under acidic conditions. Reviews on Advanced Materials Science, Vol. 63, No. 1, 2024, id. 20240042.10.1515/rams-2024-0042Search in Google Scholar
[56] de Castilho, V. C., M. K. El Debs, and M. do Carmo Nicoletti. Using a modified genetic algorithm to minimize the production costs for slabs of precast prestressed concrete joists. Engineering Applications of Artificial Intelligence, Vol. 20, 2007, pp. 519–530.10.1016/j.engappai.2006.09.003Search in Google Scholar
[57] Koza, J. On the programming of computers by means of natural selection. Genetic programming, MIT Press, Cambridge, UK, 1992.Search in Google Scholar
[58] Gandomi, A. H., A. H. Alavi, M. R. Mirzahosseini, and F. M. Nejad. Nonlinear genetic-based models for prediction of flow number of asphalt mixtures. Journal of Materials in Civil Engineering, Vol. 23, 2011, pp. 248–263.10.1061/(ASCE)MT.1943-5533.0000154Search in Google Scholar
[59] Gandomi, A. H., S. M. Tabatabaei, M. H. Moradian, A. Radfar, and A. H. Alavi. A new prediction model for the load capacity of castellated steel beams. Journal of Constructional Steel Research, Vol. 67, 2011, pp. 1096–1105.10.1016/j.jcsr.2011.01.014Search in Google Scholar
[60] Cheng, M.-Y., P. M. Firdausi, and D. Prayogo. High-performance concrete compressive strength prediction using Genetic Weighted Pyramid Operation Tree (GWPOT). Engineering Applications of Artificial Intelligence, Vol. 29, 2014, pp. 104–113.10.1016/j.engappai.2013.11.014Search in Google Scholar
[61] Ferreira, C. Gene expression programming in problem solving. In Soft computing and industry: recent applications, Springer London, London, 2002, pp. 635–653.10.1007/978-1-4471-0123-9_54Search in Google Scholar
[62] Chu, H.-H., M. A. Khan, M. Javed, A. Zafar, M. I. Khan, H. Alabduljabbar, et al. Sustainable use of fly-ash: Use of gene-expression programming (GEP) and multi-expression programming (MEP) for forecasting the compressive strength geopolymer concrete. Ain Shams Engineering Journal, Vol. 12, 2021, pp. 3603–3617.10.1016/j.asej.2021.03.018Search in Google Scholar
[63] Qi, W., W. Yang, L. Xing, and F. Yao. Modeling and solving for multi-satellite cooperative task allocation problem based on genetic programming method. Mathematics, Vol. 10, 2022, id. 3608.10.3390/math10193608Search in Google Scholar
[64] Guan, Q. T., Z. L. Tong, M. N. Amin, B. Iftikhar, M. T. Qadir, and K. Khan. Analyzing the efficacy of waste marble and glass powder for the compressive strength of self-compacting concrete using machine learning strategies. Reviews on Advanced Materials Science, Vol. 63, 2024, id. 20240043.10.1515/rams-2024-0043Search in Google Scholar
[65] Lundberg, S. M. and S.-I. Lee. A unified approach to interpreting model predictions. Advances in Neural Information Processing Systems, 31st Conference on Neural Information Processing Systems (NIPS 2017), Long Beach, CA, USA, Vol. 30, 2017.Search in Google Scholar
[66] Shapley, L. S. A value for n-person games. Contribution to the Theory of Games, Princeton University Press, Princeton, Vol. 2, 1953, 307–317.10.1515/9781400881970-018Search in Google Scholar
[67] Mottakin, M., S. D. Datta, M. M. Hossain, M. H. R. Sobuz, S. M. A. Rahman, and M. Alharthai. Evaluation of textile effluent treatment plant sludge as supplementary cementitious material in concrete using experimental and machine learning approaches. Journal of Building Engineering, Vol. 96, 2024, id. 110627.10.1016/j.jobe.2024.110627Search in Google Scholar
[68] Sobuz, M. H. R., I. Al, S. D. Datta, J. A. Jabin, F. S. Aditto, N. M. Sadiqul Hasan, et al. Assessing the influence of sugarcane bagasse ash for the production of eco-friendly concrete: Experimental and machine learning approaches. Case Studies in Construction Materials, Vol. 20, 2024, id. e02839.10.1016/j.cscm.2023.e02839Search in Google Scholar
[69] Datta, S. D., M. M. Sarkar, A. S. Rakhe, F. S. Aditto, M. H. R. Sobuz, N. M. N. Shaurdho, et al. Analysis of the characteristics and environmental benefits of rice husk ash as a supplementary cementitious material through experimental and machine learning approaches. Innovative Infrastructure Solutions, Vol. 9, 2024, id. 121.10.1007/s41062-024-01423-7Search in Google Scholar
© 2025 the author(s), published by De Gruyter
This work is licensed under the Creative Commons Attribution 4.0 International License.
Articles in the same Issue
- Review Articles
- Utilization of steel slag in concrete: A review on durability and microstructure analysis
- Technical development of modified emulsion asphalt: A review on the preparation, performance, and applications
- Recent developments in ultrasonic welding of similar and dissimilar joints of carbon fiber reinforcement thermoplastics with and without interlayer: A state-of-the-art review
- Unveiling the crucial factors and coating mitigation of solid particle erosion in steam turbine blade failures: A review
- From magnesium oxide, magnesium oxide concrete to magnesium oxide concrete dams
- Properties and potential applications of polymer composites containing secondary fillers
- A scientometric review on the utilization of copper slag as a substitute constituent of ordinary Portland cement concrete
- Advancement of additive manufacturing technology in the development of personalized in vivo and in vitro prosthetic implants
- Recent advance of MOFs in Fenton-like reaction
- A review of defect formation, detection, and effect on mechanical properties of three-dimensional braided composites
- Non-conventional approaches to producing biochars for environmental and energy applications
- Review of the development and application of aluminum alloys in the nuclear industry
- Advances in the development and characterization of combustible cartridge cases and propellants: Preparation, performance, and future prospects
- Recent trends in rubberized and non-rubberized ultra-high performance geopolymer concrete for sustainable construction: A review
- Cement-based materials for radiative cooling: Potential, material and structural design, and future prospects
- A comprehensive review: The impact of recycling polypropylene fiber on lightweight concrete performance
- A comprehensive review of preheating temperature effects on reclaimed asphalt pavement in the hot center plant recycling
- Exploring the potential applications of semi-flexible pavement: A comprehensive review
- A critical review of alkali-activated metakaolin/blast furnace slag-based cementitious materials: Reaction evolution and mechanism
- Dispersibility of graphene-family materials and their impact on the properties of cement-based materials: Application challenges and prospects
- Research progress on rubidium and cesium separation and extraction
- A step towards sustainable concrete with the utilization of M-sand in concrete production: A review
- Studying the effect of nanofillers in civil applications: A review
- Studies on the anticorrosive effect of phytochemicals on mild steel, carbon steel, and stainless-steel surfaces in acid and alkali medium: A review
- Nanotechnology for calcium aluminate cement: thematic analysis
- Towards sustainable concrete pavements: a critical review on fly ash as a supplementary cementitious material
- Optimizing rice husk ash for ultra-high-performance concrete: a comprehensive review of mechanical properties, durability, and environmental benefits
- Research Articles
- Investigation of the corrosion performance of HVOF-sprayed WC-CoCr coatings applied on offshore hydraulic equipment
- A systematic review of metakaolin-based alkali-activated and geopolymer concrete: A step toward green concrete
- Evaluation of color matching of three single-shade composites employing simulated 3D printed cavities with different thicknesses using CIELAB and CIEDE2000 color difference formulae
- Novel approaches in prediction of tensile strain capacity of engineered cementitious composites using interpretable approaches
- Effect of TiB2 particles on the compressive, hardness, and water absorption responses of Kulkual fiber-reinforced epoxy composites
- Analyzing the compressive strength, eco-strength, and cost–strength ratio of agro-waste-derived concrete using advanced machine learning methods
- Tensile behavior evaluation of two-stage concrete using an innovative model optimization approach
- Tailoring the mechanical and degradation properties of 3DP PLA/PCL scaffolds for biomedical applications
- Optimizing compressive strength prediction in glass powder-modified concrete: A comprehensive study on silicon dioxide and calcium oxide influence across varied sample dimensions and strength ranges
- Experimental study on solid particle erosion of protective aircraft coatings at different impact angles
- Compatibility between polyurea resin modifier and asphalt binder based on segregation and rheological parameters
- Fe-containing nominal wollastonite (CaSiO3)–Na2O glass-ceramic: Characterization and biocompatibility
- Relevance of pore network connectivity in tannin-derived carbons for rapid detection of BTEX traces in indoor air
- A life cycle and environmental impact analysis of sustainable concrete incorporating date palm ash and eggshell powder as supplementary cementitious materials
- Eco-friendly utilisation of agricultural waste: Assessing mixture performance and physical properties of asphalt modified with peanut husk ash using response surface methodology
- Benefits and limitations of N2 addition with Ar as shielding gas on microstructure change and their effect on hardness and corrosion resistance of duplex stainless steel weldments
- Effect of selective laser sintering processing parameters on the mechanical properties of peanut shell powder/polyether sulfone composite
- Impact and mechanism of improving the UV aging resistance performance of modified asphalt binder
- AI-based prediction for the strength, cost, and sustainability of eggshell and date palm ash-blended concrete
- Investigating the sulfonated ZnO–PVA membrane for improved MFC performance
- Strontium coupling with sulphur in mouse bone apatites
- Transforming waste into value: Advancing sustainable construction materials with treated plastic waste and foundry sand in lightweight foamed concrete for a greener future
- Evaluating the use of recycled sawdust in porous foam mortar for improved performance
- Improvement and predictive modeling of the mechanical performance of waste fire clay blended concrete
- Polyvinyl alcohol/alginate/gelatin hydrogel-based CaSiO3 designed for accelerating wound healing
- Research on assembly stress and deformation of thin-walled composite material power cabin fairings
- Effect of volcanic pumice powder on the properties of fiber-reinforced cement mortars in aggressive environments
- Analyzing the compressive performance of lightweight foamcrete and parameter interdependencies using machine intelligence strategies
- Selected materials techniques for evaluation of attributes of sourdough bread with Kombucha SCOBY
- Establishing strength prediction models for low-carbon rubberized cementitious mortar using advanced AI tools
- Investigating the strength performance of 3D printed fiber-reinforced concrete using applicable predictive models
- An eco-friendly synthesis of ZnO nanoparticles with jamun seed extract and their multi-applications
- The application of convolutional neural networks, LF-NMR, and texture for microparticle analysis in assessing the quality of fruit powders: Case study – blackcurrant powders
- Study of feasibility of using copper mining tailings in mortar production
- Shear and flexural performance of reinforced concrete beams with recycled concrete aggregates
- Advancing GGBS geopolymer concrete with nano-alumina: A study on strength and durability in aggressive environments
- Leveraging waste-based additives and machine learning for sustainable mortar development in construction
- Study on the modification effects and mechanisms of organic–inorganic composite anti-aging agents on asphalt across multiple scales
- Morphological and microstructural analysis of sustainable concrete with crumb rubber and SCMs
- Structural, physical, and luminescence properties of sodium–aluminum–zinc borophosphate glass embedded with Nd3+ ions for optical applications
- Eco-friendly waste plastic-based mortar incorporating industrial waste powders: Interpretable models for flexural strength
- Bioactive potential of marine Aspergillus niger AMG31: Metabolite profiling and green synthesis of copper/zinc oxide nanocomposites – An insight into biomedical applications
- Preparation of geopolymer cementitious materials by combining industrial waste and municipal dewatering sludge: Stabilization, microscopic analysis and water seepage
- Seismic behavior and shear capacity calculation of a new type of self-centering steel-concrete composite joint
- Sustainable utilization of aluminum waste in geopolymer concrete: Influence of alkaline activation on microstructure and mechanical properties
- Optimization of oil palm boiler ash waste and zinc oxide as antibacterial fabric coating
- Tailoring ZX30 alloy’s microstructural evolution, electrochemical and mechanical behavior via ECAP processing parameters
- Comparative study on the effect of natural and synthetic fibers on the production of sustainable concrete
- Microemulsion synthesis of zinc-containing mesoporous bioactive silicate glass nanoparticles: In vitro bioactivity and drug release studies
- On the interaction of shear bands with nanoparticles in ZrCu-based metallic glass: In situ TEM investigation
- Developing low carbon molybdenum tailing self-consolidating concrete: Workability, shrinkage, strength, and pore structure
- Experimental and computational analyses of eco-friendly concrete using recycled crushed brick
- High-performance WC–Co coatings via HVOF: Mechanical properties of steel surfaces
- Mechanical properties and fatigue analysis of rubber concrete under uniaxial compression modified by a combination of mineral admixture
- Experimental study of flexural performance of solid wood beams strengthened with CFRP fibers
- Eco-friendly green synthesis of silver nanoparticles with Syzygium aromaticum extract: characterization and evaluation against Schistosoma haematobium
- Predictive modeling assessment of advanced concrete materials incorporating plastic waste as sand replacement
- Self-compacting mortar overlays using expanded polystyrene beads for thermal performance and energy efficiency in buildings
- Enhancing frost resistance of alkali-activated slag concrete using surfactants: sodium dodecyl sulfate, sodium abietate, and triterpenoid saponins
- Equation-driven strength prediction of GGBS concrete: a symbolic machine learning approach for sustainable development
- Empowering 3D printed concrete: discovering the impact of steel fiber reinforcement on mechanical performance
- Advanced hybrid machine learning models for estimating chloride penetration resistance of concrete structures for durability assessment: optimization and hyperparameter tuning
- Influence of diamine structure on the properties of colorless and transparent polyimides
- Post-heating strength prediction in concrete with Wadi Gyada Alkharj fine aggregate using thermal conductivity and ultrasonic pulse velocity
- Experimental and RSM-based optimization of sustainable concrete properties using glass powder and rubber fine aggregates as partial replacements
- Special Issue on Recent Advancement in Low-carbon Cement-based Materials - Part II
- Investigating the effect of locally available volcanic ash on mechanical and microstructure properties of concrete
- Flexural performance evaluation using computational tools for plastic-derived mortar modified with blends of industrial waste powders
- Foamed geopolymers as low carbon materials for fire-resistant and lightweight applications in construction: A review
- Autogenous shrinkage of cementitious composites incorporating red mud
- Mechanical, durability, and microstructure analysis of concrete made with metakaolin and copper slag for sustainable construction
- Special Issue on AI-Driven Advances for Nano-Enhanced Sustainable Construction Materials
- Advanced explainable models for strength evaluation of self-compacting concrete modified with supplementary glass and marble powders
- Analyzing the viability of agro-waste for sustainable concrete: Expression-based formulation and validation of predictive models for strength performance
- Special Issue on Advanced Materials for Energy Storage and Conversion
- Innovative optimization of seashell ash-based lightweight foamed concrete: Enhancing physicomechanical properties through ANN-GA hybrid approach
- Production of novel reinforcing rods of waste polyester, polypropylene, and cotton as alternatives to reinforcement steel rods