Analyzing the viability of agro-waste for sustainable concrete: Expression-based formulation and validation of predictive models for strength performance
-
Fahad Alsharari
 ,
Roz-Ud-Din Nassar
,
Roz-Ud-Din Nassar

Abstract
By lowering environmental impact and increasing resource efficiency, agro-waste in concrete provides a sustainable substitute for traditional materials. This study focuses on optimizing concrete mix designs using agricultural byproducts such as corn cob ash, palm oil fuel ash, rice husk ash, sugarcane bagasse ash, and wheat straw ash, alongside water-cement ratio and curing duration. An experimental dataset was compiled, targeting compressive strength (CS) and tensile strength (TS) as output parameters. Two advanced machine learning (ML) techniques, gene expression programming (GEP) and multi expression programming (MEP), were applied for predictive modeling and optimization. Model accuracy was assessed using statistical metrics and Taylor’s plots, while SHapley Additive exPlanations analysis was used to interpret input parameter influence. Results showed that MEP outperformed GEP in both CS and TS predictions. For CS, the MEP model achieved an R 2 of 0.963 compared to 0.934 for the GEP model, while for TS, the MEP model reached 0.961 compared to 0.945 for GEP. The study highlights the role of ML in enhancing mix design efficiency, reducing trial-and-error experimentation, and accelerating the development of sustainable, high-performance construction materials. Such studies demonstrate how ML can streamline concrete mix design by minimizing experimental trials, saving both time and resources. By incorporating agro-waste materials, they provide engineers with practical tools to develop sustainable, high-performance concretes that lower environmental impact while maintaining structural reliability.
1 Introduction
Due to its significant use as a critical building material, the environmental impact of concrete has been thoroughly examined over many years [1]. Cement and concrete demand is projected to triple by 2050, leading to faster-than-expected increases in carbon emissions and reductions in ecosystem diversity [2]. Researchers are looking for alternative materials with lower carbon footprints [2,3]. Binding concrete requires Portland cement, whose production utilizes around 1.80 metric tons of raw materials and produces about 0.8 metric tons of carbon dioxide gas [4]. Consequently, immediate action is required to decrease cement output in order to diminish the environmental impact [2]. One methodical and technical approach to ensure the materials’ long-term viability is recycling waste from agriculture and industry into new construction materials [5,6]. Production of supplementary cementitious materials (SCMs) from recycled materials from agriculture and manufacturing has societal, economic, and ecological advantages [7,8,9]. Substituting recycled materials for Portland cement is an efficient, long-term, and economical approach to reduce environmental impact [10,11,12].
The materials for this investigation were agro-wastes, which are both common and cheap, because they are sustainable and practical. Statistical analysis in both developed and developing nations shows that biomass only makes up around 9–14% of total energy sources [13]. Major environmental problems might arise from the widespread practice of leaving wastes behind or burning them in fields. In addition to their use as extra cementitious materials, these agro-waste products can also be used as alternative aggregates in building projects [14]. When compared to developing nations, developed nations are usually better at managing and making use of agricultural waste [15]. Simultaneously, emerging nations are highly focused on finding the right ways to tackle environmental and wastage concerns [16,17]. Because of the palm oil industry’s significance to Thailand’s agro-industries, the country’s resource usage of palm oil ash is a major worry [18]. Still, every year, a mountain of solid trash is generated, comprising things like palm fiber remnants, rice husks, sugarcane bagasse, and wheat straw. Not only does the yearly growth in disposal take up a lot of room, but it also produces major issues including air pollution and possible health and safety risks following combustion. The use of agro-waste ash as a cement component, however, has attracted the attention of numerous researchers. Scientific investigations have shown that agro-waste ash has the potential to be utilized as a pozzolanic material due to its high concentration of amorphous silica [19,20]. By partially replacing 10–30% of cement with agro-wastes, researchers have proven the importance of agro-waste ash in producing high-strength concrete [21]. Cement that contains agro-waste ash has shown excellent performance in mortar and concrete, even when exposed to a hydrochloric acid solution [21], despite these substitutions. Research from all across the globe has shown that agro-wastes are essential [22], therefore it is a good idea to compile all the relevant data in one spot before we introduce new kinds of these wastes or think about their potential future uses.
Researchers, computer scientists, engineers, and scientists are realizing that artificial intelligence (AI) is changing product development. The engineering field faces numerous challenges, creating a growing demand for professionals skilled in artificial intelligence. Despite its potential, AI-based systems have limitations and performance issues. Natural conversation understanding and object identification are activities humans take for granted, but AI algorithms struggle with them [23]. In order to solve these issues, AI systems have used machine learning (ML) [23,24,25]. Computers can learn to operate independently with the help of ML algorithms by studying large enough datasets [26,27]. Returning to the features that produce the most explicit data is crucial prior to implementing the plan. To explain this process, the word “feature extraction” is now utilized. After that, pattern separation instructions, characteristics, and sample data are trained using ML [23,28,29]. Studies in civil engineering nowadays use statistical methods and AI to tackle challenges that are progressively more complex. Compressive strength (CS) estimation is one area where civil engineers utilize AI and statistical methodologies [30,31]. By applying these methods, several major obstacles were overcome. These included self-compacting concrete slump and impact strength forecasts, structural beam shear behavior, and chloride contamination risk [32,33,34,35]. Future research can save time and money by using improved prediction methods. Many ML algorithms seem to promise concrete strength estimation. Extreme Gradient Boosting, multi expression programming (MEP), Decision Trees, Gaussian Process Regression, expression trees (ETs), and gene expression programming (GEP) are examples. These data-centric approaches provide accurate, efficient material property evaluation without traditional testing [36,37,38,39]. The mechanical properties of agro-waste-derived concrete were more accurately predicted by symbolic regression-based models, such as GEP and MEP, compared to other ML techniques, owing to their ability to evolve explicit mathematical relationships and capture complex nonlinear patterns in the data.
To reliably predict the CS and tensile strength (TS) of concrete made from agro-waste, a reliable computing framework can be constructed with the help of ML algorithms that have been properly trained. This research utilizes openly accessible experimental datasets to develop predictive regression models aimed at estimating the CS and TS of concrete incorporating agro-waste materials, employing GEP and MEP techniques. There are 700 data points in the collection, drawn from the most recent research on CS and TS. Model validation was accomplished using statistical tests and analysis of Taylor’s diagrams. A SHapley Additive exPlanations (SHAP) analysis and sensitivity research were performed to further investigate the effects of different parameters on our predictions. The construction industry stands to benefit greatly from advanced data-driven methods, such as ML models, that can accurately evaluate and predict material properties with minimal human intervention. In the context of this study, such approaches not only reduce reliance on extensive trial-and-error testing but also enable the effective utilization of agro-waste materials, promoting sustainability and innovation in concrete production.
2 Framework of the study
2.1 Dataset assembling and review
This work employed MEP and GEP approaches to anticipate the CS and TS of agro-waste derived concrete, respectively. A total of 700 data points were collected through experimental investigations, comprising values for both CS and TS [40,41,42,43,44,45,46,47,48,49,50,51,52,53,54,55,56,57,58,59]. This study employed seven variables to foresee CS and TS, such as corn cob ash content (CCA), palm oil fuel ash content (POA), rice husk ash content (RHA), sugarcane bagasse ash content (SBA), wheat straw ash content (WSA), water to cement ratio (WCR), and curing duration (CD). Thorough data preparation was crucial for the data collection and organization processes. An effective approach for overcoming a significant challenge is to prepare data for data mining; this fits in with the widely-used knowledge discovery from data methods. To simplify and improve the data, preparation primarily aims to remove distortion and unnecessary portions. Several descriptive statistics were calculated using these data and their results are displayed in Table 1. As an initial stage in ML investigations, descriptive statistics help us comprehend the distribution, central tendency, and variability of the input material. There are a total of 700 samples in the dataset, broken down as follows: CCA, POA, RHA, SBA, and WSA, as well as WCR, CD, and the desired outcomes CS and TS. With a mean WCR of around 0.54 and an average curing day of about 39, the data show moderate amounts of cementitious replacements. The input variables, particularly the percentages of SCMs and the CD, show a great deal of variability, as seen by the standard deviations and ranges. This variability may impact the generalizability of the model. A strong right-tailed distribution is shown by the high kurtosis and skewness values of SCMs. The clustering of most values near 0 indicates that many mixes did not have partial replacements. The construction and validation of accurate ML models depend on a thorough understanding of data behavior, which can be achieved through statistical profiling.
Descriptive overview of ML dataset features
| Metrics | CCA (%) | POA (%) | RHA (%) | SBA (%) | WSA (%) | WCR | CD (Days) | CS (MPa) | TS (MPa) |
|---|---|---|---|---|---|---|---|---|---|
| Mean | 6.003 | 5.105 | 6.014 | 4.320 | 5.086 | 0.540 | 38.690 | 44.417 | 3.990 |
| Standard error | 0.491 | 0.464 | 0.485 | 0.428 | 0.459 | 0.004 | 1.240 | 0.377 | 0.063 |
| Median | 0.000 | 0.000 | 0.000 | 0.000 | 0.000 | 0.542 | 28.000 | 44.359 | 3.919 |
| Mode | 0.000 | 0.000 | 0.000 | 0.000 | 0.000 | 0.664 | 28.000 | 29.023 | 1.552 |
| Standard deviation | 12.981 | 12.268 | 12.821 | 11.329 | 12.145 | 0.108 | 32.795 | 9.968 | 1.662 |
| Sample variance | 168.505 | 150.511 | 164.389 | 128.344 | 147.490 | 0.012 | 1075.530 | 99.368 | 2.762 |
| Kurtosis | 3.011 | 4.342 | 2.976 | 6.015 | 4.019 | −1.195 | −1.249 | −1.285 | −1.216 |
| Minimum | 0.000 | 0.000 | 0.000 | 0.000 | 0.000 | 0.351 | 3.000 | 27.895 | 1.169 |
| Maximum | 49.998 | 49.805 | 49.883 | 49.815 | 49.859 | 0.719 | 90.000 | 61.744 | 6.782 |
| Count | 700.000 | 700.000 | 700.000 | 700.000 | 700.000 | 700.000 | 700.000 | 700.000 | 700.000 |
Figure 1(a) and (b) illustrate the Pearson correlation matrices for the datasets associated with CS and TS, respectively. These visualizations depict the linear relationships among the input variables and their corresponding strength outputs, using color-coded ellipses and numerical correlation values (ranging from −1 to +1). The red ellipses indicate positive correlations, while blue signifies negative relationships; the intensity and shape reflect the correlation magnitude. In Figure 1(a) and (b), moderate positive correlations can be seen between CD and both strength properties (CS and TS), with correlation coefficients nearing +0.25. This indicates that longer CDs generally contribute positively to strength development. WCR shows a weak but negative correlation with strength, consistent with established concrete behavior. In contrast, the five SCMs (CCA, POA, RHA, SBA, WSA) exhibit slight negative correlations with the outputs, suggesting that excessive replacement may reduce strength in some mixes. Similar patterns are observed in Figure 1(b) for the TS dataset, although minor variations in correlation values suggest differing sensitivity of compressive and TSs to certain input variables. It is important to note that low correlation values near zero do not necessarily imply independence; nonlinear effects or complex interactions may still exist. Therefore, additional interpretative tools such as SHAP values or sensitivity analysis are recommended to gain a more comprehensive understanding of input–output relationships in predictive modeling.
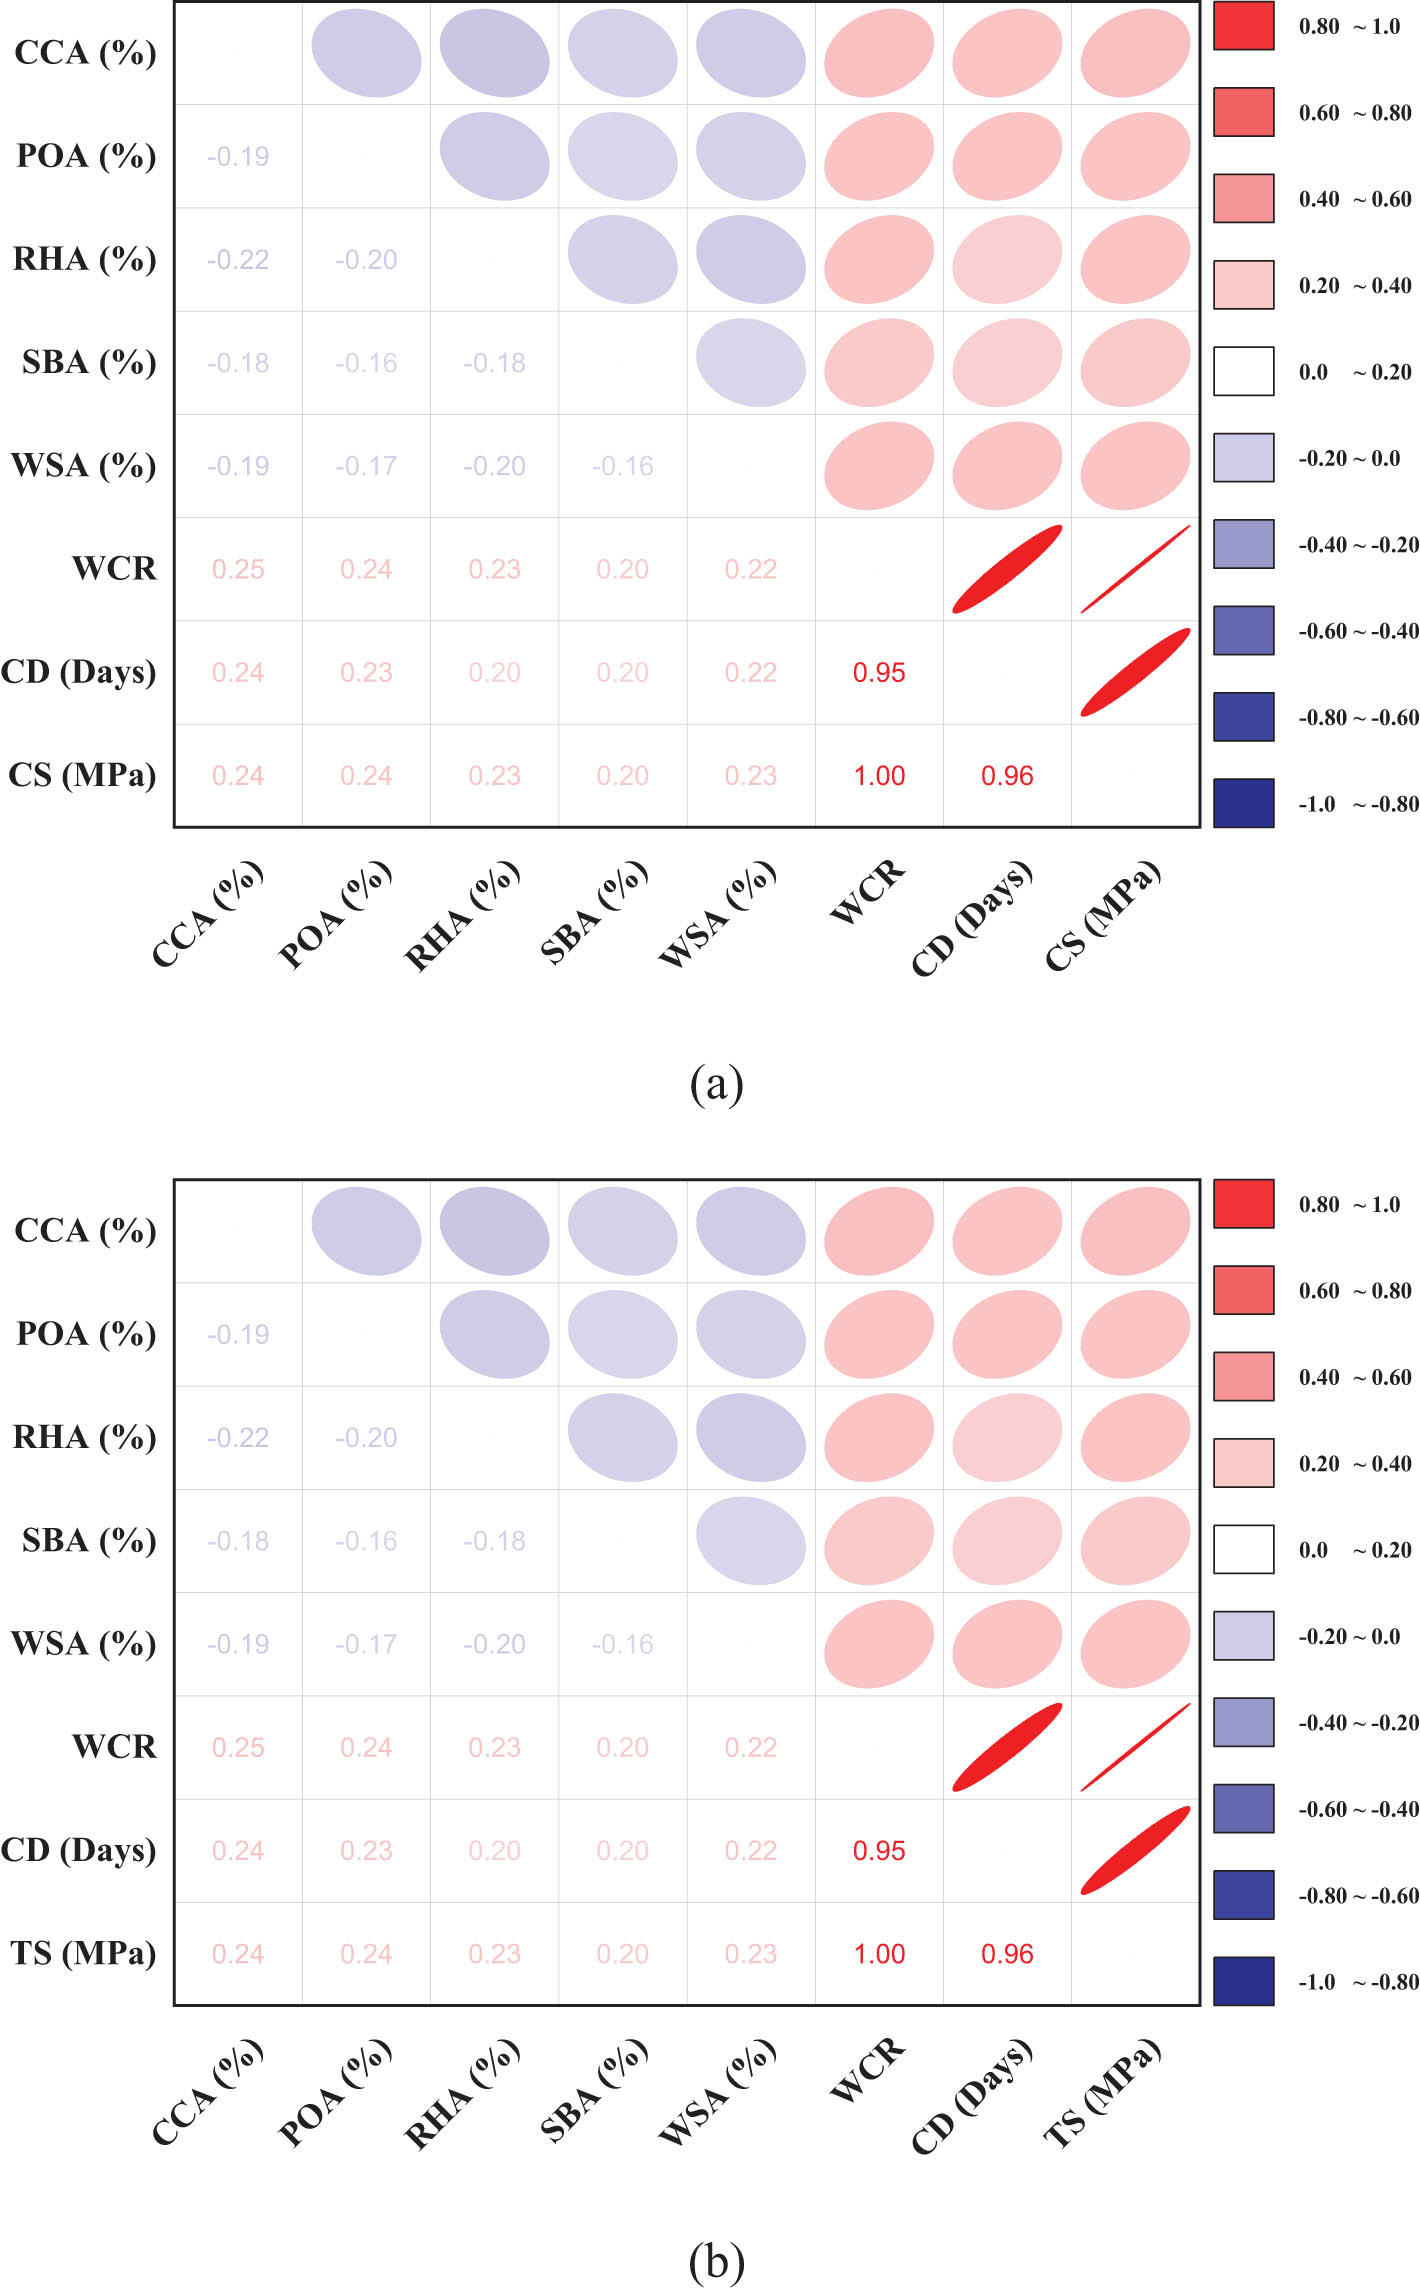
Correlation matrices highlighting key variable interdependencies for (a) CS dataset and (b) TS dataset.
2.2 ML framework
The CS and TS of agro-waste-based concrete were predicted using a dataset curated through an extensive analysis of prior research studies. Seven input features were considered essential for estimating the corresponding CS and TS values. GEP and MEP, recognized as high-performing ML methods, were employed to develop the predictive models. Typically, ML model accuracy is evaluated by comparing output predictions to actual recorded values. In this study, the dataset was split into two segments, 70% was allotted for training the models, while the rest 30% was utilized to test their generalization performance. The predictive strength of the models was primarily judged by the R 2 score, where a higher value indicates close alignment between estimated and true values, whereas a lower score reveals inconsistencies and reduced reliability [60]. A number of tests, including statistical analyses and evaluations of errors, were conducted to ensure that the model was reliable. Table 2 lists the critical hyperparameters controlling the GEP and MEP models’ performance, and Figure 2 shows a scenario-based model representation.
Configured parameters for MEP and GEP models
| Category | MEP settings | GEP settings |
|---|---|---|
| Data type | Real numbers | Floating number |
| Problem type | Symbolic regression | Symbolic regression |
| Function set | +, –, ×, ÷, power, log | +, –, ×, ÷, power, log |
| Error measure | Mean absolute error | Mean absolute error |
| Operators/variables | 0.5 | — |
| Code length/head size | Code length: 50 | Head size: 8 |
| Number of chromosomes | — | 30 |
| Number of genes | — | 4 |
| Constant per gene | — | 10 |
| Linking function | — | Addition |
| Population structure | 2 sub-populations, each with 200 individuals | — |
| Number of runs | 10 | — |
| Number of generations | 500 | — |
| Replication number | 15 | — |
| Crossover type | Uniform | — |
| Crossover probability | 0.9 | — |
| Mutation probability | 0.01 | — |
| Number of threads | 2 | — |
| Mutation rate | — | 0.00138 |
| Leaf mutation rate | — | 0.00546 |
| Stumbling mutation | — | 0.00141 |
| Inversion rate | — | 0.00546 |
| IS transposition rate | — | 0.00546 |
| RIS transposition rate | — | 0.00546 |
| Gene transposition rate | — | 0.00277 |
| Gene recombination rate | — | 0.00277 |
| One-point recombination | — | 0.00277 |
| Two-point recombination | — | 0.00277 |
| Random chromosomes | — | 0.0026 |
| Bounds | Lower: −10, Upper: 10 | Lower: −10, Upper: 10 |
| General | CS and TS | CS and TS |
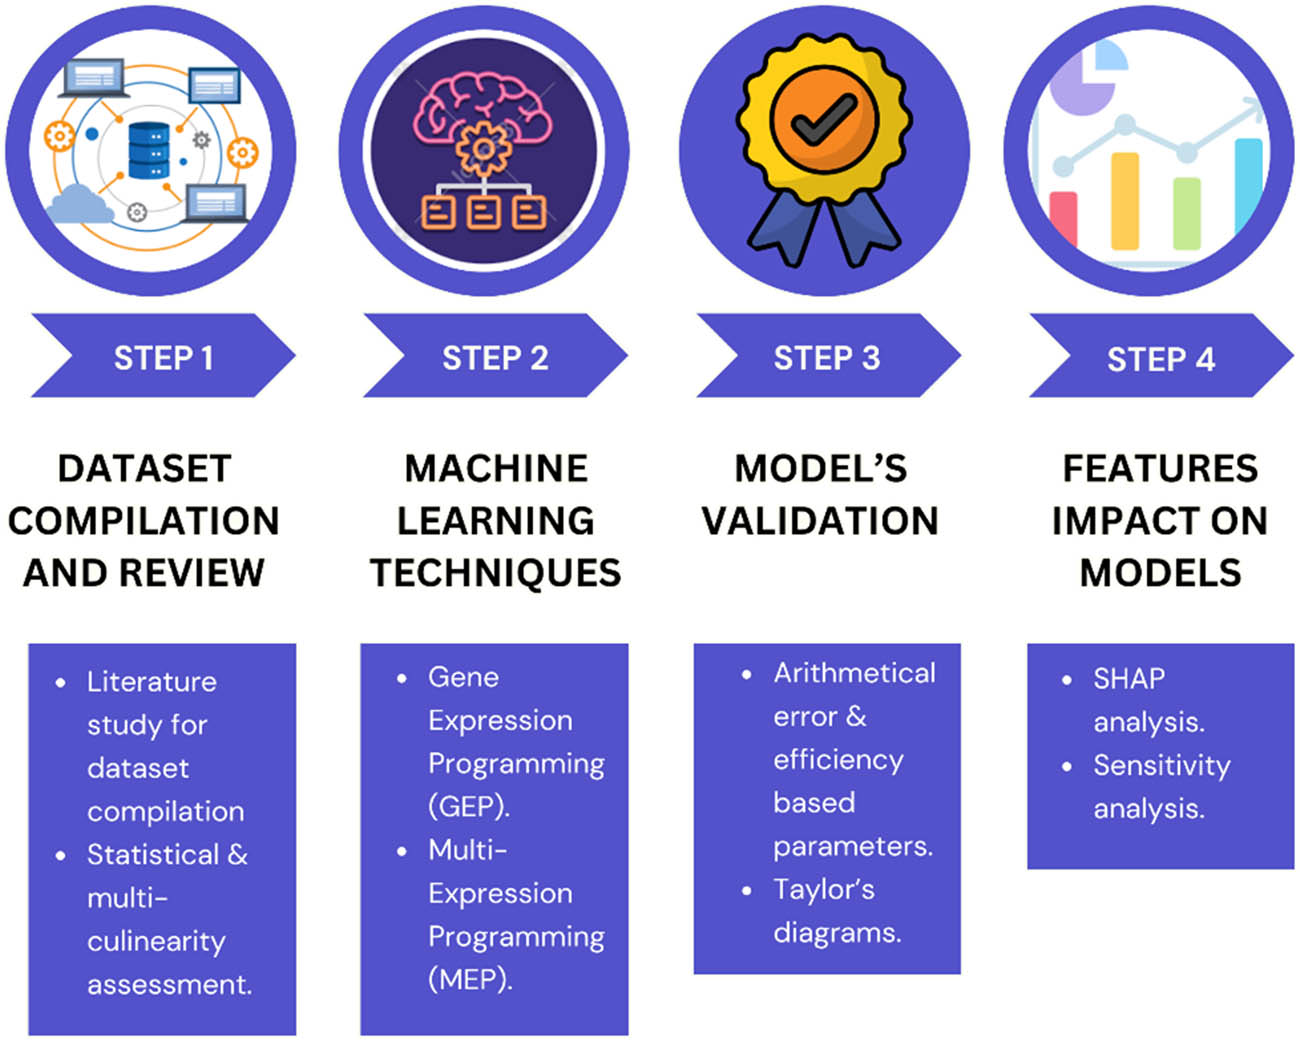
Four-step ML framework for predicting CS and TS of agro-waste concrete.
2.3 Performance metrics and accuracy evaluation
The predictive capability of the GEP and MEP models was evaluated on the test dataset using a range of statistical indicators. The assessment incorporated metrics such as root mean square error (RMSE), mean absolute percentage error (MAPE), Nash–Sutcliffe efficiency (NSE), relative root mean square error (RRMSE), mean absolute error (MAE), relative squared error (RSE), and Pearson’s correlation coefficient (R), providing a comprehensive measure of the models’ accuracy and reliability [61,62,63,64,65]. Eqs. (1)–(7) outline the mathematical expressions used to quantify different statistical indicators that evaluate the predictive performance of the models.
In this context, n represents the total number of data points, while
A Taylor diagram serves as an effective tool for evaluating a model’s predictive performance. Among various statistical validation techniques, it stands out by visually summarizing how closely a model’s output aligns with observed data. By comparing standard deviations, correlation coefficients, and centered root-mean-square differences relative to a reference point (the actual data), the diagram provides a comprehensive assessment of model accuracy and reliability [72,73]. The Taylor diagram graphically integrates three key statistical measures to assess model performance: standard deviation is shown along the axes, correlation coefficients are displayed as angular lines, and RMSE is represented by curved contours centered on the reference point (true values). This visual layout allows for a quick and effective comparison of models. The ideal model position is one that lies nearest to the reference point, indicating minimal error, high correlation, and strong predictive reliability [72].
3 Computational analysis and findings
3.1 CS models
3.1.1 GEP predictive model
To predict the CS of agro-waste-based concrete, the models employed ETs that embed mathematical structures influenced by genome distribution patterns and head length parameters. The construction of these ETs was primarily based on fundamental arithmetic operations, including multiplication, division, addition, subtraction, and exponentiation. These operations were strategically organized to construct subcomponents within the overall model. The GEP algorithm effectively transforms these structural elements into interpretable mathematical expressions that represent the predictive behavior of the model. Eq. (8) shows that by plugging in the feature values, these methods can predict the future CS of concrete made from agro-waste. Under ideal circumstances, the resultant model can beat it, but only if there is enough data. Figure 3(a) shows that the data are correctly matched because there is a solid black line there. The dotted green line shows a 20% change, whereas the dashed red line shows a 10% variance. The degree to which the experimental results match the projected CS values is shown by this graph. With a significant correlation shown by a R 2 value of 0.935, the GEP model successfully reproduced the reported CS values with little variation. Predicting CS using the GEP method was remarkably accurate; 99.1% of the values were within a 20% margin of error and 91.5% were within a 10% margin. Figure 3(b) shows the CS data vs the absolute error and may indicate a difference between the test values and the ones obtained by the GEP model. The findings demonstrated that the GEP-derived equation produced predictions that were closely aligned with the experimental outcomes, with absolute errors extending from 0.102 to 13.148 MPa. Figure 4 presents the error distribution, confirming the model’s precision. Out of all predictions, 105 values exhibited errors below 1.0 MPa, while 98 fell within the 1.0–5.0 MPa range, and only 30 readings exceeded 5.0 MPa. High-magnitude errors were infrequent, highlighting the model’s overall accuracy and reliability.
where, CS: compressive strength, CCA: corn cob ash content, POA: palm oil ash content, SBA: sugarcane Bagasse ash content, RHA: rice husk ash content, WSA: wheat straw ash content, WCR: water-to-cementitious ratio, and CD: curing duration.
CS modeling with GEP: (a) Estimated vs observed CS relationship and (b) dataset-level error dispersion.
Residual error distribution of the CS-GEP model.
3.1.2 MEP predictive model
An analytical expression for predicting the CS of agro-waste-based concrete was derived using the results obtained from the MEP model. This model takes into consideration the cumulative impact of seven independent factors. The finalized mathematical representation generated through this modeling process is presented in Eq. (9).
where, CS: compressive strength, CCA: corn cob ash content, RHA: rice husk ash content, POA: palm oil ash content, SBA: sugarcane Bagasse ash content, WSA: wheat straw ash content, WCR: water-to-cementitious ratio, and CD: curing duration.
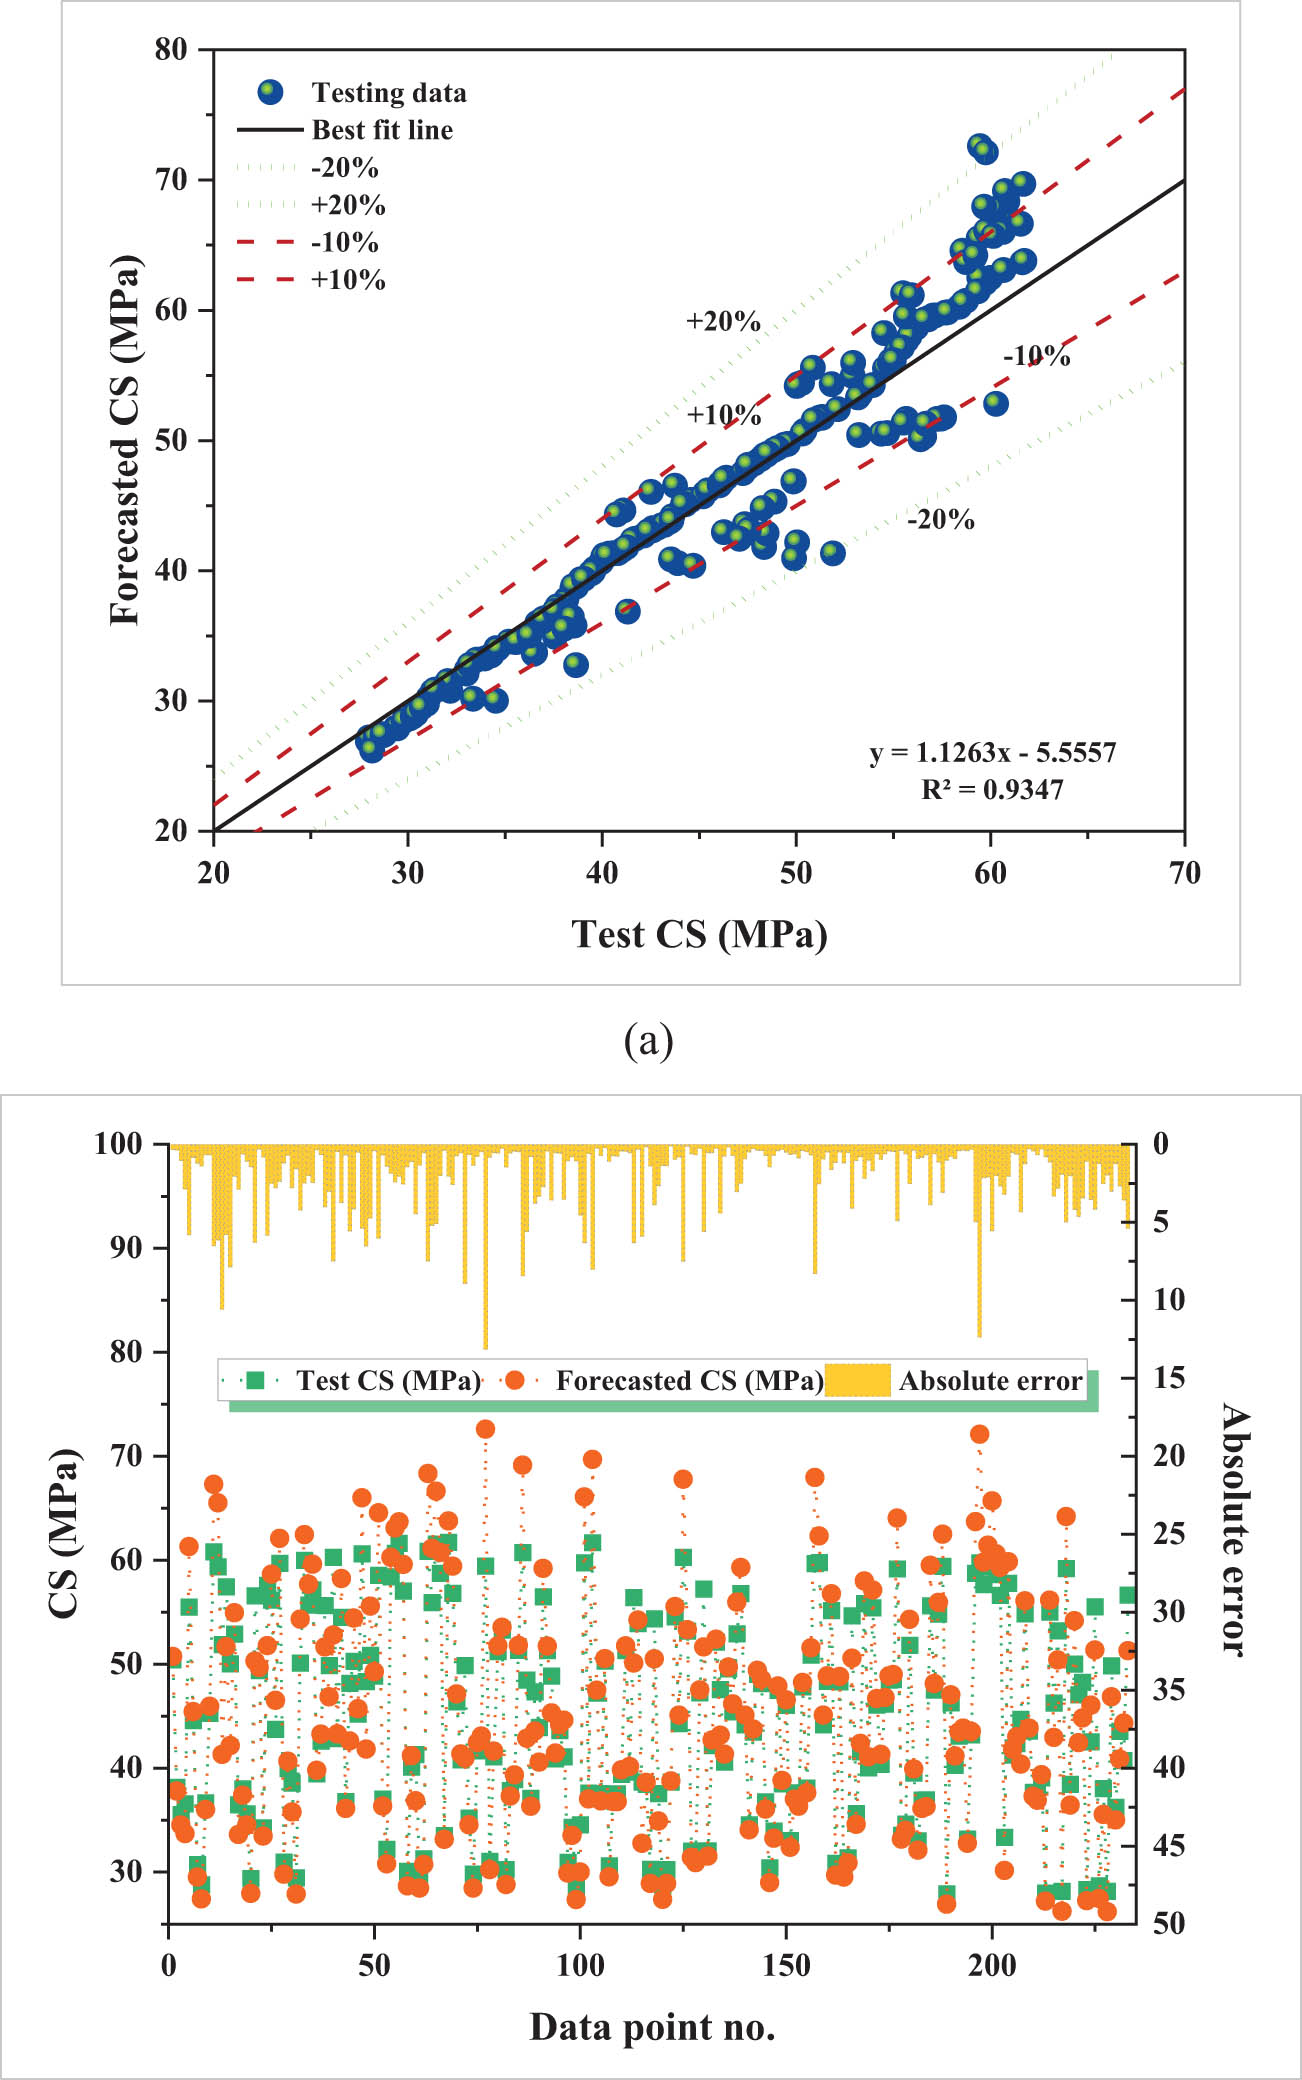
Figure 5(a) provides evidence of the MEP model’s resilience to simplification and proficiency; the figure also boasts an impressive R 2 value of 0.964. The CS model developed using MEP demonstrated greater reliability than the GEP model, as evidenced by its higher R 2 value. The solid black line in Figure 5(a) displays a perfect one-to-one connection between the anticipated and actual values, whereas the dashed red and dotted green lines indicate variances of ±10 and ±20%, respectively. The predicted CS values from the MEP model align closely with the experimental data, indicating strong predictive performance and minimal deviation across the majority of observations. The MEP approach consistently produced precise CS calculations for agro-waste derived concrete. Its forecasts met or exceeded the 10% requirement in 97% of cases and the 20% barrier in 100% of cases, highlighting its remarkable accuracy.
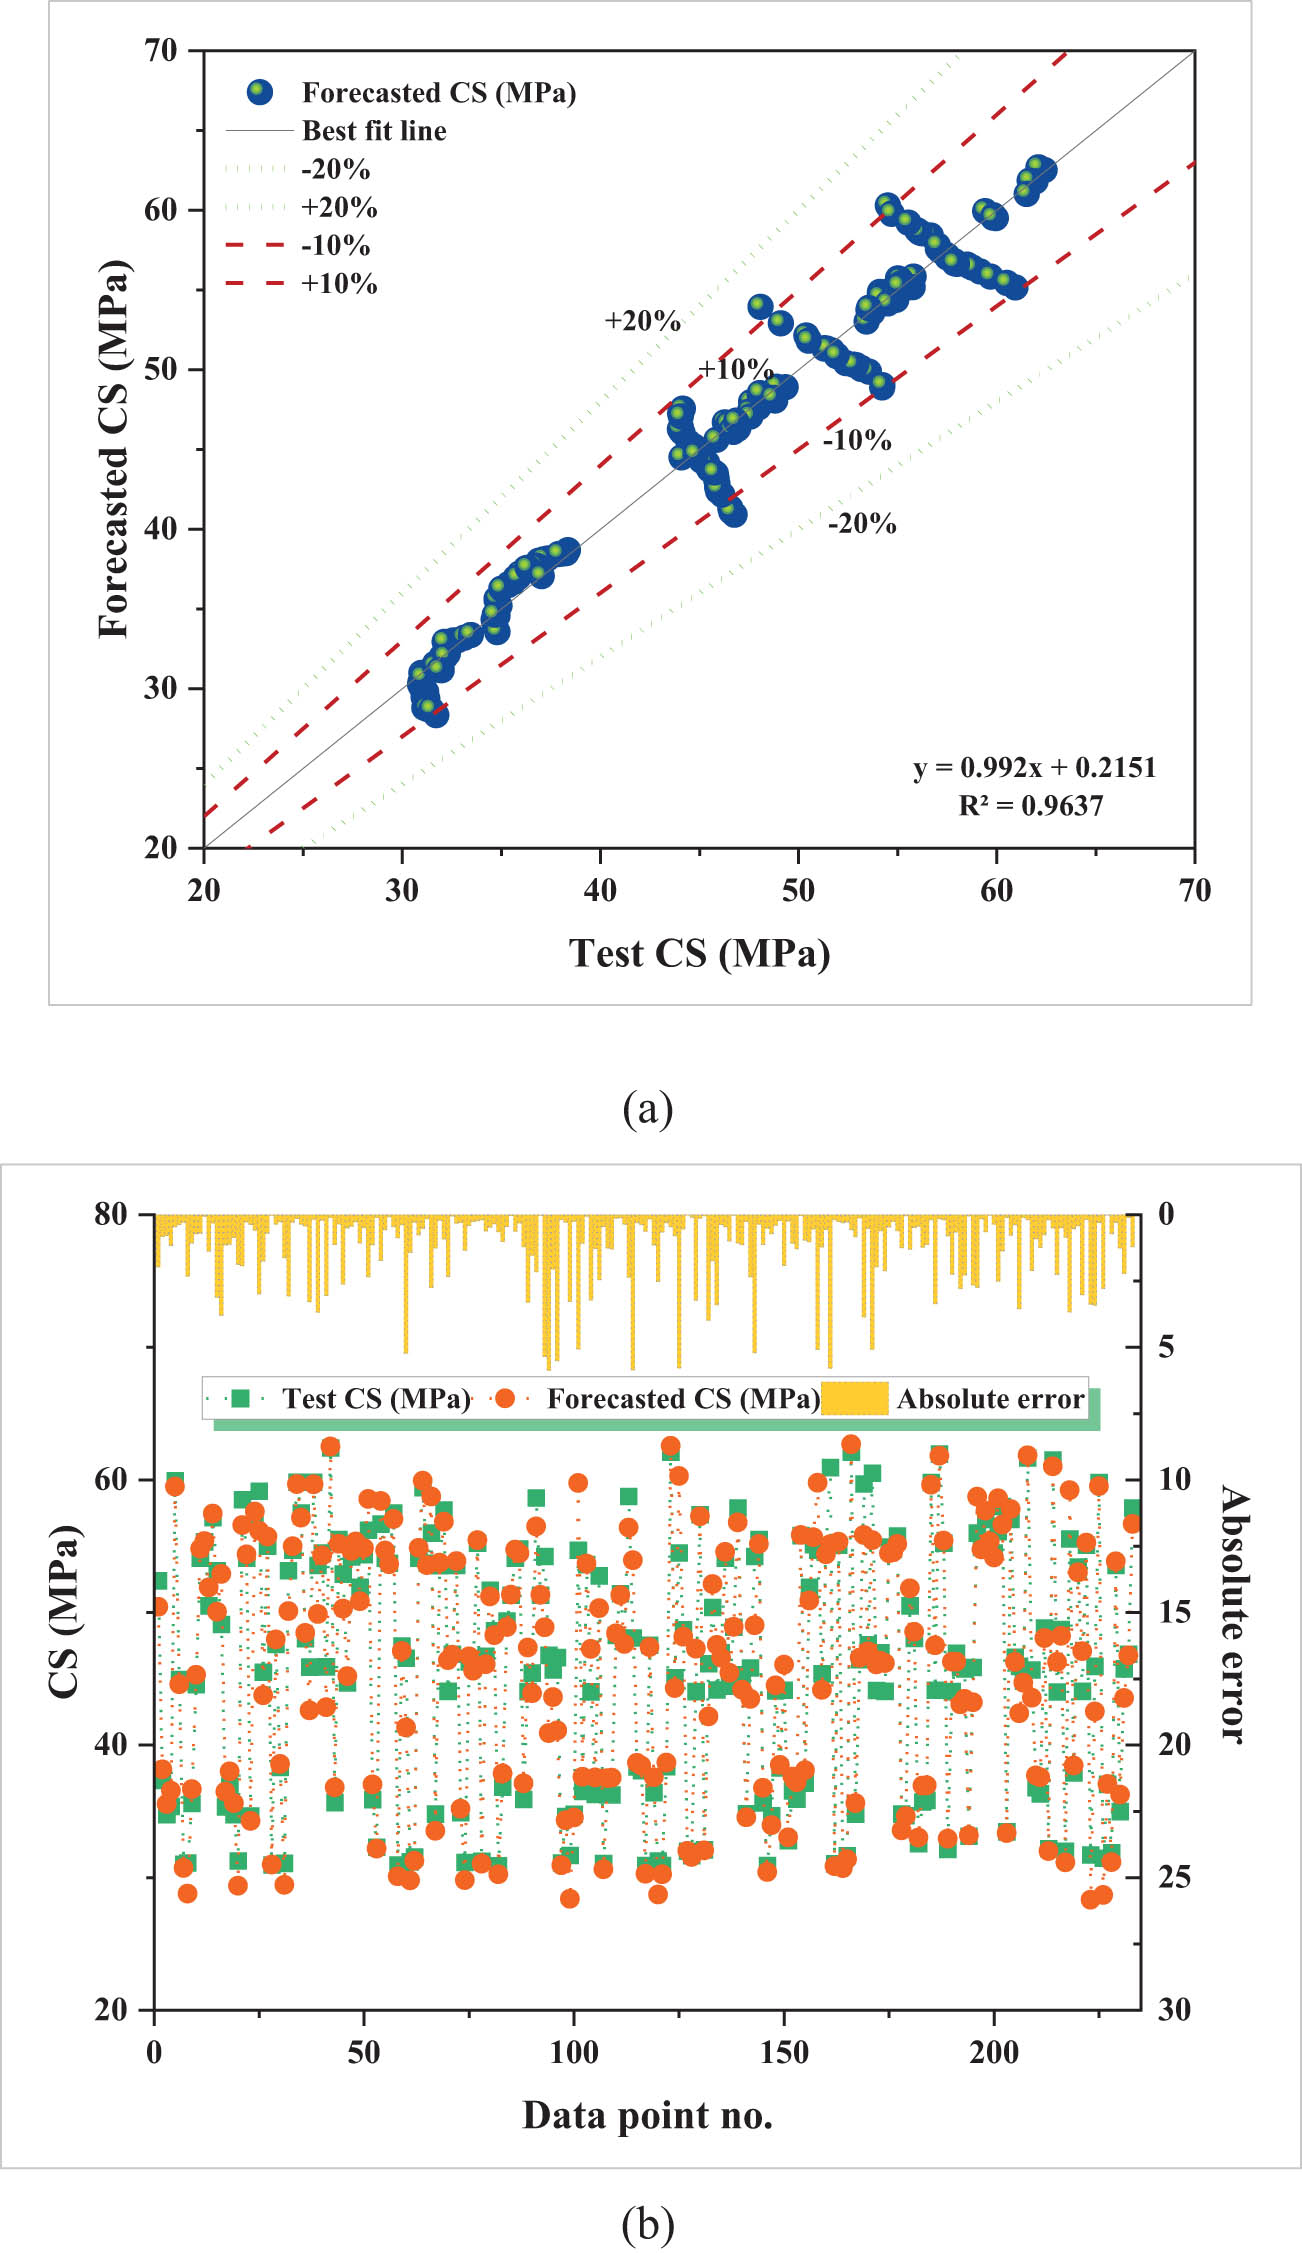
CS modeling with MEP: (a) Estimated vs observed CS relationship and (b) dataset-level error dispersion.
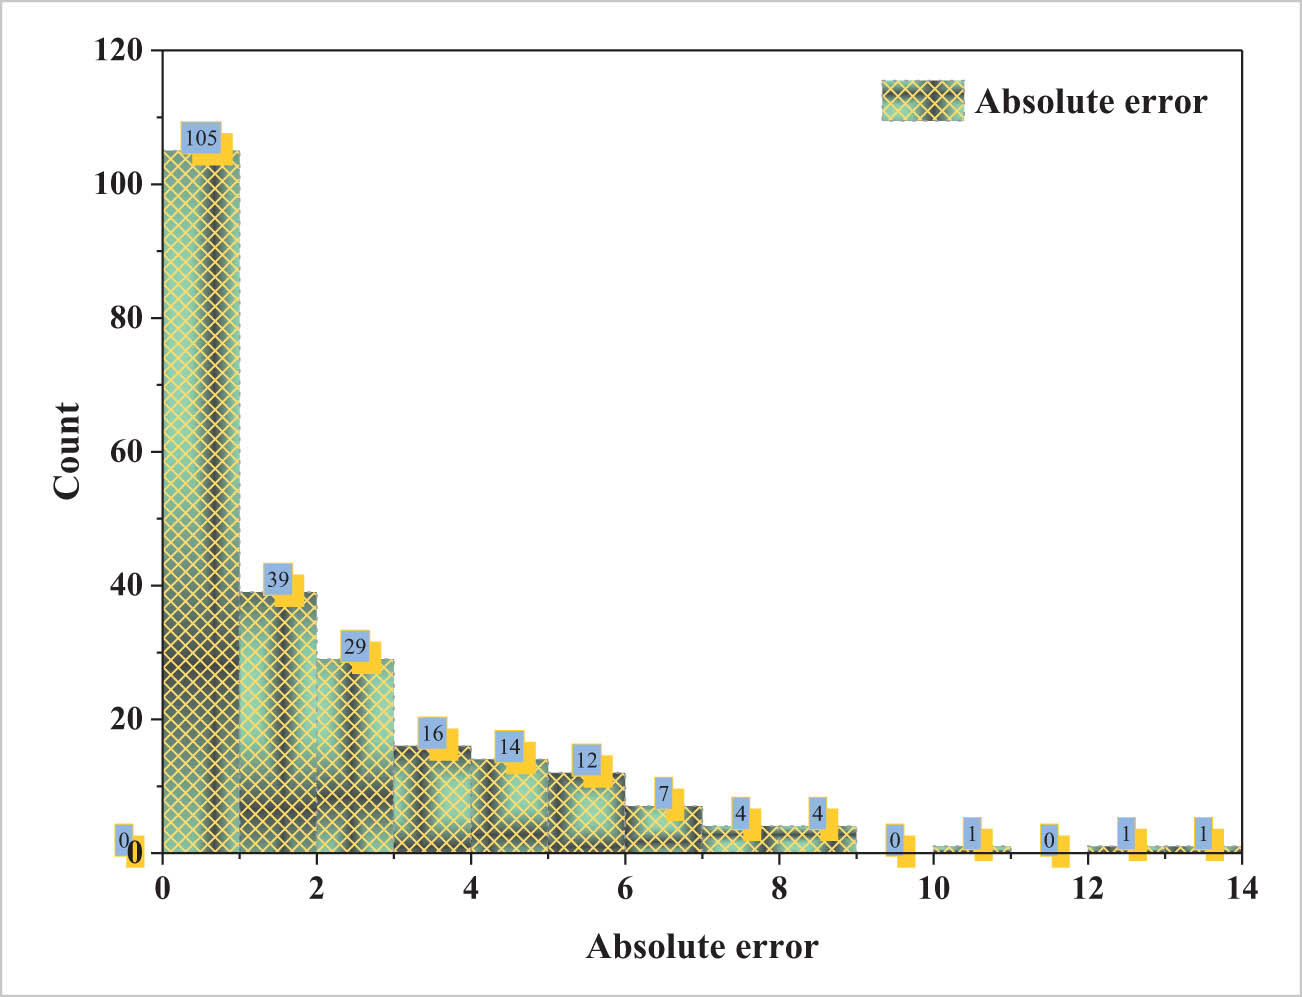
Figure 5(b) illustrates the absolute error distribution between the measured and predicted CS values generated by the MEP model. This analysis highlights the model’s ability to minimize prediction deviations, providing a clear depiction of how closely the estimated results align with experimental outcomes across the dataset. There is a wide variation in the MEP calculations, from 0.006 to 5.869 MPa, with an average error of 1.245 MPa. Nevertheless, the average inaccuracy is lower than 5.869 MPa; 137 of them are less than 1.0 MPa, 85 are between 1.0 and 5.0 MPa, and just 11 are greater than 5.0 MPa. Figure 6 shows a distribution plot comparing the MEP and GEP models. The MEP model has lower prediction variability, especially when outlier values are taken into consideration. This indicates a more stable and consistent performance of MEP in estimating CS. The GEP and MEP models both demonstrate great potential as accurate forecasters. In contrast, lowering the correlation coefficient and error standard deviations is achieved by utilizing the MEP equation. The MEP equation’s popularity stems from its widespread use and adaptability.
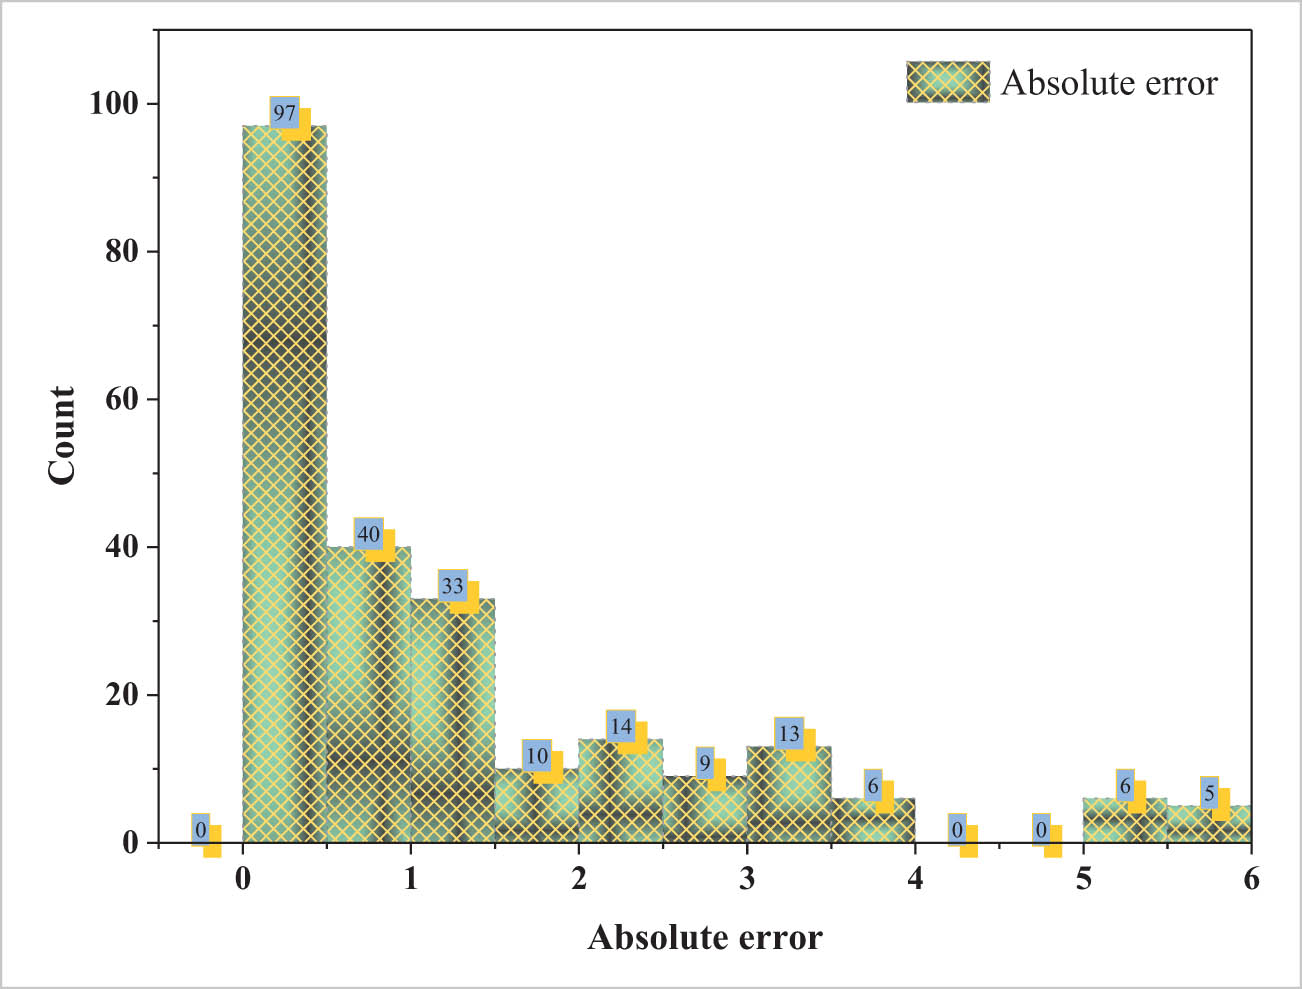
Residual error distribution of the CS-MEP model.
3.2 TS models
3.2.1 GEP predictive model
The TS was computed by the models using ETs by utilizing mathematical correlations that emerged from the relationship between genome frequency and head size. Once the GEP method encodes the subexpression trees, it results in a complete algebraic equation as shown in Eq. (10), which can be utilized to estimate the TS of concrete incorporating agro-waste materials. When sufficient input data are provided, this model has the potential to perform even better than a theoretically ideal model. The solid black line in Figure 7(a) shows that the predicted and actual values are perfectly aligned. The red dashed line indicates a 10% deviation while the green dotted line represents a 20% variation. This figure highlights a strong correlation between the measured TS values and those predicted by the GEP model. The technique proved highly effective in estimating TS, achieving an R squared value of 0.946. Additionally, 82% of the predictions fell within a 10% error margin and 96% within a 20% range, demonstrating the model’s high level of precision. Figure 7(b) displays the absolute errors between the experimental and predicted values, revealing a close match between them. The model achieved an average absolute error of 0.253 MPa, with errors ranging from 0.002 to 2.519 MPa. Figure 8 shows that the error values have a dome-shaped distribution. In all, 189 of the erroneous values are between 0.2 and 0.5 MPa, with 123 of those being below 0.2 MPa and 21 beyond 0.5 MPa, according to the error distribution. It is rare for maximal error incidences to occur.
where, TS: tensile strength, CCA: corn cob ash content, RHA: Rice husk ash content, POA: palm oil ash content, SBA: sugarcane Bagasse ash content, WSA: wheat straw ash content, WCR: water-to-cementitious tatio, and CD: curing duration.
TS modeling with GEP: (a) Estimated vs observed TS relationship and (b) dataset-level error dispersion.
Residual error distribution of the TS-GEP model.
3.2.2 MEP predictive model
An empirical formula was developed using the MEP results and the impacts of the seven independent components to determine the TS of agro-waste derived concrete. The final set of mathematical equations derived from modeling is shown in Eq. (11).
where, TS: tensile strength, CCA: Corn cob ash content, RHA: rice husk ash content, POA: palm oil ash content, SBA: sugarcane Bagasse ash content, WSA: Wheat straw ash content, WCR: water-to-cementitious ratio, and CD: curing duration.
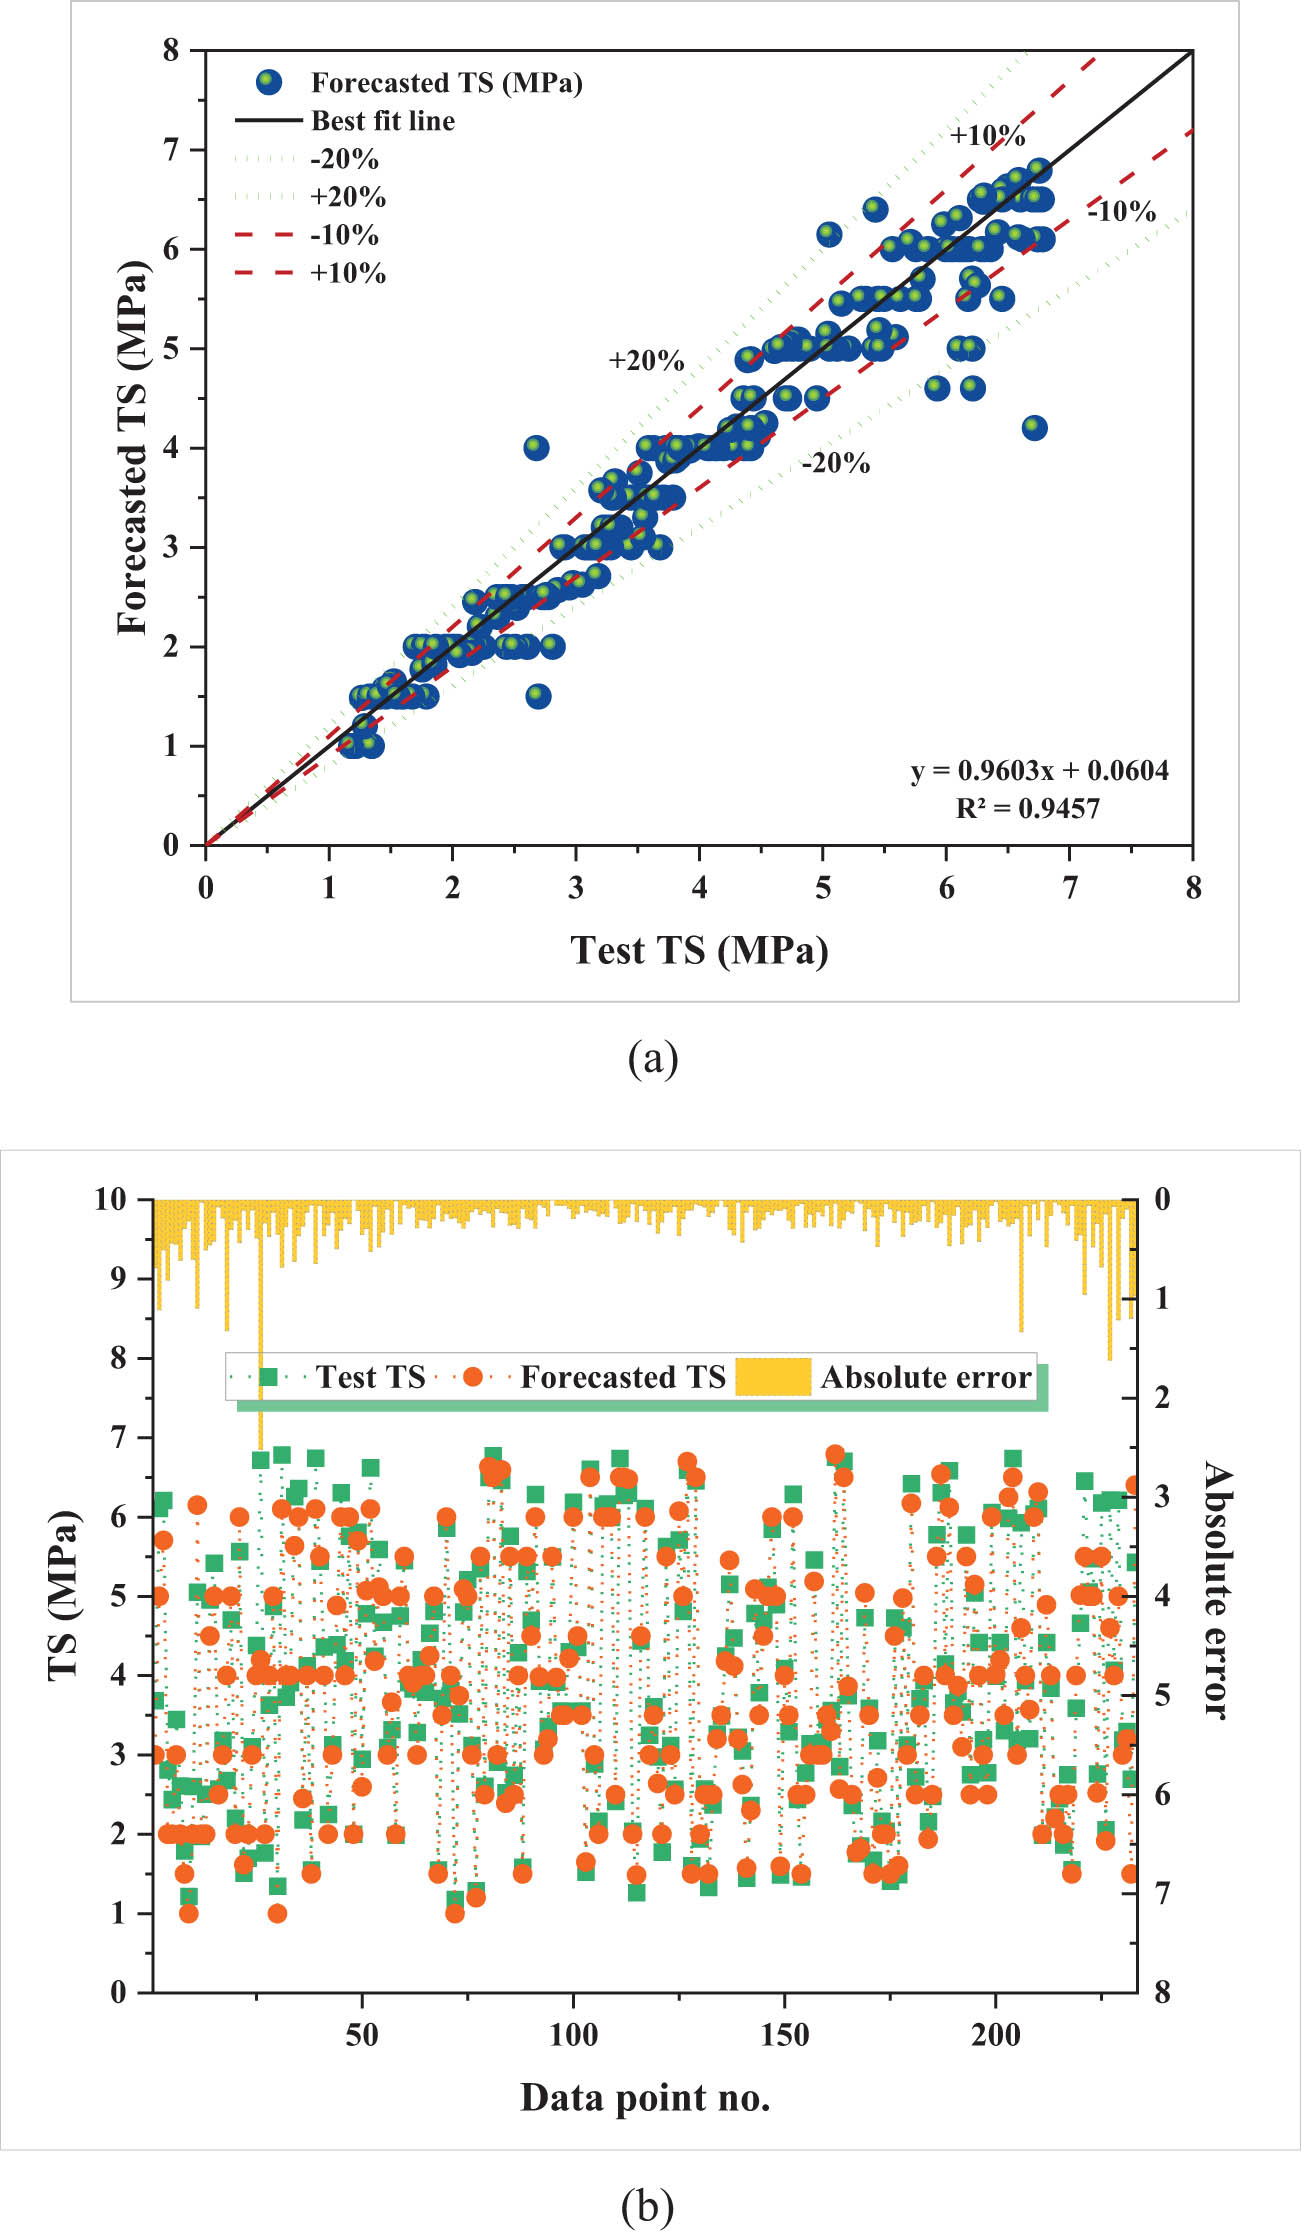
The MEP model demonstrated outstanding predictive capability for TS, as evidenced by its high R squared value of 0.961, shown in Figure 9(a). This strong correlation suggests that the model is robust and effectively captures the underlying complexity of the data without oversimplifying it. The MEP model for TS is more accurate than the GEP model, just as it is for CS. A perfect one-to-one correspondence between anticipated and actual values is shown by the solid black line in Figure 9(a), whereas lines representing 10 and 20% variances, respectively, are shown by the red and green lines. The predicted TS values closely followed the experimental results, showing strong consistency. Notably, 86% of the predicted values were within a 10% deviation and all predictions fell within the 20% range, confirming the exceptional accuracy and reliability of the MEP approach for modeling the TS of agro-waste-based concrete.
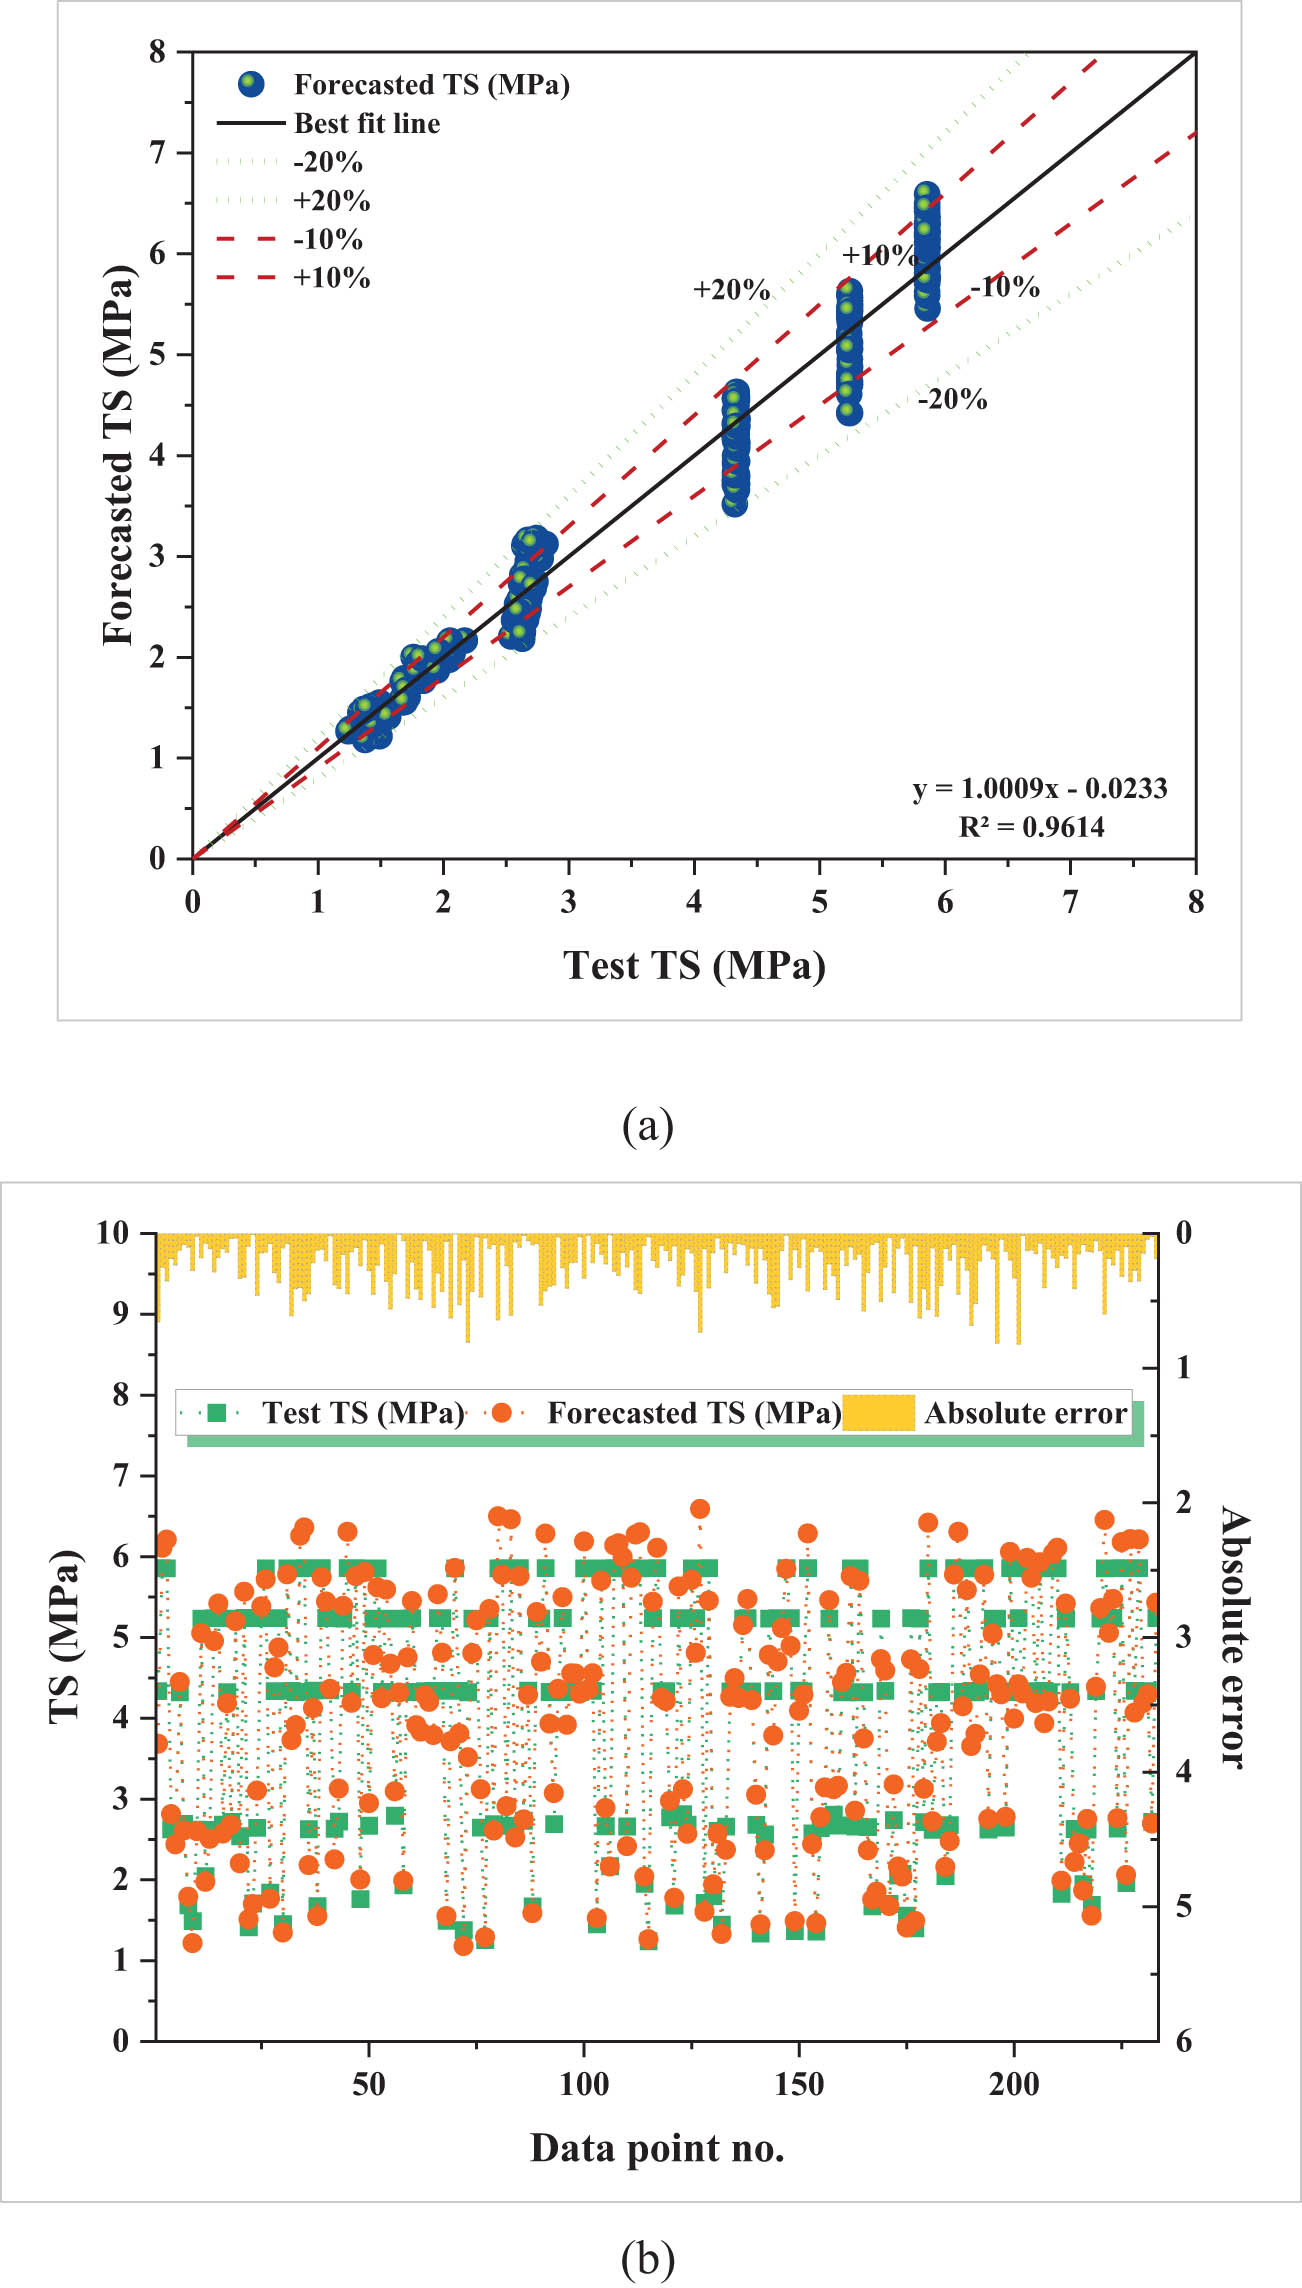
TS modeling with MEP: (a) Estimated vs observed TS relationship and (b) dataset-level error dispersion.
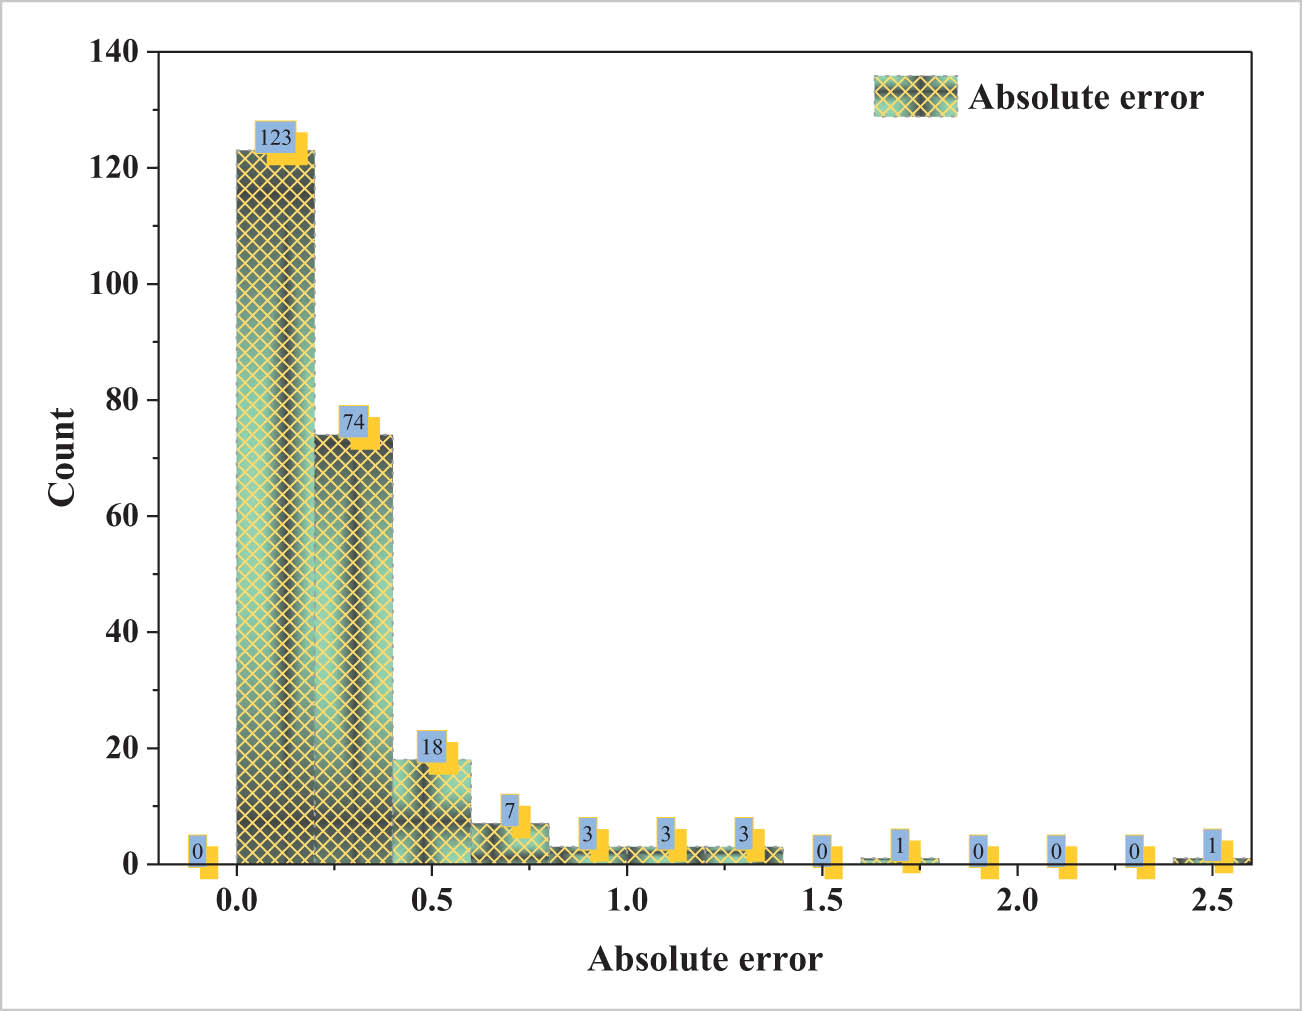
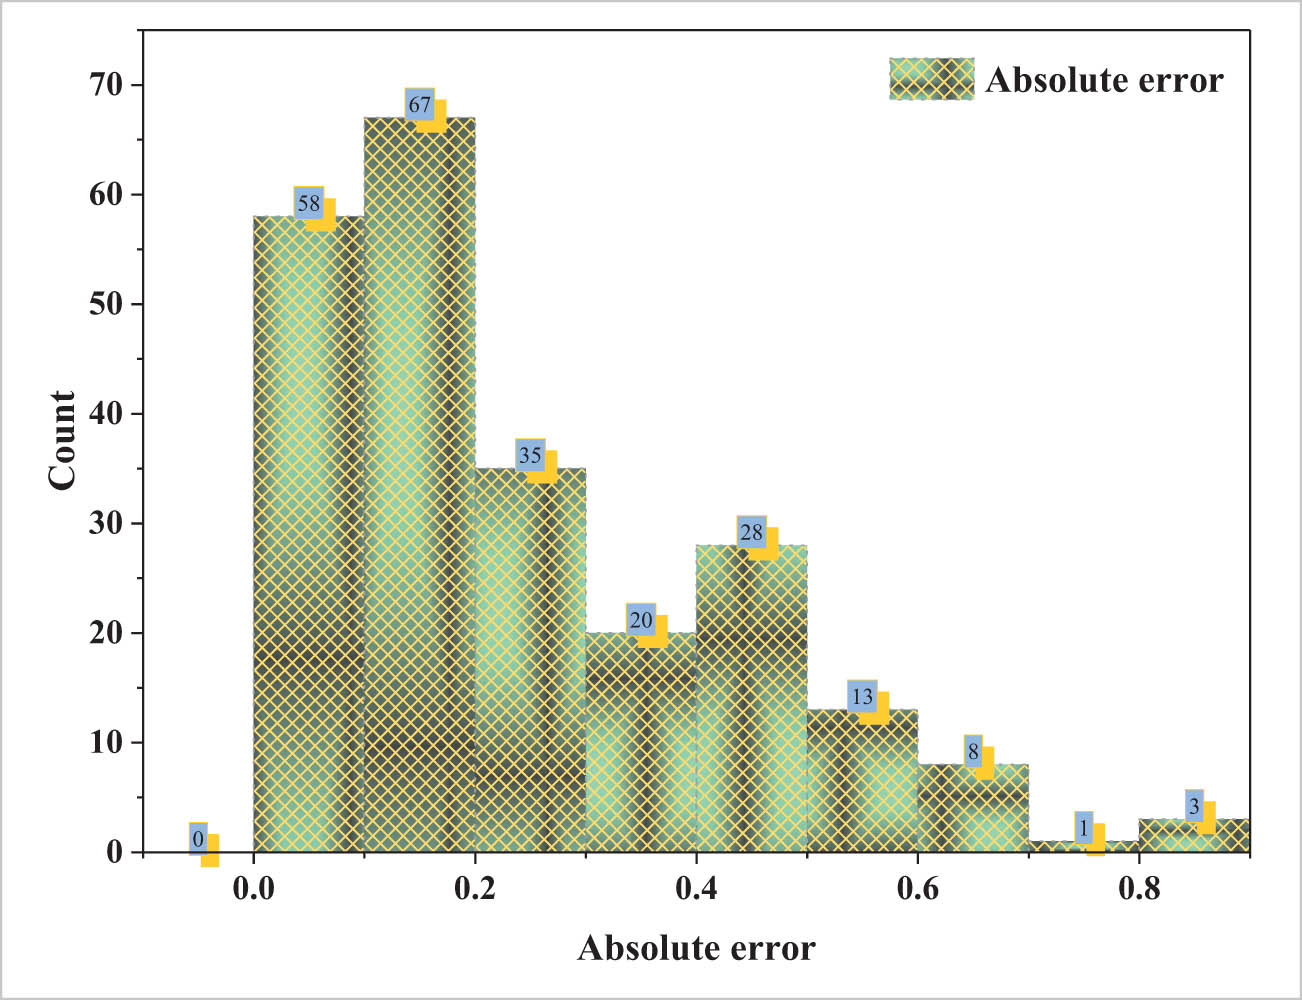
The MEP model simulation results are shown in Figure 9(b), with an emphasis on the absolute discrepancies between the actual and anticipated TS values. The data show that the model is very accurate, with an average error of only 0.239 MPa and individual errors ranging from 0.003 to 0.821 MPa. Further analysis in Figure 10 illustrates the distribution of these errors: 125 values fall below 0.2 MPa, 83 are between 0.2 and 0.5 MPa, and only 25 values exceed 0.5 MPa. Even when considering outlier values, the MEP model exhibits lower variability in results compared to the GEP model. Overall, both modeling techniques, MEP and GEP, have proven effective for predictive modeling, but MEP offers a distinct advantage. The reduced standard deviation in prediction errors and stronger correlation coefficients confirm that the MEP model delivers greater reliability and predictive accuracy than the GEP model.
Residual error distribution of the TS-MEP model.
3.3 Performance metrics and accuracy evaluation
Table 3 provides a comprehensive statistical comparison of GEP and MEP models for predicting the CS and TS of agro-waste-based concrete. Across all key performance indicators including MAE, MAPE, RMSE, R, RSE, NSE, and RRMSE, the MEP model consistently outperforms GEP, demonstrating its superior predictive capability. For CS prediction, MEP shows notably lower error values such as MAE of 1.245 MPa, RMSE of 1.845 MPa, and MAPE of 2.70%, along with a higher correlation coefficient of 0.982 and improved NSE of 0.963. It also exhibits reduced RSE and RRMSE values, indicating closer alignment between predicted and actual outcomes. In TS prediction, MEP again performs slightly better with lower MAE of 0.239 MPa, RMSE of 0.301 MPa, and MAPE of 6.20%, accompanied by stronger correlation and efficiency values. These findings highlight the robustness of MEP in capturing the complex nonlinear relationships inherent in material behavior, making it a more accurate and dependable modeling approach than GEP for strength prediction in sustainable concrete studies. The Taylor diagram in Figure 11 offers a widespread association of all predictive models, demonstrating the close alignment of MEP models in forecasting the CS and TS of agro-waste derived concrete, while GEP models are relatively more divergent. Consistent with earlier research, the MEP model stands out as the best ML method for CS and TS prediction of agro-waste derived concrete, exhibiting the fewest outliers, most efficiency, and highest R 2 value. In conclusion, the analysis of error metrics and correlation efficiency statistics confirms that MEP is the more precise and efficient ML technique for predicting both CS and TS. The consistently lower prediction errors, stronger correlation coefficients, and superior efficiency metrics highlight its advantage over GEP, confirming its robustness and reliability for accurately predicting strength in material modeling applications.
Comparative analysis of arithmetical indicators
| Property | CS | TS | ||
|---|---|---|---|---|
| GEP | MEP | GEP | MEP | |
| MAE (MPa) | 2.198 | 1.245 | 0.254 | 0.239 |
| MAPE (%) | 4.50 | 2.70 | 6.80 | 6.20 |
| NSE | 0.895 | 0.963 | 0.942 | 0.960 |
| R | 0.967 | 0.982 | 0.972 | 0.981 |
| RSE | 0.344 | 0.262 | 0.384 | 0.342 |
| RRMSE (MPa) | 0.784 | 0.622 | 0.612 | 0.584 |
| RMSE (MPa) | 3.189 | 1.845 | 0.384 | 0.301 |
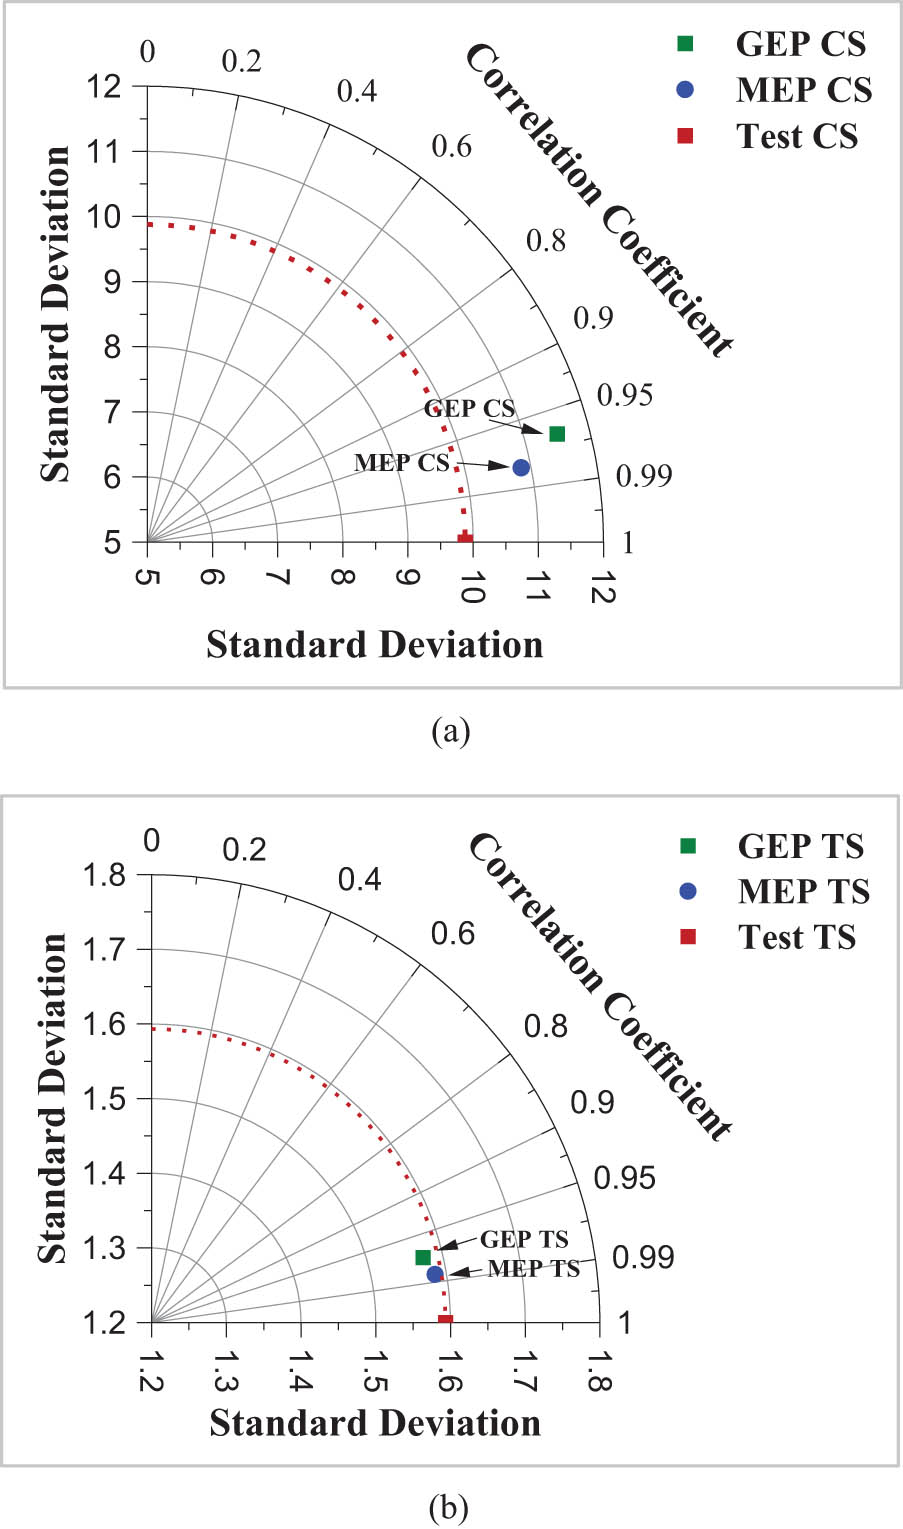
Taylor plots comparing predictive accuracy of models for (a) CS models and (b) TS models.
3.4 SHAP-based feature interpretation
The aim of this study is to explore the factors influencing the mechanical performance of concrete by analyzing its composition in detail. To understand both the overall and individual effects of input features, the SHAP tree explainer was utilized, which is widely adopted for interpreting model predictions globally. Figure 12 of the SHAP diagram shows that various input features affect agro-waste derived concrete’s CS and TS. On the X-axis, the proportion of SHAP value associated with each raw material is shown, whereas the Y-axis represents the independent variables. As illustrated in the SHAP summary plot in Figure 12(a), the agro-waste content and the WCR emerge as the dominant factors influencing the prediction of CS in agro-waste-based concrete, whereas CD contributes the least. Higher agro-waste content generally contributes positively to CS due to its pozzolanic reactivity, which enhances the concrete matrix; however, an excessive amount may negatively affect strength, indicating a nonlinear relationship. In contrast, a lower WCR consistently leads to higher predicted CS, aligning with the fundamental principle that reduced water content enhances concrete density and strength by minimizing porosity. On the other hand, CD displays negligible variation in SHAP values, suggesting its limited influence within the dataset, possibly due to saturation in curing effect or a narrow range of CDs. A similar SHAP plot in Figure 12(b) for TS also reflects a comparable trend, where WCR and agro-waste remain dominant contributors. Specifically, low WCR values positively influence TS due to improved matrix cohesion, while moderate levels of agro-waste enhance TS via refined pore structure and better particle packing. However, excessive agro-waste still tends to reduce TS, highlighting the need for an optimal balance in mix design. CD again appears to have a minimal effect on TS prediction, reinforcing its secondary role in the model. The SHAP analysis provides engineers with a transparent understanding of how individual input variables, such as WCR, agro-waste content, and supplementary materials, influence CS and TS predictions. This interpretability allows engineers to identify optimal ranges of critical variables, diagnose poor-performing mix designs, and justify decisions with quantitative evidence.
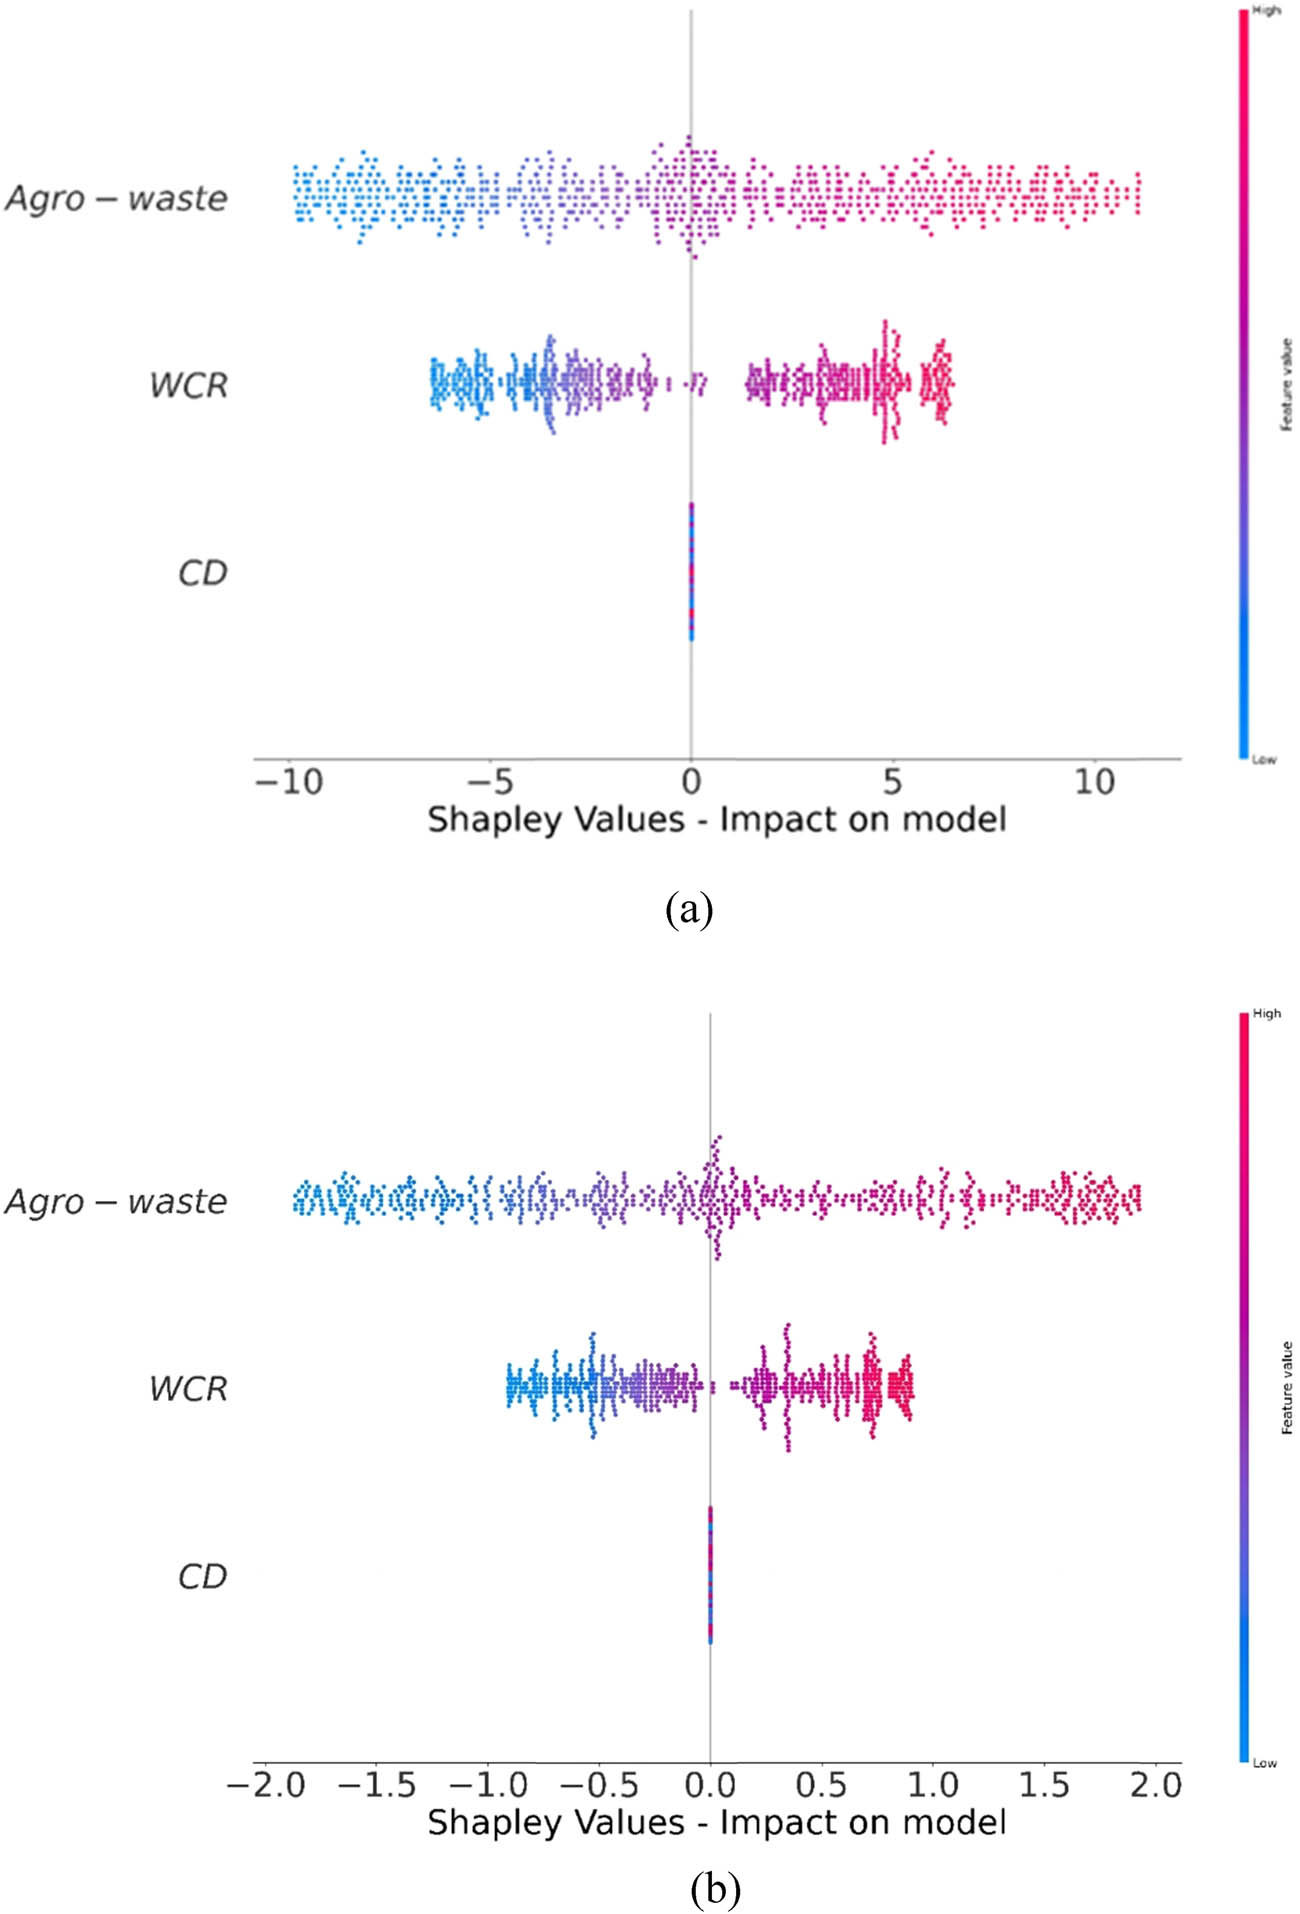
Influence of input variables: (a) CS predictions and (b) TS predictions.
3.5 Sensitivity analysis
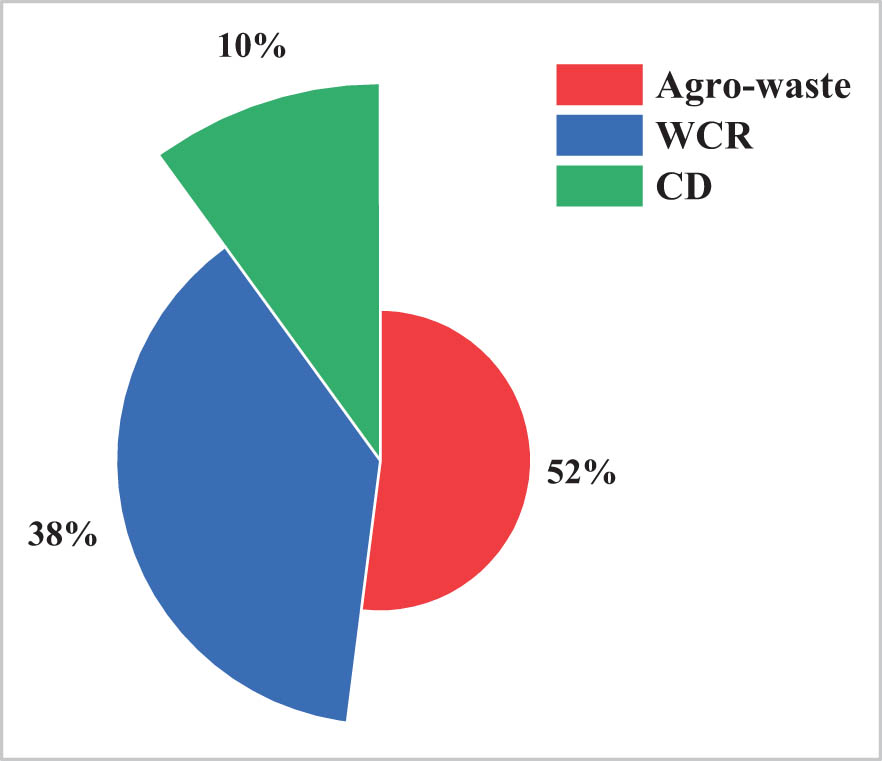
This research looks into how different input characteristics affect the CS and TS predictions in agro-waste concrete. The input variables have a high correlation with the predicted outcome [74]. The sensitivity analysis in Figure 13 reveals that agro-waste is the most influential input, contributing 52% to the model’s estimation of CS and TS. This highlights its critical role in enhancing mechanical performance, likely due to its pozzolanic and filler effects. WCR follows with a 38% impact, reflecting its importance in controlling hydration and porosity. CD has the least influence at 10%, suggesting that while it supports strength development, its effect is comparatively modest. Overall, the model is most sensitive to agro-waste and WCR, emphasizing their importance in optimizing strength outcomes. The results were greatly affected by the amount of input data points and the parameters used in the model. Keep in mind that the ML approach had varying effects on the study’s results according to certain input variables, like the amounts of concrete mix. By focusing on the most sensitive parameters, engineers can design more efficient, reliable, and sustainable concrete mixes incorporating agro-waste materials. Eqs. (12) and (13) were used to determine the weights of the model’s input parameters.
where the expression
Proportional impact of inputs on prediction results.
4 Discussion
This study underscores the potential of integrating agricultural waste materials into concrete mix designs, presenting a promising pathway toward sustainable construction practices. Effective prediction of compressive and TSs of agro-waste-based concrete was achieved by the development and evaluation of two ML models, namely, GEP and MEP. A dataset of 700 literature-derived entries incorporating 7 input parameters revealed that MEP consistently outperformed GEP across all statistical metrics. Specifically, MEP achieved lower MAE and RMSE values along with higher coefficient of determination and Nash Sutcliffe efficiency scores, demonstrating improved accuracy and reliability in capturing complex nonlinear relationships. SHAP analysis confirmed the models’ transparency by highlighting agro-waste content and WCR as the most influential features for both CS and TS predictions. In the case of CS, moderate levels of agro-waste improved strength through enhanced pozzolanic activity, while excessive replacement led to a decline. A lower WCR was linked with higher strength due to reduced porosity. For TS, a similar pattern emerged, where optimal agro-waste levels and lower WCR positively influenced tensile performance, further reinforcing the logical behavior of concrete composites. CD was shown to have a relatively lower impact on both strength parameters.
While the findings demonstrate the effectiveness of ML in optimizing sustainable concrete design, several limitations must be considered. ML models are inherently sensitive to the units and scales of input variables which can impact prediction accuracy if not properly standardized. Moreover, the dependence on a fixed set of input variables based on available literature data may reduce the models’ adaptability to cases involving other influential factors not included in the dataset such as aggregate properties or environmental exposure conditions. Although SHAP and sensitivity analyses provide useful insights into feature contributions, their interpretations are statistical in nature and do not confirm causal relationships. The relatively low impact of CD observed in this study may be due to the narrow range of values in the dataset. Future work should include experimental validation, a wider range of input parameters and real-time data to strengthen the robustness, and practical utility of such models.
5 Conclusion
Using MEP and GEP for predictive modeling, this work examines the CS and TS of concrete integrating agro-waste materials. For training, testing, and validation purposes, a dataset was used that included 700 CS and TS values that were collected experimentally. Key conclusions that summarize the research outcomes are as follows.
The GEP model had good success in predicting CS and TS agro-waste derived concrete, with R 2 values of 0.935 and 0.946, respectively. On the other hand, the MEP method proved to be more reliable in strength prediction, with R 2 values of 0.964 for CS and 0.961 for TS, demonstrating even greater accuracy and consistency.
According to the error comparison, the MEP model shows improved accuracy and reliability in strength prediction compared to GEP, with CS’s mean error dropping from 2.198 to 1.245 MPa and TS’s from 0.254 to 0.239 MPa.
The comparative results confirm that MEP consistently outperforms GEP in predicting CSs and TSs. For CS, MEP reduced RMSE from 3.189 to 1.845 MPa, MAE from 2.198 to 1.245 MPa, and improved NSE (from 0.895 to 0.963) and R (from 0.967 to 0.982). Similarly, for TS, MEP lowered RMSE from 0.384 to 0.301 MPa and enhanced NSE (from 0.942 to 0.960) and R (from 0.972 to 0.981). These improvements across all error and performance metrics demonstrate the superior accuracy and reliability of MEP in strength prediction.
The SHAP analysis shows that WCR and agro-waste content are the most influential factors in predicting both CSs and TSs of agro-waste derived concrete. Lower WCR consistently enhances strength, while agro-waste improves strength up to an optimal level but reduces it when used excessively. CD has limited impact, indicating a secondary role in strength prediction.
The sensitivity analysis confirms that agro-waste and WCR are the most impactful factors influencing the strength prediction of agro-waste derived concrete, contributing 52 and 38%, respectively. CD plays a lesser role at 10%. The model’s performance also varies with the volume of mix and the chosen ML approach, underlining the importance of tailored input parameter selection.
Predicting features across various datasets is greatly assisted by the distinct mathematical frameworks of GEP and MEP. Decisions in material design can be made more efficiently with the help of these methods for evaluating, refining, and optimizing concrete mix proportions. By generating precise mathematical models, this study accelerates the assessment and enhancement of concrete mix formulations, empowering engineers and researchers to advance material development with greater speed and effectiveness.
Acknowledgments
This work was funded by the Deanship of Graduate Studies and Scientific Research at Jouf University under Grant No. (DGSSR-2025-02-01136).
-
Funding information: Deanship of Graduate Studies and Scientific Research at Jouf University under Grant No. (DGSSR-2025-02-01136).
-
Author contributions: F.A.: conceptualization, supervision, funding acquisition, project administration, formal analysis, writing, reviewing, and editing. R-U-D.N.: data acquisition, validation, resources, visualization, writing, reviewing, and editing. T.O.A.: investigation, conceptualization, resources, visualization, writing, reviewing, and editing. M.A.D.: methodology, validation, formal analysis, writing, reviewing, and editing. S.U.A.: software, methodology, validation, formal analysis, writing – original draft, reviewing, and editing. All authors have accepted responsibility for the entire content of this manuscript and approved its submission.
-
Conflict of interest: The authors state no conflict of interest.
-
Data availability statement: The datasets generated and/or analyzed during the current study are available from the corresponding author upon reasonable request.
References
[1] Ghosh, A. and G. D. Ransinchung. Application of machine learning algorithm to assess the efficacy of varying industrial wastes and curing methods on strength development of geopolymer concrete. Construction and Building Materials, Vol. 341, 2022, id. 127828.10.1016/j.conbuildmat.2022.127828Search in Google Scholar
[2] Belaïd, F. How does concrete and cement industry transformation contribute to mitigating climate change challenges? Resources, Conservation & Recycling Advances, Vol. 15, 2022, id. 200084.10.1016/j.rcradv.2022.200084Search in Google Scholar
[3] Ahmad, W., S. J. McCormack, and A. Byrne. Biocomposites for sustainable construction: A review of material properties, applications, research gaps, and contribution to circular economy. Journal of Building Engineering, Vol. 105, 2025, id. 112525.10.1016/j.jobe.2025.112525Search in Google Scholar
[4] Andrew, R. M. Global CO2 emissions from cement production, 1928–2018. Earth System Science Data, Vol. 11, 2019, pp. 1675–1710.10.5194/essd-11-1675-2019Search in Google Scholar
[5] Puertas, F., J. A. Suárez-Navarro, M. M. Alonso, and C. Gascó. NORM waste, cements, and concretes. A review. Materiales de Construcción, Vol. 71, No. 344, 2021, id. e259.10.3989/mc.2021.13520Search in Google Scholar
[6] Li, K., X. Wang, X. Wang, S. Tu, Y. Song, T. Shi, et al. A comprehensive benefit evaluation of recycled carbon fiber reinforced cement mortar based on combined weighting. Construction and Building Materials, Vol. 489, 2025, id. 142196.10.1016/j.conbuildmat.2025.142196Search in Google Scholar
[7] Elmagarhe, A., Q. Lu, M. Alharthai, M. Alamri, and A. Elnihum. Performance of porous asphalt mixtures containing recycled concrete aggregate and fly ash. Materials, Vol. 15, 2022, id. 6363.10.3390/ma15186363Search in Google Scholar PubMed PubMed Central
[8] Schaubroeck, T., T. Gibon, E. Igos, and E. Benetto. Sustainability assessment of circular economy over time: Modelling of finite and variable loops & impact distribution among related products. Resources, Conservation and Recycling, Vol. 168, 2021, id. 105319.10.1016/j.resconrec.2020.105319Search in Google Scholar
[9] Jiang, Z., G. He, Y. Jiang, H. Zhao, Y. Duan, G. Yuan, et al. Synergistic preparation and properties of ceramic foams from wolframite tailings and high-borosilicate waste glass. Construction and Building Materials, Vol. 457, 2024, id. 139367.10.1016/j.conbuildmat.2024.139367Search in Google Scholar
[10] Shaaban, I. G., J. P. Rizzuto, A. El-Nemr, L. Bohan, H. Ahmed, and H. Tindyebwa. Mechanical properties and air permeability of concrete containing waste tires extracts. Journal of Materials in Civil Engineering, Vol. 33, 2021, id. 04020472.10.1061/(ASCE)MT.1943-5533.0003588Search in Google Scholar
[11] Nurruddin, M. F., H. Sani, B. S. Mohammed, and I. Shaaban. Methods of curing geopolymer concrete: A review. International Journal of Advanced and Applied Sciences, Vol. 5, 2018, pp. 31–36.10.21833/ijaas.2018.01.005Search in Google Scholar
[12] Saif, M. S., A. S. Shanour, G. E. Abdelaziz, H. I. Elsayad, I. G. Shaaban, B. A. Tayeh, et al. Influence of blended powders on properties of ultra-high strength fibre reinforced self compacting concrete subjected to elevated temperatures. Case Studies in Construction Materials, Vol. 18, 2023, id. e01793.10.1016/j.cscm.2022.e01793Search in Google Scholar
[13] Khan, A. A., W. de Jong, P. J. Jansens, and H. Spliethoff. Biomass combustion in fluidized bed boilers: Potential problems and remedies. Fuel Processing Technology, Vol. 90, 2009, pp. 21–50.10.1016/j.fuproc.2008.07.012Search in Google Scholar
[14] Liew, K. M., A. O. Sojobi, and L. W. Zhang. Green concrete: Prospects and challenges. Construction and Building Materials, Vol. 156, 2017, pp. 1063–1095.10.1016/j.conbuildmat.2017.09.008Search in Google Scholar
[15] Khan, R., A. Jabbar, I. Ahmad, W. Khan, A. N. Khan, and J. Mirza. Reduction in environmental problems using rice-husk ash in concrete. Construction and Building Materials, Vol. 30, 2012, pp. 360–365.10.1016/j.conbuildmat.2011.11.028Search in Google Scholar
[16] Hassan, A., T. Alomayri, M. F. Noaman, and C. Zhang. 3D printed concrete for sustainable construction: A review of mechanical properties and environmental impact. Archives of Computational Methods in Engineering, Vol. 32, 2025, pp. 1–31.10.1007/s11831-024-10220-5Search in Google Scholar
[17] Yang, L., Y. Gao, H. Chen, H. Jiao, M. Dong, T. A. Bier, et al. Three-dimensional concrete printing technology from a rheology perspective: a review. Advances in Cement Research, Vol. 36, 2024, pp. 567–586.10.1680/jadcr.23.00205Search in Google Scholar
[18] Tangchirapat, W., T. Saeting, C. Jaturapitakkul, K. Kiattikomol, and A. Siripanichgorn. Use of waste ash from palm oil industry in concrete. Waste Management, Vol. 27, 2007, pp. 81–88.10.1016/j.wasman.2005.12.014Search in Google Scholar PubMed
[19] Mehta, P. K. Properties of blended cements made from rice husk ash. Journal of the American Concrete Institute, Vol. 74, 1977, pp. 440–442.10.14359/11022Search in Google Scholar
[20] Payá, J., J. Monzó, M. V. Borrachero, and E. Peris-Mora. Comparisons among magnetic and non-magnetic fly ash fractions: Strength development of cement-fly ash mortars. Waste Management, Vol. 16, 1996, pp. 119–124.10.1016/S0956-053X(96)00034-7Search in Google Scholar
[21] Ismail, M. S. and A. M. Waliuddin. Effect of rice husk ash on high strength concrete. Construction and Building Materials, Vol. 10, 1996, pp. 521–526.10.1016/0950-0618(96)00010-4Search in Google Scholar
[22] Ahmad, W., V. S. S. C. S. Veeraghantla, and A. Byrne. Advancing sustainable concrete using biochar: Experimental and modelling study for mechanical strength evaluation. Sustainability, Vol. 17, 2025, id. 2516.10.3390/su17062516Search in Google Scholar
[23] Avci, O., O. Abdeljaber, S. Kiranyaz, M. Hussein, M. Gabbouj, and D. J. Inman. A review of vibration-based damage detection in civil structures: From traditional methods to Machine Learning and Deep Learning applications. Mechanical Systems and Signal Processing, Vol. 147, 2021, id. 107077.10.1016/j.ymssp.2020.107077Search in Google Scholar
[24] Ghahramani, Z. Probabilistic machine learning and artificial intelligence. Nature, Vol. 521, 2015, pp. 452–459.10.1038/nature14541Search in Google Scholar PubMed
[25] Long, X., M.-H. Mao, T.-X. Su, Y.-T. Su, and M.-K. Tian. Machine learning method to predict dynamic compressive response of concrete-like material at high strain rates. Defence Technology, Vol. 23, 2023, pp. 100–111.10.1016/j.dt.2022.02.003Search in Google Scholar
[26] Stocker, T. Climate change 2013: the physical science basis: Working Group I contribution to the Fifth assessment report of the Intergovernmental Panel on Climate Change, Cambridge University Press, Cambridge, United Kingdom, 2014.Search in Google Scholar
[27] Dietterich, T. G. Ensemble methods in machine learning, Springer, Berlin, Germany, 2000, pp. 1–15.10.1007/3-540-45014-9_1Search in Google Scholar
[28] Haenlein, M. and A. Kaplan. A brief history of artificial intelligence: On the past, present, and future of artificial intelligence. California Management Review, Vol. 61, 2019, pp. 5–14.10.1177/0008125619864925Search in Google Scholar
[29] Marani, A. and M. L. Nehdi. Machine learning prediction of compressive strength for phase change materials integrated cementitious composites. Construction and Building Materials, Vol. 265, 2020, id. 120286.10.1016/j.conbuildmat.2020.120286Search in Google Scholar
[30] Ahmad, A., W. Ahmad, F. Aslam, and P. Joyklad. Compressive strength prediction of fly ash-based geopolymer concrete via advanced machine learning techniques. Case Studies in Construction Materials, Vol. 16, 2022, id. e00840.10.1016/j.cscm.2021.e00840Search in Google Scholar
[31] Peng, Y. and C. Unluer. Analyzing the mechanical performance of fly ash-based geopolymer concrete with different machine learning techniques. Construction and Building Materials, Vol. 316, 2022, id. 125785.10.1016/j.conbuildmat.2021.125785Search in Google Scholar
[32] Timur Cihan, M. Prediction of concrete compressive strength and slump by machine learning methods. Advances in Civil Engineering, Vol. 2019, 2019, pp. 1–11.10.1155/2019/3069046Search in Google Scholar
[33] Tamimi, A. K., J. A. Abdalla, and Z. I. Sakka. Prediction of long term chloride diffusion of concrete in harsh environment. Construction and Building Materials, Vol. 22, 2008, pp. 829–836.10.1016/j.conbuildmat.2007.01.001Search in Google Scholar
[34] Zhang, W., S. Zhang, J. Wei, and Y. Huang. Flexural behavior of SFRC-NC composite beams: An experimental and numerical analytical study. Structures, Vol. 60, 2024, id. 105823.10.1016/j.istruc.2023.105823Search in Google Scholar
[35] Zhang, W., X. Liu, Y. Huang, and M.-N. Tong. Reliability-based analysis of the flexural strength of concrete beams reinforced with hybrid BFRP and steel rebars. Archives of Civil and Mechanical Engineering, Vol. 22, 2022, id. 171.10.1007/s43452-022-00493-7Search in Google Scholar
[36] Nazar, S., J. Yang, A. Ahmad, and S. F. A. Shah. Comparative study of evolutionary artificial intelligence approaches to predict the rheological properties of fresh concrete. Materials Today Communications, Vol. 32, 2022, id. 103964.10.1016/j.mtcomm.2022.103964Search in Google Scholar
[37] Song, H., A. Ahmad, F. Farooq, K. A. Ostrowski, M. Maślak, S. Czarnecki, et al. Predicting the compressive strength of concrete with fly ash admixture using machine learning algorithms. Construction and Building Materials, Vol. 308, 2021, id. 125021.10.1016/j.conbuildmat.2021.125021Search in Google Scholar
[38] Moein, M. M., A. Saradar, K. Rahmati, S. H. G. Mousavinejad, J. Bristow, V. Aramali, et al. Predictive models for concrete properties using machine learning and deep learning approaches: A review. Journal of Building Engineering, Vol. 63, 2022, id. 105444.10.1016/j.jobe.2022.105444Search in Google Scholar
[39] Niu, Y., W. Wang, Y. Su, F. Jia, and X. Long. Plastic damage prediction of concrete under compression based on deep learning. Acta Mechanica, Vol. 235, 2024, pp. 255–266.10.1007/s00707-023-03743-8Search in Google Scholar
[40] Abbas, A., G. Fathifazl, O. B. Isgor, A. G. Razaqpur, B. Fournier, and S. Foo. Environmental benefits of green concrete, IEEE, New York, USA, 2006, pp. 1–8.10.1109/EICCCC.2006.277204Search in Google Scholar
[41] Baigh, T. A. and F. Nanzeeba. Integration and mechanical characterization of PALF and jute fibre in epoxy polymer to fabricate structural hybrid biocomposites, Islamic University of Technology (Doctoral Dissertation), Gazipur, Bangladesh, 2023.Search in Google Scholar
[42] Meyer, C. The greening of the concrete industry. Cement and Concrete Composites, Vol. 31, 2009, pp. 601–605.10.1016/j.cemconcomp.2008.12.010Search in Google Scholar
[43] Siddique, R. Waste materials and by-products in concrete, Springer Science & Business Media, Berlin, Germany, 2007.Search in Google Scholar
[44] Amran, M., R. Fediuk, G. Murali, N. Vatin, M. Karelina, T. Ozbakkaloglu, et al. Rice husk ash-based concrete composites: A critical review of their properties and applications. Crystals, Vol. 11, 2021, id. 168.10.3390/cryst11020168Search in Google Scholar
[45] Sobuz, M. H. R., S. D. Datta, J. A. Jabin, F. S. Aditto, N. M. S. Hasan, M. Hasan, et al. Assessing the influence of sugarcane bagasse ash for the production of eco-friendly concrete: Experimental and machine learning approaches. Case Studies in Construction Materials, Vol. 20, 2024, id. e02839.10.1016/j.cscm.2023.e02839Search in Google Scholar
[46] Naik, T. R. Sustainability of the cement and concrete industries. In Sustainable construction materials and technologies, CRC Press, Boca Raton, Florida, USA, 2020, pp. 19–25.Search in Google Scholar
[47] Chandra Paul, S., P. B. K. Mbewe, S. Y. Kong, and B. Šavija. Agricultural solid waste as source of supplementary cementitious materials in developing countries. Materials, Vol. 12, 2019, id. 1112.10.3390/ma12071112Search in Google Scholar PubMed PubMed Central
[48] Shukla, A., C. K. Singh, and A. K. Sharma. Study of the properties of concrete by partial replacement of ordinary Portland cement by rice husk ash. International Journal of Earth Sciences and Engineering, Vol. 4, No. 6, 2011, pp. 965–968.Search in Google Scholar
[49] Meddah, M. S., P. T. Ramesh, and M. Sekar. Properties of Sugarcane Bagasse Ash Concrete Modified with Bacterial Treatment. ACI Materials Journal, Vol. 119, 2022, pp. 187–196.10.14359/51734613Search in Google Scholar
[50] He, J., S. Kawasaki, and V. Achal. The utilization of agricultural waste as agro-cement in concrete: A review. Sustainability, Vol. 12, 2020, id. 6971.10.3390/su12176971Search in Google Scholar
[51] Nwakaire, C. M., C. H. Aginam, and C. A. Chidolue. Prospects of partial substitution of cement with rice husk ash for road concrete works. Journal of Architectural Environment & Structural Engineering Research, Vol. 3, 2020, pp. 17–25.10.30564/jaeser.v3i3.2223Search in Google Scholar
[52] Cordeiro, G. C., R. D. Toledo Filho, and E. de Moraes Rego Fairbairn. Use of ultrafine rice husk ash with high-carbon content as pozzolan in high performance concrete. Materials and Structures, Vol. 42, 2009, pp. 983–992.10.1617/s11527-008-9437-zSearch in Google Scholar
[53] Oliko, C., C. K. Kabubo, and J. N. Mwero. Rice straw and eggshell ash as partial replacements of cement in concrete. Engineering, Technology & Applied Science Research, Vol. 10, 2020, pp. 6481–6487.10.48084/etasr.3893Search in Google Scholar
[54] Jain, V., B. Jain, and G. Sancheti. Influence of Rice Husk Ash (RHA) on the workability of concrete. Earth and Environmental Science, Vol. 796, 2021, id. 012073.10.1088/1755-1315/796/1/012073Search in Google Scholar
[55] Ahmad, W., A. Ahmad, K. A. Ostrowski, F. Aslam, P. Joyklad, and P. Zajdel. Sustainable approach of using sugarcane bagasse ash in cement-based composites: A systematic review. Case Studies in Construction Materials, Vol. 15, 2021, id. e00698.10.1016/j.cscm.2021.e00698Search in Google Scholar
[56] Jittin, V., S. N. Minnu, and A. Bahurudeen. Potential of sugarcane bagasse ash as supplementary cementitious material and comparison with currently used rice husk ash. Construction and Building Materials, Vol. 273, 2021, id. 121679.10.1016/j.conbuildmat.2020.121679Search in Google Scholar
[57] Zerbino, R., G. Giaccio, and G. C. Isaia. Concrete incorporating rice-husk ash without processing. Construction and Building Materials, Vol. 25, 2011, pp. 371–378.10.1016/j.conbuildmat.2010.06.016Search in Google Scholar
[58] Zhang, M.-h, R. Lastra, and V. M. Malhotra. Rice-husk ash paste and concrete: some aspects of hydration and the microstructure of the interfacial zone between the aggregate and paste. Cement and Concrete Research, Vol. 26, 1996, pp. 963–977.10.1016/0008-8846(96)00061-0Search in Google Scholar
[59] Athira, G. and A. Bahurudeen. Rheological properties of cement paste blended with sugarcane bagasse ash and rice straw ash. Construction and Building Materials, Vol. 332, 2022, id. 127377.10.1016/j.conbuildmat.2022.127377Search in Google Scholar
[60] Lee, B. C. and D. M. Brooks. Accurate and efficient regression modeling for microarchitectural performance and power prediction. ACM SIGOPS Operating Systems Review, Vol. 40, 2006, pp. 185–194.10.1145/1168917.1168881Search in Google Scholar
[61] Iqbal, M. F., Q.-f Liu, I. Azim, X. Zhu, J. Yang, M. F. Javed, et al. Prediction of mechanical properties of green concrete incorporating waste foundry sand based on gene expression programming. Journal of Hazardous Materials, Vol. 384, 2020, id. 121322.10.1016/j.jhazmat.2019.121322Search in Google Scholar PubMed
[62] Mohammadzadeh S, D., S.-F. Kazemi, A. Mosavi, E. Nasseralshariati, and J. H. M. Tah. Prediction of compression index of fine-grained soils using a gene expression programming model. Infrastructures, Vol. 4, 2019, id. 26.10.3390/infrastructures4020026Search in Google Scholar
[63] Shahin, M. A. Genetic programming for modelling of geotechnical engineering systems, Springer International, Cham, Switzerland, 2015.10.1007/978-3-319-20883-1_2Search in Google Scholar
[64] Çanakcı, H., A. Baykasoğlu, and H. Güllü. Prediction of compressive and tensile strength of Gaziantep basalts via neural networks and gene expression programming. Neural Computing and Applications, Vol. 18, 2009, pp. 1031–1041.10.1007/s00521-008-0208-0Search in Google Scholar
[65] Alade, I. O., M. A. Abd Rahman, and T. A. Saleh. Predicting the specific heat capacity of alumina/ethylene glycol nanofluids using support vector regression model optimized with Bayesian algorithm. Solar Energy, Vol. 183, 2019, pp. 74–82.10.1016/j.solener.2019.02.060Search in Google Scholar
[66] Alade, I. O., A. Bagudu, T. A. Oyehan, M. A. Abd Rahman, T. A. Saleh, and S. O. Olatunji. Estimating the refractive index of oxygenated and deoxygenated hemoglobin using genetic algorithm–support vector regression model. Computer Methods and Programs in Biomedicine, Vol. 163, 2018, pp. 135–142.10.1016/j.cmpb.2018.05.029Search in Google Scholar PubMed
[67] Zhang, W., R. Zhang, C. Wu, A. T. C. Goh, S. Lacasse, Z. Liu, et al. State-of-the-art review of soft computing applications in underground excavations. Geoscience Frontiers, Vol. 11, 2020, pp. 1095–1106.10.1016/j.gsf.2019.12.003Search in Google Scholar
[68] Alavi, A. H., A. H. Gandomi, H. C. Nejad, A. Mollahasani, and A. Rashed. Design equations for prediction of pressuremeter soil deformation moduli utilizing expression programming systems. Neural Computing and Applications, Vol. 23, 2013, pp. 1771–1786.10.1007/s00521-012-1144-6Search in Google Scholar
[69] Kisi, O., J. Shiri, and M. Tombul. Modeling rainfall-runoff process using soft computing techniques. Computers & Geosciences, Vol. 51, 2013, pp. 108–117.10.1016/j.cageo.2012.07.001Search in Google Scholar
[70] Alade, I. O., M. A. Abd Rahman, and T. A. Saleh. Modeling and prediction of the specific heat capacity of Al2O3/water nanofluids using hybrid genetic algorithm/support vector regression model. Nano-Structures & Nano-Objects, Vol. 17, 2019, pp. 103–111.10.1016/j.nanoso.2018.12.001Search in Google Scholar
[71] Shahin, M. A. Use of evolutionary computing for modelling some complex problems in geotechnical engineering. Geomechanics and Geoengineering, Vol. 10, 2015, pp. 109–125.10.1080/17486025.2014.921333Search in Google Scholar
[72] Band, S. S., E. Heggy, S. M. Bateni, H. Karami, M. Rabiee, S. Samadianfard, et al. Groundwater level prediction in arid areas using wavelet analysis and Gaussian process regression. Engineering Applications of Computational Fluid Mechanics, Vol. 15, 2021, pp. 1147–1158.10.1080/19942060.2021.1944913Search in Google Scholar
[73] Taylor, K. E. Summarizing multiple aspects of model performance in a single diagram. Journal of Geophysical Research: Atmospheres, Vol. 106, 2001, pp. 7183–7192.10.1029/2000JD900719Search in Google Scholar
[74] Ahmad, A., K. A.Ostrowski, M.Maślak, F.Farooq, I.Mehmood, and A.Nafees. Comparative study of supervised machine learning algorithms for predicting the compressive strength of concrete at high temperature. Materials, Vol. 14, 2021, id. 4222.10.3390/ma14154222Search in Google Scholar PubMed PubMed Central
© 2025 the author(s), published by De Gruyter
This work is licensed under the Creative Commons Attribution 4.0 International License.
Articles in the same Issue
- Review Articles
- Utilization of steel slag in concrete: A review on durability and microstructure analysis
- Technical development of modified emulsion asphalt: A review on the preparation, performance, and applications
- Recent developments in ultrasonic welding of similar and dissimilar joints of carbon fiber reinforcement thermoplastics with and without interlayer: A state-of-the-art review
- Unveiling the crucial factors and coating mitigation of solid particle erosion in steam turbine blade failures: A review
- From magnesium oxide, magnesium oxide concrete to magnesium oxide concrete dams
- Properties and potential applications of polymer composites containing secondary fillers
- A scientometric review on the utilization of copper slag as a substitute constituent of ordinary Portland cement concrete
- Advancement of additive manufacturing technology in the development of personalized in vivo and in vitro prosthetic implants
- Recent advance of MOFs in Fenton-like reaction
- A review of defect formation, detection, and effect on mechanical properties of three-dimensional braided composites
- Non-conventional approaches to producing biochars for environmental and energy applications
- Review of the development and application of aluminum alloys in the nuclear industry
- Advances in the development and characterization of combustible cartridge cases and propellants: Preparation, performance, and future prospects
- Recent trends in rubberized and non-rubberized ultra-high performance geopolymer concrete for sustainable construction: A review
- Cement-based materials for radiative cooling: Potential, material and structural design, and future prospects
- A comprehensive review: The impact of recycling polypropylene fiber on lightweight concrete performance
- A comprehensive review of preheating temperature effects on reclaimed asphalt pavement in the hot center plant recycling
- Exploring the potential applications of semi-flexible pavement: A comprehensive review
- A critical review of alkali-activated metakaolin/blast furnace slag-based cementitious materials: Reaction evolution and mechanism
- Dispersibility of graphene-family materials and their impact on the properties of cement-based materials: Application challenges and prospects
- Research progress on rubidium and cesium separation and extraction
- A step towards sustainable concrete with the utilization of M-sand in concrete production: A review
- Studying the effect of nanofillers in civil applications: A review
- Studies on the anticorrosive effect of phytochemicals on mild steel, carbon steel, and stainless-steel surfaces in acid and alkali medium: A review
- Nanotechnology for calcium aluminate cement: thematic analysis
- Towards sustainable concrete pavements: a critical review on fly ash as a supplementary cementitious material
- Optimizing rice husk ash for ultra-high-performance concrete: a comprehensive review of mechanical properties, durability, and environmental benefits
- Research Articles
- Investigation of the corrosion performance of HVOF-sprayed WC-CoCr coatings applied on offshore hydraulic equipment
- A systematic review of metakaolin-based alkali-activated and geopolymer concrete: A step toward green concrete
- Evaluation of color matching of three single-shade composites employing simulated 3D printed cavities with different thicknesses using CIELAB and CIEDE2000 color difference formulae
- Novel approaches in prediction of tensile strain capacity of engineered cementitious composites using interpretable approaches
- Effect of TiB2 particles on the compressive, hardness, and water absorption responses of Kulkual fiber-reinforced epoxy composites
- Analyzing the compressive strength, eco-strength, and cost–strength ratio of agro-waste-derived concrete using advanced machine learning methods
- Tensile behavior evaluation of two-stage concrete using an innovative model optimization approach
- Tailoring the mechanical and degradation properties of 3DP PLA/PCL scaffolds for biomedical applications
- Optimizing compressive strength prediction in glass powder-modified concrete: A comprehensive study on silicon dioxide and calcium oxide influence across varied sample dimensions and strength ranges
- Experimental study on solid particle erosion of protective aircraft coatings at different impact angles
- Compatibility between polyurea resin modifier and asphalt binder based on segregation and rheological parameters
- Fe-containing nominal wollastonite (CaSiO3)–Na2O glass-ceramic: Characterization and biocompatibility
- Relevance of pore network connectivity in tannin-derived carbons for rapid detection of BTEX traces in indoor air
- A life cycle and environmental impact analysis of sustainable concrete incorporating date palm ash and eggshell powder as supplementary cementitious materials
- Eco-friendly utilisation of agricultural waste: Assessing mixture performance and physical properties of asphalt modified with peanut husk ash using response surface methodology
- Benefits and limitations of N2 addition with Ar as shielding gas on microstructure change and their effect on hardness and corrosion resistance of duplex stainless steel weldments
- Effect of selective laser sintering processing parameters on the mechanical properties of peanut shell powder/polyether sulfone composite
- Impact and mechanism of improving the UV aging resistance performance of modified asphalt binder
- AI-based prediction for the strength, cost, and sustainability of eggshell and date palm ash-blended concrete
- Investigating the sulfonated ZnO–PVA membrane for improved MFC performance
- Strontium coupling with sulphur in mouse bone apatites
- Transforming waste into value: Advancing sustainable construction materials with treated plastic waste and foundry sand in lightweight foamed concrete for a greener future
- Evaluating the use of recycled sawdust in porous foam mortar for improved performance
- Improvement and predictive modeling of the mechanical performance of waste fire clay blended concrete
- Polyvinyl alcohol/alginate/gelatin hydrogel-based CaSiO3 designed for accelerating wound healing
- Research on assembly stress and deformation of thin-walled composite material power cabin fairings
- Effect of volcanic pumice powder on the properties of fiber-reinforced cement mortars in aggressive environments
- Analyzing the compressive performance of lightweight foamcrete and parameter interdependencies using machine intelligence strategies
- Selected materials techniques for evaluation of attributes of sourdough bread with Kombucha SCOBY
- Establishing strength prediction models for low-carbon rubberized cementitious mortar using advanced AI tools
- Investigating the strength performance of 3D printed fiber-reinforced concrete using applicable predictive models
- An eco-friendly synthesis of ZnO nanoparticles with jamun seed extract and their multi-applications
- The application of convolutional neural networks, LF-NMR, and texture for microparticle analysis in assessing the quality of fruit powders: Case study – blackcurrant powders
- Study of feasibility of using copper mining tailings in mortar production
- Shear and flexural performance of reinforced concrete beams with recycled concrete aggregates
- Advancing GGBS geopolymer concrete with nano-alumina: A study on strength and durability in aggressive environments
- Leveraging waste-based additives and machine learning for sustainable mortar development in construction
- Study on the modification effects and mechanisms of organic–inorganic composite anti-aging agents on asphalt across multiple scales
- Morphological and microstructural analysis of sustainable concrete with crumb rubber and SCMs
- Structural, physical, and luminescence properties of sodium–aluminum–zinc borophosphate glass embedded with Nd3+ ions for optical applications
- Eco-friendly waste plastic-based mortar incorporating industrial waste powders: Interpretable models for flexural strength
- Bioactive potential of marine Aspergillus niger AMG31: Metabolite profiling and green synthesis of copper/zinc oxide nanocomposites – An insight into biomedical applications
- Preparation of geopolymer cementitious materials by combining industrial waste and municipal dewatering sludge: Stabilization, microscopic analysis and water seepage
- Seismic behavior and shear capacity calculation of a new type of self-centering steel-concrete composite joint
- Sustainable utilization of aluminum waste in geopolymer concrete: Influence of alkaline activation on microstructure and mechanical properties
- Optimization of oil palm boiler ash waste and zinc oxide as antibacterial fabric coating
- Tailoring ZX30 alloy’s microstructural evolution, electrochemical and mechanical behavior via ECAP processing parameters
- Comparative study on the effect of natural and synthetic fibers on the production of sustainable concrete
- Microemulsion synthesis of zinc-containing mesoporous bioactive silicate glass nanoparticles: In vitro bioactivity and drug release studies
- On the interaction of shear bands with nanoparticles in ZrCu-based metallic glass: In situ TEM investigation
- Developing low carbon molybdenum tailing self-consolidating concrete: Workability, shrinkage, strength, and pore structure
- Experimental and computational analyses of eco-friendly concrete using recycled crushed brick
- High-performance WC–Co coatings via HVOF: Mechanical properties of steel surfaces
- Mechanical properties and fatigue analysis of rubber concrete under uniaxial compression modified by a combination of mineral admixture
- Experimental study of flexural performance of solid wood beams strengthened with CFRP fibers
- Eco-friendly green synthesis of silver nanoparticles with Syzygium aromaticum extract: characterization and evaluation against Schistosoma haematobium
- Predictive modeling assessment of advanced concrete materials incorporating plastic waste as sand replacement
- Self-compacting mortar overlays using expanded polystyrene beads for thermal performance and energy efficiency in buildings
- Enhancing frost resistance of alkali-activated slag concrete using surfactants: sodium dodecyl sulfate, sodium abietate, and triterpenoid saponins
- Equation-driven strength prediction of GGBS concrete: a symbolic machine learning approach for sustainable development
- Empowering 3D printed concrete: discovering the impact of steel fiber reinforcement on mechanical performance
- Advanced hybrid machine learning models for estimating chloride penetration resistance of concrete structures for durability assessment: optimization and hyperparameter tuning
- Influence of diamine structure on the properties of colorless and transparent polyimides
- Post-heating strength prediction in concrete with Wadi Gyada Alkharj fine aggregate using thermal conductivity and ultrasonic pulse velocity
- Experimental and RSM-based optimization of sustainable concrete properties using glass powder and rubber fine aggregates as partial replacements
- Special Issue on Recent Advancement in Low-carbon Cement-based Materials - Part II
- Investigating the effect of locally available volcanic ash on mechanical and microstructure properties of concrete
- Flexural performance evaluation using computational tools for plastic-derived mortar modified with blends of industrial waste powders
- Foamed geopolymers as low carbon materials for fire-resistant and lightweight applications in construction: A review
- Autogenous shrinkage of cementitious composites incorporating red mud
- Mechanical, durability, and microstructure analysis of concrete made with metakaolin and copper slag for sustainable construction
- Special Issue on AI-Driven Advances for Nano-Enhanced Sustainable Construction Materials
- Advanced explainable models for strength evaluation of self-compacting concrete modified with supplementary glass and marble powders
- Analyzing the viability of agro-waste for sustainable concrete: Expression-based formulation and validation of predictive models for strength performance
- Special Issue on Advanced Materials for Energy Storage and Conversion
- Innovative optimization of seashell ash-based lightweight foamed concrete: Enhancing physicomechanical properties through ANN-GA hybrid approach
- Production of novel reinforcing rods of waste polyester, polypropylene, and cotton as alternatives to reinforcement steel rods