Investigating the strength performance of 3D printed fiber-reinforced concrete using applicable predictive models
-
Qianyang Lu
 ,
Song Mei
,
Song Mei

Abstract
The construction sector is quickly adopting 3D printing because of its many benefits, such as the capacity to build complex geometries, speed up timeframes, increase sustainability, and improve safety. Making changes to the mixture composition of 3D-printed fiber-reinforced concrete (3DP-FRC) involves a lot of trial and error due to the many interdependent variables. In order to estimate the compressive strength (CS) and flexural strength (FS) of 3DP-FRC, the present study used gene expression programming (GEP) and Multi expression programming (MEP) for machine learning (ML). We ran a sensitivity analysis to go further into how important the input parameters were. Among the models, MEP had better predictive performance for FS and CS than GEP did, with R 2 values of 0.958 and 0.978, respectively. In contrast, the GEP model found lower R 2 values of 0.945 for CS and 0.928 for FS. Sensitivity analysis exposed that for CS, water-binder ratio, silica fume, and water content were the most influential parameters, while load distribution, sand content, and fly ash had the highest impact for FS. The developed ML models provide a reliable means of estimating the strength characteristics of 3DP-FRC for sustainable building design based on various input parameter values, offering significant time and cost savings compared to traditional laboratory testing.
1 Introduction
Problems such as a lack of qualified workers, diminishing resources, and worries about worker safety have greatly slowed the expansion of the construction industry, which is already struggling to keep up with the demands of fast urbanization and industrialization [1,2,3,4]. There has been ongoing research on developing advanced and sustainable building materials [5,6,7,8,9]. An increasingly digitally driven manufacturing strategy has been gaining traction in the construction sector as a means to both improve efficiency and enable the creation of more intricate building shapes. The advent of 3DP technology has given researchers and industry experts in the building trade a fresh viewpoint [10,11]. This innovative technology creates three-dimensional structures by layering printed sheets in succession, much like how a traditional 2D printer operates but in multiple dimensions. Prior research indicates that 3D printing in construction can significantly cut down on waste materials by 30–60%, shorten construction timelines by 50–70%, and lower labor costs by as much as 50–80% [12,13]. Furthermore, 3D printing eliminates the need for costly and time-consuming formworks when building large-scale buildings.
Traditional concrete has its limitations due to its inherent fragility, but 3D concrete printing has great promise for the building industry [14]. To meet the requirements of load-bearing capacity, ductility, and toughness in concrete construction, reinforcement must be incorporated [15,16,17,18]. The mechanical properties of 3D-printed concrete (3DPC) are generally weaker compared to conventionally cast concrete. This disparity arises from issues such as inconsistent mix uniformity, the absence of conventional reinforcement, and inadequate compaction during the printing process, all of which contribute to reduced strength and durability [19,20]. So, 3DPC-built structural components will not be as strong as those made with more traditional methods, such as casting using formwork and employing traditional reinforcing materials. Consequently, meeting structural material performance standards necessitates reinforcing 3DPC and enhancing material properties. Nonetheless, the method of layer-by-layer assembly in 3D concrete printing makes it difficult to incorporate reinforcement. There is an inherent benefit to 3DPC in automated construction, but current reinforcing approaches [21,22,23] may make the process too complicated and reduce its usefulness [24,25]. In order to achieve the essential properties of 3DPC, printability and extrudability, in fiber-reinforced concrete (FRC), scientists used several types of short-cut fibers for reinforcing ordinary concrete elements. The most common types of fibers used in 3D printing include glass, steel, charcoal, basalt, polyvinyl alcohol, polypropylene, and polyethylene.
Compressive strength (CS) testing shows that the 3DPC is anisotropic. Furthermore, printed specimens typically have a lower CS than their normally mold-cast counterparts since formwork and vibration are not present during printing. 3D-printed fiber-reinforced concrete (3DP-FRC) has a CS that changes depending on the loading direction (LD), with printing resulting in a stronger material. The pressure of the extrusion process causes the material to be compressed more along its longitudinal axis, leading to this result [26,27]. Liu et al. [28] investigated the CS of 3DPC subjected to several loading orientations and discovered that, throughout all testing ages, traditionally cast concrete displayed the greatest strength. To achieve optimal performance in printed concrete mixes, specimens should be loaded in the feed zone direction. Similarly, Zhou et al. [29] determined that the direction perpendicular to the print head produced the maximum CS after analyzing the impacts of LDs at 0, 45, and 90°. Reasons for this behavior include the improved interlayer bonding brought about by pressure-driven layer extrusion and the complex interaction between loading orientation and steel fiber reinforcing [29]. The CS of 3DP-FRC is greatly affected by both internal and external variables, including mix composition, fiber type, content, shape, LD, and curing duration. Microstructure, load-bearing behavior, and performance are all affected by these factors when taken as a whole [30]. More research is required to fill in the gaps in our present knowledge of these elements. It is also very labor- and material-intensive to do experimental studies to determine the sophisticated associations between these factors and the 3DP-FRC strength characteristics. Machine learning (ML) and other data-driven approaches could be useful for evaluating the strength qualities of 3DP-FRC by considering a large number of variables and the intricate interconnections between them.
Recent years have witnessed a surge in the use of modeling methods for the prediction of cementitious material attributes [31,32,33,34,35,36,37]. A stacking model was utilized by Shafighfard et al. [38] in order to forecast the CS of steel-fiber-containing concrete after high-temperature treatment. With a correlation coefficient of 0.96, the multilayer model correctly predicted the C-S. For the purpose of determining the CS of FRC, Nguyen et al. [39] utilized a number of neural network computation methods. In terms of accuracy, the neural network models made exceptionally accurate predictions, as evidenced by their correlation coefficient of 0.974. In an independent investigation, Kulasooriya et al. used a decision tree (DT) to forecast basalt fiber-reinforced concrete's properties [40]. Chen et al. used gene expression programming (GEP) to forecast the qualities of concrete built from recycled foundry sand [41]. In terms of output prediction, the GEP model performed better. In addition, Shah et al. used the GEP random forest (RF) and support vector machine (SVM) model to assess the C-S of concrete that included sugarcane bagasse ash [42]. Among the three models, the RF model demonstrated the highest precision in predicting outcome. Amin et al. investigated concrete containing rice husk ash for C-S using DT, boosting regressor, and bagging regressor [43]. The bagging regressor outperformed DT and boosting in terms of accuracy. In their study, Zheng et al. [44] found that gradient boosting was more accurate than the RF model for forecasting the F-S of steel fiber concrete. When evaluating the characteristics of silica fume-based concrete, Nafees et al. discovered that the DT model achieved an accuracy 11% higher and the SVR model 1.5% higher when compared to the ensembles of individual models [45]. Cakiroglu et al. evaluated basalt fiber-reinforced concrete's tensile strength using the RF method in conjunction with three distinct boosting procedures [46]. The most accurate method was extreme gradient boosting, based on its R 2 value. Additionally, prior work by Cakiroglu et al. demonstrated that boosting approaches accurately predicted strength-related concrete parameters [47,48]. Using multiple ML models to assess the strength characteristics of 3DP-FRC is still relatively uncharted territory in the current literature, despite the abundance of research that has utilized ML to attributes the properties of other binding materials.
To predict the CS and FS of 3DP-FRC, a trustworthy computational framework can be built using ML algorithms that have been trained properly. To foretell the CS and FS of 3DP-FRC, this study uses publicly accessible research data to build regression models based on Multi expression programming (MEP) and GEP. Using data points extracted from the most recent publications, the dataset contains 598 C-S variables and 400 F-S variables. In order to validate the model, we looked at Taylor's diagrams and ran some statistical tests. A sensitivity study was performed to identify the effect of different parameters on our predictions. The development and deployment of advanced techniques and intelligent tools for evaluating material properties with minimal human intervention hold immense potential for transforming the construction industry. Such innovations can significantly enhance precision, reduce human error, and streamline quality control processes, thereby contributing to safer, more effective, and green construction practices.
2 Research design framework
2.1 Data compilation and cleaning
This study used MEP and GEP techniques to predict the C-S and F-S of 3DP-FRC. The dataset for CS was 598 data points, and for FS, it was 400 data points collected from an experimental inquiry [26,49,50,51,52,53,54,55]. In this study, 15 variables were considered to foresee CS and FS of concrete. These included ordinary Portland cement (OPC), SF, water content (Wa), fly ash (FA), sand (Sa), ground slag (GS), water-to-binder ratio (WBR), superplasticizers (SP), hydroxypropyl methylcellulose (HPMC), fiber volume fraction (Vf), fiber type (Ft), fiber length (Lf), fiber diameter (Df), length-to-diameter ratio (LDR), curing age (CA), and LD. A Python script was used to augment the dataset by generating synthetic data. The first step is to choose a database file using a Tkinter-based file dialog box. Pandas DataFrame is used to load the chosen file and find the current count of data points. Synthetic data are subsequently merged with the original DataFrame, resulting in the creation of a new dataset file. The script includes context-specific annotations to indicate enhancements made to the data. Additionally, the declarations specify important details such as the number of data points added, the total synthesized entries, and the location of the newly saved file [56]. The script is designed to handle situations where resampling is necessary or if the user does not specify a file. Proper data preparation helps streamline and organize the dataset more effectively. It serves as a critical step to mitigate issues commonly encountered with traditional methods of extracting insights from historical data. This process typically involves cleaning the dataset by removing irrelevant or redundant information, thereby enhancing the quality and reliability of the analysis. Methods based on error distribution and regression were used in the model analysis. Figure 1(a) and (b) present violin plots for the CS and FS datasets, respectively, showing the distribution of data across different categories. The plots highlight the spread and density of values, where wider sections indicate higher data concentration. The variations in shape and size among different categories suggest differences in the distributions between the two datasets, with some categories exhibiting a more compact spread while others show broader variations.

Violin plots demonstrating the frequency distribution; (a) CS dataset and (b) FS dataset.
Pearson’s correlation plot visually represents the linear relationships between different variables in a dataset. A value near 0 indicates no correlation, a value approaching 1 signifies a strong positive correlation, and a value close to −1 reflects a strong negative correlation. The strength and direction of these correlations are depicted using color-coded ellipses and numerical values. In Figure 2(a) (CS dataset), some variables exhibit strong correlations, highlighted by red or blue ellipses. The presence of red regions suggests positive correlations, while blue indicates negative relationships. The strongest positive relation is shown by SF with CS with a value of +0.95 and strongest negative relation with CS is shown by WBR with a value of −0.85. Similarly, in Figure 2(b) (FS dataset), notable correlations between certain parameters can be observed, with different strengths and directions. Comparing both figures, variations in correlation strength indicate differences in parameter relationships across the two datasets. The fact that R is close to or equal to zero, which suggests a weak link, does not always mean that the two variables are completely unrelated. This is an important point to keep in mind. There could be hidden and complicated correlations between input factors and output responses that the Pearson correlation coefficient alone cannot reveal. In order to obtain a more thorough and precise grasp of input-output interactions, it is advised to utilize additional interpretability approaches such as sensitivity analysis and SHapley Additive exPlanations (SHAP) analysis.

Pearson’s correlation matrices: (a) CS database and (b) FS database.
2.2 ML modeling
To get the C-S and F-S outputs, fifteen inputs were genuinely required. The best ML algorithms, namely, GEP and MEP, were used to create 3DP-FRC’s CS and FS forecasts. Predicting outputs from ML models and comparing them to the actual input data is a common way to evaluate their performance. In this study, 70% of the dataset was allocated for training and 30% for testing. The GEP model handled this split automatically, whereas the data for the MEP model was manually divided before training. Higher levels of the R 2 value show a significant alignment between forecasts and actual results, reflecting the model’s performance. On the other hand, a lower R 2 value indicates a larger degree of discordance, drawing attention to differences between the anticipated and actual results [57]. The reliability of the model is verified through comprehensive validation techniques, containing statistical evaluations and evaluations of errors. Figure 3 presents a scenario-based model representation, whereas Table 1 details the key hyperparameters governing the performance of the GEP and MEP models. The hyperparameters were carefully selected based on established practices in the literature and iterative tuning to ensure optimal performance [58,59]. Parameters such as mutation rates, function sets, population size, and the number of generations were calibrated to maintain a balance between exploration and convergence. These settings enabled both GEP and MEP to effectively capture complex nonlinear relationships in CS and FS prediction.

Comprehensive study approach overview.
Model Hyperparameter Settings.
| MEP | GEP | ||
|---|---|---|---|
| Hyper-parameters | Settings | Hyper-parameters | Settings |
| Data type | Real numbers | Stumbling mutation | 0.00141 |
| Problem type | Symbolic regression | Lower bound | −10 |
| Cross over type | Uniform | Inversion rate | 0.00546 |
| Number of runs | 15 | RIS transposition rate | 0.00546 |
| Mutation probability | 0.01 | Data type | Floating number |
| Number of treads | 2 | IS transposition rate | 0.00546 |
| Number of generations | 1,000 | Head size | 8 |
| Operators/variables | 0.5 | Linking function | Addition |
| Error | MSE | Constant per gene | 10 |
| Function set | +, −, ×, ÷, power, exponential, and square root | Upper bound | 10 |
| Number of sub-populations | 100 | Gene recombination rate | 0.00277 |
| Sub-population size | 300 | Genes | 8 |
| Replication number | 15 | Leaf mutation | 0.00546 |
| Cross over probability | 0.9 | One-point recombination rate | 0.00277 |
| Code length | 50 | Two-point recombination rate | 0.00277 |
| Gene transposition rate | 0.00277 | ||
| General | CS and FS | ||
| Function set | +, −, ×, ÷, exponential, power, and square root | ||
| Mutation rate | 0.00138 | ||
| Chromosomes | 150 | ||
| Random chromosomes | 0.0026 | ||
2.3 Model accuracy assessment
The performance of the MEP and GEP models was assessed through detailed statistical analysis carried out on the test dataset. A comprehensive assessment of their predictive accuracy was conducted by employing various key metrics, including root mean square error (RMSE), Nash–Sutcliffe Efficiency (NSE), mean absolute percentage error (MAPE), relative squared error (RSE), mean absolute error (MAE), Pearson’s correlation coefficient (R), and relative root mean square error (RRMSE). These indicators collectively provided a thorough measure of the models’ effectiveness in forecasting [60,61,62,63,64]. The formulas for several statistical performance measurements are presented in Equations 2 to 8.
With values between −1 and +1, R measures the magnitude and direction of the linear relationship between the expected and observed values.
MAE is a simple way to measure the prediction error since it takes the average of the absolute differences between the actual and anticipated values.
RMSE, a more broad measure of inaccuracy than MAE, compares expected and actual values.
One effective way to compare model performance across multiple scales is with MAPE, which expresses the average absolute error as a proportion of actual values.
RSE represents the ratio between the residual sum of squares and the total sum of squares, indicating how well the model predicts compared to a simple mean-based prediction.
Greater model accuracy and efficiency are indicated by values near 1, as measured by NSE, which assesses the degree to which the projected values match the observed data.
RRMSE is the RMSE normalized by the mean of observed values, providing a scale-independent measure of model accuracy.
In this context, n signifies the total number of observations or data entries. The variables a
i
and p
i
represent the observed (measured) and predicted (estimated) values for each individual data point. Meanwhile,
The forecasting ability of a model can be visually evaluated using the Taylor diagram. It provides a unified perspective on critical performance metrics like correlation, standard deviation, and root mean square error; it is one of the statistical validation procedures that are accessible. To show how accurately the model represents real-world behavior, the figure compares the model’s output with a reference point, often the actual observed data. The accuracy and dependability of data-driven models can be effectively evaluated using this method [71,72]. The diagram illustrates standard deviations, correlation coefficients, and RMSE, with these metrics represented along the horizontal and vertical axes. Radial lines extending toward the reference or observed value point are also shown, offering a visual comparison of model performance relative to the actual data. The optimal placement of a model can be assessed using these three parameters. In terms of reliability, the model that achieves the highest level of forecast accuracy is the most reliable [71].
3 Computational results and interpretation
3.1 CS prediction models
3.1.1 GEP model
Expression trees (ETs) were utilized by the models to combine mathematical correlations generated from genome frequency and head size in order to compute the CS. The sub-ETs constructed utilizing the GEP method are demonstrated in Figure 4(a)–(h). A large portion of the sub-ETs in the C-S models of the 3DP-FRC relied heavily on basic arithmetic operations like subtracting, adding, multiplying, dividing, and finding square roots to build their sub-ETs. An algebraic formula is produced by GEP encoding these sub-ETs. By plugging in certain values, these formulas can predict the future C-S of 3DP-FRC, as demonstrated in Equation 9. In an ideal world, the resultant model might outperform a perfect one, provided there is sufficient data. The presence of a solid black line in Figure 5(a) indicates that the data are properly matched. A 10 or 20% variance will be shown by the dashed red line and the dotted blue line, respectively. This graph illustrates the extent of concordance between the expected and observed CS values. The observed values of CS are closely aligned with those anticipated by the GEP model. By substituting numerical values of input variables into the derived equations, the future CS of 3DP-FRC can be predicted, as demonstrated in Eq. (8). By obtaining a R 2 of 0.9447 and, respectively, predicting values within the 10 and 20% criteria 74 and 86% of the time, the GEP approach demonstrated a considerable improvement in accuracy when it came to estimating the CS of 3DP-FRC. It is possible to see a discrepancy between the predicted and GEP model results in Figure 5(b), which displays the test data against the absolute error. The findings indicated that the GEP model closely replicated the experimental results, with absolute prediction errors ranging from as low as 0.042 MPa to a maximum of 24.812 MPa. The distribution of errors is shown in Figure 6, which proves it. A total of 107 readings are within the range of 5.0–15.0 MPa, with 69 readings below and 23 values over 5.0 MPa. It is highly unusual for maximal error frequencies to occur.


CS-GEP ET schematic. (a) Sub-ET 1, (b) Sub-ET 2, (c) Sub-ET 3, (d) Sub-ET 4, (e) Sub-ET 5, (f) Sub-ET 6, (g) Sub-ET 7, (h) Sub-ET 8.

Estimated performance of 3DP-FRC using GEP: (a) Comparison of predicted and actual C-S values; (b) Spread of prediction errors across data.

GEP error distribution for CS.
3.1.2 MEP model
To determine the CS of 3DP-FRC, an empirical equation was derived from the MEP results, taking into account the effects of 15 independent variables. The final mathematical expression obtained from the modeling process is shown in Eq. (9).
The robustness for simplifying and a proficient MEP model is shown in Figure 7(a), which also boasts an extraordinary R 2 value of 0.978. The CS model developed using MEP demonstrates greater accuracy than the GEP-based CS model, due to the fact that its R 2 value is higher. In Figure 7(a), the solid black line indicates an ideal correspondence with the data points, serving as a benchmark for perfect prediction. The dashed red and dotted blue lines mark the boundaries for 10 and 20% deviations, respectively. The CS predictions produced by the MEP model demonstrate a strong agreement with the actual observed values, remaining well within these deviation limits. Impressively, the MEP model predicted CS with 89% of results falling within a 10% error margin and 96% of results falling within a 20% error margin, highlighting its exceptional accuracy.

Estimated performance of 3DP-FRC using MEP: (a) Comparison of predicted and actual C-S values; (b) Spread of prediction errors across data.
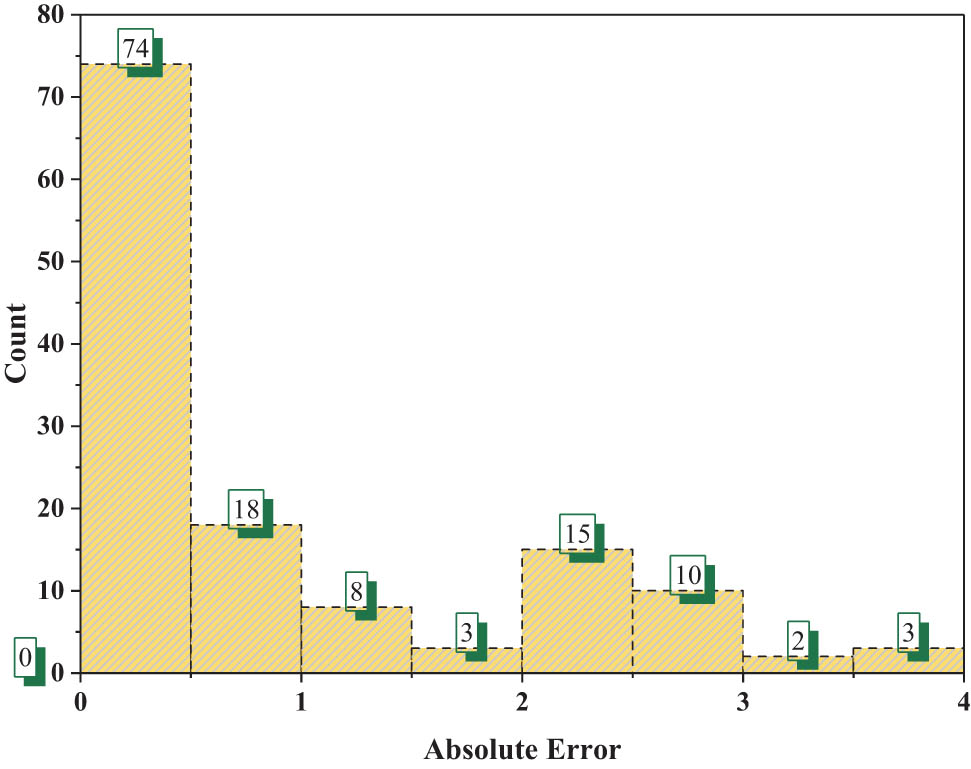
Figure 7(b) shows an analysis of the absolute differences between the predicted values and the measured values according to the MEP model. The fallouts showed that the actual data follows the GEP equation’s predictions with a precision of 0.042 MPa to 24.812 MPa of absolute error. By and large, the average error values stay below 5.66 MPa; specifically, 118 of them fall below 5.0 MPa, 79 fall in the range of 5.0–15.0 MPa, and just 02 exceed 15.0 MPa. The distribution plot in Figure 8 illustrates that, when outlier values are considered, the MEP model produces less volatile results than the GEP model. As strong predictors, the MEP and GEP models both appear promising. On the other hand, using the MEP equation reduces the error standard deviations and the correlation coefficient. The MEP equation has seen extensive use due to its adaptability and ease of use.

MEP error distribution for CS.
3.2 FS models
3.2.1 GEP model
The outcomes of ETs created utilizing the GEP technique are shown in Figure 9(a)–(h). The models used ETs to determine the FS, which is based on mathematical relationships that arise from the brain size and frequency of genomes. These sub-ETs can be expressed algebraically by GEP encoding. Eq. (10) states that these formulas can use the input data to estimate the future FS of 3DP-FRC. Under ideal circumstances, the final model could perform better than a perfect one, provided there are enough data. A flawless correspondence between the data and the model’s predictions is depicted by the solid black line in Figure 10(a). If there is a 10 or 20% variation, the dashed red and dotted blue lines will show it. The graphic illustrates the degree of agreement between the experimental F-S values and the expected ones. There was a high degree of agreement between the experimental and GEP-predicted F-S values. With an R 2 value of 0.928 and predictions falling within the 10 and 20% deviation limits 72 and 85% of the time, respectively, indicating significantly improved accuracy, the GEP method proved highly effective in estimating the FS of 3DP-FRC. Figure 10(b) shows the experimental values compared to absolute errors, which may show that the GEP model's predictions don't match up with the data. The experimental data square with the predictions given by the GEP equation, with an average absolute error of 1.442 MPa and a range of 0.018 MPa to 3.810 MPa. Figure 11 shows that the error values have a dome-shaped distribution. The error distribution reveals that 36 predictions have errors exceeding 2.0 MPa, while 49 values exhibit errors below 1.0 MPa. Additionally, 48 strength predictions fall within the intermediate error range of 1.0 to 2.0 MPa. A major indicator of the GEP approach's predictive power is the extremely low frequency of high error values in the F-S model.


FS GEP ET schematic. (a) Sub-ET 1, (b) Sub-ET 2, (c) Sub-ET 3, (d) Sub-ET 4, (e) Sub-ET 5, (f) Sub-ET 6, (g) Sub-ET 7, (h) Sub-ET 8.

Estimated performance of 3DP-FRC using GEP: (a) Comparison of predicted and actual F-S values; (b) Spread of prediction errors across data.

GEP error distribution for FS.
3.2.2 MEP model
Using the MEP outcomes and considering the effects of 15 independent variables, an empirical formula was formulated to estimate the FS of 3DP-FRC. The complete set of mathematical expressions resulting from this modeling is presented in Eq. (11).
With an outstanding R 2 value of 0.958, the well-trained MEP model demonstrates a strong resistance to oversimplification, as shown in Figure 12(a). Just like the C-S models, the F-S MEP model has a higher R 2 value and is more accurate than the GEP model. In Figure 12(a), the solid black line represents a perfect fit to the data, while the dashed red and dotted blue lines indicate a 10% and 20% deviance, respectively. The reported F-S values agreed well with the predictions made by the MEP model. The MEP method was remarkably accurate in calculating the F-S of 3DP-FRC, with predictions that were within the 10% and 20% margins of error, respectively, 87% and 94% of the time.

Estimated performance of 3DP-FRC using MEP: (a) Comparison of predicted and actual F-S values; (b) Spread of prediction errors across data.
The absolute discrepancies between the actual values and the projected ones from the MEP simulations are examined in Figure 12(b). According to the findings, the average error of the MEP model is 0.889 MPa, and the individual errors range from 0.002 to 3.677 MPa. Moreover, most errors remain below 3.677 MPa, with 92 values under 1.0 MPa, 11 between 1.0 and 2.0 MPa, and 30 exceeding 2.0 MPa. Notably, when considering outliers, the MEP model demonstrates less variability in results compared to the GEP model. It is encouraging to see predictive models developed using MEP and GEP. You can lower the correlation and error standard deviations with the help of the MEP equation. The MEP equation is often used due to its flexibility and its brevity. because of how short and flexible it is. The MEP model exhibits a greater correlation coefficient and a lower error rate compared to the GEP model, indicating its superiority (Figure 13).
GEP error distribution for FS.
3.3 Model accuracy assessment
From equations (2) to (8), the model's predictive ability is summarized in Table 2, which includes metrics like RMSE, RRMSE, MAE, RSE, NSE, R, and other indications. Stronger model accuracy is shown by lower error indicators and increased computing efficiency. For CS predictions, MEP demonstrates a lower MAE of 4.831 MPa compared to 8.190 MPa for GEP, indicating that MEP yields predictions closer to actual values. Similarly, for FS, the MAE for MEP (0.889 MPa) is significantly lower than GEP’s (1.442 MPa), reinforcing its higher accuracy. More evidence of this pattern can be found in the MAPE data; MEP shows reduced errors (18.900% for CS and 35.200% for FS) when compared to GEP (24.120 and 38.400%, respectively). In comparison to GEP, which penalizes greater errors more severely, MEP has a lower RMSE (6.110 MPa for CS and 1.364 MPa for FS). As an indication of its higher accuracy, MEP has a lower RRMSE and RSE, with the former dropping from 0.326 (GEP) to 0.284 (MEP) for CS and the latter from 0.186 (GEP) to 0.142 (MEP). In comparison to GEP’s 0.972 and 0.963, MEP’s R-values of 0.989 for CS and 0.979 for FS are stronger, indicating a better match between the two sets of data. Also, MEP is more resilient in predictive modeling than GEP, as evidenced by its greater NSE (0.978 for CS and 0.951 for FS) compared to GEP’s (0.943 and 0.925, respectively). Statistical analysis comparing GEP and MEP for CS and FS prediction reveals that MEP fared better on all important criteria. Figure 14(a) and (b) shows a Taylor diagram, which shows that all prediction models are widely associated with each other. The MEP models are quite similar to each other when it comes to predicting the CS and FS of 3DP-FRC, but the GEP models are more dissimilar. The MEP model has the highest R 2 value, the fewest outliers, and is the most efficient ML technique for CS and FS prediction of 3DP-FRC, which is in line with previous studies. Statistical evaluations of correlation efficiency and error metrics show that MEP outperforms other ML methods when it comes to CS and FS prediction. Its superiority over GEP is supported by its efficiency scores, greater correlation coefficients, and consistently lower error values, making it an ideal method for accurate strength estimation in substances modeling.
Results of the statistical analysis
| Property | CS (MPa) | FS (MPa) | ||
|---|---|---|---|---|
| GEP | MEP | GEP | MEP | |
| MAE | 8.190 | 4.831 | 1.442 | 0.889 |
| MAPE | 24.120 | 18.900 | 38.400 | 35.200 |
| RMSE | 9.934 | 6.110 | 1.747 | 1.364 |
| R | 0.972 | 0.989 | 0.963 | 0.979 |
| RSE | 0.326 | 0.284 | 0.186 | 0.142 |
| NSE | 0.943 | 0.978 | 0.925 | 0.951 |
| RRMSE | 0.692 | 0.612 | 0.532 | 0.412 |

Taylor diagram; (a) CS models and (b) FS models.
3.4 Sensitivity assessment of variables
The impact of input parameters on the C-S and F-S prediction of 3DP-FRC is investigated in this work. Predicted output strongly correlated with input variables [73]. Figure 15(a) and (b) provides a glimpse into the future of building materials and concrete by showing how each variable affects the CS and FS of 3DP-FRC. The sensitivity analysis reveals that different variables exhibit varying levels of influence on CS and FS. For CS, WBR at 35%, SF at 28%, and Wa at 22% are the most critical factors, indicating that hydration control and pozzolanic reactions significantly impact strength development. In contrast, LD at 28%, Sa at 24%, and FA at 16% dominate FS, highlighting the importance of particle packing and stress distribution in flexural behavior. Additionally, Vf plays a more substantial role in enhancing FS (7.5%) than CS (2%), emphasizing its crack-bridging effect in flexural resistance. While SP, Lf, and HPMC show minimal impact on both properties, their role in workability and binder dispersion remains relevant. Overall, reducing WBR and incorporating SF enhances CS, whereas optimizing LD, Sa, and Vf improves FS, offering valuable insights for mix design optimization in high-performance concrete applications. The input data points and number of model parameters had a significant impact on the outcomes. It is worth noting that the study’s findings were affected differently by the ML method depending on certain input factors, such as the volumes of concrete mix. The model’s input parameters were weighted according to the values determined by Eqs. (12) and (13).
where

Sensitivity analysis radar plot: (a) CS and (b) FS.
4 Discussion
The GEP and MEP models' main strength is in their ability to produce precise and reliable predictions using only fifteen input parameters. Because unit measurements and testing methodologies are continuously utilized, the models produce reliable CS and FS predictions. The mathematical equations of the model can tell you how each input parameter influences the mix design. Incorporating additional inputs beyond the 15 may jeopardize the accuracy of the projected models in the composite analysis. If the training data significantly differs from the intended domain, ML models may fail to deliver accurate predictions, especially if input parameter units are inconsistent or altered, which can render the models ineffective. Although these models are highly useful in the construction industry for forecasting ensuring quality control, assessing risks, enabling predictive maintenance, material strength, and enhancing energy efficiency, they depend significantly on human intervention. This reliance on manual input can lead to errors that may impact the accuracy and reliability of the results. Developing hybrid modeling approaches, applying Explainable AI methods, incorporating sustainability factors, establishing extensive industry-specific datasets, and ensuring seamless integration of Internet of Things devices should be the priorities of future studies aiming to address these challenges. The construction industry may greatly benefit from these enhancements, which would lead to more efficient processes, greater transparency, easier interpretation, and better decision-making. Delays in projects, increased safety, and the promotion of greener practices might all result from this. This study’s findings may promote the use of greener construction practices by increasing the use of concrete made with supplemental cementitious materials in the industry.
The study used two datasets, one with 598 CS samples and the other with 400 FS samples, and 15 important input factors for each dataset to create prediction models. Research in the future should focus on increasing the dataset’s size by adding more experimental data; this will make the models more accurate and resilient and make the predictions more applicable to a wider range of situations. Future research could look into hybrid ML methods to enhance predictive capabilities. For example, combining Genetic Algorithm with Particle Swarm Optimization or RF with Artificial Neural Networks. This study focused on GEP and MEP. RF and XGB are two examples of ensemble learning methods that show promise as individual approaches to improvement. ML applications in this domain could be significantly enhanced by using these hybrid methodologies. The present study did not make use of interpretability tools like SHAP, Local Interpretable Model-agnostic Explanations, and Partial Dependence Plots. However, these tools provide great potential for future research to improve the explainability and transparency of ML predictions. Additionally, microstructural features, fatigue performance, and long-term durability are under-researched in ML studies of concrete, while mechanical qualities are the primary focus. Upcoming study must utilize ML approaches to address these under-researched characteristics in order to gain a more comprehensive understanding of concrete behavior.
5 Conclusion
This study presented a comprehensive assessment and optimization of 3DP-FRC by employing GEP and multi expression programming (MEP) ML techniques. A total of 598 data points for CS and 400 data points for FS were utilized to train, test, and validate the predictive capabilities of the proposed models. The study’s key findings are as follows:
With R 2 values of 0.944 for CS of 3DP-FRC and 0.928 for FS, respectively, the GEP model showed great predictive potential. R 2 values of 0.978 for CS and 0.958 for FS indicate that the MEP method is more accurate and dependable when it comes to strength approximation.
The MEP model outperforms the GEP model in terms of predicted accuracy, with an average error reduction of 8.189 MPa to 4.831 MPa for C-S and 1.442 MPa to 0.889 MPa for F-S, according to the comparative error study. As a result of this substantial improvement in accuracy, the MEP method is now the preferred predictive modeling strategy in concrete research for calculating strength parameters.
With better efficiency scores, larger correlation coefficients, and lower error values, MEP outperforms GEP in C-S and F-S prediction, according to the statistics. Reduced MAE, RMSE, RSE, and RRMSE, together with increased NSE and R values, demonstrate MEP's superior accuracy and reliability. For accurate strength prediction in material modeling, MEP is the dominant machine learning method.
The sensitivity analysis highlights that reducing WBR and incorporating SF significantly enhance CS, while optimizing LD, Sa, and Vf improves FS, emphasizing the role of hydration control, particle packing, and fiber reinforcement. These findings provide valuable insights for optimizing mix design to achieve superior mechanical performance in 3D printed concrete applications.
GEP and MEP employ unique mathematical approaches that play a vital role in predicting key features across different datasets. These techniques offer an efficient means to evaluate, optimize, and justify the mix proportioning of concrete compositions. This work’s mathematical models speed up concrete mix evaluation and improvement, helping engineers and scientists advance faster.
Acknowledgments
The authors acknowledge the Ministry of Education Industry-University Cooperative Education Project: Construction of whole process digital cost collaborative innovation training base based on BIM technology, number: 231000641160801. The authors are thankful to Prof. Dr. Mohamed Ahmed Hafez, Associate Professor of Dam Engineering and to INTI-IU-Malaysia for the generous support through the research grant [INTI-FEQS-0106-2023].
-
Funding information: Ministry of Education Industry-University Cooperative Education Project: Construction of whole process digital cost collaborative innovation training base based on BIM technology, number: 231000641160801. INTI-IU-Malaysia research grant [INTI-FEQS-0106- 2023].
-
Author contributions: Q.L.: conceptualization, formal analysis, methodology, supervision, and writing – original draft. S.M.: visualization, validation, project administration, resources, writing, reviewing, and editing. A.H.A.: data acquisition, software, validation, resources, writing, reviewing, and editing. A.A.: software, formal analysis, visualization, methodology, writing, reviewing, and editing. M.M.E.: conceptualization, project administration, supervision, formal analysis, writing, reviewing, and editing. M.A.H.: resources, methodology, data acquisition, writing, reviewing, and editing. All authors have accepted responsibility for the entire content of this manuscript and approved its submission.
-
Conflict of interest: The authors state no conflict of interest.
-
Data availability statement: The dataset generated and/or analyzed during the current study are available from the corresponding author upon reasonable request.
References
[1] Han, B., L. Zhang, and J. Ou. Smart and multifunctional concrete toward sustainable infrastructures, Vol. 399, Springer, Cham, Switzerland, 2017.10.1007/978-981-10-4349-9Search in Google Scholar
[2] Sakin, M. and Y. C. Kiroglu. 3D printing of buildings: Construction of the sustainable houses of the future by BIM. Energy Procedia, Vol. 134, 2017, pp. 702–711.10.1016/j.egypro.2017.09.562Search in Google Scholar
[3] Flatt, R. J. and T. Wangler. On sustainability and digital fabrication with concrete. Cement and Concrete Research, Vol. 158, 2022, id. 106837.10.1016/j.cemconres.2022.106837Search in Google Scholar
[4] Zhang, W., X. Liu, Y. Huang, and M.-N. Tong. Reliability-based analysis of the flexural strength of concrete beams reinforced with hybrid BFRP and steel rebars. Archives of Civil and Mechanical Engineering, Vol. 22, 2022, id. 171.10.1007/s43452-022-00493-7Search in Google Scholar
[5] Yassin, A. M., M. A. Hafez, and M. Mohie Eldin. The flexural behavior of reinforced ultra-high performance engineering cementitious composite (UHP-ECC) beams fabricated with polyethylene fiber (numerical and analytical study). Buildings, Vol. 14, 2024, id. 3484.10.3390/buildings14113484Search in Google Scholar
[6] Yassin, A. M., M. M. Eldin, M. S. Omar, M. A. Hafez, and M. A. Elnaggar. Effect of nano-silica on the flexural behavior and mechanical properties of self-compacted high-performance concrete (SCHPC) produced by cement CEM II/A-P (experimental and numerical study). Case Studies in Construction Materials, Vol. 21, 2024, id. e03490.10.1016/j.cscm.2024.e03490Search in Google Scholar
[7] Yassin, A. M., M. Mohie Eldin, M. A. Hafez, and M. A. Elnaggar. The flexural behavior and mechanical properties of super high-performance concrete (SHPC) reinforced using the hybridization of micro polypropylene and macro steel fibers. Buildings, Vol. 14, 2024, id. 1887.10.3390/buildings14071887Search in Google Scholar
[8] Zhang, W., J. Lin, Y. Huang, B. Lin, and X. Liu. State of the art regarding interface bond behavior between FRP and concrete based on cohesive zone model. Structures, Vol. 74, 2025, id. 108528.10.1016/j.istruc.2025.108528Search in Google Scholar
[9] Ahmad, W., S. J. McCormack, and A. Byrne. Biocomposites for sustainable construction: A review of material properties, applications, research gaps, and contribution to circular economy. Journal of Building Engineering, Vol. 105, 2025, id. 112525.10.1016/j.jobe.2025.112525Search in Google Scholar
[10] Wu, P., J. Wang, and X. Wang. A critical review of the use of 3-D printing in the construction industry. Automation in Construction, Vol. 68, 2016, pp. 21–31.10.1016/j.autcon.2016.04.005Search in Google Scholar
[11] Hassan, A., T. Alomayri, M. F. Noaman, and C. Zhang. 3D printed concrete for sustainable construction: a review of mechanical properties and environmental impact. Archives of Computational Methods in Engineering, Vol. 32, No. 5, 2025, pp. 1–31.10.1007/s11831-024-10220-5Search in Google Scholar
[12] Zhang, J., J. Wang, S. Dong, X. Yu, and B. Han. A review of the current progress and application of 3D printed concrete. Composites Part A: Applied Science and Manufacturing, Vol. 125, 2019, id. 105533.10.1016/j.compositesa.2019.105533Search in Google Scholar
[13] Gao, D., Z. Li, C. Ding, and Z. Yu. Uniaxial tensile stress-strain constitutive relationship of 3D/4D/5D steel fiber-reinforced concrete. Construction and Building Materials, Vol. 470, 2025, id. 140539.10.1016/j.conbuildmat.2025.140539Search in Google Scholar
[14] Fahim, A. A., N. Admassu, G. Dailey, and M. Khanzadeh Moradllo. Application of cellulose nanocrystals in 3D printed alkali-activated cementitious composites. Journal of Building Engineering, Vol. 82, 2024, id. 108380.10.1016/j.jobe.2023.108380Search in Google Scholar
[15] Yu, K., L. Li, J. Yu, J. Xiao, J. Ye, and Y. Wang. Feasibility of using ultra-high ductility cementitious composites for concrete structures without steel rebar. Engineering Structures, Vol. 170, 2018, pp. 11–20.10.1016/j.engstruct.2018.05.037Search in Google Scholar
[16] He, Z. H., H. N. Zhu, M. Y. Zhang, J. Y. Shi, S. G. Du, and B. Liu. Autogenous shrinkage and nano-mechanical properties of UHPC containing waste brick powder derived from construction and demolition waste. Construction and Building Materials, Vol. 306, 2021, id. 124869.10.1016/j.conbuildmat.2021.124869Search in Google Scholar
[17] Vinet, L. and A. Zhedanov. A ‘missing’ family of classical orthogonal polynomials. Journal of Physics A: Mathematical and Theoretical, Vol. 44, 2011, id. 085201.10.1088/1751-8113/44/8/085201Search in Google Scholar
[18] Wang, Y., Z. Niu, H. Han, J. Wang, and D. Lan. Observation of structural, mechanical, thermal and microwave dielectric properties of carbon black reinforced PA6/HDPE nanocomposites. Journal of Materials Science: Materials in Electronics, Vol. 34, 2023, id. 1948.10.1007/s10854-023-11360-3Search in Google Scholar
[19] Singh, A., Q. Liu, J. Xiao, and Q. Lyu. Mechanical and macrostructural properties of 3D printed concrete dosed with steel fibers under different loading direction. Construction and Building Materials, Vol. 323, 2022, id. 126616.10.1016/j.conbuildmat.2022.126616Search in Google Scholar
[20] Xiao, J., Z. Chen, T. Ding, and S. Zou. Bending behaviour of steel cable reinforced 3D printed concrete in the direction perpendicular to the interfaces. Cement and Concrete Composites, Vol. 125, 2022, id. 104313.10.1016/j.cemconcomp.2021.104313Search in Google Scholar
[21] Mechtcherine, V., J. Grafe, V. N. Nerella, E. Spaniol, M. Hertel, and U. Füssel. 3D-printed steel reinforcement for digital concrete construction – Manufacture, mechanical properties and bond behaviour. Construction and Building Materials, Vol. 179, 2018, pp. 125–137.10.1016/j.conbuildmat.2018.05.202Search in Google Scholar
[22] Li, Z., L. Wang, and G. Ma. Mechanical improvement of continuous steel microcable reinforced geopolymer composites for 3D printing subjected to different loading conditions. Composites Part B: Engineering, Vol. 187, 2020, id. 107796.10.1016/j.compositesb.2020.107796Search in Google Scholar
[23] Marchment, T. and J. Sanjayan. Mesh reinforcing method for 3D concrete printing. Automation in Construction, Vol. 109, 2020, id. 102992.10.1016/j.autcon.2019.102992Search in Google Scholar
[24] Afroughsabet, V., L. Biolzi, and T. Ozbakkaloglu. High-performance fiber-reinforced concrete: a review. Journal of Materials Science, Vol. 51, 2016, pp. 6517–6551.10.1007/s10853-016-9917-4Search in Google Scholar
[25] Kreiger, E. L., M. A. Kreiger, and M. P. Case. Development of the construction processes for reinforced additively constructed concrete. Additive Manufacturing, Vol. 28, 2019, pp. 39–49.10.1016/j.addma.2019.02.015Search in Google Scholar
[26] Arunothayan, A. R., B. Nematollahi, R. Ranade, S. H. Bong, J. G. Sanjayan, and K. H. Khayat. Fiber orientation effects on ultra-high performance concrete formed by 3D printing. Cement and Concrete Research, Vol. 143, 2021, id. 106384.10.1016/j.cemconres.2021.106384Search in Google Scholar
[27] Rong, C., Y. Peng, Q. Shi, and P. Wang. Eccentric compression performance of concrete filled steel tube slotted columns: experiment and simulation analysis. Structures, Vol. 74, 2025, p. 108580.10.1016/j.istruc.2025.108580Search in Google Scholar
[28] Liu, C., R. Zhang, H. Liu, C. He, Y. Wang, Y. Wu, et al. Analysis of the mechanical performance and damage mechanism for 3D printed concrete based on pore structure. Construction and Building Materials, Vol. 314, 2022, id. 125572.10.1016/j.conbuildmat.2021.125572Search in Google Scholar
[29] Zhou, Y., D. Jiang, R. Sharma, Y. M. Xie, and A. Singh. Enhancement of 3D printed cementitious composite by short fibers: A review. Construction and Building Materials, Vol. 362, 2023, id. 129763.10.1016/j.conbuildmat.2022.129763Search in Google Scholar
[30] Uddin, M. N., J. Ye, B. Deng, L. Z. Li, and K. Yu. Interpretable machine learning for predicting the strength of 3D printed fiber-reinforced concrete (3DP-FRC). Journal of Building Engineering, Vol. 72, 2023, id. 106648.10.1016/j.jobe.2023.106648Search in Google Scholar
[31] Yassin, A. M., M. M. Eldin, M. S. Omar, M. A. Hafez, and M. A. Elnaggar. A new approach to calculate the shear strength of high-performance reinforced concrete beams fibered with micro polypropylene (experimental and analytical study. Engineering Structures, Vol. 314, 2024, id. 118347.10.1016/j.engstruct.2024.118347Search in Google Scholar
[32] Niu, Y., W. Wang, Y. Su, F. Jia, and X. Long. Plastic damage prediction of concrete under compression based on deep learning. Acta Mechanica, Vol. 235, 2024, pp. 255–266.10.1007/s00707-023-03743-8Search in Google Scholar
[33] Ahmad, W., V. S. S. C. S. Veeraghantla, and A. Byrne. Advancing sustainable concrete using biochar: Experimental and modelling study for mechanical strength evaluation. Sustainability, Vol. 17, 2025, id. 2516.10.3390/su17062516Search in Google Scholar
[34] Alyami, M., I. Ullah, A. H. AlAteah, A. Alsubeai, T. S. Alahmari, F. Farooq, et al. Machine learning models for predicting the compressive strength of cement-based mortar materials: Hyper tuning and optimization. Structures, Vol. 71, 2025, id. 107931.10.1016/j.istruc.2024.107931Search in Google Scholar
[35] Liu, X., A. H. AlAteah, A. Alsubeai, T. S. Alahmari, and S. A. Mostafa. Prediction of flexural strength of concrete with eggshell and glass powders: Advanced cutting-edge approach for sustainable materials. Reviews on Advanced Materials Science, Vol. 63, 2024, id. 20240055.10.1515/rams-2024-0055Search in Google Scholar
[36] Li, T., J. Yang, P. Jiang, A. H. AlAteah, A. Alsubeai, A. M. Alfares, et al. Predicting high-strength concrete’s compressive strength: a comparative study of artificial neural networks, adaptive neuro-fuzzy inference system, and response surface methodology. Materials, Vol. 17, 2024, id. 4533.10.3390/ma17184533Search in Google Scholar PubMed PubMed Central
[37] Yang, X., T. Wu, M. N. Amin, A. H. AlAteah, M. T. Qadir, S. A. Khan, et al. Experimenting the compressive performance of low-carbon alkali-activated materials using advanced modeling techniques. Reviews on Advanced Materials Science, Vol. 63, 2024, id. 20240068.10.1515/rams-2024-0068Search in Google Scholar
[38] Shafighfard, T., F. Bagherzadeh, R. A. Rizi, and D.-Y. Yoo. Data-driven compressive strength prediction of steel fiber reinforced concrete (SFRC) subjected to elevated temperatures using stacked machine learning algorithms. Journal of Materials Research and Technology, Vol. 21, 2022, pp. 3777–3794.10.1016/j.jmrt.2022.10.153Search in Google Scholar
[39] Nguyen, T. T., H. Pham Duy, T. Pham Thanh, and H. H. Vu. Compressive strength evaluation of fiber‐reinforced high‐strength self‐compacting concrete with artificial intelligence. Advances in Civil Engineering, Vol. 2020, 2020, id. 3012139.10.1155/2020/3012139Search in Google Scholar
[40] Kulasooriya, W., R. S. S. Ranasinghe, U. S. Perera, P. Thisovithan, I. U. Ekanayake, and D. P. P. Meddage. Modeling strength characteristics of basalt fiber reinforced concrete using multiple explainable machine learning with a graphical user interface. Scientific Reports, Vol. 13, 2023, id. 13138.10.1038/s41598-023-40513-xSearch in Google Scholar PubMed PubMed Central
[41] Chen, L., Z. Wang, A. A. Khan, M. Khan, M. F. Javed, A. Alaskar, et al. Development of predictive models for sustainable concrete via genetic programming-based algorithms. Journal of Materials Research and Technology, Vol. 24, 2023, pp. 6391–6410.10.1016/j.jmrt.2023.04.180Search in Google Scholar
[42] Shah, M. I., M. F. Javed, F. Aslam, and H. Alabduljabbar. Machine learning modeling integrating experimental analysis for predicting the properties of sugarcane bagasse ash concrete. Construction and Building Materials, Vol. 314, 2022, id. 125634.10.1016/j.conbuildmat.2021.125634Search in Google Scholar
[43] Amin, M. N., B. Iftikhar, K. Khan, M. F. Javed, A. M. AbuArab, and M. F. Rehman. Prediction model for rice husk ash concrete using AI approach: Boosting and bagging algorithms. Structures, Vol. 50, 2023, pp. 745–757.10.1016/j.istruc.2023.02.080Search in Google Scholar
[44] Zheng, D., R. Wu, M. Sufian, N. B. Kahla, M. Atig, A. F. Deifalla, et al. Flexural strength prediction of steel fiber-reinforced concrete using artificial intelligence. Materials, Vol. 15, 2022, id. 5194.10.3390/ma15155194Search in Google Scholar PubMed PubMed Central
[45] Nafees, A., M. N. Amin, K. Khan, K. Nazir, M. Ali, M. F. Javed, et al. Modeling of mechanical properties of silica fume-based green concrete using machine learning techniques. Polymers, Vol. 14, 2021, id. 30.10.3390/polym14010030Search in Google Scholar PubMed PubMed Central
[46] Cakiroglu, C., Y. Aydın, G. Bekdaş, and Z. W. Geem. Interpretable predictive modelling of basalt fiber reinforced concrete splitting tensile strength using ensemble machine learning methods and SHAP approach. Materials, Vol. 16, 2023, id. 4578.10.3390/ma16134578Search in Google Scholar PubMed PubMed Central
[47] Cakiroglu, C., M. Shahjalal, K. Islam, S. M. F. Mahmood, A. H. M. M. Billah, and M. L. Nehdi. Explainable ensemble learning data-driven modeling of mechanical properties of fiber-reinforced rubberized recycled aggregate concrete. Journal of Building Engineering, Vol. 76, 2023, id. 107279.10.1016/j.jobe.2023.107279Search in Google Scholar
[48] Cakiroglu, C., K. Islam, G. Bekdaş, U. Isikdag, and S. Mangalathu. Explainable machine learning models for predicting the axial compression capacity of concrete filled steel tubular columns. Construction and Building Materials, Vol. 356, 2022, id. 129227.10.1016/j.conbuildmat.2022.129227Search in Google Scholar
[49] Ma, G., Z. Li, L. Wang, F. Wang, and J. Sanjayan. Mechanical anisotropy of aligned fiber reinforced composite for extrusion-based 3D printing. Construction and Building Materials, Vol. 202, 2019, pp. 770–783.10.1016/j.conbuildmat.2019.01.008Search in Google Scholar
[50] Ding, T., J. Xiao, S. Zou, and X. Zhou. Anisotropic behavior in bending of 3D printed concrete reinforced with fibers. Composite Structures, Vol. 254, 2020, id. 112808.10.1016/j.compstruct.2020.112808Search in Google Scholar
[51] Van Der Putten, J., A. V. Rahul, G. De Schutter, and K. Van Tittelboom. Development of 3D printable cementitious composites with the incorporation of polypropylene fibers. Materials, Vol. 14, 2021, id. 4474.10.3390/ma14164474Search in Google Scholar PubMed PubMed Central
[52] Yu, J. and C. K. Y. Leung. Impact of 3D printing direction on mechanical performance of strain-hardening cementitious composite (SHCC), Springer, Cham, Switzerland, 2018, pp. 255–265.10.1007/978-3-319-99519-9_24Search in Google Scholar
[53] Ye, J., C. Cui, J. Yu, K. Yu, and J. Xiao. Fresh and anisotropic-mechanical properties of 3D printable ultra-high ductile concrete with crumb rubber. Composites Part B: Engineering, Vol. 211, 2021, id. 108639.10.1016/j.compositesb.2021.108639Search in Google Scholar
[54] Yu, K., W. McGee, T. Y. Ng, H. Zhu, and V. C. Li. 3D-printable engineered cementitious composites (3DP-ECC): Fresh and hardened properties. Cement and concrete research, Vol. 143, 2021, id. 106388.10.1016/j.cemconres.2021.106388Search in Google Scholar
[55] Pham, L., X. Lin, R. J. Gravina, and P. Tran. Influence of PVA and PP fibres at different volume fractions on mechanical properties of 3D printed concrete, Springer Nature Singapore Pte Ltd, Singapore, 2021, pp. 2013–2024.10.1007/978-981-15-8079-6_185Search in Google Scholar
[56] Tian, Q., Y. Lu, J. Zhou, S. Song, L. Yang, T. Cheng, et al. Compressive strength of waste-derived cementitious composites using machine learning. Reviews on Advanced Materials Science, Vol. 63, 2024, id. 20240008.10.1515/rams-2024-0008Search in Google Scholar
[57] Lee, B. C. and D. M. Brooks. Accurate and efficient regression modeling for microarchitectural performance and power prediction. ACM SIGOPS Operating Systems Review, Vol. 40, 2006, pp. 185–194.10.1145/1168917.1168881Search in Google Scholar
[58] Jin, C., Y. Qian, S. A. Khan, W. Ahmad, F. Althoey, B. S. Alotaibi, et al. Investigating the feasibility of genetic algorithms in predicting the properties of eco-friendly alkali-based concrete. Construction and Building Materials, Vol. 409, 2023, id. 134101.10.1016/j.conbuildmat.2023.134101Search in Google Scholar
[59] Wang, J., Q. Qu, S. A. Khan, B. S. Alotaibi, F. Althoey, Y. Gamil, et al. Experimenting the influence of corncob ash on the mechanical strength of slag-based geopolymer concrete. Reviews on Advanced Materials Science, Vol. 63, 2024, id. 20230187.10.1515/rams-2023-0187Search in Google Scholar
[60] Iqbal, M. F., Q. F. Liu, I. Azim, X. Zhu, J. Yang, M. F. Javed, et al. Prediction of mechanical properties of green concrete incorporating waste foundry sand based on gene expression programming. Journal of Hazardous Materials, Vol. 384, 2020, id. 121322.10.1016/j.jhazmat.2019.121322Search in Google Scholar PubMed
[61] Mohammadzadeh, S. D., S. F. Kazemi, A. Mosavi, E. Nasseralshariati, and J. H. M. Tah. Prediction of compression index of fine-grained soils using a gene expression programming model. Infrastructures, Vol. 4, 2019, id. 26.10.3390/infrastructures4020026Search in Google Scholar
[62] Shahin, M. A. Genetic programming for modelling of geotechnical engineering systems, Springer, Cham, Switzerland, 2015.10.1007/978-3-319-20883-1_2Search in Google Scholar
[63] Çanakcı, H., A. Baykasoğlu, and H. Güllü. Prediction of compressive and tensile strength of Gaziantep basalts via neural networks and gene expression programming. Neural Computing and Applications, Vol. 18, 2009, pp. 1031–1041.10.1007/s00521-008-0208-0Search in Google Scholar
[64] Alade, I. O., M. A. Abd Rahman, and T. A. Saleh. Predicting the specific heat capacity of alumina/ethylene glycol nanofluids using support vector regression model optimized with Bayesian algorithm. Solar Energy, Vol. 183, 2019, pp. 74–82.10.1016/j.solener.2019.02.060Search in Google Scholar
[65] Alade, I. O., A. Bagudu, T. A. Oyehan, M. A. Abd Rahman, T. A. Saleh, and S. O. Olatunji. Estimating the refractive index of oxygenated and deoxygenated hemoglobin using genetic algorithm–support vector regression model. Computer Methods and Programs in Biomedicine, Vol. 163, 2018, pp. 135–142.10.1016/j.cmpb.2018.05.029Search in Google Scholar PubMed
[66] Zhang, W., R. Zhang, C. Wu, A. T. C. Goh, S. Lacasse, Z. Liu, and H. Liu. State-of-the-art review of soft computing applications in underground excavations. Geoscience Frontiers, Vol. 11, 2020, pp. 1095–1106.10.1016/j.gsf.2019.12.003Search in Google Scholar
[67] Alavi, A. H., A. H. Gandomi, H. C. Nejad, A. Mollahasani, and A. Rashed. Design equations for prediction of pressuremeter soil deformation moduli utilizing expression programming systems. Neural Computing and Applications, Vol. 23, 2013, pp. 1771–1786.10.1007/s00521-012-1144-6Search in Google Scholar
[68] Kisi, O., J. Shiri, and M. Tombul. Modeling rainfall-runoff process using soft computing techniques. Computers & Geosciences, Vol. 51, 2013, pp. 108–117.10.1016/j.cageo.2012.07.001Search in Google Scholar
[69] Alade, I. O., M. A. Abd Rahman, and T. A. Saleh. Modeling and prediction of the specific heat capacity of Al2O3/water nanofluids using hybrid genetic algorithm/support vector regression model. Nano-Structures & Nano-Objects, Vol. 17, 2019, pp. 103–111.10.1016/j.nanoso.2018.12.001Search in Google Scholar
[70] Shahin, M. A. Use of evolutionary computing for modelling some complex problems in geotechnical engineering. Geomechanics and Geoengineering, Vol. 10, 2015, pp. 109–125.10.1080/17486025.2014.921333Search in Google Scholar
[71] Band, S. S., E. Heggy, S. M. Bateni, H. Karami, M. Rabiee, S. Samadianfard, et al. Groundwater level prediction in arid areas using wavelet analysis and Gaussian process regression. Engineering Applications of Computational Fluid Mechanics, Vol. 15, 2021, pp. 1147–1158.10.1080/19942060.2021.1944913Search in Google Scholar
[72] Taylor, K. E. Summarizing multiple aspects of model performance in a single diagram. Journal of Geophysical Research: Atmospheres, Vol. 106, 2001, pp. 7183–7192.10.1029/2000JD900719Search in Google Scholar
[73] Ahmad, A., K. A. Ostrowski, M. Maślak, F. Farooq, I. Mehmood, and A. Nafees. Comparative study of supervised machine learning algorithms for predicting the compressive strength of concrete at high temperature. Materials, Vol. 14, 2021, id. 4222.10.3390/ma14154222Search in Google Scholar PubMed PubMed Central
© 2025 the author(s), published by De Gruyter
This work is licensed under the Creative Commons Attribution 4.0 International License.
Articles in the same Issue
- Review Articles
- Utilization of steel slag in concrete: A review on durability and microstructure analysis
- Technical development of modified emulsion asphalt: A review on the preparation, performance, and applications
- Recent developments in ultrasonic welding of similar and dissimilar joints of carbon fiber reinforcement thermoplastics with and without interlayer: A state-of-the-art review
- Unveiling the crucial factors and coating mitigation of solid particle erosion in steam turbine blade failures: A review
- From magnesium oxide, magnesium oxide concrete to magnesium oxide concrete dams
- Properties and potential applications of polymer composites containing secondary fillers
- A scientometric review on the utilization of copper slag as a substitute constituent of ordinary Portland cement concrete
- Advancement of additive manufacturing technology in the development of personalized in vivo and in vitro prosthetic implants
- Recent advance of MOFs in Fenton-like reaction
- A review of defect formation, detection, and effect on mechanical properties of three-dimensional braided composites
- Non-conventional approaches to producing biochars for environmental and energy applications
- Review of the development and application of aluminum alloys in the nuclear industry
- Advances in the development and characterization of combustible cartridge cases and propellants: Preparation, performance, and future prospects
- Recent trends in rubberized and non-rubberized ultra-high performance geopolymer concrete for sustainable construction: A review
- Cement-based materials for radiative cooling: Potential, material and structural design, and future prospects
- A comprehensive review: The impact of recycling polypropylene fiber on lightweight concrete performance
- A comprehensive review of preheating temperature effects on reclaimed asphalt pavement in the hot center plant recycling
- Exploring the potential applications of semi-flexible pavement: A comprehensive review
- A critical review of alkali-activated metakaolin/blast furnace slag-based cementitious materials: Reaction evolution and mechanism
- Dispersibility of graphene-family materials and their impact on the properties of cement-based materials: Application challenges and prospects
- Research progress on rubidium and cesium separation and extraction
- A step towards sustainable concrete with the utilization of M-sand in concrete production: A review
- Studying the effect of nanofillers in civil applications: A review
- Studies on the anticorrosive effect of phytochemicals on mild steel, carbon steel, and stainless-steel surfaces in acid and alkali medium: A review
- Nanotechnology for calcium aluminate cement: thematic analysis
- Towards sustainable concrete pavements: a critical review on fly ash as a supplementary cementitious material
- Optimizing rice husk ash for ultra-high-performance concrete: a comprehensive review of mechanical properties, durability, and environmental benefits
- Research Articles
- Investigation of the corrosion performance of HVOF-sprayed WC-CoCr coatings applied on offshore hydraulic equipment
- A systematic review of metakaolin-based alkali-activated and geopolymer concrete: A step toward green concrete
- Evaluation of color matching of three single-shade composites employing simulated 3D printed cavities with different thicknesses using CIELAB and CIEDE2000 color difference formulae
- Novel approaches in prediction of tensile strain capacity of engineered cementitious composites using interpretable approaches
- Effect of TiB2 particles on the compressive, hardness, and water absorption responses of Kulkual fiber-reinforced epoxy composites
- Analyzing the compressive strength, eco-strength, and cost–strength ratio of agro-waste-derived concrete using advanced machine learning methods
- Tensile behavior evaluation of two-stage concrete using an innovative model optimization approach
- Tailoring the mechanical and degradation properties of 3DP PLA/PCL scaffolds for biomedical applications
- Optimizing compressive strength prediction in glass powder-modified concrete: A comprehensive study on silicon dioxide and calcium oxide influence across varied sample dimensions and strength ranges
- Experimental study on solid particle erosion of protective aircraft coatings at different impact angles
- Compatibility between polyurea resin modifier and asphalt binder based on segregation and rheological parameters
- Fe-containing nominal wollastonite (CaSiO3)–Na2O glass-ceramic: Characterization and biocompatibility
- Relevance of pore network connectivity in tannin-derived carbons for rapid detection of BTEX traces in indoor air
- A life cycle and environmental impact analysis of sustainable concrete incorporating date palm ash and eggshell powder as supplementary cementitious materials
- Eco-friendly utilisation of agricultural waste: Assessing mixture performance and physical properties of asphalt modified with peanut husk ash using response surface methodology
- Benefits and limitations of N2 addition with Ar as shielding gas on microstructure change and their effect on hardness and corrosion resistance of duplex stainless steel weldments
- Effect of selective laser sintering processing parameters on the mechanical properties of peanut shell powder/polyether sulfone composite
- Impact and mechanism of improving the UV aging resistance performance of modified asphalt binder
- AI-based prediction for the strength, cost, and sustainability of eggshell and date palm ash-blended concrete
- Investigating the sulfonated ZnO–PVA membrane for improved MFC performance
- Strontium coupling with sulphur in mouse bone apatites
- Transforming waste into value: Advancing sustainable construction materials with treated plastic waste and foundry sand in lightweight foamed concrete for a greener future
- Evaluating the use of recycled sawdust in porous foam mortar for improved performance
- Improvement and predictive modeling of the mechanical performance of waste fire clay blended concrete
- Polyvinyl alcohol/alginate/gelatin hydrogel-based CaSiO3 designed for accelerating wound healing
- Research on assembly stress and deformation of thin-walled composite material power cabin fairings
- Effect of volcanic pumice powder on the properties of fiber-reinforced cement mortars in aggressive environments
- Analyzing the compressive performance of lightweight foamcrete and parameter interdependencies using machine intelligence strategies
- Selected materials techniques for evaluation of attributes of sourdough bread with Kombucha SCOBY
- Establishing strength prediction models for low-carbon rubberized cementitious mortar using advanced AI tools
- Investigating the strength performance of 3D printed fiber-reinforced concrete using applicable predictive models
- An eco-friendly synthesis of ZnO nanoparticles with jamun seed extract and their multi-applications
- The application of convolutional neural networks, LF-NMR, and texture for microparticle analysis in assessing the quality of fruit powders: Case study – blackcurrant powders
- Study of feasibility of using copper mining tailings in mortar production
- Shear and flexural performance of reinforced concrete beams with recycled concrete aggregates
- Advancing GGBS geopolymer concrete with nano-alumina: A study on strength and durability in aggressive environments
- Leveraging waste-based additives and machine learning for sustainable mortar development in construction
- Study on the modification effects and mechanisms of organic–inorganic composite anti-aging agents on asphalt across multiple scales
- Morphological and microstructural analysis of sustainable concrete with crumb rubber and SCMs
- Structural, physical, and luminescence properties of sodium–aluminum–zinc borophosphate glass embedded with Nd3+ ions for optical applications
- Eco-friendly waste plastic-based mortar incorporating industrial waste powders: Interpretable models for flexural strength
- Bioactive potential of marine Aspergillus niger AMG31: Metabolite profiling and green synthesis of copper/zinc oxide nanocomposites – An insight into biomedical applications
- Preparation of geopolymer cementitious materials by combining industrial waste and municipal dewatering sludge: Stabilization, microscopic analysis and water seepage
- Seismic behavior and shear capacity calculation of a new type of self-centering steel-concrete composite joint
- Sustainable utilization of aluminum waste in geopolymer concrete: Influence of alkaline activation on microstructure and mechanical properties
- Optimization of oil palm boiler ash waste and zinc oxide as antibacterial fabric coating
- Tailoring ZX30 alloy’s microstructural evolution, electrochemical and mechanical behavior via ECAP processing parameters
- Comparative study on the effect of natural and synthetic fibers on the production of sustainable concrete
- Microemulsion synthesis of zinc-containing mesoporous bioactive silicate glass nanoparticles: In vitro bioactivity and drug release studies
- On the interaction of shear bands with nanoparticles in ZrCu-based metallic glass: In situ TEM investigation
- Developing low carbon molybdenum tailing self-consolidating concrete: Workability, shrinkage, strength, and pore structure
- Experimental and computational analyses of eco-friendly concrete using recycled crushed brick
- High-performance WC–Co coatings via HVOF: Mechanical properties of steel surfaces
- Mechanical properties and fatigue analysis of rubber concrete under uniaxial compression modified by a combination of mineral admixture
- Experimental study of flexural performance of solid wood beams strengthened with CFRP fibers
- Eco-friendly green synthesis of silver nanoparticles with Syzygium aromaticum extract: characterization and evaluation against Schistosoma haematobium
- Predictive modeling assessment of advanced concrete materials incorporating plastic waste as sand replacement
- Self-compacting mortar overlays using expanded polystyrene beads for thermal performance and energy efficiency in buildings
- Enhancing frost resistance of alkali-activated slag concrete using surfactants: sodium dodecyl sulfate, sodium abietate, and triterpenoid saponins
- Equation-driven strength prediction of GGBS concrete: a symbolic machine learning approach for sustainable development
- Empowering 3D printed concrete: discovering the impact of steel fiber reinforcement on mechanical performance
- Advanced hybrid machine learning models for estimating chloride penetration resistance of concrete structures for durability assessment: optimization and hyperparameter tuning
- Influence of diamine structure on the properties of colorless and transparent polyimides
- Post-heating strength prediction in concrete with Wadi Gyada Alkharj fine aggregate using thermal conductivity and ultrasonic pulse velocity
- Experimental and RSM-based optimization of sustainable concrete properties using glass powder and rubber fine aggregates as partial replacements
- Special Issue on Recent Advancement in Low-carbon Cement-based Materials - Part II
- Investigating the effect of locally available volcanic ash on mechanical and microstructure properties of concrete
- Flexural performance evaluation using computational tools for plastic-derived mortar modified with blends of industrial waste powders
- Foamed geopolymers as low carbon materials for fire-resistant and lightweight applications in construction: A review
- Autogenous shrinkage of cementitious composites incorporating red mud
- Mechanical, durability, and microstructure analysis of concrete made with metakaolin and copper slag for sustainable construction
- Special Issue on AI-Driven Advances for Nano-Enhanced Sustainable Construction Materials
- Advanced explainable models for strength evaluation of self-compacting concrete modified with supplementary glass and marble powders
- Analyzing the viability of agro-waste for sustainable concrete: Expression-based formulation and validation of predictive models for strength performance
- Special Issue on Advanced Materials for Energy Storage and Conversion
- Innovative optimization of seashell ash-based lightweight foamed concrete: Enhancing physicomechanical properties through ANN-GA hybrid approach
- Production of novel reinforcing rods of waste polyester, polypropylene, and cotton as alternatives to reinforcement steel rods