Novel approaches in prediction of tensile strain capacity of engineered cementitious composites using interpretable approaches
-
 und
und

Abstract
The performance and durability of conventional concrete (CC) are significantly influenced by its weak tensile strength and tensile strain capacity (TSC). Thus, the intrusion of fibers in the cementitious matrix forms ductile engineered cementitious composites (ECCs) that can cater to this weak area of CC. Moreover, ECCs have become a reasonable substitute for brittle plain concrete due to their increased flexibility, ductility, and greater TSC. Thus, its prediction of ECC concrete is crucial without the need for laborious experimental procedures. Thus, to achieve this, machine learning approaches (MLAs), namely light gradient boosting (LGB) approach, extreme gradient boosting (XGB) approach, artificial neural network (ANN), and k-nearest neighbor (KNN), were developed. The data gathered from the literature comprise input parameters in which the fiber content, fiber length, cement, fiber diameter, water-to-binder ratio, fly ash (FA), age, sand, superplasticizer, and TSC as output parameters are utilized. The assessment of the models is gauged with coefficient of determination (R 2), statistical measures, and uncertainty analysis. In addition, an analysis of feature importance is carried out for further refinement of the model. The result demonstrates that ANN and XGB perform well for train and test sets with R 2 > 0.96. Statistical measures show that all models give fewer errors with higher R 2, in which XGB and ANN depict robust performance. Validation via K-fold confirms that models perform by showing fewer errors and a greater correlation of determination. In addition, the analysis of parameters reveals that the fiber diameter, cement, and FA have a major contribution in the prediction of TSC of ECC. Moreover, the graphical user interface is also developed to help users/researchers that will facilitate them to estimate the strength of ECC in practical applications.
Abbreviations
- ANN
-
artificial neural network
- CC
-
cementitious composite
- CM
-
construction material
- CO2
-
carbon dioxide
- CS
-
compressive strength
- CV
-
cross-validation
- DT
-
decision tree
- ECC
-
engineered cementitious composite
- EFB
-
exclusive feature bundling
- FA
-
fly ash
- FRC
-
fiber-reinforced concrete
- GB
-
gradient boosting
- GGBF
-
ground granulated blast furnace
- GOSS
-
gradient-based one-side sampling
- GUI
-
graphical user interface
- HTS
-
high tensile strength
- KNN
-
K-nearest neighbor
- LGB
-
light gradient boosting
- LTS
-
low tensile strength
- MAE
-
mean absolute error
- ML
-
machine learning
- MLA
-
machine learning algorithm
- MLPNN
-
multi-layer perceptron neural network
- OF
-
objective function
- PC
-
plain concrete
- PE
-
polyethylene
- PP
-
polypropylene
- PVA
-
polyvinyl alcohol
- QM
-
quadratic model
- RF
-
random forest
- RHA
-
rice husk ash
- RMSE
-
root mean square error
- SCM
-
supplementary cementitious material
- SF
-
silica fume
- TSC
-
tensile strain capacity
- UTS
-
ultimate tensile strain
- XGB
-
extreme gradient boosting
1 Introduction
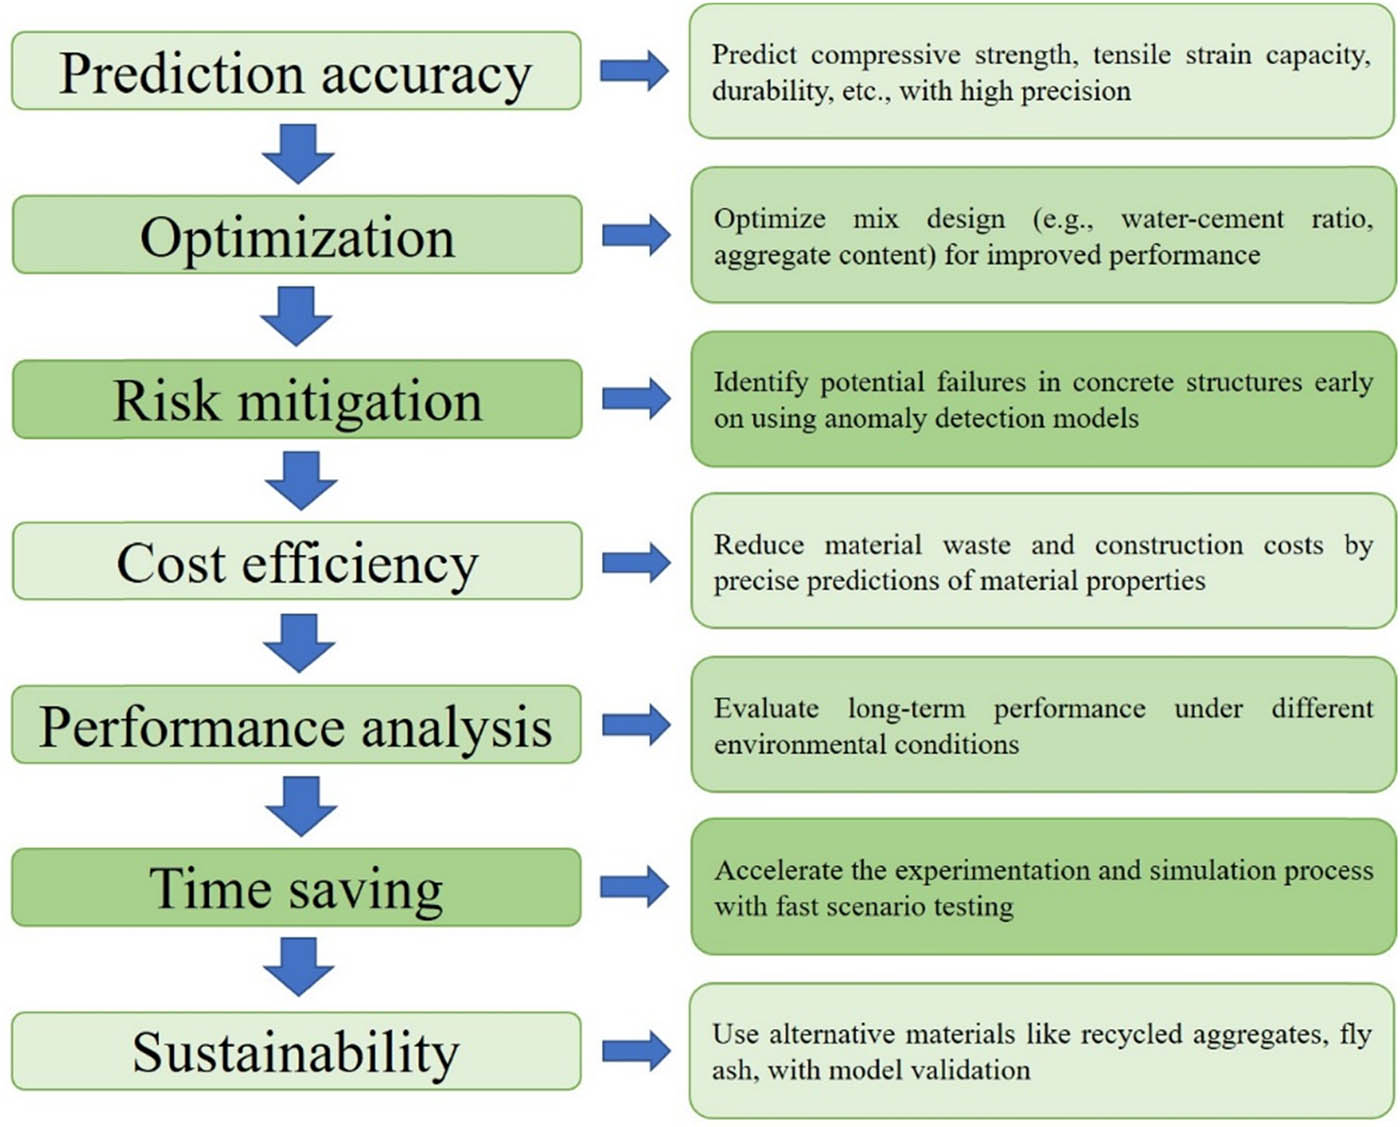
Concrete is one of the most utilized construction materials (CMs) that is used all around the globe because it is highly workable, readily available, and cost-effective [1]. Conventional concrete (CC) has in-built limitations, including inadequate resistance to cracking, low tensile strength (LTS), limited toughness (LT), brittleness, and heavyweight [2,3,4]. These drawbacks can limit its effectiveness and adaptability in various engineering applications. Furthermore, it is also reported that plain concrete (PC) has an ultimate tensile strain (UTS) of only about 0.01%, beyond which it is prone to brittle failure [5,6,7]. This brittleness indicates that cementitious structures can rapidly collapse [8], thus posing significant risks to safety and properties [9,10,11]. However, integrating fiber reinforcement with supplementary cementitious materials (SCMs) into the matrix can diminish this concern by obstructing the development of micro-cracks [4,12,13,14]. As a result, the risk of brittle failure is considerably reduced, and the UTS of the cementitious matrix can be increased by over 200 times [15]. In addition, the incorporation of these SCMs reduces carbon dioxide (CO2) emissions globally. It is also mentioned that various approaches can also mitigate or lower the emission of CO2, as illustrated in Table 1. Recently, numerous way-out approaches have been proposed to increase the performance of cementitious composite (CC) [16–20]. Therefore, the utilization of fibers is one of the most prominent methods. Thus, the presence of fibers plays a crucial role in increasing the toughness and tensile strain capacity (TSC) of engineered cementitious composites (ECCs), which is vibrant for the design and use of advanced concrete materials in the future [21–25]. The random distribution of fibers within the CC leads to better resistance to the propagation of cracks and, hence, improved tensile strength and increased strain capacity [3,26–28]. This arrangement enhances the post-cracking behavior of concrete. Therefore, it helps to minimize the propagation of small cracks and improve the overall ductility of ECCs. Figure 1 shows an overview of the appropriate properties of ECCs. The improved ductility of ECC allows it to undertake substantial deformation during seismic events without failing or cracking [29]. Thus, it is a perfect choice for constructing earthquake-resistant structures and other applications that need high durability. Moreover, the high TSC of concrete significantly enhances its suitability for a variety of new construction applications [30–32]. In structural components such as beams, columns, and slabs, high TSC improves the concrete’s ability to resist bending and tensile stresses, thus reducing the risk of cracking and deformation under load. This leads to greater structural integrity and longevity. For precast concrete elements, including panels and architectural features, high TSC ensures that these components can handle tensile stresses during manufacturing, handling, and installation while maintaining their structural stability and aesthetic quality [33–36]. In industrial flooring, such as heavy-duty and cleanroom floors, high TSC contributes to durability and resistance to cracking. Therefore, it is ideal for environments with significant mechanical stresses. Additionally, in infrastructure projects like bridge construction and tunnel linings, concrete with high TSC offers enhanced performance by managing tensile stresses and preventing cracking. Consequently, it ensures the safety and longevity of these critical structures. Incorporating high TSC concrete into new construction projects not only improves structural performance but also extends the lifespan and reliability of the built environment [35].
Method description impact on CO2 reduction
| SCMs | Partial replacement of cement with materials like fly ash (FA), slag, and silica fume (SF) | Reduces clinker usage, lowering emissions |
|---|---|---|
| Low-carbon cements | Includes LC3, geopolymer cement, and carbon-neutral cement | Significantly reduces the carbon footprint of cement production |
| Carbon capture, utilization, and storage (CCUS) | Captures CO2 from cement plants, either storing it or using it in concrete production | Directly reduces CO2 emissions from cement manufacturing |
| Optimizing concrete mix design | Reducing cement content, using high-strength concrete, and water-reducing admixtures | Lowers overall cement requirement, reducing emissions |
| Recycling and reuse of materials | Using recycled aggregates and reusing demolition waste in new concrete | Reduces the need for new cement and aggregates |
| Alternative binders | Utilizes alkali-activated materials and magnesium-based cement | Provides lower-carbon alternatives to traditional Portland cement |
| Improving energy efficiency in cement production | Upgrading kilns, using alternative fuels, and recovering waste heat | Reduces energy consumption and associated CO2 emissions |
| Sustainable construction practices | Design for longevity and modular construction techniques | Reduces material usage and waste, lowering cumulative emissions |
| Policy and regulatory measures | Implementation of carbon pricing, sustainability standards, and regulations | Encourages industry-wide adoption of low-carbon practices |

Benefits of ECCs in concrete.
This feature makes ECC predominantly appropriate for earthquake-resistant structures where toughness and durability are critical and required. It has also been reported that fiber-reinforced concrete (FRC) is stronger than traditional concrete [37–41]. In addition, it usually lacks the ductility that ECC offers. Moreover, ECC is known for its exceptional crack resistance, and it limits the propagation of cracks [42]. This is due to its unique blend of high tensile strength and ductility. FRC also has the ability to provide good crack resistance [43–45]. Furthermore, it may not be accomplished as efficiently as ECCs under high-stress conditions. The distinctions between plain concrete, ECC, and FRC are summarized in Table 2.
Differences between CC
| Property/feature | Plain concrete | FRC | ECC |
|---|---|---|---|
| Definition | A basic form of concrete made from cement, aggregates, and water | Concrete reinforced with fibrous materials to enhance its structural integrity | A type of high-performance FRC designed to exhibit strain-hardening behavior and increased ductility |
| Composition | Cement, coarse and fine aggregates, water, and sometimes admixtures | Cement, aggregates, water, and fibers (steel, glass, synthetic, natural) | Cement, fine aggregates, water, fibers, admixtures, and SCMs |
| Ductility | Low, brittle failure under tensile stress | Moderate; improved ductility compared to plain concrete | High; capable of significant strain-hardening and deformation before failure |
| Crack resistance | Poor, prone to large crack formation | Good; fibers help in controlling crack width and propagation | Excellent; designed to form many micro-cracks instead of a few large cracks |
| Tensile strength | Low; tensile strength is much lower than compressive strength | Moderate to high, depending on fiber type and content | High, owing to fiber reinforcement and strain-hardening properties |
| Flexural strength | Low; fails under flexural loads | Improved; fibers help in carrying tensile loads | High; improved flexural performance due to fibers |
| Energy absorption | Low; absorbs less energy under load | Moderate to high; fibers contribute to higher energy absorption | High; can absorb significant energy before failure |
| Durability | Moderate; durability depends on mix design and curing | Improved; fibers enhance resistance to spalling, impact, and fatigue | High; enhanced resistance to environmental and mechanical degradation |
| Application areas | General construction, foundations, pavements | Bridges, pavements, industrial floors, and tunnel linings | Infrastructure, seismic zones, repair and rehabilitation, and overlays |
| Cost | Low; most economical form of concrete | Moderate; cost varies with type and amount of fibers used | Higher; due to advanced materials and fiber content |
| Workability | High; easy to mix, place, and finish | Moderate; fibers can affect workability and may need adjustments | Moderate to low; may require special handling and placement techniques |
| Shrinkage | Moderate; prone to shrinkage cracking | Improved; fibers reduce the extent of shrinkage | Low; fibers help in reducing shrinkage cracking |
| Environmental impact | Moderate to high, depending on cement content | Variable; inclusion of recycled fibers can reduce the environmental impact | Variable; can be designed to be more sustainable with supplementary materials |
ECC incorporates numerous mineral admixtures, such as SF and FA, as partial replacements for cement to cater to the properties of concrete [46–50]. This process supports the use of eco-friendly CMs in civil engineering projects. Typically, an ECC mix includes cement/binder, ashes, sand, fibers, and a superplasticizer. The proportions of these mixtures adamantly influence the composite’s properties. Moreover, fibers that play a significant role in ECC act in bridging action inside the cementitious matrix [51–53]. Thus, their incorporation increases the properties of the overall matrix. These fibers are essential in ECC for enhancing tensile strength, ductility, crack control, flexural strength, toughness, energy absorption, and overall durability [47,54–56], therefore making ECC a superior and versatile CM. Common fibers used in ECC are polyvinyl alcohol (PVA), polyethylene (PE), and polypropylene (PP). PVA fibers are favored over PP fibers because they offer higher tensile strength, which is crucial for improving the composite’s overall tensile strength [56]. Additionally, ECC with PVA fibers exhibits superior flexural strength and toughness compared to ECC with PP fibers [57]. ECC is a mixture of heterogeneous materials designed to achieve superior mechanical properties and durability. The typical ECC mix includes cement, sand, FA, fibers (such as PE, PP, or PVA), and a superplasticizer. Thus, it requires a lot of time and involves the hit and trial approach to achieve the desired strength after 28 days [58]. However, calculating the compressive strength (CS) of ECC at 28 days can be challenging due to the ambiguity that exists in the mix ratios of its various components. The heterogeneous nature of the materials and the variability in the proportions of fibers, cement, sand, and SCMs make it difficult to establish a standardized mix ratio. This variability can ultimately lead to inconsistencies in the mixture properties. Thus, the need to balance workability durability and strength requires numerous iterations. This is often required to optimize the mix design. In addition, the trial-and-error method can ominously interrupt the development and application of ECC in construction projects. Given these challenges in the concrete industry, ML approaches offer an encouraging solution for forecasting the CS of ECC more efficiently [59–61]. This is done by analyzing the large gathered data of ECC mix proportions and their corresponding performance outcomes, namely the CS. These machine learning algorithms (MLAs) can identify patterns and associations with each other that are not simply discernible through conventional methods [62–66]. These models can then help in calculating the optimal mix ratios of the mixture to attain the desired strength within due time. It, therefore, reduces the dependence on time-consuming trial and error associated with it. This approach not only speeds up the development process but also improves the accurateness and reliability of strength predictions. In addition, researchers and engineers can more efficiently harness the potential of ECC cementitious matrix to numerous civil engineering applications with greater assurance in its performance. ML techniques have appeared as an effective means for scholars to develop prediction models for revolutionary concrete composites, including ECC [67–70]. These methods control vast amounts of data to uncover complex arrangements and relationships that traditional methods might miss. Thus, it enables more precise predictions of the properties of materials. Wu et al. [71] utilized the ML method, particularly the artificial neural network (ANN), for the prediction of pervious concrete. The author forecasted the permeability and CS and revealed that both outputs depict significant correlation (R 2) values of 0.98 and 0.97, respectively. Karim et al. [72] estimated the strength of concrete, including FA and rice husk ash (RHA) as SCMs, by utilizing the gradient boosting (GB) approach, ANN, and extreme gradient boosting (XGB) with 138 data points. The author demonstrated that the XGB model gives a strong and significant R 2 of 0.84. Kashem et al. [73] deployed various ML approaches in conjunction with hybrid approaches to anticipate the strength of sustainable concrete with RHA. The author employed random forest (RF), XGB, and light gradient boosting (LGB) with hybrid approaches. The author reveals that the hybrid approach XGB-LGB shows resilient performance with R 2 = 0.95. Piro et al. [74] predicted the electrical resistivity of normal concrete with slag content as a partial replacement of coarse aggregate and revealed that the full quadratic model performs as a most reliable model with R 2 = 0.91. Jaf et al. [75] estimated the CS of FA-based concrete by employing numerous approaches, including ANN, linear, non-linear regression, and full quadratic with 236 data points. The authors concluded that the ANN model gives robust measures for training and testing sets with R 2 = 0.987 and 0.986, respectively. Mohammed et al. [76] predicted the CS of high and normal strength concrete with FA and ground granulated blast furnace (GGBS) as ingredients in a cementitious matrix. They employed ML measures and revealed that the ANN model depicts robust performance. Similarly, Lou et al. [77] developed ML approaches for self-healing concrete to anticipate the crack repair rate. They showed that adaptive boosting approaches yield robust measures of R 2 = 0.943. Shakil et al. [78] predicted the CS of blended concrete with various SCMs, namely as lime powder, GGBS, SF, FA, and calcined clay with 1,288 data points. They employed numerous approaches and reveal that XGB shows strong correlation in anticipating the strength of blended concrete. In addition, Figure 2 illustrates the influence of ML in the construction sector.
Advantages of ML in concrete.
2 Research significance
The aim of this study is to predict the TSC of ECCs, which are advanced materials designed for enhanced durability and performance. To achieve this, the study leverages a precompiled dataset sourced from various published research articles. The prediction models will be built using advanced machine learning (ML) techniques, specifically the LGB, XGB, ANN, and k-nearest neighbors (KNNs). These approaches are implemented within the Anaconda Spyder Jupyter Notebook environment. These algorithms were selected because of their ability to manage intricate datasets and produce precise forecasts. The models were developed and tested using the Anaconda Spyder Jupyter Notebook platform. They offer an integrated environment for ML and data analysis. To assess the performance of each model, statistical metrics and uncertainty analysis were employed. To further refine the models, an analysis of feature importance was carried out. This analysis identifies the variables or parameters that most significantly impact the strength predictions. Thus, it helps understand the key factors driving TSC. Moreover, Python coding is employed to create a graphical user interface (GUI) that will facilitate users to estimate the strength of ECCs in practical applications.
3 Methodology
MLAs are advanced computational techniques used to predict the properties of CCs [36,79–81]. This is done by utilizing large datasets to derive insights and make accurate forecasts. These algorithms are instrumental in solving complex regression and classification problems. Therefore, providing an understanding of material behaviors is more nuanced than traditional ways [82–85]. In the context of the concrete industry, ML approaches are increasingly popular because they enable the analysis of material performance based on historical data, thereby improving the accuracy of future predictions. These algorithms can identify patterns and links through training on large datasets that may not be seen through manual analysis alone [41,71,86–89]. For this study, four advanced ML techniques are employed, namely LGB, XGB, ANN, and KNN. Each of these methods offers unique advantages. XGB is known for its high performance and accuracy. It constructs several decision trees (DTs) and merges them to increase the precision of predictions. It handles large datasets efficiently and is less prone to overfitting due to its regularization techniques [89–91]. The LGB method is designed to be faster and more scalable than traditional GB methods. LGB is particularly effective with large datasets and complicated composite strength predictions due to its high-dimensional data [92]. Similar to this, the KNN algorithm is a simple and effective way to categorize data points based on their proximity to other data points in the feature space [93]. ANN resembles the neural networks in the human brain, allowing it to model complicated and non-linear relationships in data. Its success depends on the quality of the training data and the distance measure selected. Its performance relies on the quality of the training data and the choice of distance metric, and ANN mimics the human brain’s neural networks [77]. Thus, it enables to model complex and non-linear relationships in data. This method is highly flexible and can capture intricate patterns in material behavior. The choice of these methods is driven by their exceptional predictive accuracy, ability to handle complex datasets, and robustness to overfitting. Each method’s unique strengths make them well-suited for estimating the strength of composites containing ECC, which involves intricate interactions between various material components.
3.1 Data description
A dataset of 122 experimental data points on composite matrices incorporating fibers in ECC has been compiled from previous studies to evaluate CS, as detailed in Annexure A. The dataset was assembled from prior research. To understand the structure of the dataset and choose suitable MLAs, it is essential to examine the dataset. The dataset comprises 211 entries of raw materials such as FA, cement, water-to-binder ratio (W/B), sand, superplasticizer, fiber content, and composite age. When evaluating the CS of the ECC, each of these factors is very important, and thus analysis is necessary. The “VAC.describe().T” command in python was used to provide descriptive statistics that revealed information about the dataset’s mean, variability, distribution, and percentiles (25th, 50th, and 75th), as shown in Table 3 and Figure 3. To create precise predictive models, it is necessary to understand the data’s central tendency and spread, which is aided by these statistics. Additionally, a careful examination of these descriptive statistics helps to clarify the relationships between variables. Thus, it ensures that the MLAs chosen are capable of accurately capturing and forecasting the CS of ECCs from the given input features. Additionally, previous studies utilized Ordinary Portland Cement that complied with ASTM C150 standards. The cement had a fineness between 300 and 400 m2·kg−1, and its specific gravity was in the range of 3.05–3.20. The fibers primarily consisted of PVA fibers, with lengths between 6 and 12 mm and diameters from 12 to 40 μm, respectively. The content of these fibers varied between 4.55 and 39 kg·m−3. For cement replacement, Class-F FA was mainly used, with amounts varying from 201 to 1,150 kg·m−3. The sand content in the ECC mixtures ranged from 380 to 756 kg·m−3, and the maximum particle sizes spanned from 100 to 4,750 μm. The superplasticizer used was polycarboxylate-based, known for its high water-reducing capabilities, which help in minimizing water content and enhancing workability.
Parameter descriptive statistics
| Count | Mean | Std | Min | 25% | 50% | 75% | Max | |
|---|---|---|---|---|---|---|---|---|
| Cement | 122 | 430.69 | 123.06 | 190 | 368 | 398.5 | 502 | 936 |
| Flyash | 122 | 787.78 | 149.02 | 0.00 | 684 | 807 | 886 | 1,063 |
| Water-to-binder ratio | 122 | 0.27 | 0.05 | 0.19 | 0.25 | 0.26 | 0.27 | 0.56 |
| Sand content | 122 | 470.73 | 68.58 | 380 | 454 | 456 | 456 | 838 |
| Sand max size | 122 | 539.4 | 970.7 | 150.0 | 250 | 250 | 300 | 4,750 |
| Superplasticizer | 122 | 7.71 | 4.85 | 2.0 | 5 | 5.80 | 9.34 | 23 |
| Fiber content | 122 | 22.93 | 4.63 | 0 | 19 | 26 | 26 | 29 |
| Fiber length | 122 | 10.09 | 2.00 | 8.0 | 8.0 | 12 | 12 | 12 |
| Fiber diameter | 122 | 35.5 | 6.20 | 24.0 | 29.2 | 39.0 | 39.0 | 40 |
| Age | 122 | 32.49 | 22.82 | 3 | 28 | 28 | 28 | 90 |
| TSC | 122 | 3.44 | 2.34 | 0 | 2.38 | 3.10 | 4.05 | 10.75 |
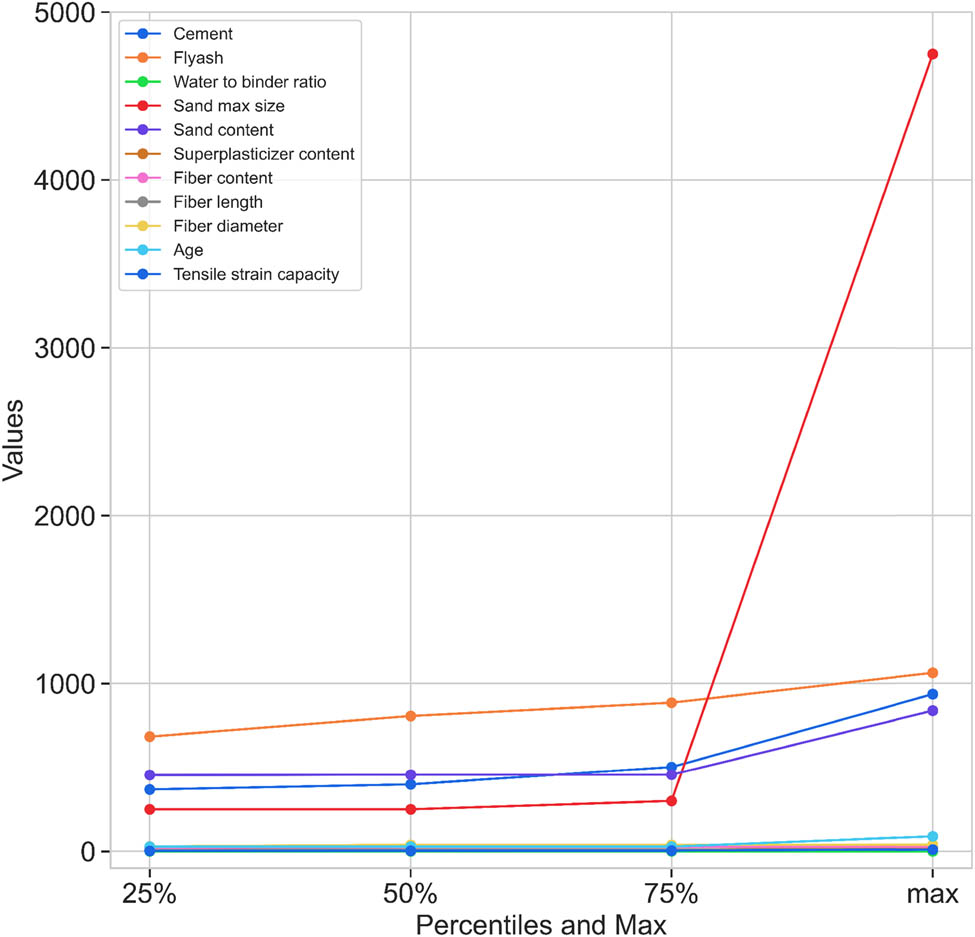
Percentile graph of the dataset.
The heat map indicates that for ECCs, cement (0.15) and superplasticizer (0.20) have weak positive correlations with strength, as illustrated in Figure 4. This suggests that increasing these components slightly improves the strength, though the effect is modest. FA (−0.23) shows a weak negative correlation, implying that higher FA content slightly reduces the strength, while the water-to-binder ratio (−0.15) also negatively impacts the strength, indicating that higher ratios marginally lower the strength. Sand (0.56) exhibits a positive correlation, suggesting that more sand slightly improves the strength, though the effect is limited. Fiber content (0.03) has a very weak positive correlation, meaning that changes in the fiber content have minimal impact on the strength. Age (−0.10) shows a very weak negative correlation, suggesting a minor decrease in the strength with age over time, which is atypical given that concrete generally gains strength over time. Fiber length shows a weak positive correlation, suggesting that longer fibers slightly improve the strength, but the impact is minimal. Longer fibers might contribute more to the tensile strength and crack resistance than CS. Overall, while cement, superplasticizer, and sand have a favorable impact on FA and strength, the water-to-binder ratio has small negative effects, and the correlations are weak, indicating that a combination of factors and empirical testing is essential for optimizing the ECC strength.
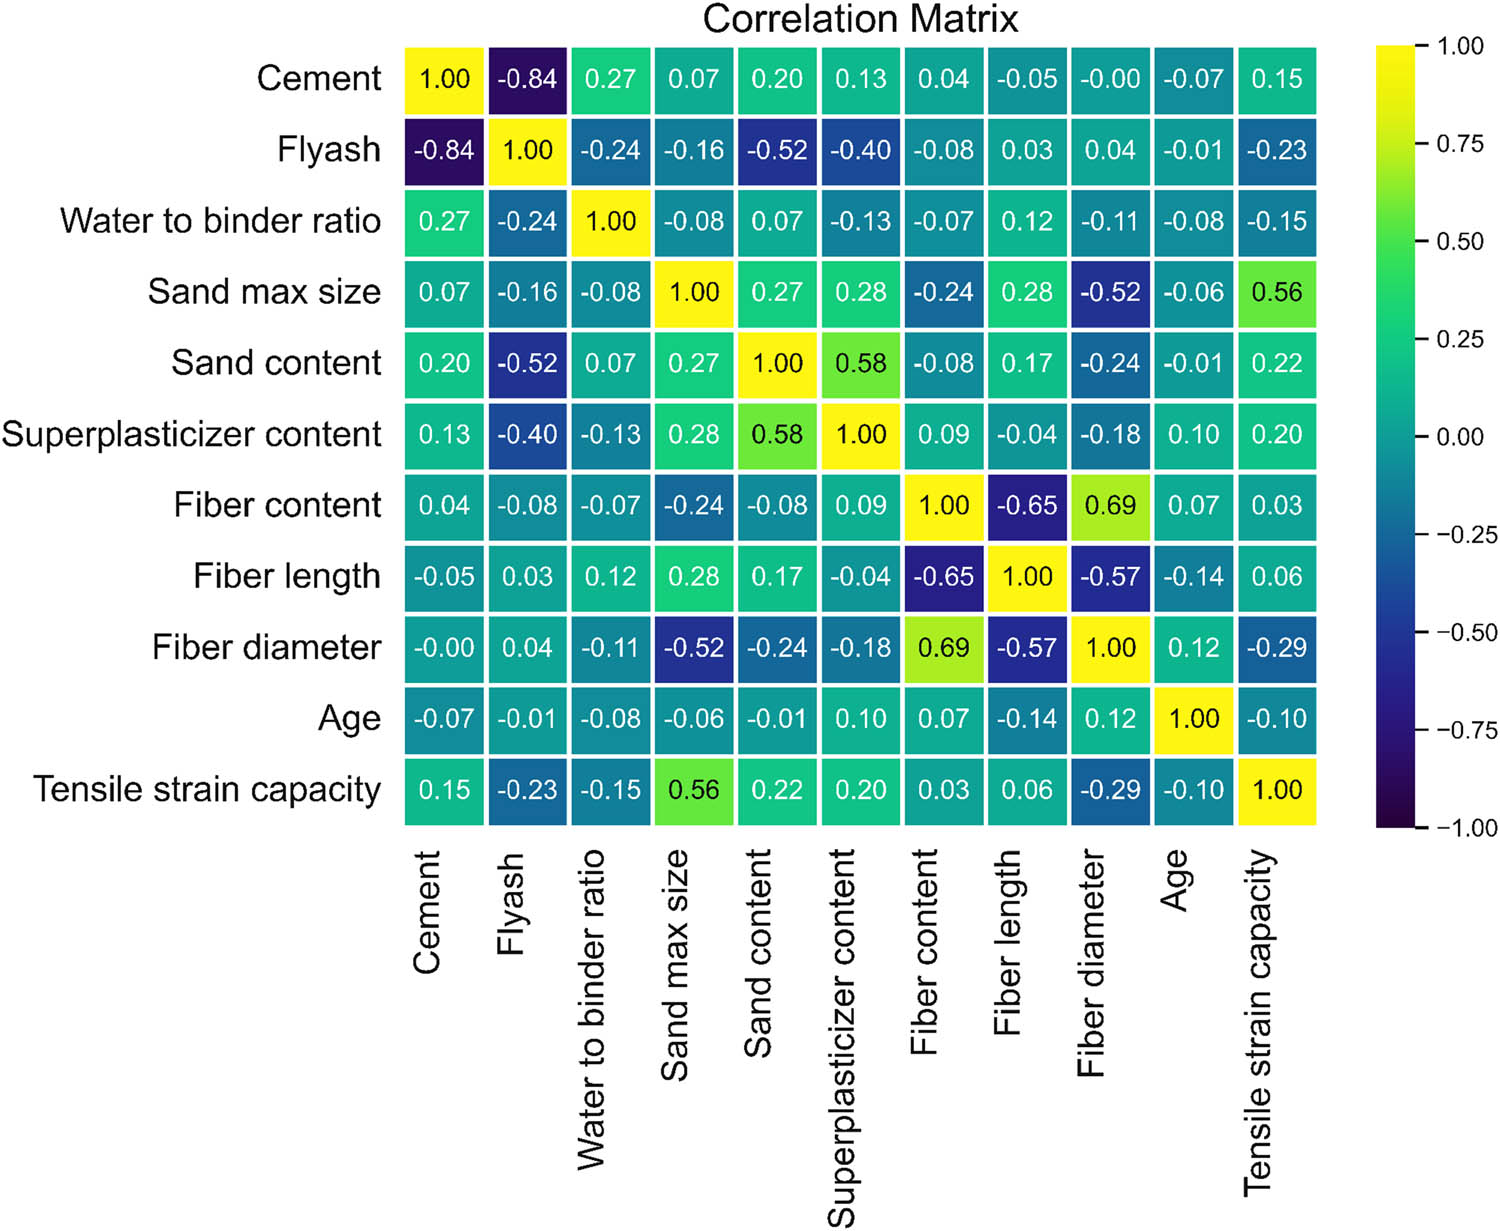
Heat map of ECCs.
To check the relationship of the parameters to the strength of ECC, the individual correlation of each variable is depicted in Figure 5. It can be seen that these parameters show the same relation, as demonstrated in Figure 6. However, the fiber content shows an increase and then decrease behavior, which is because the addition of fibers generally improves the strength by enhancing the material’s ability to resist cracking and distribute loads more evenly. Fibers reinforce the composite by bridging cracks and improving tensile strength, which leads to an increase in the overall strength. However, beyond a certain optimal fiber content, the addition of more fibers can lead to problems. Excessive fiber content might result in clumping or uneven distribution, which can create localized weaknesses and reduce the effectiveness of fiber reinforcement. Additionally, very high fiber content might negatively impact the mix’s workability. Thus, it leads to difficulties in proper mixing and compaction, which can also reduce the strength.
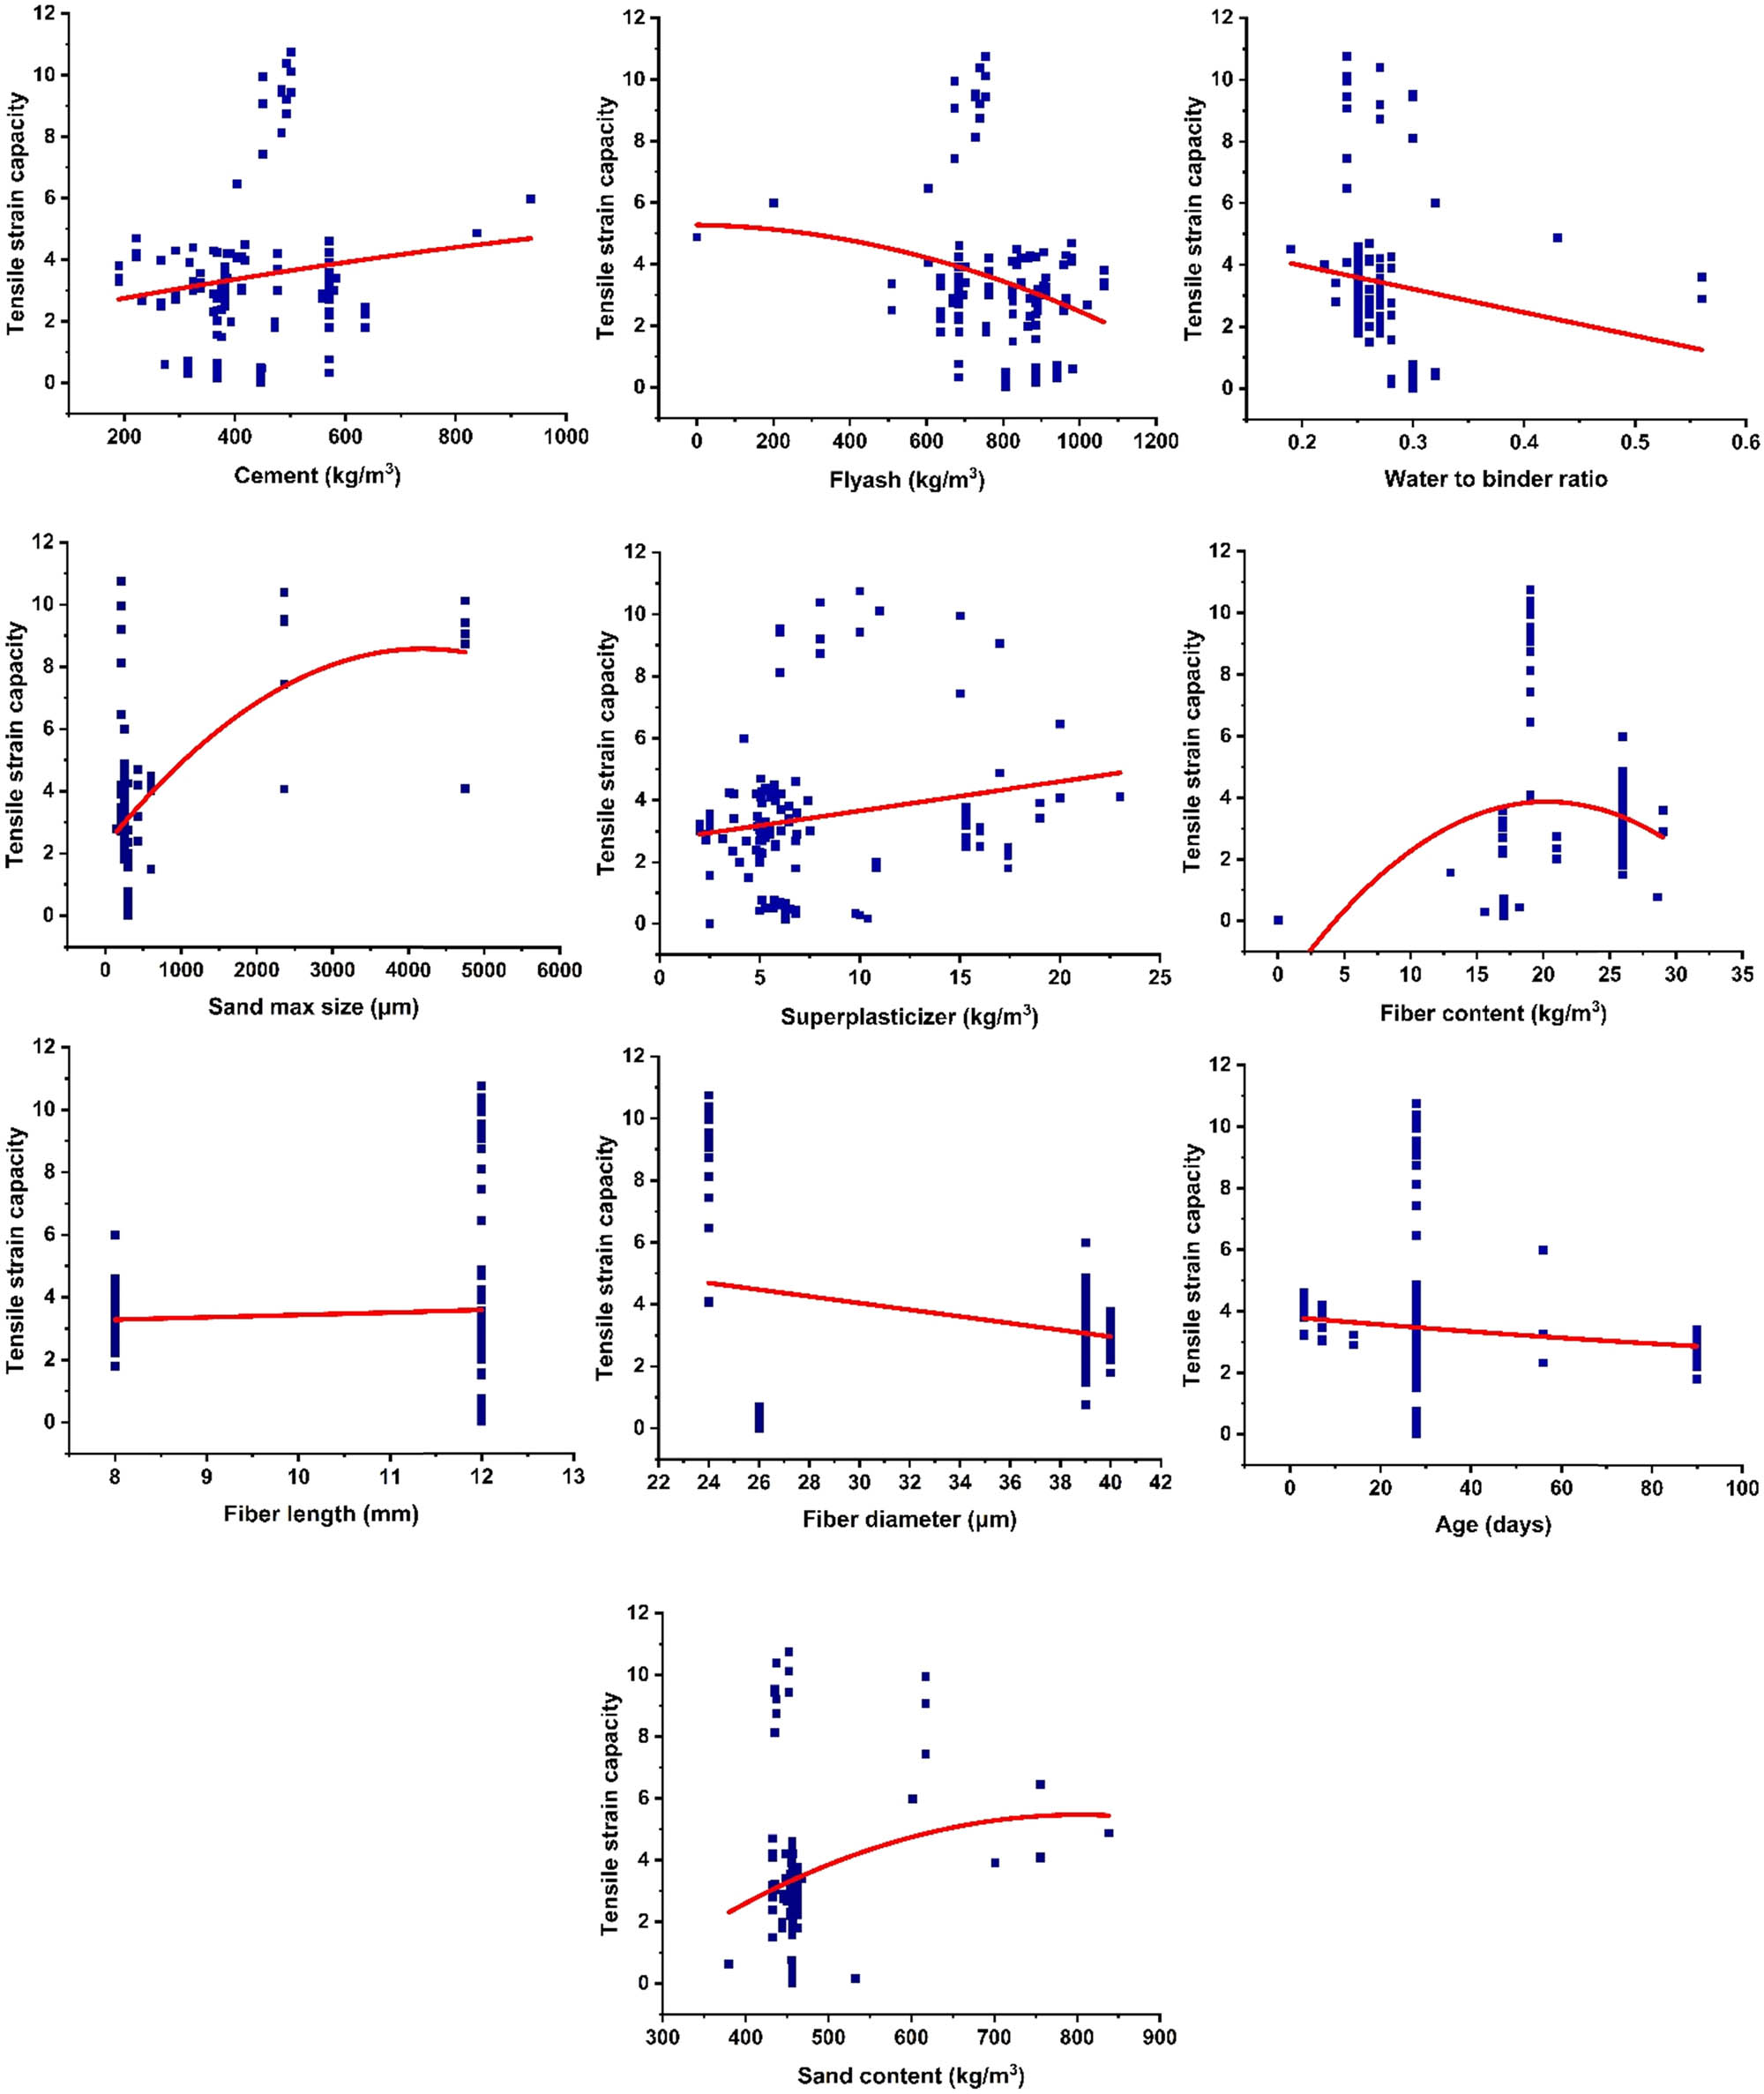
Individual relationship of parameters with strength.
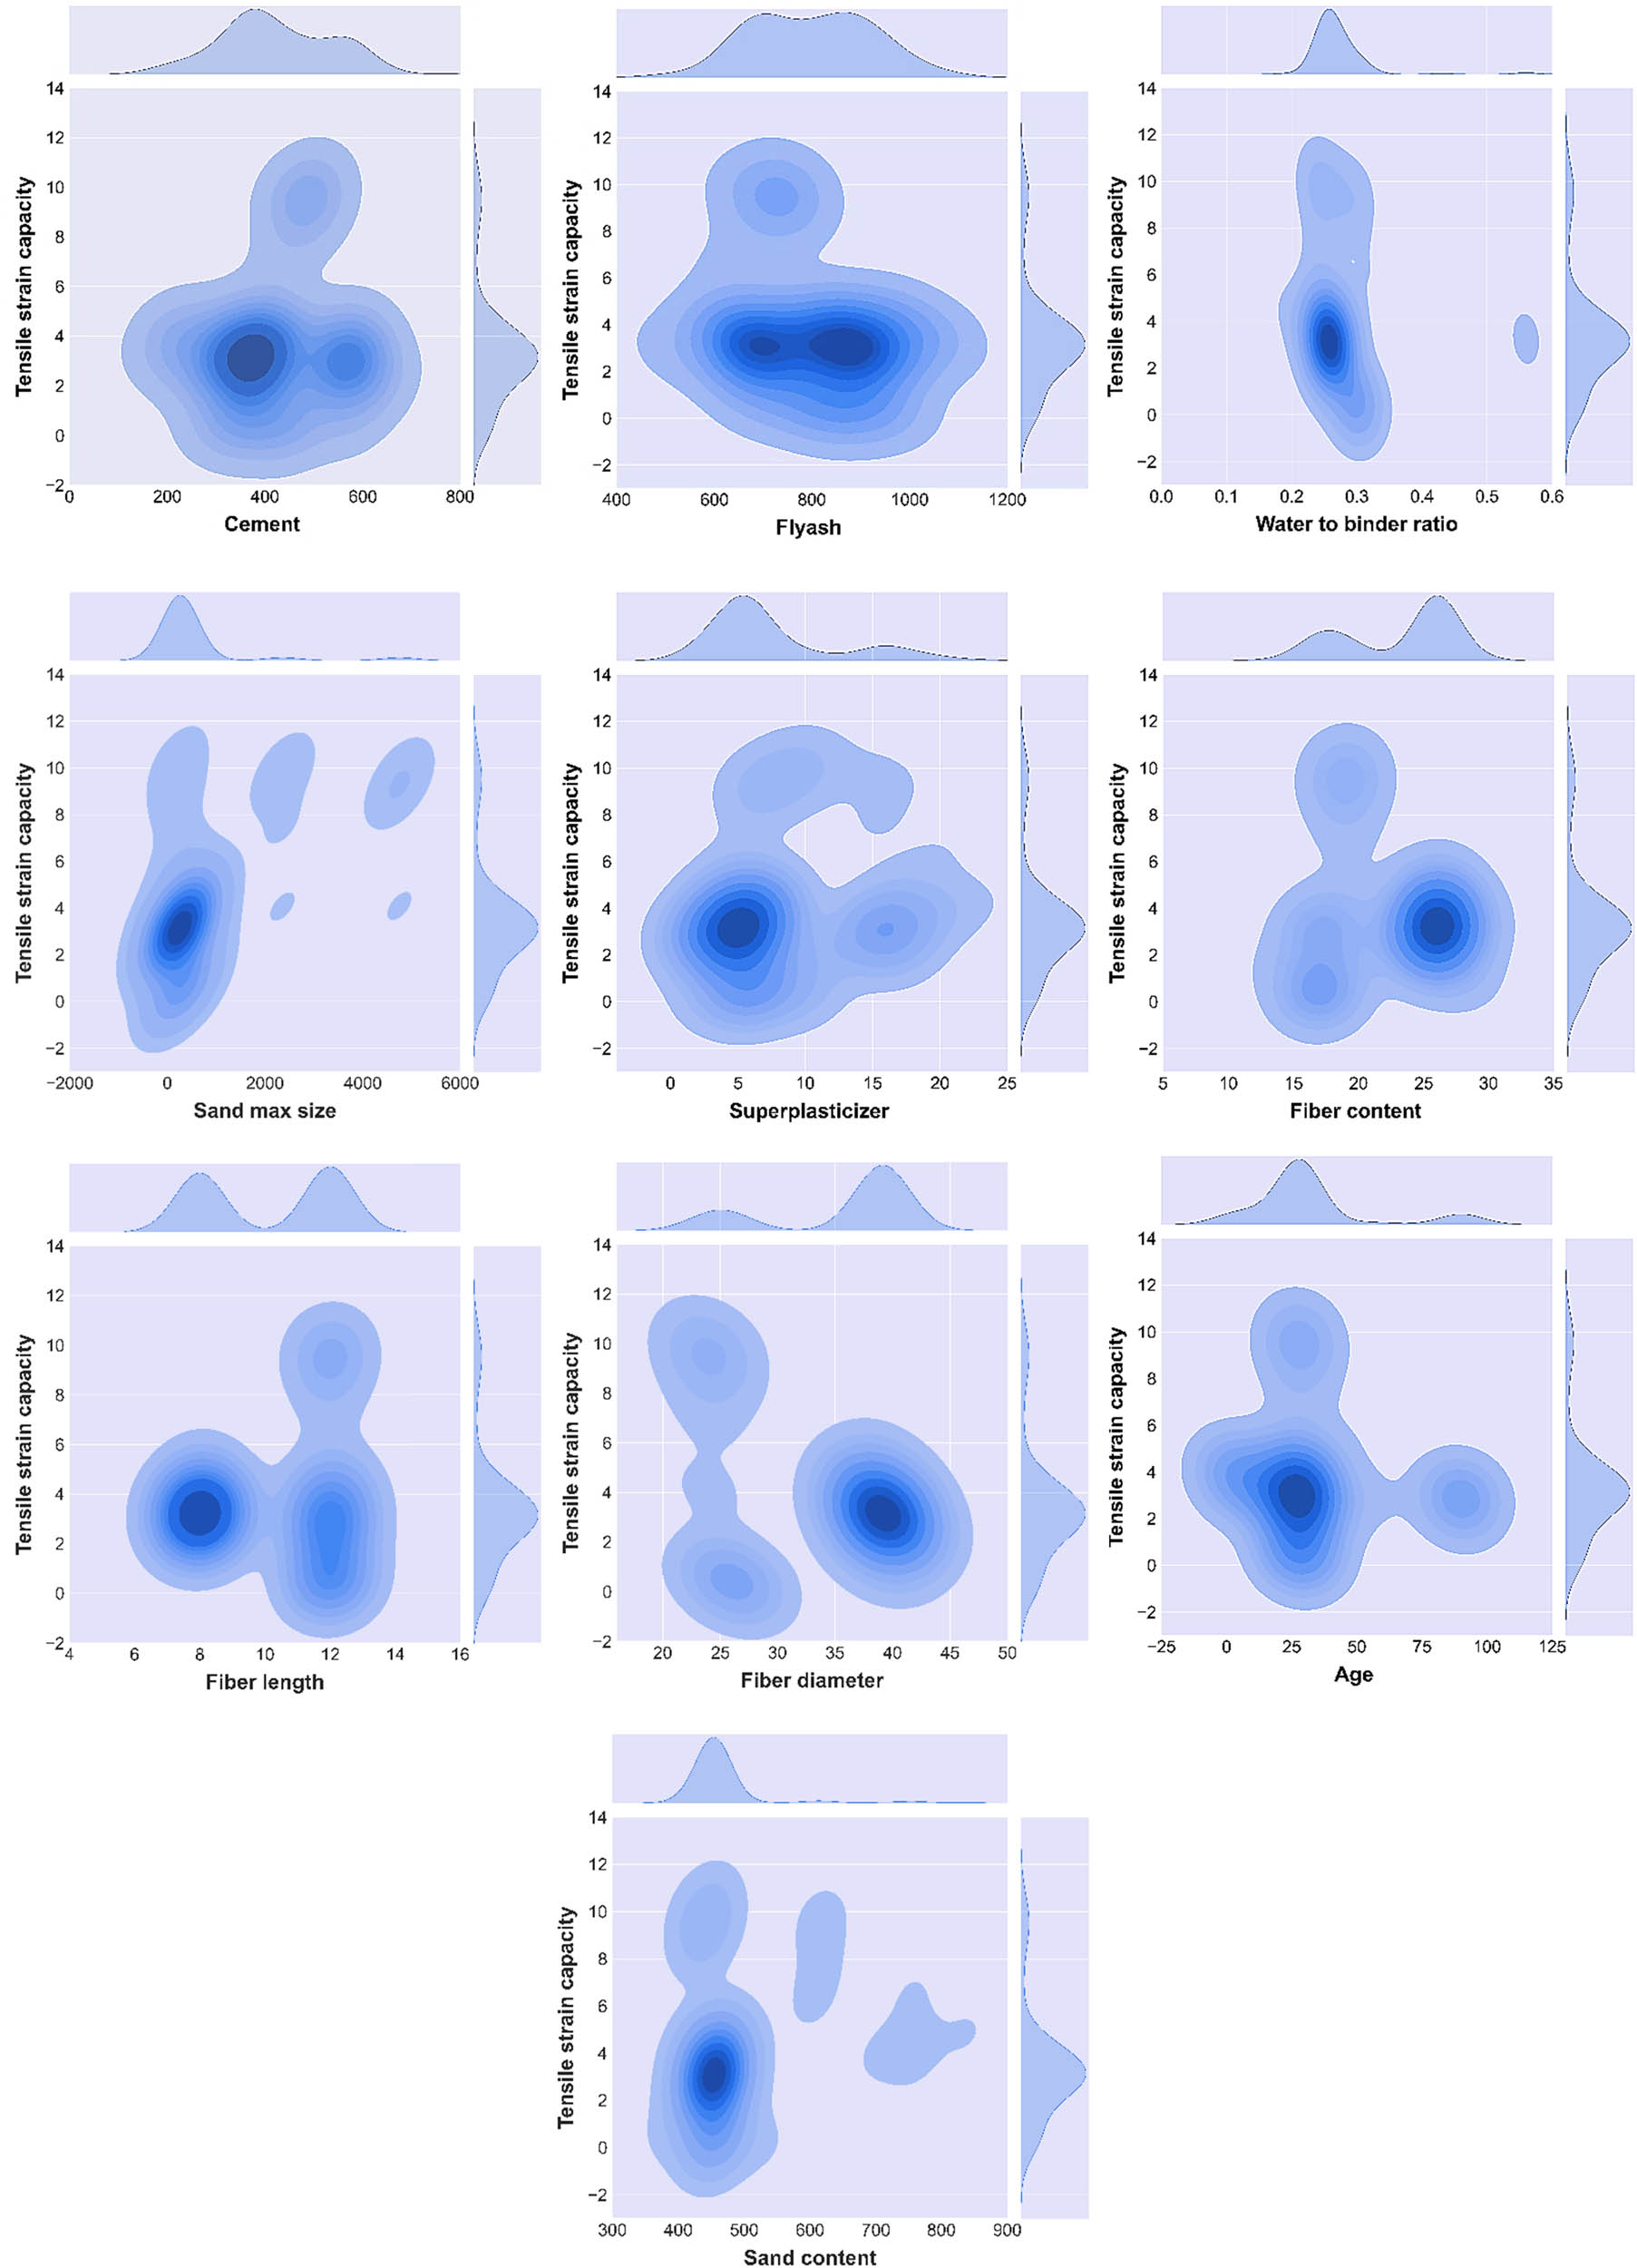
Contour plot of parameters with strength.
Figure 6 demonstrates the distribution of input parameters and their effects on the concrete’s output strength within the optimized benchmark system. The contour plots provide a visual representation of how variations in individual input parameters such as cement content, water-to-binder ratio, and fiber content affect the resulting ECC strength. Darker regions on the plots indicate higher concentrations of specific parameter values, highlighting their stronger influence on the strength of the concrete. These plots are derived from comprehensive data analysis, which helps in understanding the precise relationships between the input variables and concrete performance. This visualization aids in identifying the optimal parameter ranges to achieve the desired strength outcomes.
3.2 Machine learning overview
These approaches are frequently employed to predict the behavior and characteristics of ingredients within a cementitious matrix. In this study, four different algorithms, KNN, XGBoost (XGB), ANN, and LightGBM (LGB), are utilized to estimate the strength of an ECC that includes fibers and waste materials. These algorithms are highly regarded for their accuracy and efficiency in identifying material properties [94]. To further illustrate, Figure 7 presents a thorough flowchart that describes the individual algorithms and their input parameters, and Figure 8 gives an overview of the MLAs used in this study.
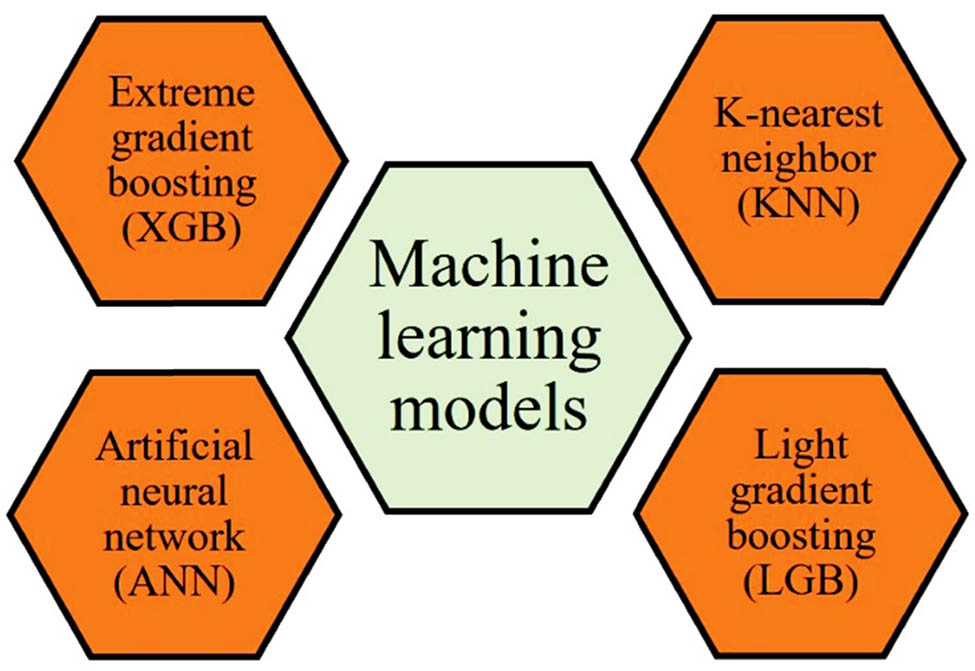
MLAs used in the current work.
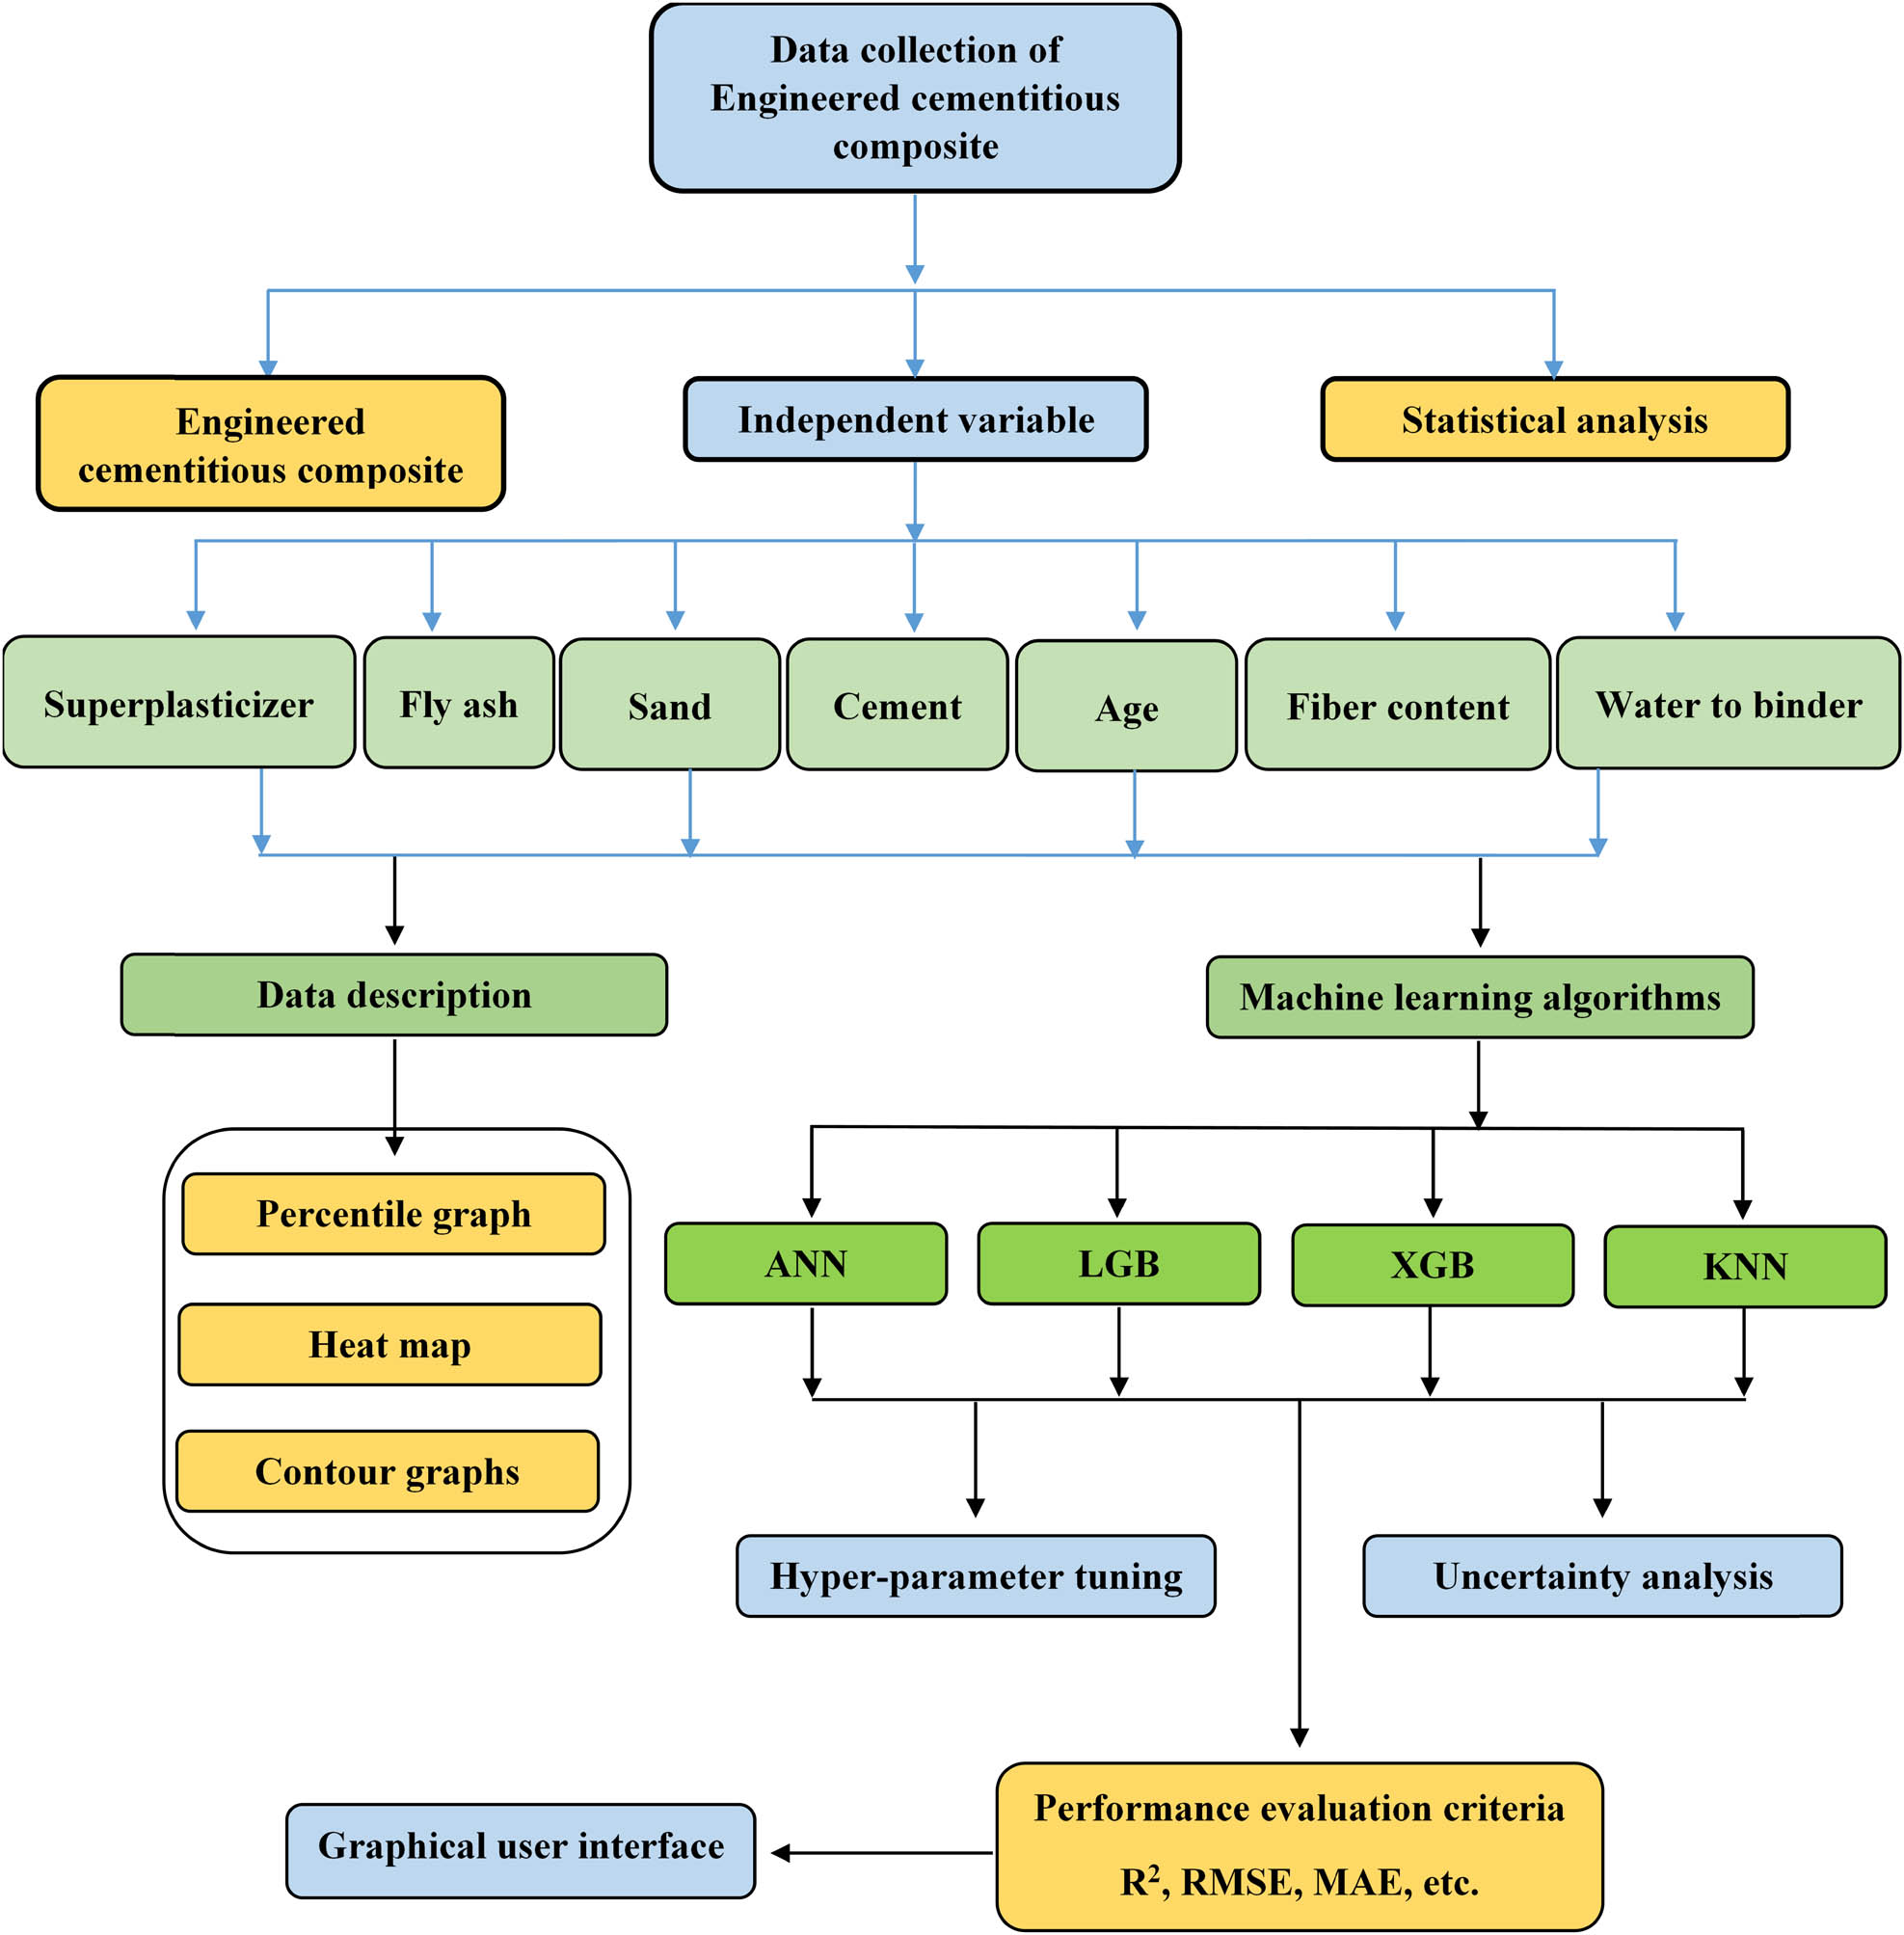
Flowchart of ECC with approaches.
3.2.1 XGB
The XGB model represents an advanced evolution of Friedman’s original GB Machine. It is renowned for its effectiveness and robustness, particularly in constructing ensembles of DTs that collaboratively tackle both classification and regression problems [95–97]. The core function of XGB is to optimize its objective function (OF), which is central to its performance. By leveraging ML techniques within a gradient-boosted framework, XGB excels in solving diverse challenges with high efficiency and precision through its use of parallel boosted trees. One of the standout features of XGB is its integration of GB with regularization, a combination that significantly reduces the risk of overfitting [98–100]. The XGB OF consists of two main parts: the loss function and a regularization term. The loss function measures the discrepancy between the actual and predicted values, while the regularization term imposes penalties on overly complex models. Thus, it ensures a balance between complexity and performance. Figure 9 shows a comprehensive overview of the XGB prediction process. It begins with the construction of an initial DT. The algorithm then calculates the errors, i.e., the differences between the predicted and actual values. To address these errors, a new DT is trained and added to the ensemble. This new tree helps correct the errors made by the previous tree. The predictions are updated by aggregating the outputs from all the trees in the ensemble. This iterative process of error calculation and tree addition continues until a predefined stopping criterion is achieved [101,102]. This method enables XGB to refine its predictions progressively, enhancing both accuracy and reliability.
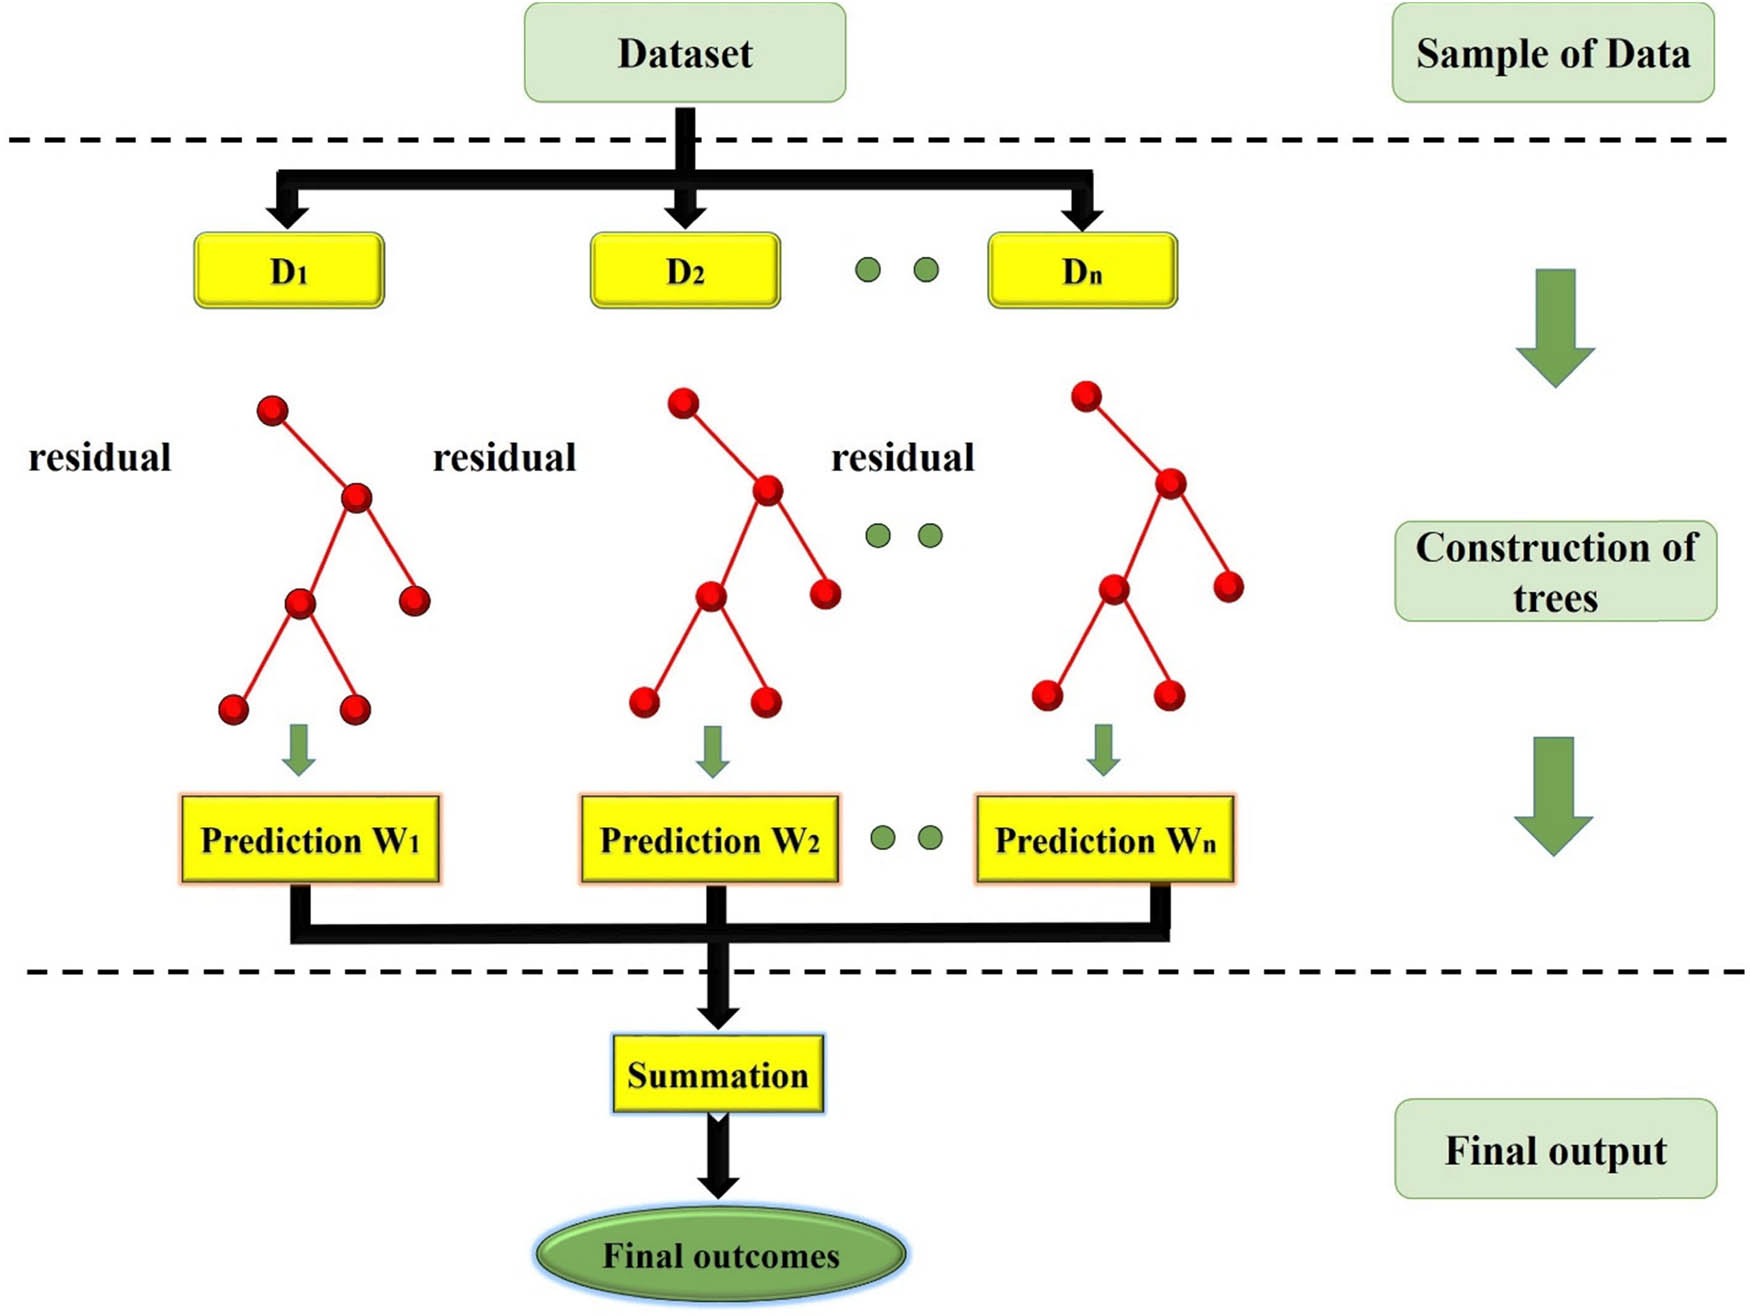
XGB prediction process.
3.2.2 LGB machine (LightGBM)
LightGBM, developed by Microsoft Research, is a specialized Gradient Boosting Decision Tree algorithm designed to tackle various ML tasks such as regression and classification [73,103,104]. It is distinguished by its efficiency and effectiveness, requiring less memory while achieving superior prediction accuracy. The primary aim of LightGBM is to enhance computational efficiency, making it ideal for handling complex data prediction problems. LightGBM incorporates two novel techniques: gradient-based one-side sampling (GOSS) and exclusive feature bundling (EFB). GOSS is designed to handle large datasets by concentrating on the most informative data points, thereby improving training efficiency. EFB addresses the challenge of high-dimensional data by bundling similar features together, which helps to mitigate overfitting. These innovations, along with LightGBM’s histogram-based method and leaf-wise tree growth strategy, substantially boost training speed and reduce memory consumption. In the histogram-based approach, continuous data are divided into discrete bins, creating a histogram of these bins. This histogram provides key statistics, such as the sum of gradients and the count of samples for each bin. By analyzing these aggregated values, LightGBM can identify the optimal split points for DTs, leading to more efficient training and lower storage and computational costs [73,103,104]. Figure 10 illustrates the differences between LightGBM’s level-wise and leaf-wise tree growth strategies. The level-wise strategy involves splitting all leaves at the same level simultaneously, which facilitates parallel processing and better management of model complexity. In contrast, the leaf-wise strategy focuses on splitting the leaf with the highest information gain, which measures the reduction in entropy when a node is split based on certain features. This targeted approach ensures that leaves with unique information are effectively utilized, enhancing the model’s overall performance and accuracy.
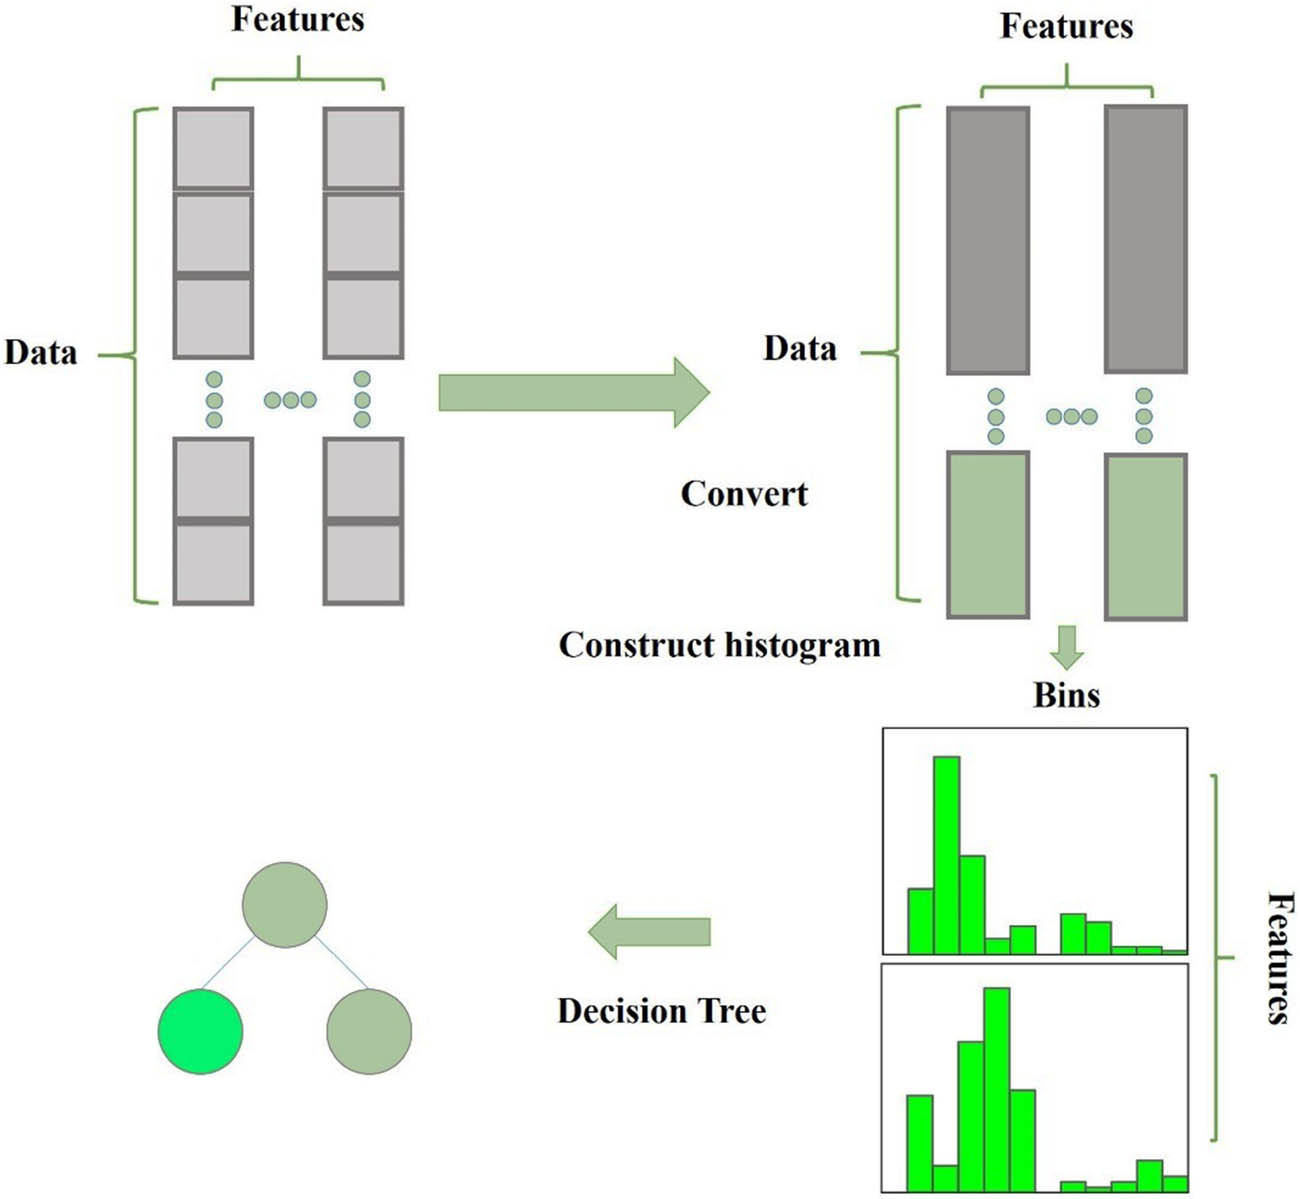
Histogram-based DT.
The leaf-wise growth strategy is highly efficient because it focuses on splitting only the leaf that offers the highest information gain at each level, as shown in Figure 11. This targeted approach allows the construction of trees with a high degree of complexity, which can capture intricate patterns in the data. However, to avoid overfitting, where the model becomes overly tailored to the training data, a maximum depth limit is imposed during the tree-building process. This depth restriction ensures that while the model remains complex enough to capture important details, it does not become so specialized that it loses its ability to generalize to new data [105].
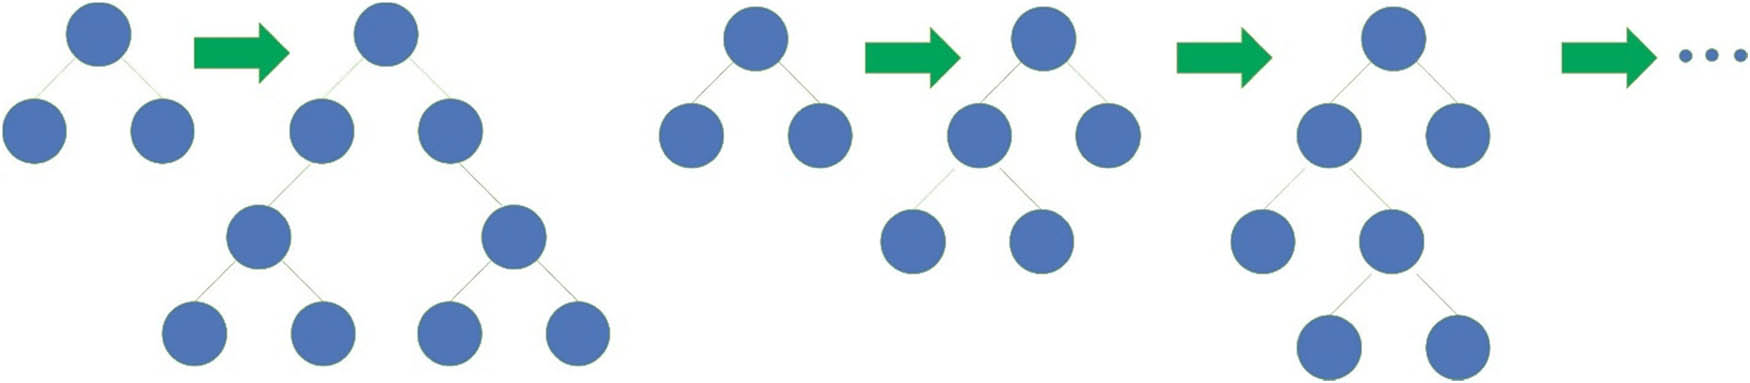
Construction of a DT.
3.2.3 KNN
The KNN algorithm is a popular technique used for making predictions by comparing new data points to the most similar instances in a given dataset. As illustrated in Figure 12, KNN operates by finding the “K” nearest neighbors to a new data point and leveraging their characteristics to make predictions. This method is versatile and applicable to both regression and classification tasks within ML. The core principle of KNN is that data points that are close to each other in the feature space (e.g., attributes of a concrete mix) are likely to have similar outcomes. Therefore, when KNN makes a prediction, it identifies the “K” closest neighbors by calculating the distance between data points in the feature space. The predicted output is then determined by a function that aggregates the response values of these nearest neighbors. Typically, in standard KNN, the prediction is derived from the mean of the neighbors’ response values [106]. The key features of the standard KNN algorithm include its simplicity and effectiveness in scenarios where data points are closely related. This approach is particularly useful for problems where the relationships between data points are expected to be local rather than global. The standard KNN algorithm is characterized by the following key features:
Equal weighting of neighbors: All identified neighboring data points contribute equally to the prediction, with the average value of their responses commonly used to predict the outcome for the new data point.
Uniform feature importance: It assumes that all features have been normalized; that is, each feature is considered equally important in calculating distances between data points.
Use of Euclidean distance: The Euclidean distance metric is typically employed to determine how close data points are to one another in the feature space [107].
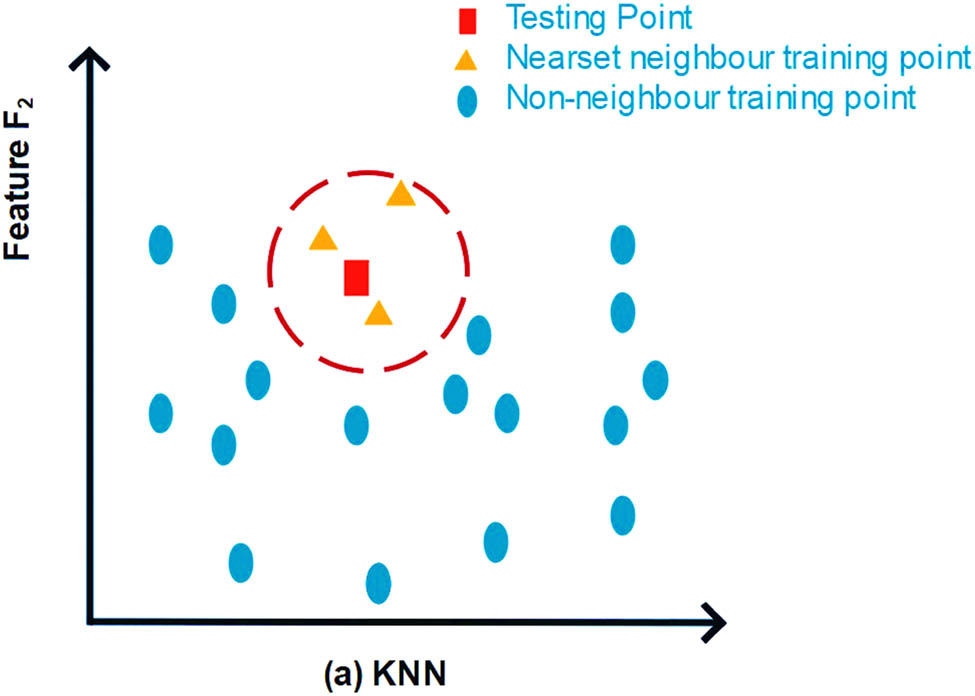
Schematic diagram of the KNN model.
One of the significant advantages of the KNN algorithm is its robustness against noise in the training data. Because KNN bases its predictions on multiple neighboring data points, it is less likely to be skewed by noisy or outlier data. This resilience makes KNN particularly effective for handling large datasets where noise is more prevalent, ensuring more reliable predictions even in complex data environments.
3.2.4 ANN
ANNs are sophisticated systems composed of interconnected nodes, known as artificial neurons, which operate in parallel to solve complex problems [108–110]. ANNs are designed to emulate how the human brain processes information and are modeled after the structure and function of biological neural networks. These networks consist of numerous neurons that are connected in a way that mimics the architecture of biological neural systems [111]. The neurons are arranged into multiple layers, reflecting the brain’s hierarchical organization.
A prevalent type of neural network is the feedforward neural network, which generally comprises three primary layers: Input layer: This layer receives external data necessary for identifying patterns. Hidden layer: This intermediate layer processes the inputs and serves as the bridge between the input and output layers. Output layer: This layer produces the final prediction or response based on the processed data. The neurons in these layers are interconnected by directed arcs, which link neurons from one layer to those in adjacent layers. ANNs learn from data through a training process where the weights of the neurons are adjusted based on the discrepancy between the predicted output and the actual results. This process, known as backpropagation, involves iteratively modifying the weights to minimize the error and improve prediction accuracy [112–114]. Figure 13 provides a detailed view of an ANN’s architecture, showcasing how its various components and layers collaborate to address complex problems.
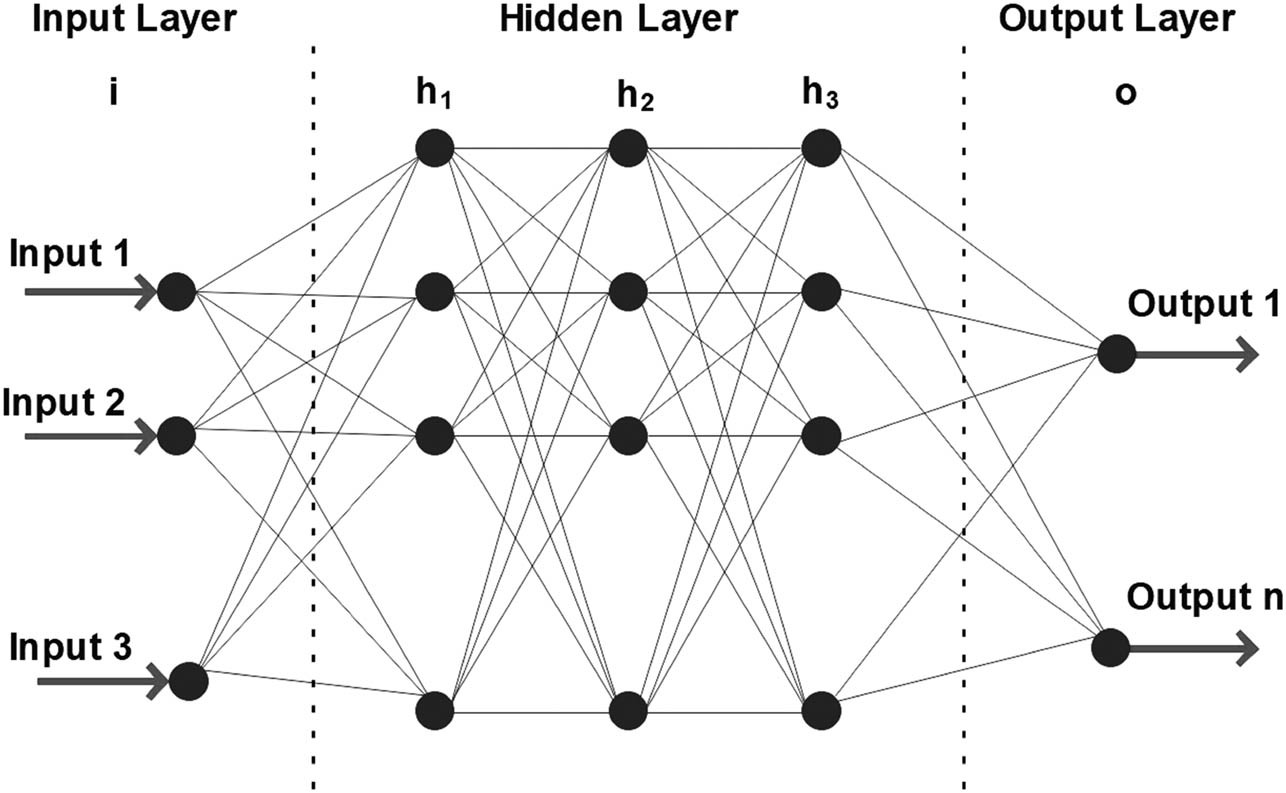
Schematic diagram of the ANN approach.
3.2.5 Tuning of hyper parameters
A crucial component of ML is the fine-tuning of hyper parameters. The tuning of parameters can greatly affect the effectiveness and performance of models [115–117]. An ML model’s behavior during training is determined by its hyperparameters and, thus, programmable parameters. The number of hidden layers, batch size, learning rate, and other variables are among them. Accurate prediction of results, good generalization to new data, and more efficient training can all be significantly improved by properly tuning these hyper parameters [116]. Moreover, it is the process of determining the ideal parameter configuration for a given model and dataset through methodical search and optimization methods. This procedure is essential to ensuring that the model performs to its highest capacity and yields solid and dependable results. The specific parameter adjustments made during this tuning process for the models are listed in Table 4.
Optimal tuning of models with hyperparameters
| MLA method | Parameters | Parameter range | Optimum parameter value |
|---|---|---|---|
| KNN | Algorithm | Auto, ball_tree, kd_tree, brute | Auto |
| Neighbors number | 3, 4, 5, 6, 7, 8, 9, … 20 | 7 | |
| Leaf size | 20, 21, 22, 23, 24, 25, … 50 | 25 | |
| Weight function | Uniform, distance | Distance | |
| XGB | Colsample_bytree | 0.5, 0.6, 0.7, 0.8,…, 1 | 0.8 |
| Learning rate | 0.01,0.02,0.03, …, 0.3 | 0.09 | |
| Gamma | 0, 0.1 | 0 | |
| Subsample | 0.5, 0.6, 0.7, …, 1 | 0.8 | |
| Min child weight | 1, 2, 3, 4, 5, 6, …, 1 | 1 | |
| n_estimators | 100, 200, 300, …, 200 | 200 | |
| ANN | Optimizer | SGD, Adam | Adam |
| Number of layers | 1, 2, 3, …, 5 | 2 | |
| Batch size | 0, 1, 2, 3, …, 150 | 32 | |
| Dropout rate | 0, 0.1, 0.2, …, 0.5 | 0.2 | |
| Activation function | Sigmoid, ReLU, Tanh | ReLU | |
| Number of neurons per layer | 0, 10, 20, …, 200 | 40 | |
| Number of epochs | 20–200 | 100 | |
| Learning rate | 0.001–0.01 | 0.001 | |
| LGB | Number of leaves | 31, 32, …, 128 | 48 |
| n_estimators | 100–1,000 | 250 | |
| Feature fraction | 0.6–1 | 0.6 | |
| Max depth | −1 (no limit)–15 | 12 | |
| Bagging frequency | 0–5 | 5 | |
| Learning rate | 0.01–0.3 | 0.08 | |
| Bagging fraction | 0.6–1 | 0.4 | |
| Min data in the leaf | 20–100 | 20 |
3.3 Statistical analysis
To evaluate the ML model designed for predicting ECC in composites, it is crucial to test it using a separate testing dataset. Performance metrics such as root mean absolute error (MAE), root mean square error (RMSE), and the coefficient of determination (R 2) are employed to assess how well the model performs on unseen data, ensuring the reliability of its predictions. These metrics are used to quantify the discrepancies between the predicted and actual values, with smaller differences resulting in higher accuracy of the model [118]. Lower values for RMSE and MAE signify better model performance, suggesting that the model’s predictions are close to actual outcomes, which is a positive indicator of its effectiveness. Additionally, an R 2 value close to 1 signifies that the model accounts for a high proportion of the variance in the data, reflecting its accuracy in capturing the underlying patterns. Table 5 presents the statistical measures applied in this study.
3.4 Uncertainty analysis
A crucial technique for evaluating and quantifying the uncertainty in the predictions produced by ML models is uncertainty analysis. It is crucial to take into account and control the uncertainties that may have an impact on the prediction algorithms when estimating the TSC of ECC. These ambiguities could result from input characteristics, experimental observations, or model outputs. By using uncertainty analysis, researchers can take into consideration the inherent unpredictability in the models and assess the validity of their predictions.
The uncertainty can be calculated using the following formula:
In the above equation, SD stands for the standard deviation, and “1.96” is the multiplier for the 95% confidence interval, assuming a normal distribution of prediction errors. This calculation provides an estimate of the range within which the prediction errors are expected to fall with 95% confidence, helping to gauge the accuracy and reliability of the model’s predictions.
3.5 K-fold cross-validation (CV)
K-fold CV is a widely used method for assessing a model’s ability to generalize to unseen data by testing it on different subsets of a dataset. As illustrated in Figure 14, the dataset is initially divided into two parts: a training set and a testing set. The testing set is reserved for final evaluation, where the model is tested on completely new data. In K-fold CV, the training set is further divided into K equal-sized subsets, known as “folds.” During each iteration, one fold is selected as the validation set, while the remaining K−1 folds are used to train the model. This process is repeated K times, with each fold taking a turn as the validation set. The model’s performance is averaged across all K iterations, providing a comprehensive assessment of its accuracy and ability to generalize beyond the training data. This iterative process ensures that every part of the dataset is used for both training and validation, reducing bias and providing a more reliable evaluation of model performance.
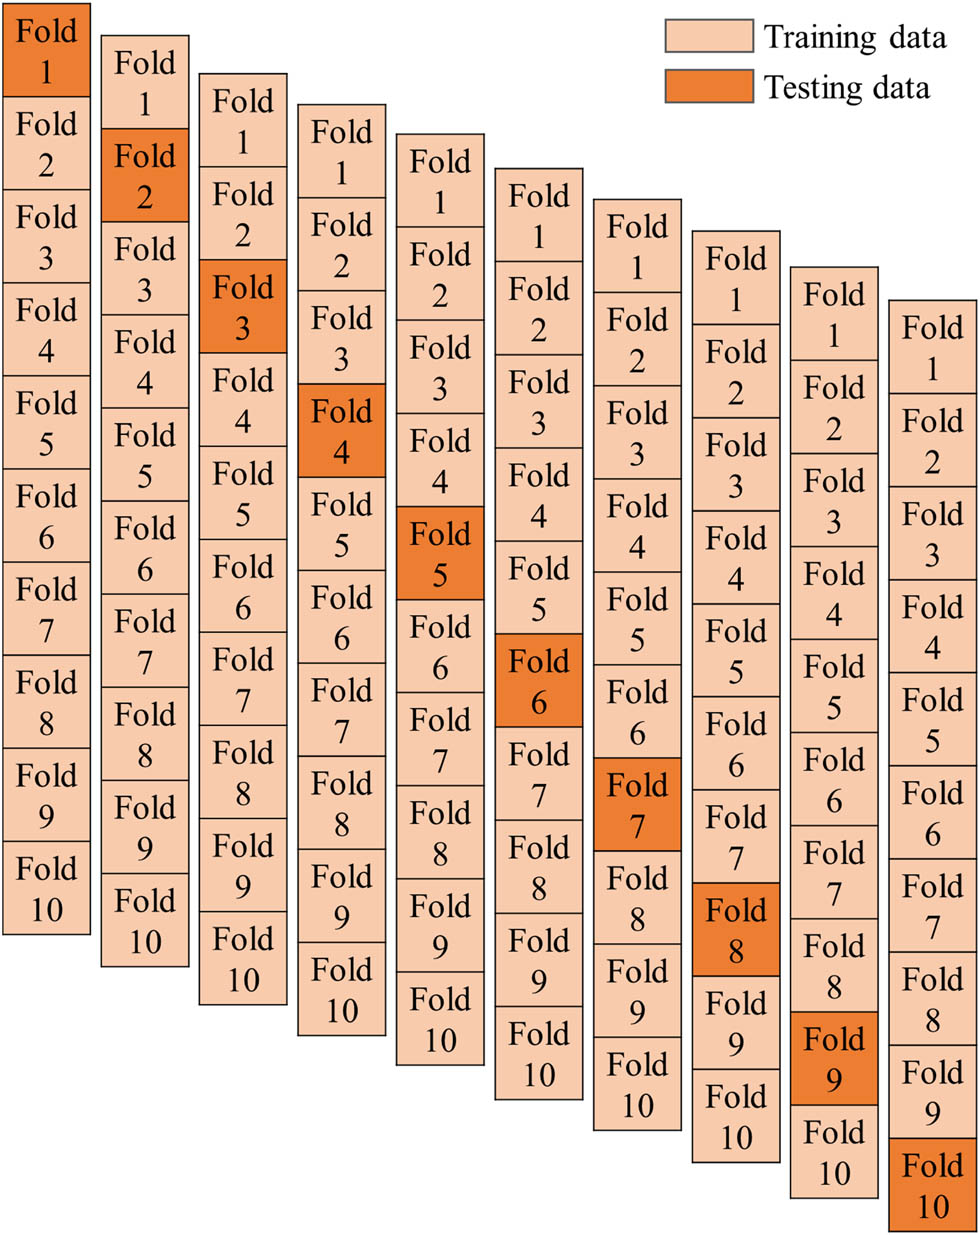
CV process for validation of the model.
4 Results and discussion
4.1 XGB
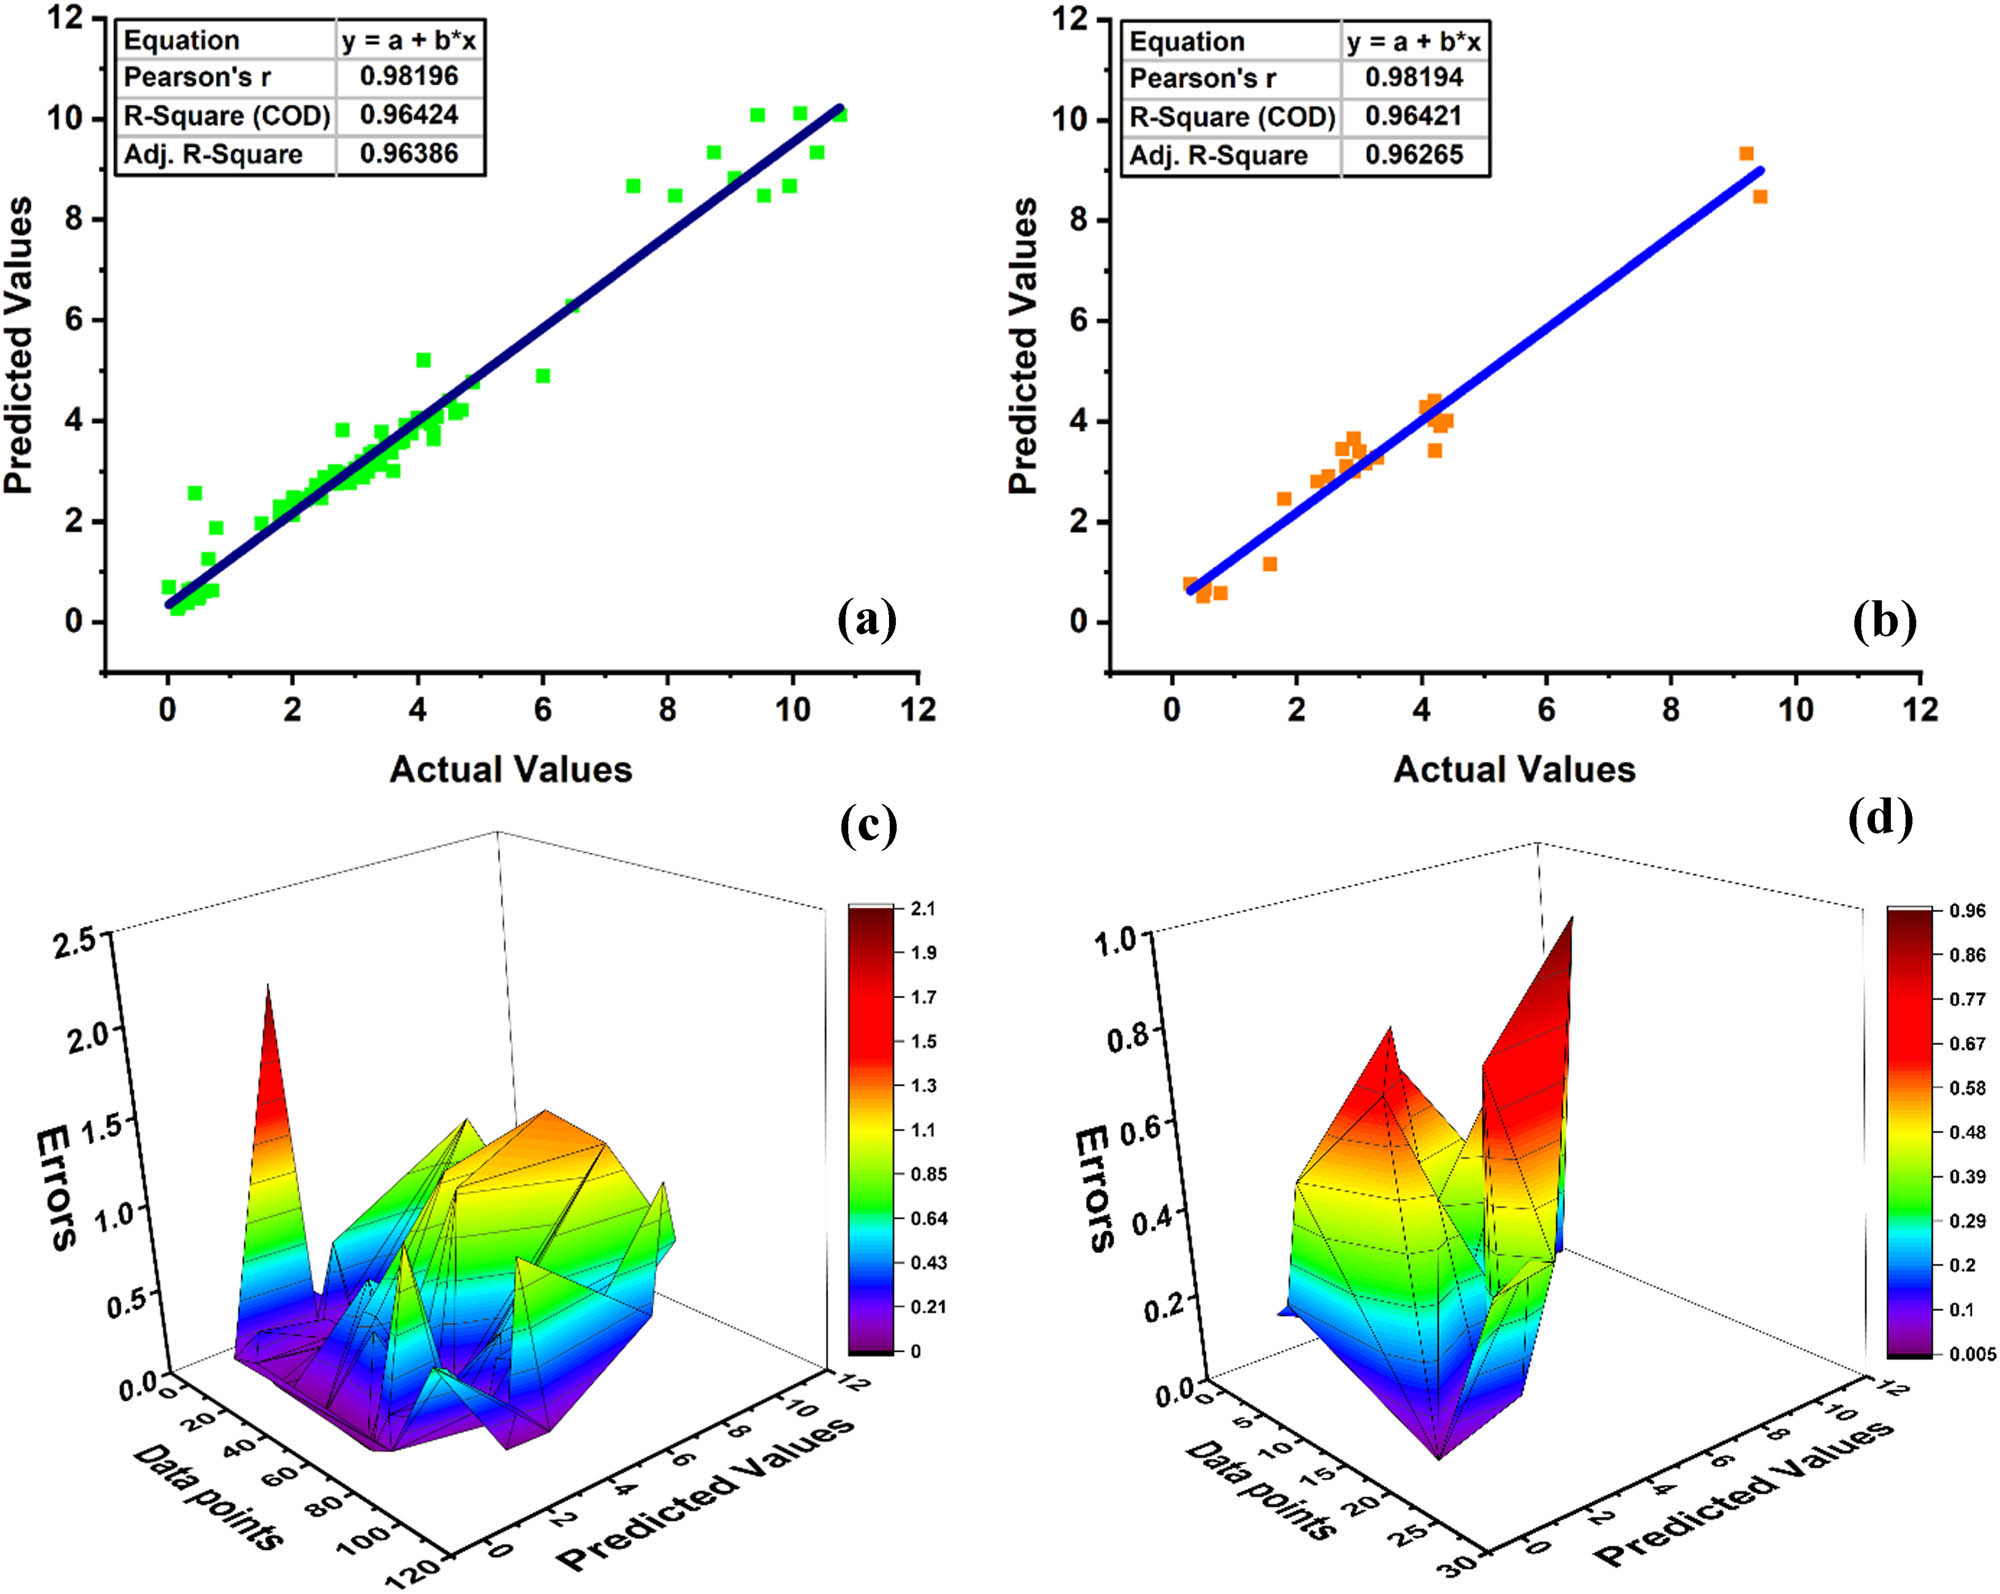
Regression slope is the most prominent tool for evaluating the efficacy of ML models. As shown in Figure 15, a regression plot displays the predicted values of the model on the vertical axis and the actual values on the horizontal axis. Regression slopes that are near 1 or >0.8 usually mean that the model’s predictions agree quite well with the observed data. As demonstrated in Figure 15(a) and (b), the XGB model shows a strong correlation with R 2 = 0.97 and 0.96 for the training and test sets, respectively, with improved accuracy and less variation between the predicted and experimental findings, as shown in Figure 15. Figure 15(b) shows the outcome of the XGB model with test data (20%). An R 2 score of 0.96 on the graph suggests a significant correlation with the outcome. After the model was assessed, the train and test sets were evaluated with discrepancies, as shown in Figure 15(c) and (d). It was discovered that the test model had a low degree of error, with the greatest error being 1.28 MPa; 100% of the testing results showed discrepancies smaller than 5 MPa. Consequently, this suggests that there is a high degree of agreement between the actual and projected values. The remarkable efficacy of the XGB model, as demonstrated by its R 2, can be attributed to multiple components innate to its algorithm. XGBoost performs exceptionally well because of its ensemble learning methodology, which combines the predictions of several DTs to boost resilience and accuracy. By gradually creating trees that fix the mistakes of earlier ones, this model effectively manages complicated, non-linear relationships inside the data, iteratively improving its forecasts in the process. In order to avoid overfitting and guarantee that the model performs well when applied to fresh, untested data, XGBoost also includes regularization algorithms. The great accuracy and correlation of the model can be attributed to its capacity to capture complex interactions between the many input features, including fibers, cement, and superplasticizers. All of these characteristics work together to improve the model’s ability to forecast the TSC of ECC with accuracy and consistency.
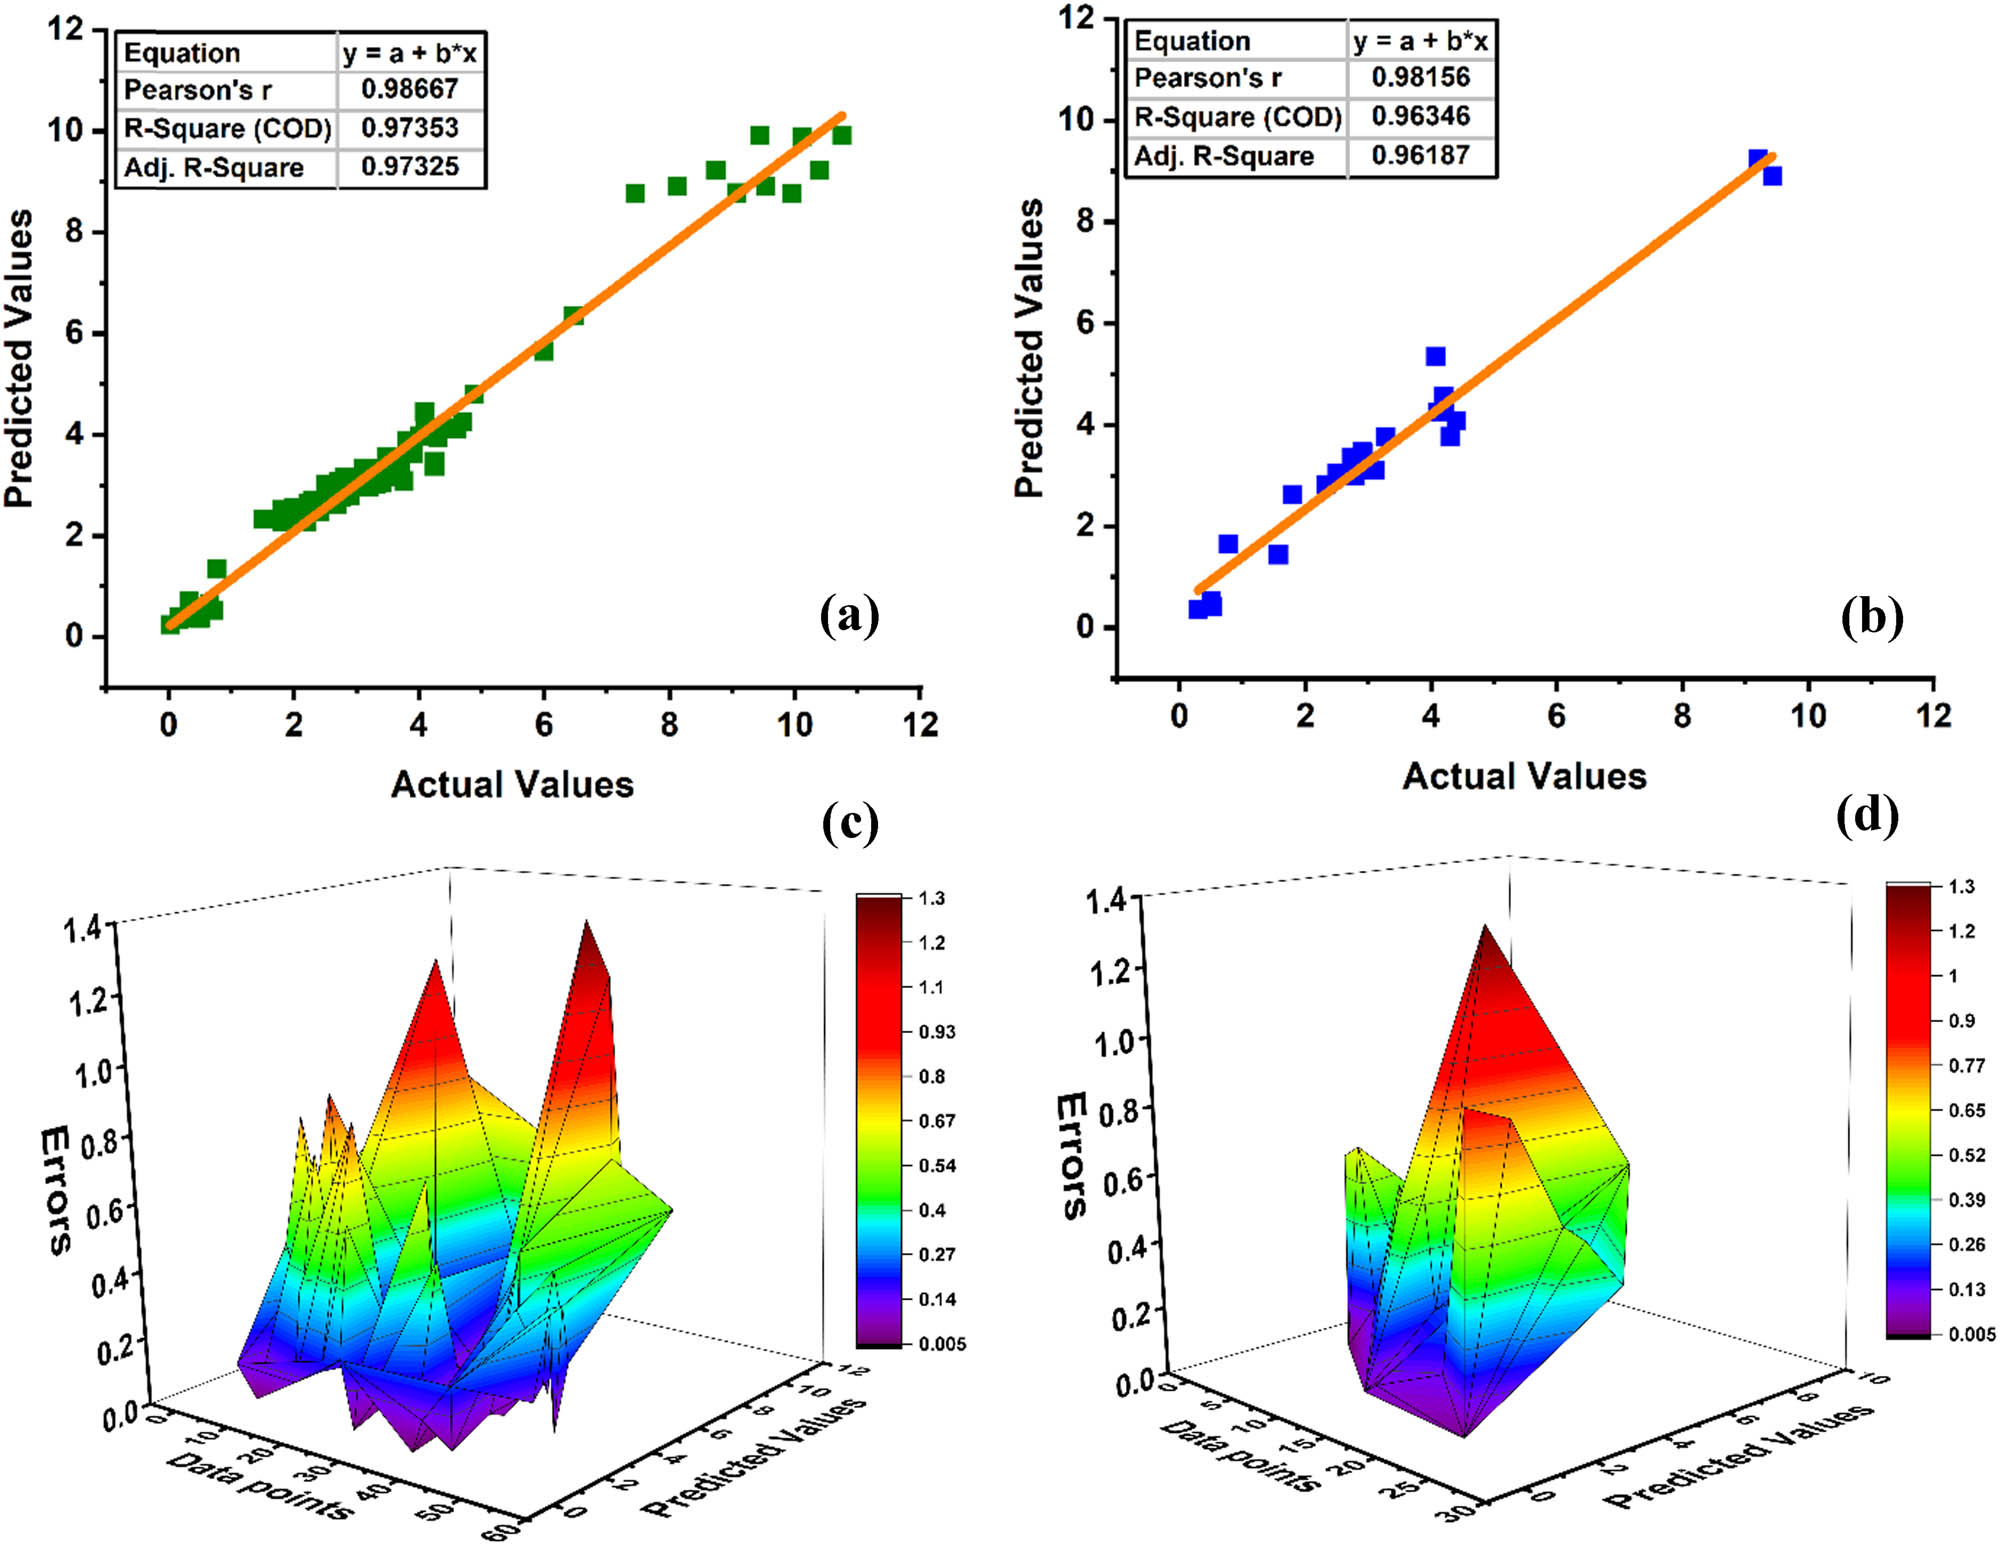
XGB model of ECC: (a) R 2 training, (b) R 2 testing, (c) training discrepancies, and (d) testing discrepancies.
4.2 LGB machine
The first phase involves training the model using a labeled dataset, where each data point is linked with its corresponding output. This process expressively boosts the model’s ability to recognize underlying patterns and relationships within the data, thus allowing it to make more accurate predictions. By learning from these patterns, the model improves its overall performance and improve capacity to detect and address potential inaccuracies or shortcomings in its predictions. This step is crucial for refining the model’s predictive power and ensuring it can reliably handle real-world data. It is especially useful for forecasting complex properties like the TSC of ECC because the LGB model is built to handle big datasets with high-dimensional features effectively. The model’s ability to perform leaf-wise tree growth, where it splits the leaf with the highest loss reduction. Thus, it leads to more precise predictions by focusing on the most significant splits. The model is able to identify intricate patterns in the training set by using this technique, which contributes to its high R 2 score of 0.97, as depicted in Figure 16(a). It is important to emphasize that strong correlations (R 2) observed within the training set do not necessarily ensure reliable outcomes when the model is applied to new, unseen data. This issue often arises when the model becomes overly complex and over fits the training data. Therefore, it captures noise or irrelevant patterns rather than generalizable relationships. As illustrated in Figure 16(b), assessing the model’s performance on entirely new data is essential for determining its ability to generalize and apply learned knowledge to unfamiliar situations. This step is critical for avoiding overfitting and ensuring the model’s robustness in real-world applications. The analysis shows how the predicted outcomes of the model relate to the empirical findings of ECC made from different combinations. The model’s 0.93 correlation score indicates that it has a respectable degree of prediction accuracy, as shown in Figure 16(b). The model catches the underlying patterns well, but it also strikes a reasonable balance between fitting the training data and generalizing to new, unseen data, as evidenced by the expected modest decline in accuracy from the training to the test set. Thus, the model is trustworthy for use in real-world scenarios and does not overfit the training set. Figure 16(c) and (d) shows the empirical point scattering from various mixtures in relation to the model-generated forecasts. The errors of the test model were determined to be dispersed with a maximum error of 2.30 MPa, a minimum error of 0.02 MPa, and an average error of 0.40 MPa after the test set was analyzed.
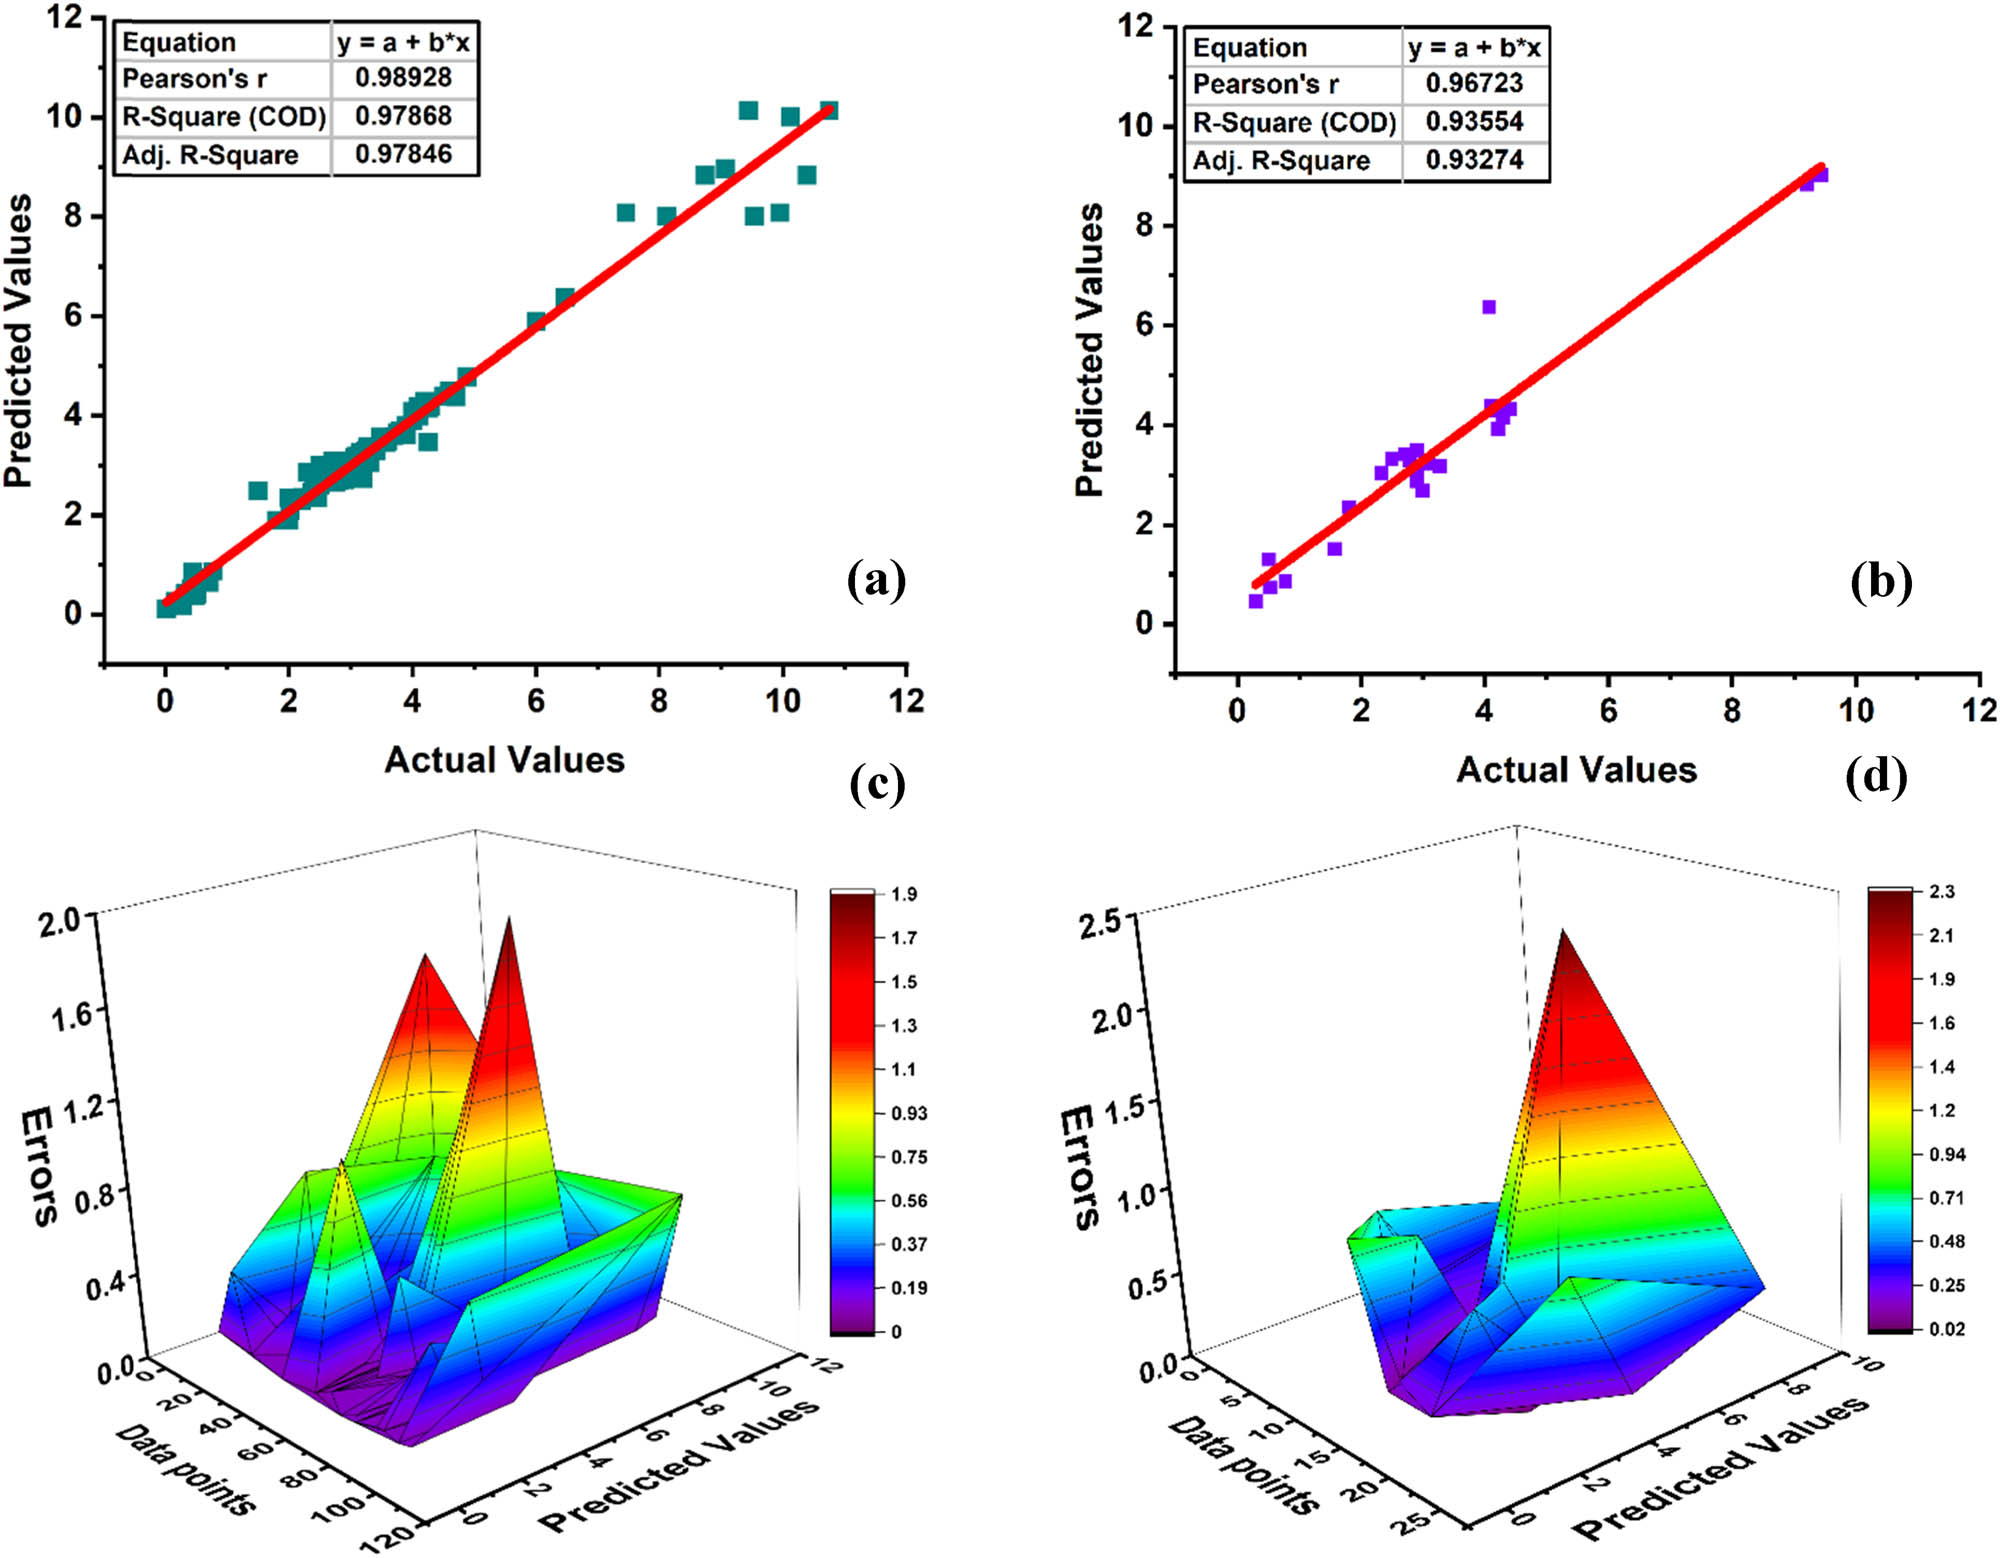
LGB model of ECC: (a) R 2 training, (b) R 2 testing, (c) training discrepancies, and (d) testing discrepancies.
4.3 KNN
Unlike XGBoost and LightGBM, which are ensemble methods that rely on multiple DTs and complex algorithms, KNN is a simpler, instance-based learning algorithm. KNN works by comparing new data points to the closest data points in the training set, therefore making predictions based on the similarity to these neighbors. This method allows KNN to provide strong correlations, particularly when the dataset has well-defined clusters or regions of similar values. As shown in Figure 17, the performance of the KNN model was evaluated on a dataset of ECC-based concrete. This was done by using an 80/20 split ratio between the training and testing sets. This approach is widely adopted, as it confirms that the majority of the data are used for training, while a portion is reserved for testing. Consequently, it allows for reliable model evaluation. Training data refers to the dataset used to teach the model to identify patterns and relationships. The testing data are used to assess how well the model performs on unseen information. It is also reported that understanding this distinction is crucial for evaluating the model’s generalization ability. Figure 17(a) highlights the strong relationship between the observed and predicted results for the training set, with a high coefficient of determination (R 2 = 0.94). During training, KNN identifies complex patterns within the data and refines its predictions by learning from errors and improving its accuracy. Figure 17(b) shows the performance of the KNN model on the test set, achieving an R 2 value of 0.92. While slightly lower than the training set, this strong R 2 value suggests that KNN effectively captures local patterns in the data. However, its performance is slightly inferior to XGBoost and LightGBM. KNN is more sensitive to local structures and lacks the capability to model complex interactions or feature importance as effectively as gradient boosting methods. The strength of KNN lies in its ability to provide stable and consistent predictions without overfitting, as reflected in the close R 2 values for both the training (0.94) and test sets (0.92). This balance indicates that KNN generalizes well across different data samples. Thus, it makes it a dependable model for predicting the TSC in ECCs, particularly when dealing with simpler relationships in the dataset. Figure 17(c) displays the bias in the training set, showing how errors are distributed. It is essential to recognize the risk of overfitting, where a model becomes overly complex and captures random noise rather than focusing on core patterns. This can lead to poor performance when applied to new data. Preventing overfitting requires finding an appropriate balance between model complexity and generalization. Figure 17(d) visualizes the error distribution in the test set, with an average error, minimum, and maximum error of around 0.449, 0.04, and 1.75 MPa. Hence, this indicates that KNN maintains consistent performance across both training and test sets with minimal error variation.
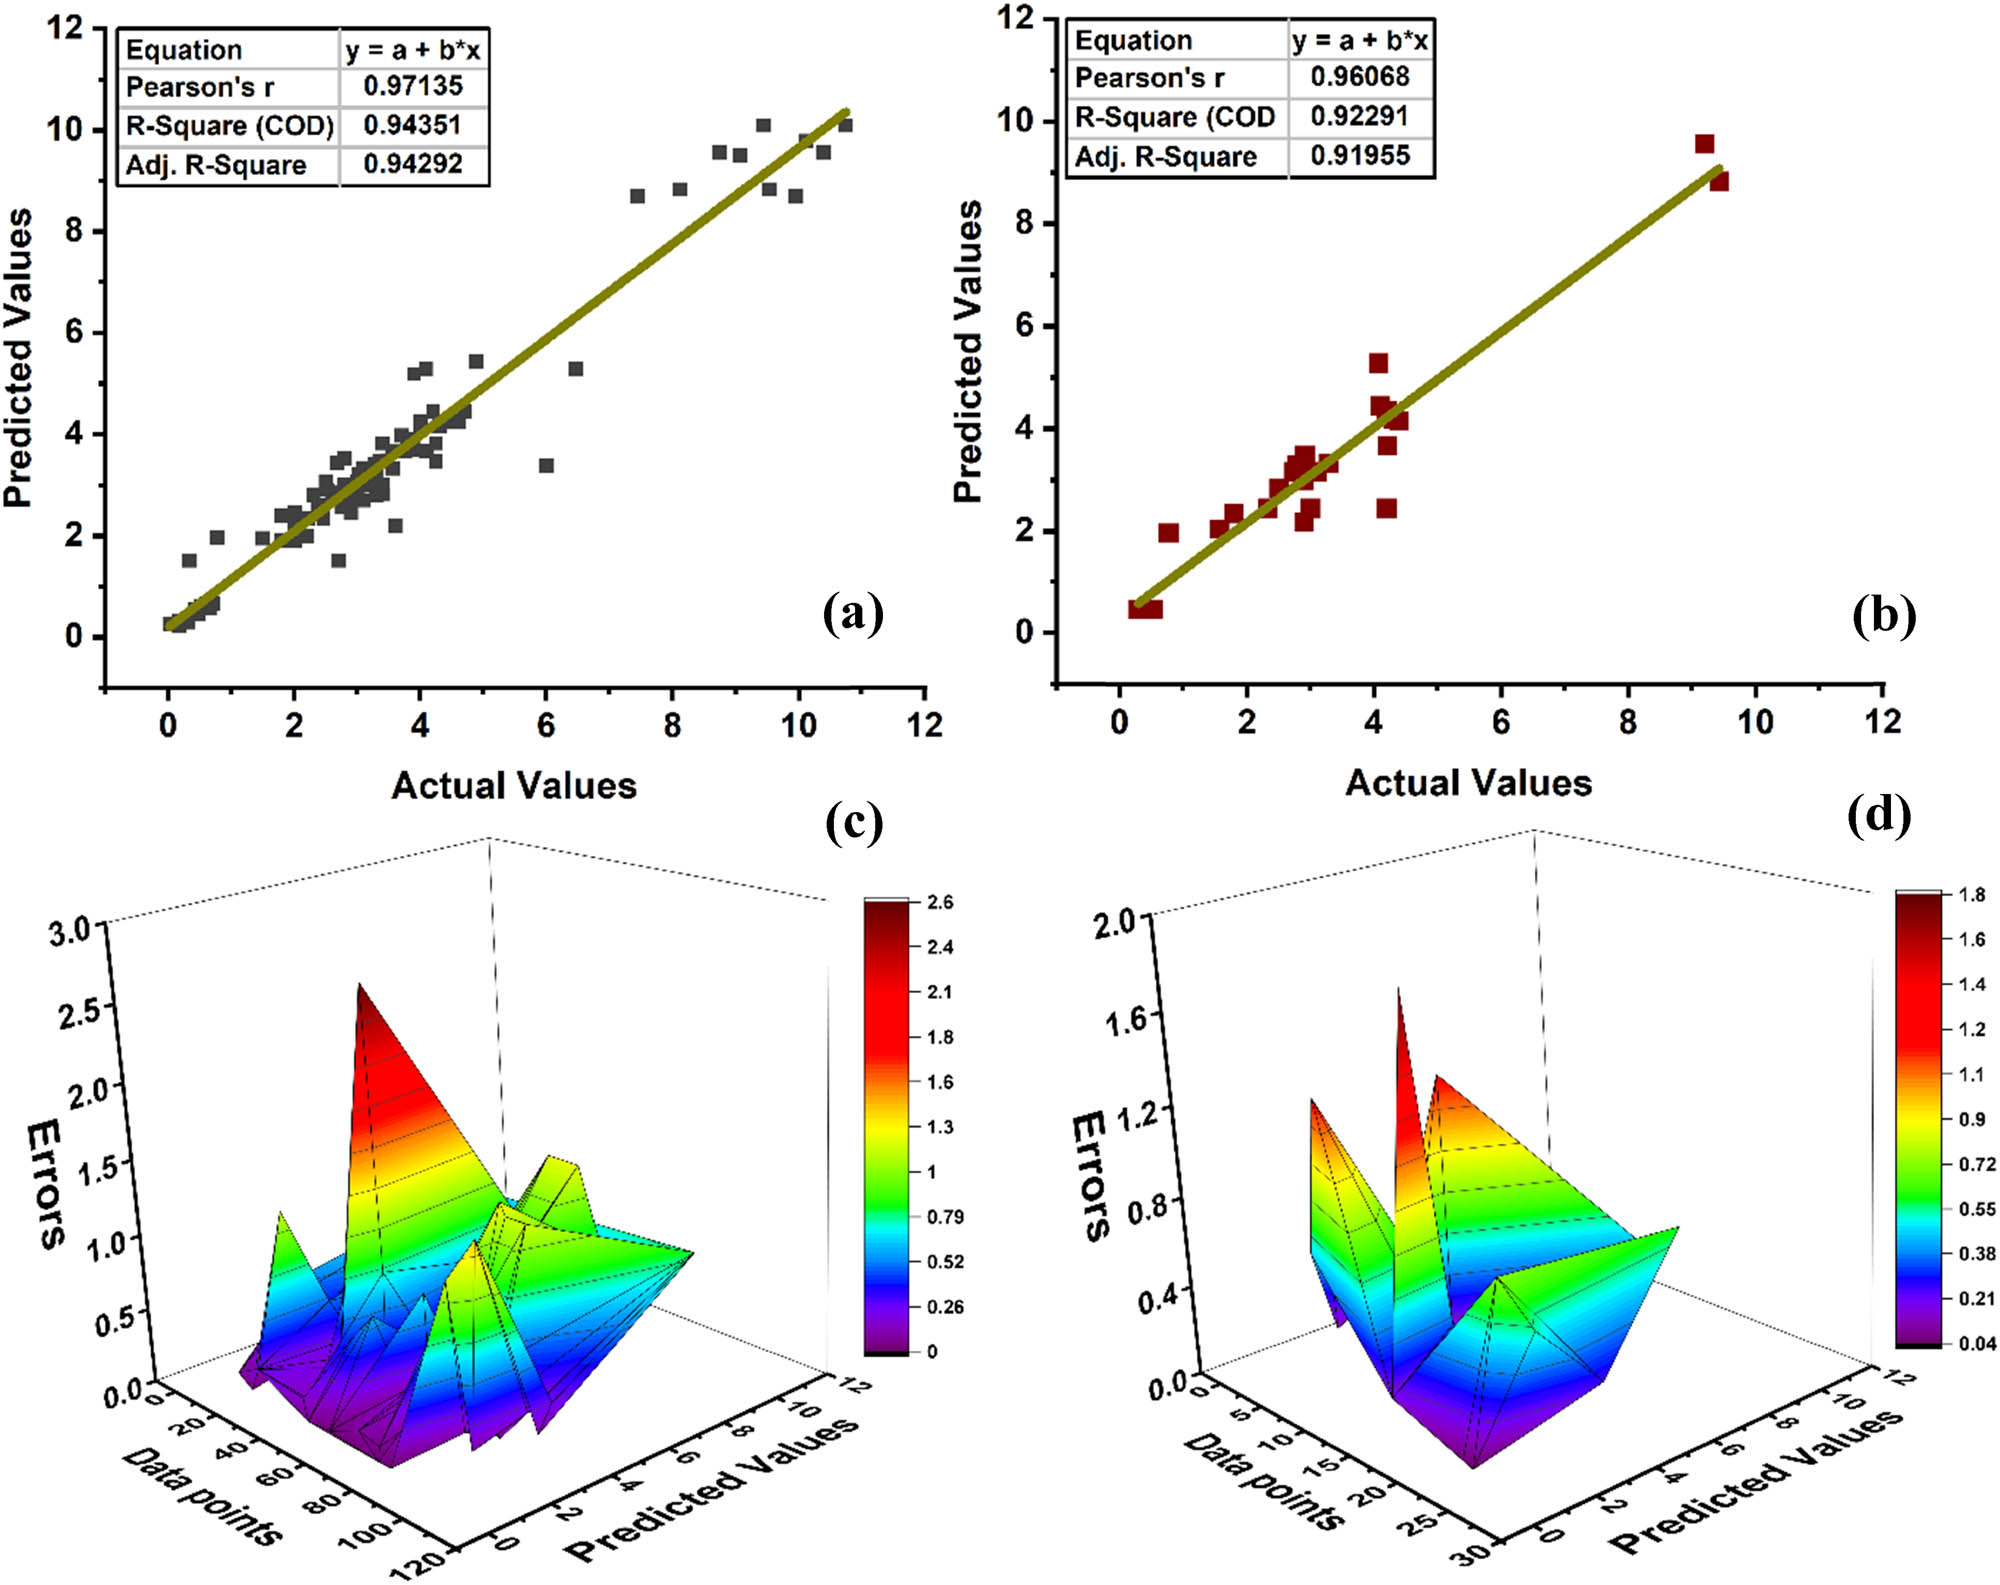
KNN model of ECC: (a) R 2 training, (b) R 2 testing, (c) training discrepancies, and (d) testing discrepancies.
4.4 ANN
The ANN model exhibits a strong correlation for both the training and test sets, with R 2 values of 0.96 for each, as depicted in Figure 18(a) and (b). Therefore, it reflects the robust performance in predicting the TSC of ECC. Neural networks, a type of supervised learning in artificial intelligence, are particularly effective at modeling complex, non-linear relationships in data. This capability makes ANN well-suited for predicting mechanical properties such as concrete CS, especially when incorporating advanced materials like PVA fibers and SCM. The consistent R 2 values across both training and test sets demonstrate the ANN’s ability to generalize well to new data, avoiding overfitting while maintaining high prediction accuracy. Similar to other models like XGB, LGB, and KNN, the multi-layer perceptron neural network (MLPNN) was developed using supervised ensemble algorithms, as illustrated in Figure 18. The MLPNN allows it to integrate multiple layers of neurons, each processing the data iteratively to improve prediction accuracy. This structure enhances the model’s capability to learn from complex datasets and provides a reliable prediction of target responses, such as TSC, in ECC. Consequently, the ANN model’s high accuracy and generalization ability make it a powerful tool for predicting mechanical properties in advanced concrete formulations. Additionally, Figure 18(c) and (d) illustrates the distribution of colored data points representing discrepancies between actual empirical observations and the predictions made by the ANN model across various combinations. These discrepancies reflect how the model’s predictions deviate from real-world data. For individual samples, the average discrepancy is 0.34 MPa, with a minimum value of 0.0095 MPa and a maximum of 0.95 MPa. The figures also provide a statistical breakdown of the error differences of testing sets. Therefore, highlighting the variance in model performance (as shown in Figure 18(d)).
ANN model of ECC: (a) R 2 training, (b) R 2 testing, (c) training discrepancies, and (d) testing discrepancies.
4.5 Performance metrics of ML models
The accuracy of a predictive model is often determined through a variety of performance metrics, including the coefficient of determination (R 2), RMSE, and MAE. These metrics provide a quantitative assessment of how well the model’s predictions align with the observed data by analyzing the deviations between predicted and experimental values. Table 6 provides a comprehensive summary of these performance metrics for each of the approaches used in the study, offering a detailed comparison of their effectiveness. Additionally, Figure 19 presents a radar chart that visually consolidates the performance of all models, highlighting their respective error values across different dimensions. This visual representation allows for a clearer understanding of each model’s strengths and weaknesses, facilitating a more informed evaluation of their predictive capabilities.
Assessment of the models with statistical measures
| Methods | XGB | LGB | KNN | ANN |
|---|---|---|---|---|
| Training response | ||||
| R 2 | 0.974 | 0.979 | 0.943 | 0.964 |
| RMSE | 0.394 | 0.371 | 0.564 | 0.464 |
| MAE | 0.284 | 0.206 | 0.374 | 0.293 |
| Testing response | ||||
| R 2 | 0.963 | 0.936 | 0.923 | 0.964 |
| RMSE | 0.49 | 0.611 | 0.607 | 0.433 |
| MAE | 0.382 | 0.407 | 0.449 | 0.348 |
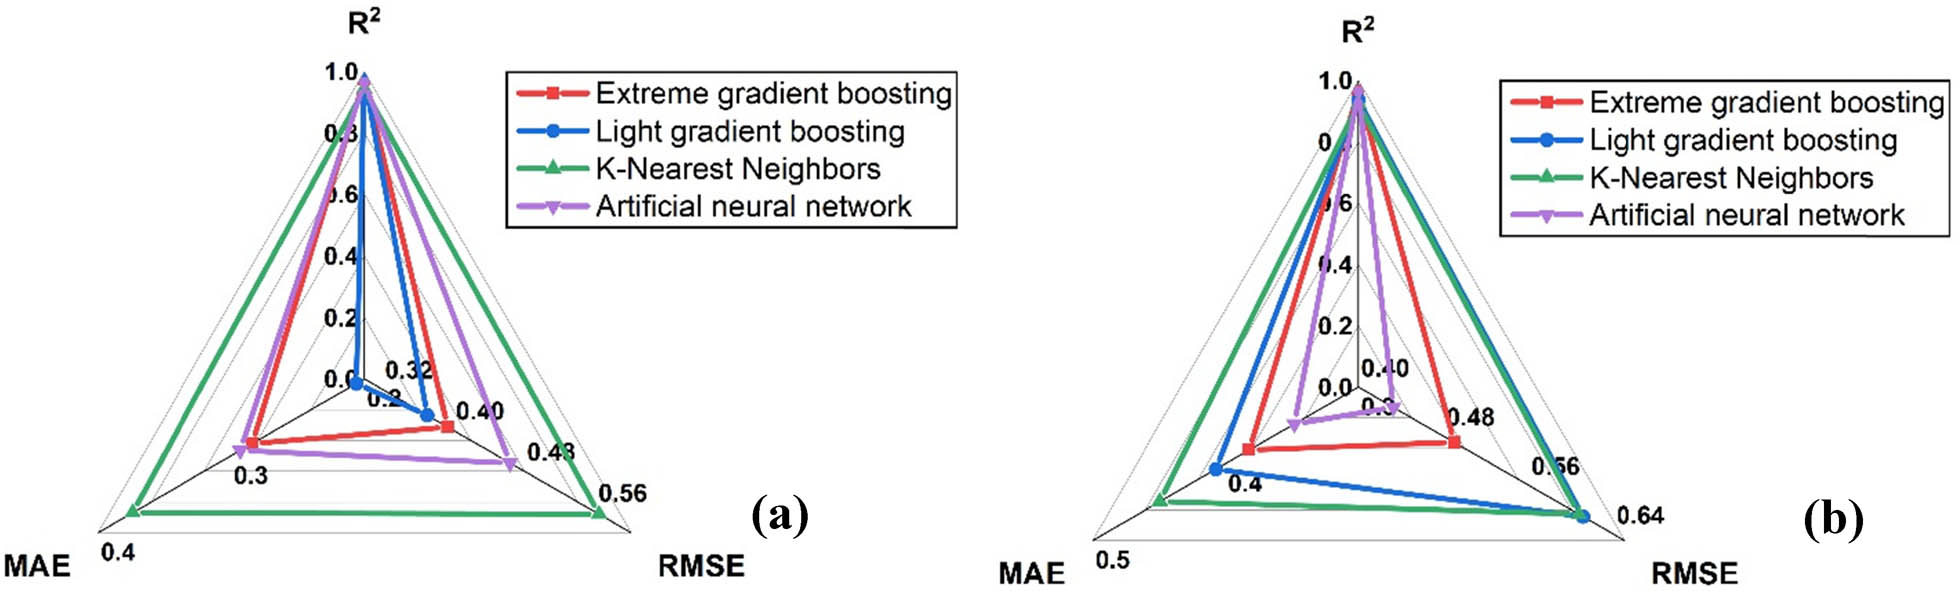
Model assessment: (a) train and (b) test.
4.6 Uncertainty analysis
Uncertainty analysis is essential to resolve the inherent ambiguity in models used to forecast the TSC of ECC. For assessing the robustness and dependability of prediction models, this kind of analysis is essential. Figure 20 shows the outcomes of the uncertainty analysis for the nanocomposite models’ training and testing stages. The results indicate that the XGB, LGB, KNN, and ANN models have, respectively, uncertainty percentages for the training and testing sets of 4.52, 4.25, 4.43, 4.4, 4.78, 4.49, 4.76, and 4.41%. The XGB model consistently outperforms the other models in terms of noise reduction and overfitting prevention. Additionally, Amlashi et al. [122] proposed that model uncertainty should remain below the 35% threshold, making our findings particularly noteworthy. Since the models in this study show uncertainty levels well below 5%, our findings are very interesting, as uncertainty should remain below the 35% threshold. This suggests that these models have reliable and strong performance.
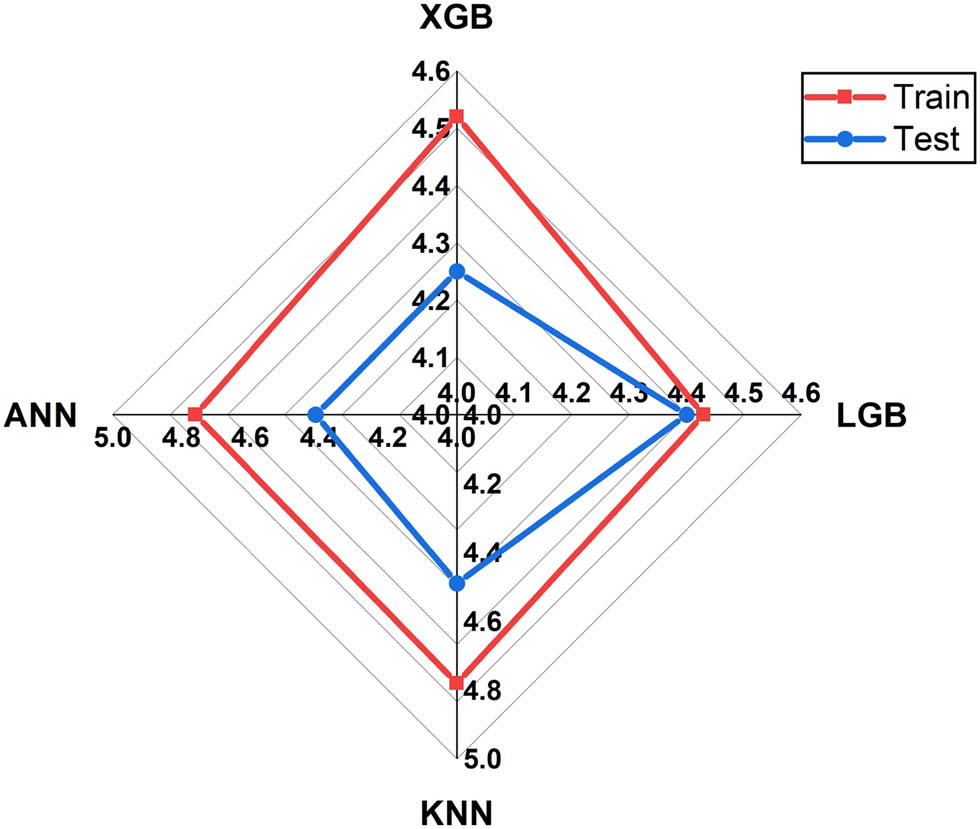
Model uncertainty analysis.
4.7 K-fold CV
By splitting the entire dataset into ten groups, this method is very useful in ML because it minimizes overfitting, improves generalization, and lowers variance. One of these ten subsets is set aside for validation, while the other nine are used for training. Larger R-squared (R 2) values with lower error metrics, such as MAE and RMSE, are utilized to assess the model’s accuracy. The iterations of CV produced a rigorous analysis that ensured data accuracy and aided in accurate decision-making. The models attained a noteworthy degree of precision as a consequence of this meticulous process. The comprehensive validation study of the models is shown in Figure 21, which again emphasizes the decrease in average errors and the improvement in correlation. By using this 10-fold CV technique, each model’s performance has improved dramatically and shown a robust reaction across all measures.
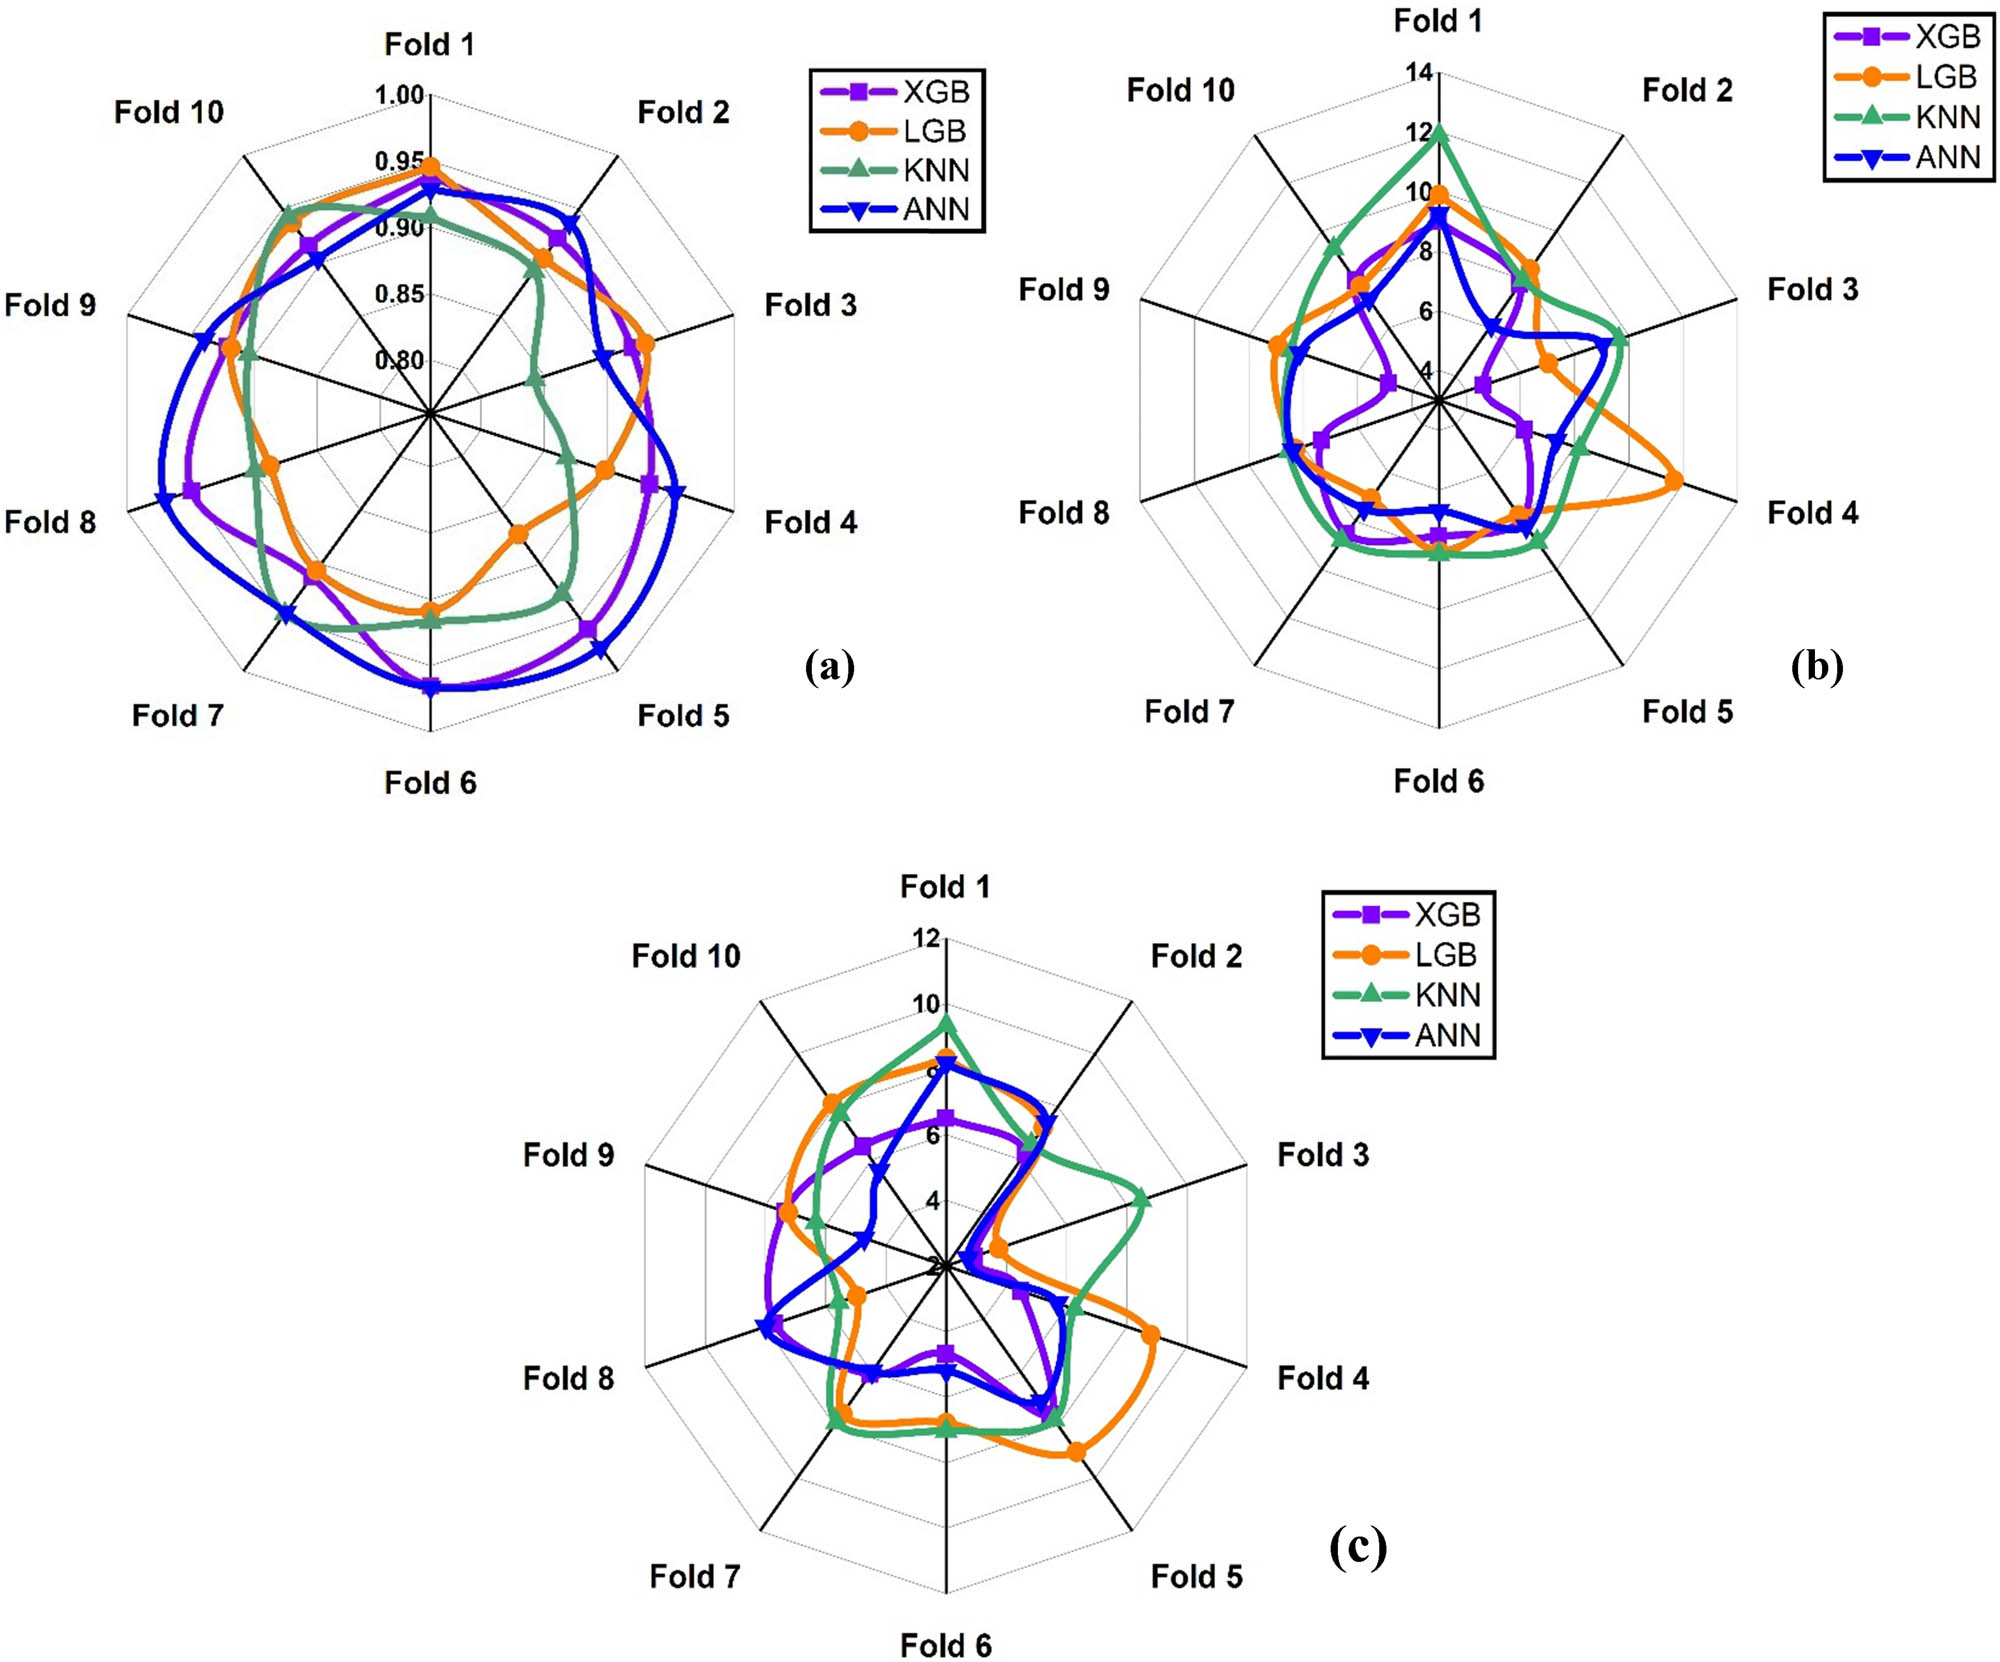
Validation result: (a) R 2, (b) RMSE, and (c) MAE.
4.8 Feature importance
Feature importance analysis is a crucial step in ML and predictive modeling because it helps identify which input variables (features) have the most significant impact on the model’s predictions, as illustrated in Figure 22. Understanding feature importance allows researchers and practitioners to gain insights into the underlying relationships in the data, prioritize the most influential features, and potentially simplify models by focusing on the most relevant inputs. In the context of ECC, the feature importance analysis conducted has revealed that fiber diameter has the highest importance, followed by cement, FA, superplasticizer, sand maximum size, sand content, age, water-to-binder ratio, fiber content, and fiber length. Fiber diameter likely has the highest importance because it directly influences the mechanical properties of ECC, particularly tensile strength and ductility. Thinner fibers can bridge cracks more effectively, enhancing the strain capacity and overall toughness of the concrete. This improved crack-bridging capability allows the material to withstand greater strain without failing, making fiber diameter a key factor in the performance of ECC. In addition, cement is a fundamental component in concrete that significantly affects its CS and durability. Cement is responsible for the hydration process that leads to the development of a strong, cohesive microstructure. The amount and quality of cement directly influence the CS and durability of the concrete. FA is used to partially replace cement, offering benefits like improved workability, reduced heat of hydration, and enhanced long-term strength. It also contributes to a denser and more durable concrete matrix by filling voids and contributing to the pozzolanic reaction. FA’s role in improving the workability and long-term performance of ECC explains its importance in feature analysis. In ECC, maintaining a low water-to-binder ratio is critical for achieving high strength, and superplasticizers enable this by enhancing the fluidity of the mix without compromising strength. Moreover, the maximum size of sand particles and their content in the mix influences the packing density and overall texture of the concrete. Smaller particles can fill gaps more effectively, leading to a denser and more homogeneous material, which is important for the strength and durability of ECC. Although fiber content and length also affect toughness and crack resistance, their impact is more specific to distribution within the matrix, making fiber diameter the most significant feature in the analysis.
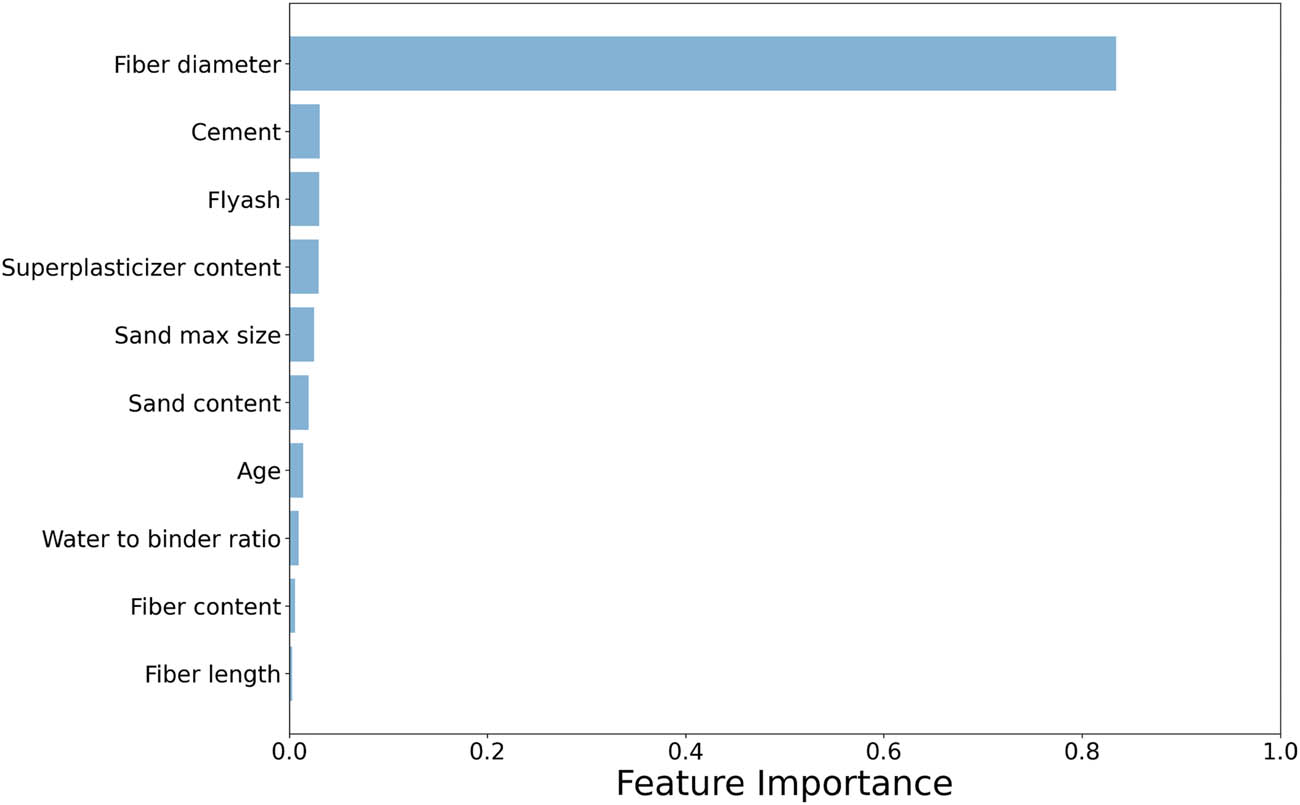
Parametric influence on ECC.
4.9 GUI
This section explains the creation of an intuitive GUI that makes it easier to anticipate and analyze the strength of the TSC of ECC, as illustrated in Figure 23. Researchers may easily enter the nine critical variables that affect the properties of ECC owing to the GUI’s toolbar, input area, and output section. Users can access anticipated values quickly by just putting these variables into the input boxes given and choosing the “Predict” button found in the output area. Engineers may create concrete designs that are specifically customized to the demands of construction projects with the help of this specialized GUI. In order to facilitate effective analysis and prediction of the TSC of ECC, this tool is meant to assist researchers in making the most of the suggested model in their work. Therefore, it provides a practical solution for their experimental and analytical needs.
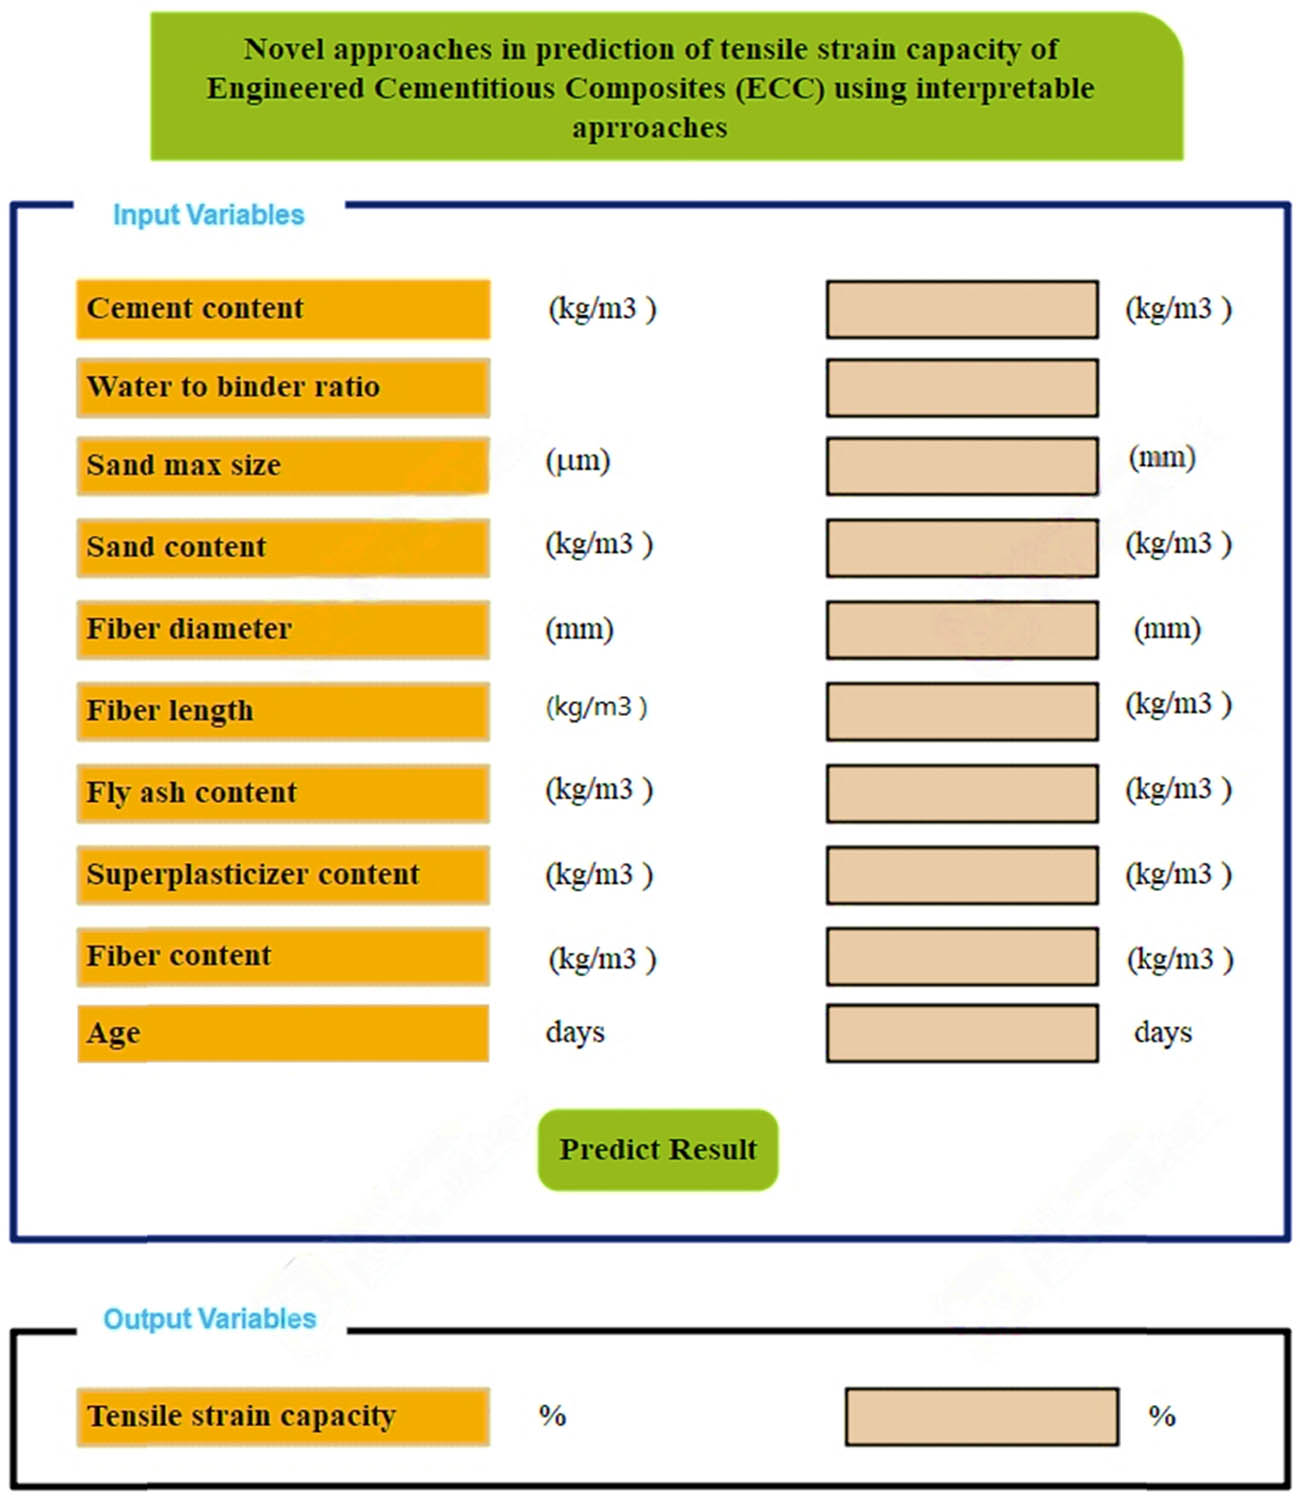
GUI of ECC.
5 Conclusions
The TSC of ECC is forecasted by ML approaches. XGB, ANN, LBG, and KNN approaches are employed on 122 specimens taken from the published literature. Key parameters were selected to predict the TSC, and feature importance, statistical measures, and uncertainty analysis were performed. Moreover, the following conclusions are drawn as listed:
XGB, ANN, LGB, and KNN models are employed in which ANN and XGB models perform well in terms of training and testing set. The ANN and XGB model depicts R 2 for training sets of about 0.964, and 0.974, respectively. Similarly, the train set gives R 2 of about 0.964 and 0.963, respectively. This shows the superior performance of the ANN and XGB models.
Assessment of the models is evaluated by conducting statistical errors. The ANN model depicts RMSE for train and test sets of about 0.464 and 0.433 MPa. In addition, XGB models show 0.394 and 0.49 MPa for train and test sets. Similarly, the MAE of XGB and ANN also shows lesser discrepancies. Thus, all models perform well by showing minimal errors.
The 10-fold technique was evaluated for each model using the MAE, RMSE, and R 2 statistical analysis. The 10-fold CV confirmed that XGB and ANN have the best performance by showing fewer errors and a greater correlation of determination.
Feature analysis of ECC shows that the fiber diameter, cement, and FA as SCMs play a vital role in the overall prediction of TSC of ECC. The increase in strength is mainly due to the load transfer mechanism, increased area of fibers, and hydration process with filling of pore sizes.
GUI is developed for the TSC of ECC by using python anaconda software that will facilitate the users to estimate the strength of ECC in practical applications.
6 Limitations and future work
Although this study offers insightful information about how to use SCMs to improve the properties of concrete, there are still a number of drawbacks and opportunities for further research. One key limitation is the variability in the reaction rates and setting times of SCMs, which can lead to challenges in achieving early strength development and managing construction schedules. Additionally, the availability and quality of SCMs can differ significantly based on the geographic location and source, potentially impacting the consistency and performance of concrete mixes. The study also highlights the need for more comprehensive research into the interactions between SCMs and other concrete components, such as admixtures, to optimize mix designs and ensure compatibility. Future work should focus on addressing these limitations by exploring alternative SCMs with improved reactivity, developing standardized guidelines for their use in various construction scenarios, and conducting long-term performance studies to better understand their impact on concrete durability. Further research could also investigate the economic implications and environmental impact of SCMs to provide a more holistic view of their benefits and challenges. By addressing these areas, future studies can contribute to advancing the practical application of SCMs in concrete and enhancing the overall quality and sustainability of construction practices.
-
Funding information: The authors state no funding involved.
-
Author contributions: All authors have accepted responsibility for the entire content of this manuscript and approved its submission.
-
Conflict of interest: The authors state no conflict of interest.
-
Data availability statement: The datasets generated and/or analyzed during the current study are available from the corresponding author on reasonable request.
Annexure A
| Cement | Flyash | Water to binder ratio | Sand max size | Sand content | Superplasticizer content | Fiber content | Fiber length | Fiber diameter | Age | Tensile strain capacity |
|---|---|---|---|---|---|---|---|---|---|---|
| 375 | 825 | 0.26 | 200 | 432 | 5.52 | 26 | 12 | 39 | 28 | 2.9 |
| 375 | 825 | 0.26 | 200 | 432 | 5.04 | 26 | 12 | 39 | 28 | 2.8 |
| 375 | 825 | 0.26 | 425 | 432 | 4.8 | 26 | 12 | 39 | 28 | 2.4 |
| 375 | 825 | 0.26 | 600 | 432 | 4.44 | 26 | 12 | 39 | 28 | 1.5 |
| 222 | 978 | 0.26 | 200 | 432 | 5.04 | 26 | 12 | 39 | 28 | 4.1 |
| 222 | 978 | 0.26 | 425 | 432 | 4.8 | 26 | 12 | 39 | 28 | 4.2 |
| 222 | 978 | 0.26 | 425 | 432 | 5.04 | 26 | 12 | 39 | 28 | 4.7 |
| 375 | 825 | 0.26 | 425 | 432 | 5.16 | 26 | 12 | 39 | 28 | 3.2 |
| 472 | 755 | 0.27 | 300 | 444 | 10.8 | 26 | 8 | 39 | 28 | 1.8 |
| 472 | 755 | 0.27 | 300 | 444 | 10.8 | 26 | 12 | 39 | 28 | 2 |
| 570 | 684 | 0.3 | 300 | 455 | 5.7 | 28.6 | 12 | 39 | 28 | 0.77 |
| 570 | 684 | 0.56 | 250 | 456 | 6.84 | 29 | 8 | 39 | 28 | 2.9 |
| 570 | 684 | 0.56 | 250 | 456 | 6.84 | 29 | 8 | 39 | 28 | 3.6 |
| 232 | 1019 | 0.26 | 250 | 450 | 4.3 | 26 | 12 | 39 | 28 | 2.68 |
| 382 | 890 | 0.25 | 250 | 462 | 15.3 | 26 | 8 | 40 | 28 | 3.2 |
| 382 | 763 | 0.25 | 250 | 462 | 15.3 | 26 | 8 | 40 | 28 | 3.76 |
| 382 | 636 | 0.25 | 250 | 462 | 15.3 | 26 | 8 | 40 | 28 | 3.56 |
| 382 | 509 | 0.25 | 250 | 462 | 15.3 | 26 | 8 | 40 | 28 | 3.36 |
| 382 | 890 | 0.25 | 250 | 462 | 15.3 | 26 | 8 | 40 | 90 | 2.79 |
| 382 | 763 | 0.25 | 250 | 462 | 15.3 | 26 | 8 | 40 | 90 | 3.28 |
| 382 | 636 | 0.25 | 250 | 462 | 15.3 | 26 | 8 | 40 | 90 | 3.3 |
| 382 | 509 | 0.25 | 250 | 462 | 15.3 | 26 | 8 | 40 | 90 | 2.51 |
| 936 | 201 | 0.32 | 250 | 601 | 4.2 | 26 | 8 | 39 | 56 | 6 |
| 393 | 865 | 0.25 | 250 | 457 | 5 | 26 | 12 | 39 | 28 | 2 |
| 393 | 865 | 0.25 | 250 | 457 | 5 | 26 | 12 | 39 | 28 | 4.2 |
| 570 | 684 | 0.27 | 250 | 454 | 5 | 16.9 | 12 | 39 | 3 | 3.22 |
| 337 | 912 | 0.27 | 250 | 454 | 2.5 | 16.9 | 12 | 39 | 3 | 3.28 |
| 570 | 684 | 0.27 | 250 | 454 | 5 | 16.9 | 12 | 39 | 7 | 3.03 |
| 337 | 912 | 0.27 | 250 | 454 | 2.5 | 16.9 | 12 | 39 | 7 | 3.1 |
| 570 | 684 | 0.27 | 250 | 454 | 5 | 16.9 | 12 | 39 | 28 | 2.7 |
| 337 | 912 | 0.27 | 250 | 454 | 2.5 | 16.9 | 12 | 39 | 28 | 3.57 |
| 570 | 684 | 0.27 | 250 | 454 | 5 | 16.9 | 12 | 39 | 56 | 2.33 |
| 337 | 912 | 0.27 | 250 | 454 | 2.5 | 16.9 | 12 | 39 | 56 | 3.27 |
| 570 | 684 | 0.27 | 250 | 454 | 5 | 16.9 | 12 | 39 | 90 | 2.2 |
| 337 | 912 | 0.27 | 250 | 454 | 2.5 | 16.9 | 12 | 39 | 90 | 3.07 |
| 578 | 694 | 0.25 | 200 | 462 | 7.51 | 26 | 12 | 39 | 28 | 3 |
| 570 | 684 | 0.23 | 150 | 454 | 5.3 | 26 | 8 | 40 | 28 | 2.8 |
| 570 | 684 | 0.27 | 200 | 455 | 4.9 | 26 | 8 | 39 | 7 | 3.48 |
| 570 | 684 | 0.27 | 200 | 455 | 4.9 | 26 | 8 | 39 | 28 | 3.16 |
| 570 | 684 | 0.27 | 200 | 455 | 4.9 | 26 | 8 | 39 | 7 | 3.48 |
| 386 | 847 | 0.27 | 200 | 448 | 3.7 | 26 | 8 | 39 | 7 | 4.21 |
| 570 | 684 | 0.27 | 200 | 455 | 4.9 | 26 | 8 | 39 | 28 | 3.16 |
| 386 | 847 | 0.27 | 200 | 448 | 3.7 | 26 | 8 | 39 | 28 | 3.4 |
| 570 | 684 | 0.27 | 200 | 455 | 5.1 | 26 | 8 | 39 | 7 | 3.9 |
| 570 | 684 | 0.27 | 200 | 455 | 5.1 | 26 | 8 | 39 | 28 | 3.1 |
| 558 | 669 | 0.27 | 200 | 446 | 2.3 | 26 | 8 | 39 | 14 | 2.91 |
| 375 | 823 | 0.27 | 200 | 435 | 2 | 26 | 8 | 39 | 14 | 3.24 |
| 558 | 669 | 0.27 | 200 | 446 | 2.3 | 26 | 8 | 39 | 28 | 2.73 |
| 375 | 823 | 0.27 | 200 | 435 | 2 | 26 | 8 | 39 | 28 | 3.02 |
| 838 | 0 | 0.43 | 250 | 838 | 17 | 26 | 12 | 39 | 28 | 4.88 |
| 583 | 700 | 0.23 | 250 | 467 | 19 | 26 | 12 | 39 | 28 | 3.41 |
| 318 | 701 | 0.28 | 250 | 701 | 19 | 26 | 12 | 39 | 28 | 3.9 |
| 571 | 685 | 0.25 | 250 | 456 | 6.8 | 26 | 8 | 39 | 3 | 4.6 |
| 477 | 763 | 0.25 | 250 | 456 | 6.05 | 26 | 8 | 39 | 3 | 4.2 |
| 412 | 824 | 0.25 | 250 | 456 | 5.52 | 26 | 8 | 39 | 3 | 4.1 |
| 362 | 870 | 0.25 | 250 | 456 | 5.1 | 26 | 8 | 39 | 3 | 4.3 |
| 324 | 906 | 0.25 | 250 | 456 | 5.29 | 26 | 8 | 39 | 3 | 4.4 |
| 292 | 965 | 0.25 | 250 | 456 | 5.1 | 26 | 8 | 39 | 3 | 4.3 |
| 266 | 959 | 0.25 | 250 | 456 | 5.8 | 26 | 8 | 39 | 3 | 4 |
| 190 | 1063 | 0.25 | 250 | 456 | 6.45 | 26 | 8 | 39 | 3 | 3.8 |
| 571 | 685 | 0.25 | 250 | 456 | 6.8 | 26 | 8 | 39 | 28 | 2.7 |
| 477 | 763 | 0.25 | 250 | 456 | 6.05 | 26 | 8 | 39 | 28 | 3.7 |
| 412 | 824 | 0.25 | 250 | 456 | 5.52 | 26 | 8 | 39 | 28 | 3 |
| 362 | 870 | 0.25 | 250 | 456 | 5.1 | 26 | 8 | 39 | 28 | 2.9 |
| 324 | 906 | 0.25 | 250 | 456 | 5.29 | 26 | 8 | 39 | 28 | 3 |
| 292 | 965 | 0.25 | 250 | 456 | 5.1 | 26 | 8 | 39 | 28 | 2.7 |
| 266 | 959 | 0.25 | 250 | 456 | 5.8 | 26 | 8 | 39 | 28 | 2.5 |
| 190 | 1063 | 0.25 | 250 | 456 | 6.45 | 26 | 8 | 39 | 28 | 3.3 |
| 571 | 685 | 0.25 | 250 | 456 | 6.8 | 26 | 8 | 39 | 90 | 1.8 |
| 477 | 763 | 0.25 | 250 | 456 | 6.05 | 26 | 8 | 39 | 90 | 3 |
| 412 | 824 | 0.25 | 250 | 456 | 5.52 | 26 | 8 | 39 | 90 | 3.1 |
| 362 | 870 | 0.25 | 250 | 456 | 5.1 | 26 | 8 | 39 | 90 | 2.3 |
| 324 | 906 | 0.25 | 250 | 456 | 5.29 | 26 | 8 | 39 | 90 | 3.3 |
| 292 | 965 | 0.25 | 250 | 456 | 5.1 | 26 | 8 | 39 | 90 | 2.9 |
| 266 | 959 | 0.25 | 250 | 456 | 5.8 | 26 | 8 | 39 | 90 | 2.6 |
| 190 | 1063 | 0.25 | 250 | 456 | 6.45 | 26 | 8 | 39 | 90 | 3.4 |
| 636 | 636 | 0.25 | 250 | 462 | 17.4 | 26 | 8 | 40 | 28 | 1.8 |
| 636 | 636 | 0.25 | 250 | 462 | 17.4 | 26 | 8 | 40 | 28 | 2.22 |
| 636 | 636 | 0.25 | 250 | 462 | 17.4 | 26 | 8 | 40 | 28 | 2.46 |
| 382 | 890 | 0.25 | 250 | 462 | 16 | 26 | 8 | 40 | 28 | 2.5 |
| 382 | 890 | 0.25 | 250 | 462 | 16 | 26 | 8 | 40 | 28 | 3 |
| 382 | 890 | 0.25 | 250 | 462 | 16 | 26 | 8 | 40 | 28 | 3.12 |
| 418 | 836 | 0.19 | 600 | 456 | 5.7 | 26 | 8 | 39 | 28 | 4.5 |
| 570 | 684 | 0.25 | 600 | 456 | 5.7 | 26 | 8 | 39 | 28 | 4.25 |
| 418 | 836 | 0.22 | 600 | 456 | 7.41 | 26 | 8 | 39 | 28 | 4 |
| 404 | 605 | 0.24 | 4750 | 756 | 23 | 19 | 12 | 24 | 28 | 4.09 |
| 450 | 673 | 0.24 | 4750 | 617 | 17 | 19 | 12 | 24 | 28 | 9.07 |
| 502 | 753 | 0.24 | 4750 | 452 | 11 | 19 | 12 | 24 | 28 | 10.12 |
| 493 | 739 | 0.27 | 4750 | 437 | 8 | 19 | 12 | 24 | 28 | 8.74 |
| 484 | 726 | 0.3 | 4750 | 435 | 6 | 19 | 12 | 24 | 28 | 9.43 |
| 404 | 605 | 0.24 | 2360 | 756 | 20 | 19 | 12 | 24 | 28 | 4.07 |
| 450 | 673 | 0.24 | 2360 | 617 | 15 | 19 | 12 | 24 | 28 | 7.45 |
| 502 | 753 | 0.24 | 2360 | 452 | 10 | 19 | 12 | 24 | 28 | 9.44 |
| 493 | 739 | 0.27 | 2360 | 437 | 8 | 19 | 12 | 24 | 28 | 10.39 |
| 484 | 726 | 0.3 | 2360 | 435 | 6 | 19 | 12 | 24 | 28 | 9.54 |
| 404 | 605 | 0.24 | 212 | 756 | 20 | 19 | 12 | 24 | 28 | 6.47 |
| 450 | 673 | 0.24 | 212 | 617 | 15 | 19 | 12 | 24 | 28 | 9.95 |
| 502 | 753 | 0.24 | 212 | 452 | 10 | 19 | 12 | 24 | 28 | 10.75 |
| 493 | 739 | 0.27 | 212 | 437 | 8 | 19 | 12 | 24 | 28 | 9.21 |
| 484 | 726 | 0.3 | 212 | 435 | 6 | 19 | 12 | 24 | 28 | 8.12 |
| 570 | 684 | 0.3 | 300 | 456 | 5.1 | 28.6 | 12 | 39 | 28 | 0.77 |
| 570 | 684 | 0.3 | 300 | 456 | 6.77 | 17 | 12 | 26 | 28 | 0.33 |
| 448 | 807 | 0.3 | 300 | 456 | 6.5 | 17 | 12 | 26 | 28 | 0.48 |
| 368 | 886 | 0.3 | 300 | 456 | 6.27 | 17 | 12 | 26 | 28 | 0.51 |
| 314 | 941 | 0.3 | 300 | 456 | 6 | 17 | 12 | 26 | 28 | 0.71 |
| 273 | 981 | 0.3 | 300 | 456 | 5.89 | 17 | 12 | 26 | 28 | 0.6 |
| 447 | 807 | 0.28 | 300 | 456 | 10.4 | 17 | 12 | 26 | 28 | 0.17 |
| 447 | 807 | 0.32 | 300 | 456 | 5.643 | 17 | 12 | 26 | 28 | 0.5 |
| 368 | 886 | 0.28 | 300 | 456 | 10 | 17 | 12 | 26 | 28 | 0.28 |
| 368 | 886 | 0.32 | 300 | 456 | 5.26 | 17 | 12 | 26 | 28 | 0.52 |
| 314 | 941 | 0.28 | 300 | 456 | 9.78 | 17 | 12 | 26 | 28 | 0.32 |
| 314 | 941 | 0.32 | 300 | 456 | 5 | 17 | 12 | 26 | 28 | 0.42 |
| 368 | 886 | 0.3 | 300 | 380 | 6.27 | 17 | 12 | 26 | 28 | 0.65 |
| 368 | 886 | 0.3 | 300 | 532 | 6.27 | 17 | 12 | 26 | 28 | 0.16 |
| 447 | 807 | 0.3 | 300 | 456 | 2.5 | 0 | 12 | 26 | 28 | 0.02 |
| 447 | 807 | 0.3 | 300 | 456 | 6.27 | 15.6 | 12 | 26 | 28 | 0.29 |
| 447 | 807 | 0.3 | 300 | 456 | 6.77 | 18.2 | 12 | 26 | 28 | 0.44 |
| 368 | 886 | 0.28 | 300 | 456 | 3.63 | 21 | 12 | 39 | 28 | 2.37 |
| 368 | 886 | 0.26 | 300 | 456 | 4 | 21 | 12 | 39 | 28 | 2.01 |
| 368 | 886 | 0.28 | 300 | 456 | 2.5 | 13 | 12 | 39 | 28 | 1.57 |
| 368 | 886 | 0.28 | 300 | 456 | 3.13 | 21 | 12 | 39 | 28 | 2.76 |
| 368 | 886 | 0.28 | 300 | 456 | 3.5 | 26 | 12 | 39 | 28 | 4.25 |
References
[1] Qian, X., J. Wang, Y. Fang, and L. Wang. Carbon dioxide as an admixture for better performance of OPC-based concrete. Journal of CO2 Utilization, Vol. 25, 2018, pp. 31–38.10.1016/j.jcou.2018.03.007Suche in Google Scholar
[2] Alshahrani, A. and S. Kulasegaram. Effect of fibre diameter and tensile strength on the mechanical, fracture, and fibre distribution properties of eco-friendly high-strength self-compacting concrete. Construction and Building Materials, Vol. 403, 2023, id. 133161.10.1016/j.conbuildmat.2023.133161Suche in Google Scholar
[3] Dong, J. F., Q. Y. Wang, Z. W. Guan, and H. K. Chai. High-temperature behaviour of basalt fibre reinforced concrete made with recycled aggregates from earthquake waste. Journal of Building Engineering, Vol. 48, 2022, id. 103895.10.1016/j.jobe.2021.103895Suche in Google Scholar
[4] Dong, J. F., Y. Xu, Z. W. Guan, and Q. Y. Wang. Freeze-thaw behaviour of basalt fibre reinforced recycled aggregate concrete filled CFRP tube specimens. Engineering Structures, Vol. 273, 2022, id. 115088.10.1016/j.engstruct.2022.115088Suche in Google Scholar
[5] Chen, X., Y. Huang, C. Chen, J. Lu, and X. Fan. Experimental study and analytical modeling on hysteresis behavior of plain concrete in uniaxial cyclic tension. International Journal of Fatigue, Vol. 96, 2017, pp. 261–269.10.1016/j.ijfatigue.2016.12.002Suche in Google Scholar
[6] Swaddiwudhipong, S., H. R. Lu, and T. H. Wee. Direct tension test and tensile strain capacity of concrete at early age. Cement and Concrete Research, Vol. 33, 2003, pp. 2077–2084.10.1016/S0008-8846(03)00231-XSuche in Google Scholar
[7] Chen, X., P. Yang, Y. Peng, M. Wang, F. Hu, and J. Xu. Output voltage drop and input current ripple suppression for the pulse load power supply using virtual multiple quasi-notch-filters impedance. IEEE Transactions on Power Electronics, Vol. 38, 2023, pp. 9552–9565.10.1109/TPEL.2023.3275304Suche in Google Scholar
[8] Xiao, Q., G. Ju, F. Ye, Y. Wang, L. Jin, and W. Fu. An innovative approach for assessing the tensile strength of concrete: Experimental and numerical investigations. Construction and Building Materials, Vol. 417, 2024, id. 135249.10.1016/j.conbuildmat.2024.135249Suche in Google Scholar
[9] Nematzadeh, M., A. A. Shahmansouri, and M. Fakoor. Post-fire compressive strength of recycled PET aggregate concrete reinforced with steel fibers: Optimization and prediction via RSM and GEP. Construction and Building Materials, Vol. 252, 2020, id. 119057.10.1016/j.conbuildmat.2020.119057Suche in Google Scholar
[10] Hong, J., L. Gui, and J. Cao. Analysis and experimental verification of the tangential force effect on electromagnetic vibration of PM motor. IEEE Transactions on Energy Conversion, Vol. 38, 2023, pp. 1893–1902.10.1109/TEC.2023.3241082Suche in Google Scholar
[11] Liu, Y., B. Wang, Y. Fan, J. Yu, T. Shi, Y. Zhou, et al. Effects of reactive MgO on durability and microstructure of cement-based materials: Considering carbonation and pH value. Construction and Building Materials, Vol. 426, 2024, id. 136216.10.1016/j.conbuildmat.2024.136216Suche in Google Scholar
[12] Rocha, J. H. and R. D. Toledo Filho. The utilization of recycled concrete powder as supplementary cementitious material in cement-based materials: A systematic literature review. Journal of Building Engineering, Vol. 76, 2023, id. 107319.10.1016/j.jobe.2023.107319Suche in Google Scholar
[13] Liu, T., G. Zhao, B. Qu, and C. Gong. Characterization of a fly ash-based hybrid well cement under different temperature curing conditions for natural gas hydrate drilling. Construction and Building Materials, Vol. 445, 2024, id. 137874.10.1016/j.conbuildmat.2024.137874Suche in Google Scholar
[14] Wu, P., X. Liu, Z. Zhang, C. Wei, J. Wang, and J. Gu. The harmless and value-added utilization of red mud: Recovering iron from red mud by pyrometallurgy and preparing cementitious materials with its tailings. Journal of Industrial and Engineering Chemistry, Vol. 132, 2024, pp. 50–65.10.1016/j.jiec.2023.11.038Suche in Google Scholar
[15] Kim, D. J. Effects of nanoparticles on the tensile behavior of ultra-high-performance fiber-reinforced concrete at high strain rates. Journal of Building Engineering, Vol. 63, 2023, id. 105513.10.1016/j.jobe.2022.105513Suche in Google Scholar
[16] Abid, M., G. Q. Waqar, J. Mao, M. F. Javed, and H. Almujibah. Mechanical properties, microstructure and GEP-based modeling of basalt fiber reinforced lightweight high-strength concrete containing SCMs. Journal of Building Engineering, Vol. 96, 2024, id. 110378.10.1016/j.jobe.2024.110378Suche in Google Scholar
[17] Sankar, B., D. Anitha, K. Arunkumar, D. Rameshkumar, P. Swaminathan, K. K. Saxena, et al. A study on the mechanical performance, shrinkage and morphology of high-performance fiber reinforced concrete with varying SCMs and geometry of steel fibers. Case Studies in Construction Materials, Vol. 21, 2024, id. e03642.10.1016/j.cscm.2024.e03642Suche in Google Scholar
[18] Ramzi, S. and H. Hajiloo. The effects of supplementary cementitious materials (SCMs) on the residual mechanical properties of concrete after exposure to high temperatures – review. Buildings, Vol. 13, No. 1, 2023, id. 103.10.3390/buildings13010103Suche in Google Scholar
[19] Yang, Z. Q., K. P. Hou, and T. T. Guo. Study on the effects of different water-cement ratios on the flow pattern properties of cement grouts. Applied Mechanics and Materials, Vol. 71, 2011 Sep, pp. 1264–1267.10.4028/www.scientific.net/AMM.71-78.1264Suche in Google Scholar
[20] Liu, Y., J. Dong, S. Yuan, K. Li, X. Hu, and Q. Wang. Variable fatigue loading effects on corrugated steel box girders with recycled concrete. Journal of Constructional Steel Research, Vol. 215, 2024, id. 108526.10.1016/j.jcsr.2024.108526Suche in Google Scholar
[21] Yang, Z., M. Chen, J. Zhang, P. Ding, N. He, and Y. Yang. Effect of initial water content on soil failure mechanism of loess mudflow disasters. Frontiers in Ecology and Evolution, Vol. 11, 2023 Apr, id. 1141155.10.3389/fevo.2023.1141155Suche in Google Scholar
[22] Li, J., A. Hajimohammadi, Y. Yu, B. Y. Lee, and T. Kim. Mechanism of PVA fiber influence in foam concrete: from macroscopic to microscopic view. Journal of Materials in Civil Engineering, Vol. 35, No. 12, 2023, id. 04023447.10.1061/JMCEE7.MTENG-16124Suche in Google Scholar
[23] Zhao, Y., J. Wang, G. Cao, Y. Yuan, X. Yao, and L. Qi. Intelligent control of multilegged robot smooth motion: a review. IEEE Access, Vol. 11, 2023, pp. 86645–86685.10.1109/ACCESS.2023.3304992Suche in Google Scholar
[24] Diao, X., Y. Song, S. Pan, X. Cai, T. Shi, and L. Wang. Enhanced dynamic compressive performance of silicon carbide whiskers-modified mortars. Construction and Building Materials, Vol. 432, 2024, id. 136626.10.1016/j.conbuildmat.2024.136626Suche in Google Scholar
[25] Dong, J., Q. Wang, and Z. Guan. Structural behaviour of RC beams with external flexural and flexural-shear strengthening by FRP sheets. Composites Part B: Engineering, Vol. 44, 2013, pp. 604–612.10.1016/j.compositesb.2012.02.018Suche in Google Scholar
[26] Meng, S., F. Meng, H. Chi, H. Chen, and A. Pang. A robust observer based on the nonlinear descriptor systems application to estimate the state of charge of lithium-ion batteries. Journal of the Franklin Institute, Vol. 360, 2023, pp. 11397–11413.10.1016/j.jfranklin.2023.08.037Suche in Google Scholar
[27] Tian, F., Z. Liu, J. Zhou, L. Chen, and X. T. Feng. Quantifying post-peak behavior of rocks with type-I, type-II, and mixed fractures by developing a quasi-state-based peridynamics. Rock Mechanics and Rock Engineering, Vol. 57, 2024, pp. 4835–4871.10.1007/s00603-024-03788-8Suche in Google Scholar
[28] Bao, X., H. Yuan, J. Shen, C. Liu, X. Chen, and H. Cui. Numerical analysis of seismic response of a circular tunnel-rectangular underpass system in liquefiable soil. Computers and Geotechnics, Vol. 174, 2024, id. 106642.10.1016/j.compgeo.2024.106642Suche in Google Scholar
[29] Ji, J., Z. Zhang, M. Lin, L. Li, L. Jiang, Y. Ding, et al. Structural application of engineered cementitious composites (ECC): A state-of-the-art review. Construction and Building Materials, Vol. 406, 2023, id. 133289.10.1016/j.conbuildmat.2023.133289Suche in Google Scholar
[30] Ye, J., J. Yu, J. Yu, K. Yu, Y. Wang, and Y. Weng. Tensile size effect of engineered cementitious composites (ECC): Experimental and theoretical investigations. Construction and Building Materials, Vol. 402, 2023, id. 133053.10.1016/j.conbuildmat.2023.133053Suche in Google Scholar
[31] Qin, F., Z. Zhang, Z. Yin, J. Di, L. Xu, and X. Xu. Use of high strength, high ductility engineered cementitious composites (ECC) to enhance the flexural performance of reinforced concrete beams. Journal of Building Engineering, Vol. 32, 2020, id. 101746.10.1016/j.jobe.2020.101746Suche in Google Scholar
[32] Yoo, D. Y. and N. Banthia. High-performance strain-hardening cementitious composites with tensile strain capacity exceeding 4%: A review. Cement and Concrete Composites, Vol. 125, 2022, id. 104325.10.1016/j.cemconcomp.2021.104325Suche in Google Scholar
[33] Qin, F., X. Wei, Y. Lu, Z. Zhang, J. Di, and Z. Yin. Flexural behaviour of high strength engineered cementitious composites (ECC)-reinforced concrete composite beams. Case Studies in Construction Materials, Vol. 18, 2023, id. e02002.10.1016/j.cscm.2023.e02002Suche in Google Scholar
[34] Arulanandam, P. M., T. Kanakubo, S. B. Singh, and M. V. R. Sivasubramanian. Effect of ECC layer thickness and reinforcement ratio on the load carrying capacity of steel-reinforced composite beams. Structural Concrete, Vol. 24, 2023, pp. 2280–2306.10.1002/suco.202200752Suche in Google Scholar
[35] Deng, B. Y., D. Tan, L. Z. Li, Z. Zhang, Z. W. Cai, and K. Q. Yu. Flexural behavior of precast ultra-lightweight ECC-concrete composite slab with lattice girders. Engineering Structures, Vol. 279, 2023, id. 115553.10.1016/j.engstruct.2022.115553Suche in Google Scholar
[36] Chen, D., F. Kang, J. Li, S. Zhu, and X. Liang. Enhancement of underwater dam crack images using multi-feature fusion. Automation in Construction, Vol. 167, 2024, id. 105727.10.1016/j.autcon.2024.105727Suche in Google Scholar
[37] Zheng, Y., X. Lv, S. Hu, J. Zhuo, C. Wan, and J. Liu. Mechanical properties and durability of steel fiber reinforced concrete: A review. Journal of Building Engineering, Vol. 82, 2024, id. 108025.10.1016/j.jobe.2023.108025Suche in Google Scholar
[38] Zhao, C., Z. Wang, Z. Zhu, Q. Guo, X. Wu, and R. Zhao. Research on different types of fiber reinforced concrete in recent years: An overview. Construction and Building Materials, Vol. 365, 2023, id. 130075.10.1016/j.conbuildmat.2022.130075Suche in Google Scholar
[39] Zhang, P., C. Wang, Z. Gao, and F. Wang. A review on fracture properties of steel fiber reinforced concrete. Journal of Building Engineering, Vol. 67, 2023, id. 105975.10.1016/j.jobe.2023.105975Suche in Google Scholar
[40] Dong, J. F., Z. W. Guan, H. K. Chai, and Q. Y. Wang. High temperature behaviour of basalt fibre-steel tube reinforced concrete columns with recycled aggregates under monotonous and fatigue loading. Construction and Building Materials, Vol. 389, 2023, id. 131737.10.1016/j.conbuildmat.2023.131737Suche in Google Scholar
[41] Kang, F., Y. Wu, J. Ma, and J. Li. Structural identification of super high arch dams using Gaussian process regression with improved salp swarm algorithm. Engineering Structures, Vol. 286, 2023, id. 116150.10.1016/j.engstruct.2023.116150Suche in Google Scholar
[42] Hu, Z., M. Elchalakani, S. Yehia, H. Ran, M. A. Sadakkathulla, and X. Guo. Engineered cementitious composite (ECC) strengthening of reinforced concrete structures: A state-of-the-art review. Journal of Building Engineering, Vol. 86, 2024, id. 108941.10.1016/j.jobe.2024.108941Suche in Google Scholar
[43] Zedan Khalel, H. H., M. Khan, and A. Starr. Dynamic response-based crack resistance analysis of fibre reinforced concrete specimens under different temperatures and crack depths. Journal of Building Engineering, Vol. 66, 2023, id. 105865.10.1016/j.jobe.2023.105865Suche in Google Scholar
[44] Zhang, W., J. Lin, Y. Huang, B. Lin, and S. Kang. Temperature-dependent debonding behavior of adhesively bonded CFRP-UHPC interface. Composite Structures, Vol. 340, 2024, id. 118200.10.1016/j.compstruct.2024.118200Suche in Google Scholar
[45] He, L., J. Pan, Y. S. Hee, H. Chen, L. G. Li, B. Panda, et al. Development of novel concave and convex trowels for higher interlayer strength of 3D printed cement paste. Case Studies in Construction Materials, Vol. 21, 2024, id. e03745.10.1016/j.cscm.2024.e03745Suche in Google Scholar
[46] Zhao, Y., X. Chen, Z. Wang, Y. Zhang, and Y. Leng. An experimental study on the influence of fly ash and crumb rubber on the mechanical property and permeability of Engineered Cementitious Composite (ECC). Journal of Building Engineering, Vol. 76, 2023, id. 106998.10.1016/j.jobe.2023.106998Suche in Google Scholar
[47] Lu, C., Z. Pang, H. Chu, and C. K. Y. Leung. Experimental and numerical investigation on the long-term performance of engineered cementitious composites (ECC) with high-volume fly ash and domestic polyvinyl alcohol (PVA) fibers. Journal of Building Engineering, Vol. 70, 2023, id. 106324.10.1016/j.jobe.2023.106324Suche in Google Scholar
[48] Zhiquan, Y., N. Xiangdong, H. Kepeng, L. Wei, and G. Yanhui. Relationships between water-cement ratio and rheological characteristics of power-law cement grouts. Electronic Journal of Geotechnical Engineering, Vol. 20, No. 13, 2015, pp. 5825–5831.Suche in Google Scholar
[49] Dong, J., Y. Liu, S. Yuan, K. Li, F. Zhang, Z. Guan, et al. Mechanical behavior and impact resistance of rubberized concrete enhanced by basalt fiber-epoxy resin composite. Construction and Building Materials, Vol. 435, 2024, id. 136836.10.1016/j.conbuildmat.2024.136836Suche in Google Scholar
[50] He, L., B. Chen, Q. Liu, H. Chen, H. Li, W. T. Chow, et al. A quasi-exponential distribution of interfacial voids and its effect on the interlayer strength of 3D printed concrete. Additive Manufacturing, Vol. 89, 2024, id. 104296.10.1016/j.addma.2024.104296Suche in Google Scholar
[51] Zou, Y., J. Jiang, J. Yang, Z. Zhang, and J. Guo. Enhancing the toughness of bonding interface in steel-UHPC composite structure through fiber bridging. Cement and Concrete Composites, Vol. 137, 2023, id.104947.10.1016/j.cemconcomp.2023.104947Suche in Google Scholar
[52] Cao, J., J. Gu, Z. Dang, and C. Zhang. On temperature-dependent fiber bridging in mode I delamination of unidirectional composite laminates. Composites Part A: Applied Science and Manufacturing, Vol. 171, 2023, id. 107581.10.1016/j.compositesa.2023.107581Suche in Google Scholar
[53] Zhang, K., Q. Liu, H. Qian, B. Xiang, Q. Cui, J. Zhou, et al. EATN: An efficient adaptive transfer network for aspect-level sentiment analysis. IEEE Transactions on Knowledge and Data Engineering, Vol. 35, 2023, pp. 377–389.Suche in Google Scholar
[54] Men, P., X. M. Wang, D. Liu, Z. Zhang, Q. Zhang, and Y. Lu. On use of polyvinylpyrrolidone to modify polyethylene fibers for improving tensile properties of high strength ECC. Construction and Building Materials, Vol. 417, 2024, id. 135354.10.1016/j.conbuildmat.2024.135354Suche in Google Scholar
[55] Shabakhty, N., H. R. Karimi, and A. Y. Bakhtiary. Statistical evaluation of fracture and mechanical performance of engineered cementitious composites (ECC), containing different percentages of glass, polypropylene, polyvinyl-alcohol fibers, and fly ash. Construction and Building Materials, Vol. 417, 2024, id. 135247.10.1016/j.conbuildmat.2024.135247Suche in Google Scholar
[56] Wang, Q., Y. Zhou, M. Lai, M. Gu, and J. C. M. Ho. Carbon fiber to improve the resistance of high strength PVA-ECC to elevated temperatures. Journal of Building Engineering, Vol. 71, 2023, id. 106475.10.1016/j.jobe.2023.106475Suche in Google Scholar
[57] Xie, D., Z. Hu, B. Wang, K. Zhao, and J. Zhou. Effect of PVA fiber and basalt fiber on residual mechanical and permeability properties of ECC after elevated temperatures. Construction and Building Materials, Vol. 433, 2024, id. 136610.10.1016/j.conbuildmat.2024.136610Suche in Google Scholar
[58] Zheng, W., A. Zaman, F. Farooq, F. Althoey, A. Alaskar, and A. Akbar. Sustainable predictive model of concrete utilizing waste ingredient: Individual alogrithms with optimized ensemble approaches. Materials Today Communications, Vol. 35, 2023, id. 105901.10.1016/j.mtcomm.2023.105901Suche in Google Scholar
[59] Kang, L., B. Tang, J. Huang, and J. Li. 3D-MRI super-resolution reconstruction using multi-modality based on multi-resolution CNN. Computer Methods and Programs in Biomedicine, Vol. 248, 2024, id. 108110.10.1016/j.cmpb.2024.108110Suche in Google Scholar PubMed
[60] Zhu, J., B. Ma, D. Li, Y. Zhang, and L. Xu. Role of bicarbonate in CO2 corrosion of carbon steel. Electrochimica Acta, Vol. 478, 2024, id. 143818.10.1016/j.electacta.2024.143818Suche in Google Scholar
[61] Zhang, D., C. Du, Y. Peng, J. Liu, S. Mohammed, and A. Calvi. A multi-source dynamic temporal point process model for train delay prediction. IEEE Transactions on Intelligent Transportation Systems, 2024 Jul. https://ieeexplore.ieee.org/abstract/document/10618957/ (accessed August 26, 2024).Suche in Google Scholar
[62] Javed, M. F., F. Farooq, S. A. Memon, A. Akbar, M. A. Khan, F. Aslam, et al. New prediction model for the ultimate axial capacity of concrete-filled steel tubes: An evolutionary approach. Crystals, Vol. 10, 2020, pp. 1–33.10.3390/cryst10090741Suche in Google Scholar
[63] Farooq, F., M. N. Amin, K. Khan, M. R. Sadiq, M. F. Javed, F. Aslam, et al. A comparative study of random forest and genetic engineering programming for the prediction of compressive strength of high strength concrete (HSC). Applied Sciences, Vol. 10, 2020, pp. 1–18.10.3390/app10207330Suche in Google Scholar
[64] Nafees, A., M. F. Javed, S. Khan, K. Nazir, F. Farooq, F. Aslam, et al. Predictive modeling of mechanical properties of silica fume-based green concrete using artificial intelligence approaches: MLPNN, ANFIS, and GEP. Materials (Basel), Vol. 14, 2021, id. 7531.10.3390/ma14247531Suche in Google Scholar PubMed PubMed Central
[65] Xie, X., Y. Gao, F. Hou, T. Cheng, A. Hao, and H. Qin. Fluid inverse volumetric modeling and applications from surface motion. IEEE Transactions on Visualization and Computer Graphics, 2024 Feb 28.Suche in Google Scholar
[66] Xin, J., W. Xu, B. Cao, T. Wang, and S. Zhang. A deep-learning-based MAC for integrating channel access, rate adaptation and channel switch, 2024. http://arxiv.org/abs/2406.02291 (accessed July 13, 2024).10.1016/j.dcan.2024.10.010Suche in Google Scholar
[67] Jiao, H., Y. Wang, L. Li, K. Arif, F. Farooq, and A. Alaskar. A novel approach in forecasting compressive strength of concrete with carbon nanotubes as nanomaterials. Materials Today Communications, Vol. 35, 2023, id. 106335.10.1016/j.mtcomm.2023.106335Suche in Google Scholar
[68] Huang, Z., K. Li, Y. Jiang, Z. Jia, L. Lv, and Y. Ma. Graph Relearn Network: Reducing performance variance and improving prediction accuracy of graph neural networks. Knowledge-Based Systems, Vol. 301, 2024, id. 112311.10.1016/j.knosys.2024.112311Suche in Google Scholar
[69] Liang, S., Y. Gao, C. Hu, A. Hao, and H. Qin. Efficient photon beam diffusion for directional subsurface scattering. IEEE Transactions on Visualization and Computer Graphics, 2024 Aug 22.10.1109/TVCG.2024.3447668Suche in Google Scholar PubMed
[70] Chen, D., F. Kang, J. Chen, S. Zhu, and H. Li. Effect of light source wavelength on surface defect imaging in deep-water concrete dams. NDT & E International, Vol. 147, 2024, id. 103198.10.1016/j.ndteint.2024.103198Suche in Google Scholar
[71] Wu, Y., R. Pieralisi, F. G. B. Sandoval, R. D. López-Carreño, and P. Pujadas. Optimizing pervious concrete with machine learning: Predicting permeability and compressive strength using artificial neural networks. Construction and Building Materials, Vol. 443, 2024, id. 137619.10.1016/j.conbuildmat.2024.137619Suche in Google Scholar
[72] Karim, R., M. H. Islam, S. D. Datta, and A. Kashem. Synergistic effects of supplementary cementitious materials and compressive strength prediction of concrete using machine learning algorithms with SHAP and PDP analyses. Case Studies in Construction Materials, Vol. 20, 2024, id. e02828.10.1016/j.cscm.2023.e02828Suche in Google Scholar
[73] Kashem, A., R. Karim, P. Das, S. D. Datta, and M. Alharthai. Compressive strength prediction of sustainable concrete incorporating rice husk ash (RHA) using hybrid machine learning algorithms and parametric analyses. Case Studies in Construction Materials, Vol. 20, 2024, id. e03030.10.1016/j.cscm.2024.e03030Suche in Google Scholar
[74] Piro, NS., A. Mohammed, S. M. Hamad, and R. Kurda. Electrical resistivity-Compressive strength predictions for normal strength concrete with waste steel slag as a coarse aggregate replacement using various analytical models. Construction and Building Materials, Vol. 327, 2022, id. 127008.10.1016/j.conbuildmat.2022.127008Suche in Google Scholar
[75] Jaf, D. K., P. I. Abdulrahman, A. S. Mohammed, R. Kurda, S. M. Qaidi, and P. G. Asteris. Machine learning techniques and multi-scale models to evaluate the impact of silicon dioxide (SiO2) and calcium oxide (CaO) in fly ash on the compressive strength of green concrete. Construction and Building Materials, Vol. 400, 2023, id. 132604.10.1016/j.conbuildmat.2023.132604Suche in Google Scholar
[76] Mohammed, H. X., A. S. Mohammed, and A. M. T. Hassan. Soft computing models to evaluate the effect of fly ash and ground granulated blast furnace slag (GGBS) on the compressive strength of concrete in normal and high strength ranges. Structures, Vol. 58, 2023, id. 105459.10.1016/j.istruc.2023.105459Suche in Google Scholar
[77] Lou, Y., H. Wang, M. N. Amin, S. U. Arifeen, Y. Dodo, F. Althoey, et al. Predicting the crack repair rate of self-healing concrete using soft-computing tools. Materials Today Communications, Vol. 38, 2024, id. 108043.10.1016/j.mtcomm.2024.108043Suche in Google Scholar
[78] Shakil, M., S. Nazar, H. F. Ameen, A. Shahzad, and F. Ahmad. A comparative study of ground granulated blast furnace slag and bagasse ash incorporation on enhancing mechanical properties of expansive soil. Results in Engineering, Vol. 25, 2025 Mar, id. 103569.10.1016/j.rineng.2024.103569Suche in Google Scholar
[79] Alkhattabi, L. and K. Arif. Novel base predictive model of resilient modulus of compacted subgrade soils by using interpretable approaches with graphical user interface. Materials Today Communications, Vol. 40, 2024, id. 109764.10.1016/j.mtcomm.2024.109764Suche in Google Scholar
[80] Alyousef, R., R. U. D. Nassar, M. Khan, K. Arif, M. Fawad, A. M. Hassan, et al. Forecasting the strength characteristics of concrete incorporating waste foundry sand using advance machine algorithms including deep learning. Case Studies in Construction Materials, Vol. 19, 2023, id. e02459.10.1016/j.cscm.2023.e02459Suche in Google Scholar
[81] Zhao, Y., Y. Sun, and H. Hou. Core-shell structure nanoprecipitates in Fe-xCu-3.0Mn-1.5Ni-1.5Al alloys: A phase field study. Progress in Natural Science: Materials International, Vol. 32, 2022, pp. 358–368.10.1016/j.pnsc.2022.04.001Suche in Google Scholar
[82] Alzara, M., M. F. Rehman, F. Farooq, M. Ali, A. A. A. Beshr, A. M. Yosri, et al. Prediction of building energy performance using mathematical gene-expression programming for a selected region of dry-summer climate. Engineering Applications of Artificial Intelligence, Vol. 126, 2023, id. 106958.10.1016/j.engappai.2023.106958Suche in Google Scholar
[83] Sheida, K., M. Seyedi, M. A. Afridi, F. Ferdowsi, M. J. Khattak, V. K. Gopu, et al. Resilient reinforcement learning for voltage control in an islanded dc microgrid integrating data-driven piezoelectric. Machines, Vol. 12, No. 10, 2024, id. 694.10.3390/machines12100694Suche in Google Scholar
[84] Asif, U., M. F. Javed, M. Abuhussain, M. Ali, W. A. Khan, and A. Mohamed. Predicting the mechanical properties of plastic concrete: An optimization method by using genetic programming and ensemble learners. Case Studies in Construction Materials, Vol. 20, 2024, id. e03135.10.1016/j.cscm.2024.e03135Suche in Google Scholar
[85] Deng, J., G. Liu, L. Wang, G. Liu, and X. Wu. Intelligent optimization design of squeeze casting process parameters based on neural network and improved sparrow search algorithm. Journal of Industrial Information Integration, Vol. 39, 2024, id. 100600.10.1016/j.jii.2024.100600Suche in Google Scholar
[86] Shahrokhishahraki, M., M. Malekpour, S. Mirvalad, and G. Faraone. Machine learning predictions for optimal cement content in sustainable concrete constructions. Journal of Building Engineering, Vol. 82, 2024, id. 108160.10.1016/j.jobe.2023.108160Suche in Google Scholar
[87] Afridi, H. F., D. Khan, W. A. Khan, H. Jamal, A. A. Durrani, M. A. Afridi, et al. Utilizing waste engine oil and Sasobit to improve the rheological and physiochemical properties of RAP. Discover. Civil Engineering, Vol. 1, No. 1, 2024 Nov, id. 131.10.1007/s44290-024-00114-7Suche in Google Scholar
[88] Mahe, R., Z. Ye, M. Qi, W. Cai, Y. Wen, J. Xiao, et al. Application progress and prospect of game theory on aquaculture: from the perspectives of breeding, rearing, and marketing. Reviews in Fisheries Science & Aquaculture, Vol. 32, 2024, pp. 505–525.10.1080/23308249.2024.2347627Suche in Google Scholar
[89] Zhang, L., D. Li, P. Liu, X. Liu, and H. Yin. Incentive-based demand response optimization method based on federated learning with a focus on user privacy protection Incentive-based demand response optimization method based on federated learning with a focus on user privacy protection. Motivation Science, Vol. 10, 2024, pp. 138–148.Suche in Google Scholar
[90] Lee, S., J. Park, N. Kim, T. Lee, and L. Quagliato. Extreme gradient boosting-inspired process optimization algorithm for manufacturing engineering applications. Materials & Design, Vol. 226, 2023, id. 111625.10.1016/j.matdes.2023.111625Suche in Google Scholar
[91] Thai, D. K., T. M. Tu, T. Q. Bui, and T. T. Bui. Gradient tree boosting machine learning on predicting the failure modes of the RC panels under impact loads. Engineering with Computers, Vol. 1, 2019, id. 3.10.1007/s00366-019-00842-wSuche in Google Scholar
[92] Guo, J., S. Yun, Y. Meng, N. He, D. Ye, Z. Zhao, et al. Prediction of heating and cooling loads based on light gradient boosting machine algorithms. Building and Environment, Vol. 236, 2023, id. 110252.10.1016/j.buildenv.2023.110252Suche in Google Scholar
[93] Huang, A., R. Xu, Y. Chen, and M. Guo. Research on multi-label user classification of social media based on ML-KNN algorithm. Technological Forecasting and Social Change, Vol. 188, 2023, id. 122271.10.1016/j.techfore.2022.122271Suche in Google Scholar
[94] Alahmari, T. S. and K. Arif. Machine learning approaches to predict the strength of graphene nanoplatelets concrete: Optimization and hyper tuning with graphical user interface. Materials Today Communications, Vol. 40, 2024, id. 109946.10.1016/j.mtcomm.2024.109946Suche in Google Scholar
[95] Sun, Z., Y. Li, Y. Yang, L. Su, and S. Xie. Splitting tensile strength of basalt fiber reinforced coral aggregate concrete: Optimized XGBoost models and experimental validation. Construction and Building Materials, Vol. 416, 2024, id. 135133.10.1016/j.conbuildmat.2024.135133Suche in Google Scholar
[96] Tran, V. Q., H. V. T. Mai, Q. T. To, and M. H. Nguyen. Machine learning approach in investigating carbonation depth of concrete containing Fly ash. Structural Concrete, Vol. 24, 2023, pp. 2145–2169.10.1002/suco.202200269Suche in Google Scholar
[97] Nayak, D. K., G. Verma, A. Dimri, R. Kumar, and V. Kumar. Predicting the twenty-eight day compressive strength of OPC- and PPC-prepared concrete through hybrid GA-XGB model. Practice Periodical on Structural Design and Construction, Vol. 28, No. 3, 2023, id. 04023020.10.1061/PPSCFX.SCENG-1315Suche in Google Scholar
[98] Huu Nguyen, M., T. A. Nguyen, and H. B. Ly. Ensemble XGBoost schemes for improved compressive strength prediction of UHPC. Structures, Vol. 57, 2023, id. 105062.10.1016/j.istruc.2023.105062Suche in Google Scholar
[99] Elhishi, S., A. M. Elashry, and S. El-Metwally. Unboxing machine learning models for concrete strength prediction using XAI. Scientific Reports, Vol. 13, 2023, id. 19892.10.1038/s41598-023-47169-7Suche in Google Scholar PubMed PubMed Central
[100] Al-Taai, S. R., N. M. Azize, Z. A. Thoeny, H. Imran, L. F. A. Bernardo, and Z. Al-Khafaji. XGBoost prediction model optimized with bayesian for the compressive strength of eco-friendly concrete containing ground granulated blast furnace slag and recycled coarse aggregate. Applied Sciences, Vol. 13, No. 15, 2023, id. 8889.10.3390/app13158889Suche in Google Scholar
[101] Kumar, A., H. C. Arora, and M. L. Nehdi. XGBoost algorithm based estimation of near surface mounted FRP rod-to-concrete bond strength and failure mode. Journal of Building Engineering, Vol. 90, 2024, id. 109418.10.1016/j.jobe.2024.109418Suche in Google Scholar
[102] Chen, X., J. Shen, X. Bao, X. Wu, W. Tang, and H. Cui. A review of seismic resilience of shield tunnels. Tunnelling and Underground Space Technology, Vol. 136, 2023, id. 105075.10.1016/j.tust.2023.105075Suche in Google Scholar
[103] Al Asmari, A. F., M. I. Bashir, F. Farooq, and U. Asif. Investigating the effect of locally available volcanic ash on mechanical and microstructure properties of concrete. Reviews on Advanced Materials Science, Vol. 64, No. 1, 2025 Feb, id. 20240085.10.1515/rams-2024-0085Suche in Google Scholar
[104] Afridi, M. A., Y. Wu, M. J. Khattak, and F. Karbalaeisaleh. Development of a highly conductive nano-engineered geopolymer for geothermal applications. ASME Open Journal of Engineering, Vol. 3, 2024 Jan.10.1115/1.4067000Suche in Google Scholar
[105] Kodaz, H., S. Özşen, A. Arslan, and S. Güneş. Medical application of information gain based artificial immune recognition system (AIRS): Diagnosis of thyroid disease. Expert Systems with Applications, Vol. 36, 2009, pp. 3086–3092.10.1016/j.eswa.2008.01.026Suche in Google Scholar
[106] Beskopylny, A. N., S. A. Stel’makh, E. M. Shcherban’, L. R. Mailyan, B. Meskhi, I. Razveeva, et al. Concrete strength prediction using machine learning methods CatBoost, k-nearest neighbors, support vector regression. Applied Sciences, Vol. 12, 2022, id. 10864.10.3390/app122110864Suche in Google Scholar
[107] Franco-Lopez, H., A. R. Ek, and M. E. Bauer. Estimation and mapping of forest stand density, volume, and cover type using the k-nearest neighbors method. Remote Sensing of the Environment, Vol. 77, 2001, pp. 251–274.10.1016/S0034-4257(01)00209-7Suche in Google Scholar
[108] Ahmed, H. U., A. S. Mohammed, R. H. Faraj, A. A. Abdalla, S. M. A. Qaidi, N. H. Sor, et al. Innovative modeling techniques including MEP, ANN and FQ to forecast the compressive strength of geopolymer concrete modified with nanoparticles. Neural Computing and Applications, Vol. 35, 2023, pp. 12453–12479.10.1007/s00521-023-08378-3Suche in Google Scholar
[109] Abunassar, N., M. Alas, and S. I. A. Ali. Prediction of compressive strength in self-compacting concrete containing fly ash and silica fume using ANN and SVM. Arabian Journal for Science and Engineering, Vol. 48, 2023, pp. 5171–5184.10.1007/s13369-022-07359-3Suche in Google Scholar
[110] Ramachandra, R. and S. Mandal. Prediction of fly ash concrete type using ANN and SVM models. Innovative Infrastructure Solutions, Vol. 8, No. 1, 2023, id. 47.10.1007/s41062-022-01014-4Suche in Google Scholar
[111] Liu, L., Y. T. Du, M. N. Amin, S. Nazar, K. Khan, and M. T. Qadir. Explicable AI-based modeling for the compressive strength of metakaolin-derived geopolymers. Case Studies in Construction Materials, Vol. 21, 2024 Dec, id. e03849.10.1016/j.cscm.2024.e03849Suche in Google Scholar
[112] Gao, J. and H. Yang. An artificial neural network method for probabilistic life prediction of corroded reinforced concrete. International Journal of Fatigue, Vol. 186, 2024, id. 108418.10.1016/j.ijfatigue.2024.108418Suche in Google Scholar
[113] Al-Mosawe, D., L. Neves, and J. Owen. Accelerating reliability analysis of deteriorated simply supported concrete beam with a newly developed approach: MCS, FORM and ANN. Structures, Vol. 60, 2024, id. 105962.10.1016/j.istruc.2024.105962Suche in Google Scholar
[114] Kumar, S., D. R. Kumar, W. Wipulanusat, and S. Keawsawasvong. Development of ANN-based metaheuristic models for the study of the durability characteristics of high-volume fly ash self-compacting concrete with silica fume. Journal of Building Engineering, Vol. 94, 2024, id. 109844.10.1016/j.jobe.2024.109844Suche in Google Scholar
[115] Yang, Z. Q. and H. L. Zhu. Study on the effect of carbon nanotubes on the microstructure and anti-carbonation properties of cement-based materials. Journal of Functional Materials, Vol. 54, No. 8, 2023, pp. 8217–8227.Suche in Google Scholar
[116] Zheng, W., Z. Shui, Z. Xu, X. Gao, and S. Zhang. Multi-objective optimization of concrete mix design based on machine learning. Journal of Building Engineering, Vol. 76, 2023, id. 107396.10.1016/j.jobe.2023.107396Suche in Google Scholar
[117] Lee, S., N. H. Nguyen, A. Karamanli, J. Lee, and T. P. Vo. Super learner machine-learning algorithms for compressive strength prediction of high performance concrete. Structural Concrete, Vol. 24, 2023, pp. 2208–2228.10.1002/suco.202200424Suche in Google Scholar
[118] Song, H., A. Ahmad, F. Farooq, K. A. Ostrowski, M. Maślak, S. Czarnecki, et al. Predicting the compressive strength of concrete with fly ash admixture using machine learning algorithms. Construction and Building Materials, Vol. 308, 2021, id. 125021.10.1016/j.conbuildmat.2021.125021Suche in Google Scholar
[119] Dong, W., Y. Huang, B. Lehane, and G. Ma. Multi-objective design optimization for graphite-based nanomaterials reinforced cementitious composites: A data-driven method with machine learning and NSGA-Ⅱ. Construction and Building Materials, Vol. 331, 2022, id. 127198.10.1016/j.conbuildmat.2022.127198Suche in Google Scholar
[120] Iqbal, M. F., M. F. Javed, M. Rauf, I. Azim, M. Ashraf, J. Yang, et al. Sustainable utilization of foundry waste: Forecasting mechanical properties of foundry sand based concrete using multi-expression programming. Science of The Total Environment, Vol. 780, 2021, id. 146524.10.1016/j.scitotenv.2021.146524Suche in Google Scholar PubMed
[121] Moriasi, D. N., J. G. Arnold, M. W. Van Liew, R. L. Bingner, R. D. Harmel, and T. L. Veith. Model evaluation guidelines for systematic quantification of accuracy in watershed simulations. Transactions of the ASABE, Vol. 50, 2007, pp. 885–900, https://elibrary.asabe.org/abstract.asp?aid=23153 (accessed October 9, 2023).10.13031/2013.23153Suche in Google Scholar
[122] Amlashi, A. T., P. Alidoust, A. R. Ghanizadeh, S. Khabiri, M. Pazhouhi, and M. S. Monabati. Application of computational intelligence and statistical approaches for auto-estimating the compressive strength of plastic concrete. European Journal of Environmental and Civil Engineering, Vol. 26, 2022, pp. 3459–3490.10.1080/19648189.2020.1803144Suche in Google Scholar
© 2025 the author(s), published by De Gruyter
This work is licensed under the Creative Commons Attribution 4.0 International License.
Artikel in diesem Heft
- Review Articles
- Utilization of steel slag in concrete: A review on durability and microstructure analysis
- Technical development of modified emulsion asphalt: A review on the preparation, performance, and applications
- Recent developments in ultrasonic welding of similar and dissimilar joints of carbon fiber reinforcement thermoplastics with and without interlayer: A state-of-the-art review
- Unveiling the crucial factors and coating mitigation of solid particle erosion in steam turbine blade failures: A review
- From magnesium oxide, magnesium oxide concrete to magnesium oxide concrete dams
- Properties and potential applications of polymer composites containing secondary fillers
- A scientometric review on the utilization of copper slag as a substitute constituent of ordinary Portland cement concrete
- Advancement of additive manufacturing technology in the development of personalized in vivo and in vitro prosthetic implants
- Recent advance of MOFs in Fenton-like reaction
- A review of defect formation, detection, and effect on mechanical properties of three-dimensional braided composites
- Non-conventional approaches to producing biochars for environmental and energy applications
- Review of the development and application of aluminum alloys in the nuclear industry
- Advances in the development and characterization of combustible cartridge cases and propellants: Preparation, performance, and future prospects
- Recent trends in rubberized and non-rubberized ultra-high performance geopolymer concrete for sustainable construction: A review
- Cement-based materials for radiative cooling: Potential, material and structural design, and future prospects
- A comprehensive review: The impact of recycling polypropylene fiber on lightweight concrete performance
- A comprehensive review of preheating temperature effects on reclaimed asphalt pavement in the hot center plant recycling
- Exploring the potential applications of semi-flexible pavement: A comprehensive review
- A critical review of alkali-activated metakaolin/blast furnace slag-based cementitious materials: Reaction evolution and mechanism
- Dispersibility of graphene-family materials and their impact on the properties of cement-based materials: Application challenges and prospects
- Research progress on rubidium and cesium separation and extraction
- A step towards sustainable concrete with the utilization of M-sand in concrete production: A review
- Studying the effect of nanofillers in civil applications: A review
- Studies on the anticorrosive effect of phytochemicals on mild steel, carbon steel, and stainless-steel surfaces in acid and alkali medium: A review
- Nanotechnology for calcium aluminate cement: thematic analysis
- Towards sustainable concrete pavements: a critical review on fly ash as a supplementary cementitious material
- Optimizing rice husk ash for ultra-high-performance concrete: a comprehensive review of mechanical properties, durability, and environmental benefits
- Research Articles
- Investigation of the corrosion performance of HVOF-sprayed WC-CoCr coatings applied on offshore hydraulic equipment
- A systematic review of metakaolin-based alkali-activated and geopolymer concrete: A step toward green concrete
- Evaluation of color matching of three single-shade composites employing simulated 3D printed cavities with different thicknesses using CIELAB and CIEDE2000 color difference formulae
- Novel approaches in prediction of tensile strain capacity of engineered cementitious composites using interpretable approaches
- Effect of TiB2 particles on the compressive, hardness, and water absorption responses of Kulkual fiber-reinforced epoxy composites
- Analyzing the compressive strength, eco-strength, and cost–strength ratio of agro-waste-derived concrete using advanced machine learning methods
- Tensile behavior evaluation of two-stage concrete using an innovative model optimization approach
- Tailoring the mechanical and degradation properties of 3DP PLA/PCL scaffolds for biomedical applications
- Optimizing compressive strength prediction in glass powder-modified concrete: A comprehensive study on silicon dioxide and calcium oxide influence across varied sample dimensions and strength ranges
- Experimental study on solid particle erosion of protective aircraft coatings at different impact angles
- Compatibility between polyurea resin modifier and asphalt binder based on segregation and rheological parameters
- Fe-containing nominal wollastonite (CaSiO3)–Na2O glass-ceramic: Characterization and biocompatibility
- Relevance of pore network connectivity in tannin-derived carbons for rapid detection of BTEX traces in indoor air
- A life cycle and environmental impact analysis of sustainable concrete incorporating date palm ash and eggshell powder as supplementary cementitious materials
- Eco-friendly utilisation of agricultural waste: Assessing mixture performance and physical properties of asphalt modified with peanut husk ash using response surface methodology
- Benefits and limitations of N2 addition with Ar as shielding gas on microstructure change and their effect on hardness and corrosion resistance of duplex stainless steel weldments
- Effect of selective laser sintering processing parameters on the mechanical properties of peanut shell powder/polyether sulfone composite
- Impact and mechanism of improving the UV aging resistance performance of modified asphalt binder
- AI-based prediction for the strength, cost, and sustainability of eggshell and date palm ash-blended concrete
- Investigating the sulfonated ZnO–PVA membrane for improved MFC performance
- Strontium coupling with sulphur in mouse bone apatites
- Transforming waste into value: Advancing sustainable construction materials with treated plastic waste and foundry sand in lightweight foamed concrete for a greener future
- Evaluating the use of recycled sawdust in porous foam mortar for improved performance
- Improvement and predictive modeling of the mechanical performance of waste fire clay blended concrete
- Polyvinyl alcohol/alginate/gelatin hydrogel-based CaSiO3 designed for accelerating wound healing
- Research on assembly stress and deformation of thin-walled composite material power cabin fairings
- Effect of volcanic pumice powder on the properties of fiber-reinforced cement mortars in aggressive environments
- Analyzing the compressive performance of lightweight foamcrete and parameter interdependencies using machine intelligence strategies
- Selected materials techniques for evaluation of attributes of sourdough bread with Kombucha SCOBY
- Establishing strength prediction models for low-carbon rubberized cementitious mortar using advanced AI tools
- Investigating the strength performance of 3D printed fiber-reinforced concrete using applicable predictive models
- An eco-friendly synthesis of ZnO nanoparticles with jamun seed extract and their multi-applications
- The application of convolutional neural networks, LF-NMR, and texture for microparticle analysis in assessing the quality of fruit powders: Case study – blackcurrant powders
- Study of feasibility of using copper mining tailings in mortar production
- Shear and flexural performance of reinforced concrete beams with recycled concrete aggregates
- Advancing GGBS geopolymer concrete with nano-alumina: A study on strength and durability in aggressive environments
- Leveraging waste-based additives and machine learning for sustainable mortar development in construction
- Study on the modification effects and mechanisms of organic–inorganic composite anti-aging agents on asphalt across multiple scales
- Morphological and microstructural analysis of sustainable concrete with crumb rubber and SCMs
- Structural, physical, and luminescence properties of sodium–aluminum–zinc borophosphate glass embedded with Nd3+ ions for optical applications
- Eco-friendly waste plastic-based mortar incorporating industrial waste powders: Interpretable models for flexural strength
- Bioactive potential of marine Aspergillus niger AMG31: Metabolite profiling and green synthesis of copper/zinc oxide nanocomposites – An insight into biomedical applications
- Preparation of geopolymer cementitious materials by combining industrial waste and municipal dewatering sludge: Stabilization, microscopic analysis and water seepage
- Seismic behavior and shear capacity calculation of a new type of self-centering steel-concrete composite joint
- Sustainable utilization of aluminum waste in geopolymer concrete: Influence of alkaline activation on microstructure and mechanical properties
- Optimization of oil palm boiler ash waste and zinc oxide as antibacterial fabric coating
- Tailoring ZX30 alloy’s microstructural evolution, electrochemical and mechanical behavior via ECAP processing parameters
- Comparative study on the effect of natural and synthetic fibers on the production of sustainable concrete
- Microemulsion synthesis of zinc-containing mesoporous bioactive silicate glass nanoparticles: In vitro bioactivity and drug release studies
- On the interaction of shear bands with nanoparticles in ZrCu-based metallic glass: In situ TEM investigation
- Developing low carbon molybdenum tailing self-consolidating concrete: Workability, shrinkage, strength, and pore structure
- Experimental and computational analyses of eco-friendly concrete using recycled crushed brick
- High-performance WC–Co coatings via HVOF: Mechanical properties of steel surfaces
- Mechanical properties and fatigue analysis of rubber concrete under uniaxial compression modified by a combination of mineral admixture
- Experimental study of flexural performance of solid wood beams strengthened with CFRP fibers
- Eco-friendly green synthesis of silver nanoparticles with Syzygium aromaticum extract: characterization and evaluation against Schistosoma haematobium
- Predictive modeling assessment of advanced concrete materials incorporating plastic waste as sand replacement
- Self-compacting mortar overlays using expanded polystyrene beads for thermal performance and energy efficiency in buildings
- Enhancing frost resistance of alkali-activated slag concrete using surfactants: sodium dodecyl sulfate, sodium abietate, and triterpenoid saponins
- Equation-driven strength prediction of GGBS concrete: a symbolic machine learning approach for sustainable development
- Empowering 3D printed concrete: discovering the impact of steel fiber reinforcement on mechanical performance
- Advanced hybrid machine learning models for estimating chloride penetration resistance of concrete structures for durability assessment: optimization and hyperparameter tuning
- Influence of diamine structure on the properties of colorless and transparent polyimides
- Post-heating strength prediction in concrete with Wadi Gyada Alkharj fine aggregate using thermal conductivity and ultrasonic pulse velocity
- Experimental and RSM-based optimization of sustainable concrete properties using glass powder and rubber fine aggregates as partial replacements
- Special Issue on Recent Advancement in Low-carbon Cement-based Materials - Part II
- Investigating the effect of locally available volcanic ash on mechanical and microstructure properties of concrete
- Flexural performance evaluation using computational tools for plastic-derived mortar modified with blends of industrial waste powders
- Foamed geopolymers as low carbon materials for fire-resistant and lightweight applications in construction: A review
- Autogenous shrinkage of cementitious composites incorporating red mud
- Mechanical, durability, and microstructure analysis of concrete made with metakaolin and copper slag for sustainable construction
- Special Issue on AI-Driven Advances for Nano-Enhanced Sustainable Construction Materials
- Advanced explainable models for strength evaluation of self-compacting concrete modified with supplementary glass and marble powders
- Analyzing the viability of agro-waste for sustainable concrete: Expression-based formulation and validation of predictive models for strength performance
- Special Issue on Advanced Materials for Energy Storage and Conversion
- Innovative optimization of seashell ash-based lightweight foamed concrete: Enhancing physicomechanical properties through ANN-GA hybrid approach
- Production of novel reinforcing rods of waste polyester, polypropylene, and cotton as alternatives to reinforcement steel rods