Quokka swarm optimization: A new nature-inspired metaheuristic optimization algorithm
-
Wijdan Jaber AL-kubaisy


Abstract
Problem
Metaheuristics are efficient algorithms designed to address a broad spectrum of optimization challenges and offer satisfactory solutions, even in scenarios of limited processing capability or incomplete information. It has been observed that no single metaheuristic algorithm is universally ideal for all applications. This realization underscores the opportunity for the introduction of new metaheuristic algorithms or enhancements to existing ones.
Aim
The aim of this work is to propose Quokka swarm optimization (QSO), a novel nature-inspired metaheuristic optimization technique. The QSO simulates the cooperative behavior of quokka animals, which can be used to address optimization issues.
Method
A group of common unconstrained and constrained test functions is employed to demonstrate the strength of the proposed approach. To test the performance of QSO, 43 popular test functions that are used in the optimization were employed as benchmarks. The solutions have been refining their positions in tandem with the ongoing discovery of the best solution. In addition, QSO can substitute the worst quokka with the best child found so far to improve the solutions. Performance comparisons using the Blue monkey swarm optimization, Gray wolf optimization, Biogeography-based optimizer, Artificial bee colony, Particle swarm optimization, and Gravitational search algorithm were also performed.
Results
The obtained results showed that QSO is competitive in comparison to the chosen metaheuristic algorithms.
1 Introduction
The primary aim of optimization is to identify the most suitable solution while considering the constraints and requirements of the problem at hand. Multiple solutions may exist for a given problem, and the objective function serves as a means to compare them and select the best one. The nature of the problem dictates the choice of function to be utilized. In transportation network optimization, e.g., a common objective is the reduction of trip time or costs. However, a critical aspect of the optimization process lies in selecting the appropriate objective function. Multi-objective problems involve the optimization of multiple objectives simultaneously, employing various objective functions [1]. In recent years, bio-inspired optimization algorithms have gained popularity due to their ease of use, robustness, and ability to perform parallel computation [2]. Many real-world problems are highly complex, featuring a diverse array of potential solutions, nonlinear constraints, and interconnected variables. This complexity underscores the need for a method capable of addressing challenging optimization problems in real-time.
The use of metaheuristic algorithms is one such method [3]. In order to be successful, a search algorithm must establish an effective equilibrium between exploration and exploitation. In this respect, Evolutionary algorithms (EAs) [4] like Genetic algorithms (GAs) [5], Evolutionary strategies (ES) [6], Evolutionary programming (EP) [7], and Genetic programming [8] are examples of additional well-known instance. Metaheuristics are broadly classified into three main classes: EAs, physics based (PB), and Swarm intelligence (SI) algorithms. EAs, which constitute the first class, get their inspiration from the genetic and evolutionary characteristics of living things. The GA is the most widely used algorithm in this field. In an effort to imitate the ideas of Darwinian evolution, Holland created GA in 1975 [9]. The second class is PB. Typically, these optimization methods imitate physical rules. The algorithm most widely favored in this category is Gravitational search algorithm (GSA) based algorithmic rule, in which its fundamental physical theory is inspired from Newton’s law of universal gravitation [10]. In SI, techniques simulate the intelligence of swarms, flocks, schools, or groups of animals in their natural habitat. The most popular algorithms in this class are Ant colony optimization [11], Particle swarm optimization (PSO) [12], and Artificial bee colony (ABC) algorithm [13]. Metaheuristics frequently possess the capability to partition the search process into distinct exploration and exploitation phases [14], notwithstanding the variations among them. The exploration phase entails thoroughly investigating the search space, which necessitates the utilization of stochastic operators for widespread, random search across the entire space. Conversely, the term “exploitation” signifies the local search proficiency focused on the previously explored regions, derived from the initial exploration phase. Because of the stochastically based nature of metaheuristics, it is thought to be difficult to achieve the proper balance between these stages [15]. The behavior of Quokka swarms served as inspiration for the novel SI method that is presented in this study. The suggested algorithm can strike a harmonious balance between the exploration and exploitation phases and has a small number of parameters, which makes it simple to build and suitable for addressing numerous optimization problems. The constraints posed by current algorithms, encompass concerns regarding convergence speed, scalability, and the ability to handle complex optimization tasks effectively. These challenges emphasize the need for fresh perspectives in swarm optimization. Our proposed algorithm endeavors to address these obstacles by integrating pioneering functionalities aimed at boosting performance and surmounting the constraints present in previous methodologies.
The existing algorithms include some limitation related with scalability, convergence speed, and the capacity to manage intricate optimization jobs efficiently. These difficulties highlight the need for new ideas in swarm optimization. The suggested algorithm attempts to overcome these challenges by including innovative features designed to increase efficiency and overcome the limitations of earlier approaches.
The main contributions of this work are:
The main aim of this research is to design and develop a new algorithm called Quokka Swarm Optimization (QSO) as a novel metaheuristic algorithm tailored for solving complex optimization problems.
The efficiency of the QSO algorithm in solving both single and multi-objective optimization problems, which means that it efficiently explores trade-off solutions, providing decision-makers with a diverse set of best solutions to choose from.
This algorithm has an adaptive parameter control, where it continuously adjusts parameters such as acceleration coefficients and swarm size. This adaptability improves convergence speed and solution quality, making it highly effective across a wide range of optimization problems.
The remainder of this work is structured as follows: related works are displayed in Section 2. The mathematical model and inspiration for the QSO algorithm are presented in Section 3. Results and a description of test functions are presented in Section 4. Section 5 concludes the work and makes a number of recommendations for additional research trajectories.
2 Related works
SI-inspired optimization techniques have gained popularity in recent years. Operating in a decentralized manner, these techniques mimic the behavior of swarms of social insects, bird flocks, or schooling fish. Such strategies offer advantages of robustness and adaptability compared to conventional methods. SI serves as a valuable project paradigm for algorithms addressing complex issues due to these inherent properties. This field of artificial intelligence (AI) is centered on developing intelligent multi-agent systems, drawing inspiration from the cooperative behaviors observed in social insects such as ants, termites, bees, and wasps, as well as other animal species like birds or fish [16].
In 2013, Sahil and Parikshit explored the effectiveness of ABC algorithms for tackling the Traveling Salesman Problem (TSP). The fundamental purpose of TSP is for a salesman to visit a number of destinations and return to the initial city using the shortest route possible. Because domain experts are difficult to find and knowledge extraction from experts is a challenging operation, data-driven modeling becomes important. To develop rule-based form data, one must use soft computing techniques. Among the methodologies are neural networks, GAs, and PSO. The fundamental ABC algorithm offers notable strengths including robustness, rapid convergence, high adaptability, and minimal parameter configuration requirements. However, it can suffer from premature convergence during the later stages of search and occasional deviations from the required optimal value accuracy [17].
In 2014, Seyedali et al. proposed the Gray wolf optimizer (GWO), a metaheuristic influenced by gray wolves (Canis lupus). The GWO algorithm mimics the gray wolves’ innate leadership structure and hunting techniques. Alpha, beta, delta, and omega are the four different species of gray wolves used to represent the leadership hierarchy. Additionally, the three fundamental hunting techniques – looking for prey, encircling prey, and attacking prey – are used. A comparison study using PSO, Gravitational search technique (GSA), Differential evolution (DE), EP, and Evolution strategy (ES) is used to validate the results after the technique is tested on 29 well-known test functions. The outcomes imply that the GWO algorithm can perform better than a number of well-known metaheuristics. The study also addresses how to solve three common engineering design issues (tension/compression spring, welded beam, and pressure vessel designs), and it illustrates how the suggested approach is really used in optical engineering. Results from conventional engineering design concerns and real-world applications show that the suggested approach is appropriate for challenging problems with unknown search spaces. Compared with traditional optimization algorithms such as PSO and GA, GWO has the advantages of fewer parameters, simple principles, and easy implementation. However, GWO has the disadvantages of slow convergence speed, low solution accuracy, and easy to fall into the local optimum [18].
In 2015 Seyedali proposed Ant lion optimizer (ALO) algorithm. This study introduces ALO, an innovative algorithm inspired by nature. The ALO algorithm mimics the natural hunting behavior of ant lions, encompassing five key processes: the random movement of ants, building traps, capturing ants, collecting prey, and reconstructing traps. The proposed algorithm is evaluated in three stages. The first step is to test the different ALO properties using a set of 19 mathematical functions. The construction of three-bar trusses, cantilever beams, and gear trains are three classic engineering challenges that ALO resolves. Finally, ALO makes minor real-world adjustments to the designs of two ship propellers. In the first and second test phases, a variety of techniques from the literature are compared to the ALO algorithm. Results from the test function demonstrate that the proposed approach can produce highly competitive results in terms of better exploration, local optima avoidance, exploitation, and convergence. The majority of classical engineering problems are solved using the ALO method, which shows that it is effective in solving constrained problems with various search horizons. The most effective designs for ship propellers discovered show how useful the suggested technique is for solving real-world issues with unknowable search areas. ALO is a recent metaheuristic algorithm that simulates antlion’s foraging performance in finding and attacking ants. However, the ALO algorithm suffers from local optima stagnation and slow convergence speed for some optimization problems [19].
In 2016, Mohammed and Ramzy introduced a Novel optimization algorithm inspired by the traveling behavior of camels. Camels, renowned for their remarkable adaptations enabling survival in harsh desert conditions, served as the inspiration for this innovative algorithm. The Camel algorithm was employed to uncover optimal solutions across a spectrum of benchmark test functions. Through experimental comparison with GA and PSO, it became evident that the Camel algorithm exhibits a robust and practical search capability, consistently yielding superior results for a diverse range of test functions [20].
In 2018, Belal and Amal presented an algorithm designed to tackle the practical challenge of university examination timetabling, known as Meerkat swarm optimization (MSO). The MSO approach represents an innovative and intelligent solution inspired by the cooperative behaviors observed in meerkat swarms, such as foraging and nurturing. Within the MSO algorithm, meerkats are divided into two sub-groups, one dedicated to foraging and the other to caring for pups in burrows, each led by their respective alpha leaders. This strategic partitioning promotes solution diversity, enhancing users’ ability to explore and exploit the search space effectively. The effectiveness of this approach is evaluated across seven benchmark examination scheduling scenarios. Comparative analysis with Bee colony optimization (BCO) and BCO with the tournament selection method reveals that the proposed MSO algorithm offers promising solutions for various examination timetabling instances [21].
In 2019, Maha and Belal proposed a Blue monkey swarm optimization (BMSO), this algorithm is inspired from the blue monkey swarms in nature. The BMSO method determines the number of males in a given group. Outside of the breeding season, blue monkey groups, like other forest guenons, usually have only one adult male. Erythrocebus patas is a species of monkey related to the Patas monkey. This algorithm is tested by using 43 well-known optimization test functions as benchmarks. A performance comparison of BM’s results with those of ABC, GSA, Biogeography-based optimizer (BBO), and PSO also serves to validate the method. The results obtained demonstrated the competitiveness of the BMSO algorithm when pitted against the selected metaheuristic algorithms; furthermore, the BMSO algorithm may converge to the global optimal via optimization problems. Additionally, this method handles real-world issues with limitations and ambiguous search spaces quite effectively. It should be highlighted that the BMSO technique incorporates a number of variables and can outperform other algorithms in a number of test functions [22].
In 2020, Belal Al-Khateeb et al. proposed a Rock hyraxes swarm optimization (RHSO) takes inspiration from the collective behavior of rock hyrax swarms in their natural habitat. RHSO algorithm replicates the foraging techniques and unique perspective employed by rock hyraxes in their search for food. Rock hyraxes are social animals that live in colonies or groups. To maintain the colony’s safety, a dominant male keeps a constant check on it. The RHSO method is evaluated using 48 test functions (22 unimodal and 26 multimodal), which are often utilized in the optimization field. A comparison efficiency analysis compares RHSO to PSO, ABC, GSA, and GWO. The collected results confirmed the RHSO algorithm’s superiority over the chosen algorithms, and the data showed the RHSO’s capacity to optimize in the direction of the global optimal as it does well in both exploitation and exploration tests. With constraints and a new search space, RHSO is also quite effective at solving problems in the real world. It is worth noting that the RHSO method has few variables and can outperform the selected algorithms in many test functions [23].
Finally, in 2022, Zuyan et al., proposed an Egret swarm optimization algorithm (ESOA). The Great Egret and the Snowy Egret, two species of egrets, were the inspiration for the ESOA. A sit-and-wait technique, an aggressive strategy, and discriminatory criteria make up the three primary parts of ESOA. The egret employs a trainable sit-and-wait strategy, guiding it to pinpoint the most probable solutions using a pseudo-gradient estimator. In contrast, an aggressive technique involves random wandering and encirclement processes to facilitate an optimal search for solutions. By leveraging the discriminant model, these two approaches are harmonized. This proposed method not only presents a parallel framework but also a dependable mechanism for learning parameters from historical data, applicable across a wide range of scenarios. The performance of the ESOA is compared against PSO, GA, and DE on 36 benchmark functions and three engineering challenges [24].
When studying the literature research, it was found that the QSO is similar to other algorithms in some respects, such as being often inspired by natural phenomena or observed collective behaviors. However, it differs in the design of the mathematical model and the implementation approach. Additionally, the QSO algorithm stands out from other algorithms by having fewer variables, which makes it easier to understand and use. Table 1 explains the summary of the related works.
Summary of related works
| Study | Year | Description | Limitations |
|---|---|---|---|
| PSO algorithm | 2004 | Inspired by bird behavior, simulates collective bird behavior in response to changes. Used in various optimization situations | Convergence to local optima and sensitive to the parameter |
| ABC algorithm | 2013 | Used for the TSP. Known for robustness, rapid convergence, high adaptability, minimal parameter needs | Can suffer from premature convergence and deviations from best value accuracy |
| GWO algorithm | 2014 | Inspired by gray wolves’ social structure and hunting techniques. Utilized in various engineering challenges and optical engineering | May experience slow convergence speed, low solution accuracy, and risk of falling into local optima |
| BMSO algorithm | 2019 | Inspired by blue monkey swarms. Tested using optimization test functions and compared with various algorithms | The BMSO algorithm likely faces typical limitations of metaheuristic algorithms. While effective in the tested scenarios, its scalability and performance in more complex real-world problems require further exploration |
| GSA algorithm | 2009 | GSA is nature-inspired optimization algorithm used for solving optimization problems and an example of physics-based algorithmic rule in which its fundamental physical theory is inspired from Newton’s law of universal gravitation | Convergence speed and sensitivity to parameters |
| BBO algorithm | 2008 | The BBO algorithm is inspired by the theory of biogeography, which suggests that the distribution of species in different habitats is influenced by various factors such as immigration, emigration, mutation, and extinction | Computational complexity, limited exploration |
3 Quokka animals
In this section, the motivation of the proposed algorithm and the mathematical model are discussed.
3.1 Inspiration
The quokka is the only member of the genus Setonix. It is a small animal about the size of a domestic cat. The quokka, a marsupial member of the macropod family (which includes kangaroos and wallabies), is primarily nocturnal and herbivorous. Its habitat includes smaller islands situated off the Western Australian coast, notably Rottnest Island near Perth and Bald Island near Albania. There is also a mainland colony located within protected nature reserves [25]. The quokka weighs 2.5–5 kg (5.5–11.0 lb) and is 40–90 cm (16–35 in) long, with a tail 25–30 cm (9.8–11.8 in) long. The quokka is somewhat short, full body build, round ears, can climb small trees and bushes. It has coarse grizzled brown fur, which is orange below. Quokkas rest during daylight hours in compact groups amidst dense vegetation. At night, they exhibit heightened activity levels, often congregating around water holes in groups of up to 150 individuals [26]. The quokka feeds on local grasses, leaves, seeds, roots, and swallows its food immediately, regurgitating it later to chew ruminant food. If the Quokka animal remains for long periods without rain in dry and hot weather, the individuals farthest from the water source are exposed to the highest mortality rate, in addition, temperatures deplete plants of water and nitrogen stores, and create nitrogen deficiency problems, and the quokka animal may suffer from dehydration, but research has shown that it has excellent thermoregulatory capabilities, being able to cope with temperatures up to 44°C [27]. Here are some potential inspirations from quokka behaviors:
Social interaction: Quokkas are known for their social nature and ability to live in groups and through observing how quokkas interact within their communities led us to inspired algorithm that simulate social behaviors and cooperation among individuals.
Adaptability: Quokkas are resilient and resourceful in their foraging and survival tactics, having adapted to a variety of settings.
Exploration and foraging: Quokkas exhibit curious and exploratory behavior, often venturing out to explore new territories in search of food and resources, this led to suggest a new swarm optimization algorithm that balances exploration and exploitation to find best solutions.
3.2 Mathematical model and algorithm
In this section, we introduce the QSO algorithm along with its corresponding mathematical model.
3.2.1 Position update
The update of each quokka’s position within the group is influenced by the best quokka position within that group, as described by the following equations:
(Where D
old represents the Drought and its value between [0,1]), T represents the ratio of the temperature, which is between 0.2 and 0.44, and H represents the ratio of the humidity and it is between 0.3 and 0.65. The reason for choosing these values is that quokka animals are able to tolerate temperatures and humidity between these ratios. ∆w represents the differences of weight between the leader and the quokka i, rand represents the random number and its value is between 0 and 1, ∆X represents the differences of position between the leader and quokka i, quokka’s new position is represented by
3.2.2 Quokka optimization algorithm
The behavior of quokka animals is simulated by the QSO algorithmic program. In this section, we will elucidate the pseudo-code of the proposed QSO algorithm. In the exploratory mode, the QSO initially generates random solutions and evaluates their fitness. It then initializes values for temperature, humidity, and nitrogen. When the global optimum may be in proximity, it transitions from exploration to local exploitation mode, concentrating on promising locations and designating the quokka with the highest fitness as the leader. The leader represents the best solution to optimization problems thereafter. The search agents recommence their exploratory movements, transitioning into a new phase of exploitation. Humidity and position are updated for each quokka according to equations (1) and (2). The fitness of the leader is evaluated, and subsequently, the fitness for every quokka is updated. Upon reaching the stopping condition, the procedure kept going and returned the leader as the closest approximation to the best solution to the optimization problem. Figure 1 shows the flowchart of the QSO algorithm.
| 1 – Initialize the quokka population b i (i = 1…n). |
| 2 – Initialize the temperature T, humidity H, and nitrogen N, where (T ∊ [0.2, 0.44]), (H ∊ [0.3,0.65]), (N ∊ [0,1]). |
| 3 – Compute the fitness for each quokka. |
| 4 – Start loop. |
| 5 – Select the best quokka to be the leader. |
| 6 – Update drought (D) and position (X) for each Quokka by using equations (1) and (2). |
| 7 – Find the fitness of the leader. |
| 8 – Update the fitness for every quokka. |
| 9 – If not stop condition return to step 5. |
| 10 – End loop. |
| 11 – Return the best solution. |

Flowchart of QSO algorithm.
4 Results and discussion
In this section, we scrutinize and assess the performance of the QSO algorithm using a set of 43 benchmark functions, including some commonly used ones in the field. We selected these functions to contrast the outcomes of our algorithm with those of several well-known metaheuristic algorithms. Tables 2–4 illustrate the 43 test functions chosen, where D denotes the function’s dimension, Lb and Ub represent the function’s lower and upper bounds in the search space, respectively, and Opt denotes the optimal value. Typically, the test functions employed are optimization functions designed for minimization, and they can belong to either unimodal or multimodal benchmark categories. Unimodal test functions can be used to assess the convergence and application of an algorithm because they have a single ideal value. Despite having several optimum values, multimodal test functions are more challenging to execute than unimodal test functions. To reach and approximate the global optimum, an algorithm should steer clear of local optima; as a result, multimodal test functions can be used to benchmark algorithm exploration and local optima avoidance. We use these benchmark functions to validate the algorithm, which leads to identifying potential weaknesses or errors that need to be addressed. Furthermore, it helps us to compare the performance of the algorithm with other algorithms.
Unimodal benchmark functions
| Equation | Test name | Opt | Ub | Lb | D |
|---|---|---|---|---|---|
|
|
Sphere | 0 | 100 | −100 | 30 |
|
|
Schwefel 2.22 | 0 | 100 | −100 | 2 |
|
|
Schwefel 2.21 | 0 | 100 | −100 | 2 |
|
|
Rosenbrock | 0 | 2.048 | −2.048 | 30 |
|
|
Schwefel 1.2 | 0 | 100 | −100 | 2 |
|
|
Bohachevsky N.1 | 0 | 100 | −100 | 2 |
|
|
Booth | 0 | 10 | −10 | 2 |
|
|
Zakharov | 0 | 5.12 | −5.12 | 2 |
|
|
Dixon Price | 0 | 10 | −10 | 0 |
|
|
Exponential | −1 | 1 | −1 | −1 |
|
|
Matyas | 0 | 10 | −10 | 0 |
|
|
Schwefel 2.23 | 0 | 100 | −100 | 2 |
|
|
Schwefel 2.20 | 0 | 100 | −100 | 2 |
|
|
Schaffer N2 | 0 | 36 | −36 | 2 |
|
|
Schaffer N3 | 0.0015 | 100 | −100 | 2 |
|
|
Schaffer N1 | 0 | 100 | −100 | 2 |
|
|
Powell | 0 | 5 | −4 | 10 |
|
|
Power Sum | 0 | 4 | 0 | 4 |
Multimodal benchmark functions (fixed)
| Equation | Test name | Type | Opt | Ub | Lb | D |
|---|---|---|---|---|---|---|
|
|
Branin | F | 0.3979 | 15 | ‒5 | 2 |
|
|
Hartmann 3-D | F | ‒3.8628 | 1 | 0 | 3 |
|
|
Hartmann 6-D | F | ‒3.3224 | 1 | 0 | 6 |
|
|
Ackley3 | F | ‒195.629 | 32 | ‒32 | 2 |
|
|
Easom | F | ‒1 | 10 | ‒1 | 2 |
|
|
Trid | F | ‒50 | 36 | ‒36 | 6 |
|
|
Gramacy & Lee | F | ‒0.869 | 2.5 | 0.5 | 1 |
|
|
Griewank | F | 0 | 600 | ‒600 | 30 |
Multimodal benchmark functions (not fixed)
| Equation | Test name | Type | Opt | Ub | Lb | D |
|---|---|---|---|---|---|---|
|
|
Ackley | N | 0 | 10 | ‒10 | 2 |
|
|
Step1 | N | 0 | 100 | ‒100 | 30 |
|
|
Quartic | N | 0 | 1.28 | ‒1.28 | 10 |
|
|
Six-Hump Camel | N | ‒1.0316 | 5 | ‒5 | 2 |
|
|
Goldstein Price | N | 0.3979 | 15 | ‒5 | 2 |
|
|
Schwefel 2.26 | N | ‒12569.5 | 500 | ‒500 | 30 |
|
|
Penalized 1 | N | 0 | 50 | ‒50 | 2 |
|
|
Penalized 2 | N | 0 | 50 | ‒50 | 2 |
|
|
Three-Hump Camel | N | ‒12569.5 | 500 | ‒500 | 30 |
|
|
Bohachevsky N. 2 | N | 0 | 10 | ‒10 | 2 |
|
|
Brid | N | ‒106.7645 | 2pi | 2pi | 2 |
|
|
Cross in Tiny | N | ‒2.06261 | 10 | ‒10 | 2 |
|
|
Keane | N | ‒0.6737 | 10 | 0 | 2 |
|
|
Egg Holder | N | ‒959.641 | 512 | ‒512 | 2 |
|
|
Holder | N | ‒19.2085 | 1 | ‒10 | 2 |
|
|
Schwefel | N | 0 | 500 | ‒500 | 2 |
|
|
Michalewicz | N | ‒1.8013 | 2.21 | 1.57 | 2 |
The QSO algorithm and the comparison algorithms are tested for each benchmark function under identical conditions (1,000 iterations), separate runs for 30 times, and a population size of 30. Tables 5–10 display the statistical findings (average and standard deviation). The QSO method is compared against BMSO [22], ABC [28], PSO [29], GSA [30], GWO [31], and BBO [32] for the purpose of confirming the results.
Results of unimodal benchmarks functions
| No. | QSO | BMSO | GWO | |||
|---|---|---|---|---|---|---|
| AV | STD | AV | STD | AV | STD | |
| F1 | 6.06 × 10⁻¹⁴ | 1.72294 × 10⁻¹³ | 0.00000000009036925 | 1.32178 × 10⁻¹² | 8.321× 10−62 | 2.01043 × 10−61 |
| F2 | 1.2 × 10−126 | 6.7361 × 10−126 | 6.69373 × 10−47 | 0 | 8.74 × 10−216 | 0 |
| F3 | 1.2 × 10−112 | 6.6986 × 10−112 | 3.61157059 × 10−47 | 0 | 1.26 × 10−189 | 0 |
| F4 | 21.33485 | 32.18975311 | 45.05824 | 57.41600484 | 40.66229 | 51.6464659 |
| F5 | 2.3 × 10−151 | 1.2689 × 10−150 | 9.11567 × 10−91 | 0 | 2.89 × 10−306 | 0 |
| F6 | 0 | 0 | 0 | 0 | 0 | 0 |
| F7 | 0 | 0 | 0 | 0 | 1.541 × 10⁻⁷ | 1.11392 × 10⁻⁷ |
| F8 | 9.6 × 10−232 | 0 | 9.85874 × 10−95 | 0 | 0 | 0 |
| F9 | 3.7 × 10⁻³² | 5.5674 × 10−48 | 3.6978 × 10⁻³² | 5.66594 × 10−48 | 3.457 × 10⁻⁸ | 3.12228 × 10⁻⁸ |
| F10 | −1 | 0 | −1 | 0 | −1 | 0 |
| F11 | 1.5 × 10−164 | 0 | 1.00289 × 10−89 | 0 | 8.42 × 10−204 | 0 |
| F12 | 0 | 0 | 0 | 0 | 0 | 0 |
| F13 | 2.4 × 10−118 | 1.2982 × 10−117 | 1.10936 × 10−45 | 0 | 3.21 × 10−214 | 0 |
| F14 | 0 | 0 | 0 | 0 | 0 | 0 |
| F15 | 0.001567 | 8.8219 × 10⁻¹⁹ | 0.00156 | 4.95042 × 10⁻¹⁴ | 0.001567 | 2.3979 × 10⁻⁷ |
| F16 | 0 | 0 | 0 | 0 | 0 | 0 |
| F17 | 0.000539 | 0.000514742 | 7.10209 × 10⁻⁵ | 2.46282 × 10⁻⁵ | 4.949 × 10⁻⁷ | 6.09827 × 10⁻⁷ |
| F18 | 0.003809 | 0.004806622 | 0.002583809 | 0.008358561 | 0.1068024 | 0.261322987 |
Results of unimodal benchmarks functions
| No. | PSO | GSA | ABC | BBO | ||||
|---|---|---|---|---|---|---|---|---|
| AV | STD | AV | STD | AV | STD | AV | STD | |
| F1 | 2.54029 × 10⁻⁸ | 7.98316 × 10⁻⁸ | 2.14471 × 10⁻¹⁷ | 5.63657 × 10⁻¹⁸ | 0.001252987 | 0.000811156 | 0.002774887 | 0.000688769 |
| F2 | 1.0534 × 10−55 | 5.14643 × 10−55 | 9.31038 × 10⁻¹¹ | 5.16071 × 10⁻¹¹ | 0.000253748 | 0.000152438 | 5.84342 × 10⁻⁹ | 1.14509 × 10⁻⁸ |
| F3 | 2.02803 × 10−51 | 1.10053 × 10−50 | 6.01947 × 10⁻¹¹ | 2.99344 × 10⁻¹¹ | 0.001662766 | 0.001098175 | 4.45571 × 10⁻⁷ | 6.05727 × 10⁻⁷ |
| F4 | 75.79913333 | 71.462 | 26.07697667 | 35.00419754 | 171.07381 | 9.52652 | 28.87917333 | 4.65628 |
| F5 | 1.8593 × 10−90 | 1.01836 × 10−89 | 6.07849 × 10⁻²¹ | 6.02163 × 10⁻²¹ | 4.55395 × 10⁻⁶ | 6.63091 × 10⁻⁶ | 2.10227 × 10⁻⁹ | 4.80854 × 10⁻⁹ |
| F6 | 1.66533 × 10⁻¹⁶ | 5.8874 × 10⁻¹⁶ | 0 | 0 | 1.42235 × 10⁻⁵ | 1.41276 × 10⁻⁵ | 3.01983 × 10⁻¹² | 1.615 × 10⁻¹¹ |
| F7 | 6.96827 × 10⁻³⁰ | 2.47526 × 10⁻²⁹ | 1.85221 × 10⁻²⁰ | 1.43471 × 10⁻²⁰ | 4.51821 × 10⁻⁷ | 5.78899 × 10⁻⁷ | 8.95268 × 10⁻¹⁰ | 2.22824 × 10⁻⁹ |
| F8 | 4.0826 × 10−104 | 2.0807 × 10−103 | 3.11163 × 10⁻²⁰ | 4.09121 × 10⁻²⁰ | 1.8417 × 10⁻⁹ | 1.69934 × 10⁻⁹ | 7.82734 × 10⁻¹⁶ | 2.00333 × 10⁻¹⁵ |
| F9 | 0.085226667 | 0.408424714 | 7.21111 × 10⁻²⁰ | 7.48794 × 10⁻²⁰ | 2.19797 × 10⁻⁶ | 2.14305 × 10⁻⁶ | 1.29442 × 10⁻⁸ | 1.65908 × 10⁻⁸ |
| F10 | −1 | 0 | −1 | 0 | −0.99994133 | 3.8213 × 10⁻⁵ | −0.999951 | 1.21343 × 10⁻⁵ |
| F11 | 6.77411 × 10−66 | 3.71033 × 10−65 | 1.56958 × 10⁻²¹ | 1.18656 × 10⁻²¹ | 1.32931 × 10⁻⁷ | 1.36422 × 10⁻⁷ | 2.80296 × 10⁻⁸ | 5.51136 × 10⁻⁸ |
| F12 | 0 | 0 | 1.7161 × 10−99 | 4.233 × 10−99 | 2.94618 × 10⁻³¹ | 9.23942 × 10⁻³¹ | 2.26294 × 10−69 | 1.23937 × 10−68 |
| F13 | 9.14357 × 10−46 | 5.00814 × 10−45 | 1.52258 × 10⁻¹⁰ | 6.4698 × 10⁻¹¹ | 0.000561859 | 0.000278038 | 1.69745 × 10⁻⁸ | 3.52861 × 10⁻⁸ |
| F14 | 6.95737 × 10⁻¹⁶ | 2.22941 × 10⁻¹⁵ | 0.005331387 | 0.006958944 | 5.26439 × 10⁻⁹ | 7.65922 × 10⁻⁹ | 1.6606 × 10⁻¹³ | 9.08585 × 10⁻¹³ |
| F15 | 0.015050889 | 0.069811002 | 0.003418706 | 0.002052954 | 0.001717237 | 0.000144094 | 0.0018911 | 0.000475574 |
| F16 | 1.33227 × 10⁻¹⁶ | 5.70145 × 10⁻¹⁶ | 0.020150599 | 0.031993769 | 1.06425 × 10⁻⁵ | 8.70544 × 10⁻⁶ | 4.38922 × 10⁻¹⁵ | 2.34985 × 10⁻¹⁴ |
| F17 | 0.026647349 | 0.085179668 | 7.38449 × 10⁻⁵ | 5.66791 × 10⁻⁵ | 0.000136074 | 8.18357 × 10⁻⁵ | 0.000198973 | 0.000104829 |
| F18 | 1863.431315 | 6520.088474 | 0.028399943 | 0.033204355 | 0.020449223 | 0.010801132 | 0.01795016 | 0.015663814 |
Results of Multimodal Benchmarks Functions (fixed) for (QSO, BMSO and GWO).
| No. | QSO | BMSO | GWO | |||
|---|---|---|---|---|---|---|
| AV | STD | AV | STD | AV | STD | |
| F19 | 0.39789 | 1.6938 × 10⁻¹⁶ | 0.3979 | 1.14919 × 10⁻¹⁶ | 0.3978879 | 5.97628 × 10⁻⁷ |
| F20 | −3.8628 | 3.16177 × 10⁻¹⁵ | −3.8628 | 9.19352 × 10⁻¹⁶ | −3.8620812 | 0.001938044 |
| F21 | −3.3224 | 1.35504 × 10⁻¹⁵ | −3.3224 | 1.37903 × 10⁻¹⁵ | −3.2642539 | 0.099876517 |
| F22 | −195.629 | 5.78152 × 10⁻¹⁴ | −195.629 | 0 | −195.62903 | 2.8506 × 10⁻⁸ |
| F23 | −1 | 0 | −1 | 0 | −1 | 0 |
| F24 | −50 | 0 | −50 | 0 | −49.99989 | 8.03012 × 10⁻⁵ |
| F25 | −0.86901 | 3.38761 × 10⁻¹⁶ | −0.869 | 2.29838 × 10⁻¹⁶ | −0.869 | 1.1292 × 10⁻¹⁶ |
| F26 | 0.004431276 | 0.00808136 | 0.014644 | 0.001093158 | 0.0049342 | 0.0000495042085227491 |
Results of Multimodal Benchmarks Functions (fixed) for (PSO, GSA, ABC and BBO).
| No. | PSO | GSA | ABC | BBO | ||||
|---|---|---|---|---|---|---|---|---|
| AV | STD | AV | STD | AV | STD | AV | STD | |
| F19 | 0.482471019 | 91.46533617 | 0.3979 | 0 | 0.39789 | 1.6938 × 10⁻¹⁶ | 0.39789 | 1.6938 × 10⁻¹⁶ |
| F20 | −3.86278215 | 0 | −3.862796667 | 1.82574 × 10⁻⁵ | −3.8628 | 3.16177 × 10⁻¹⁵ | −3.8628 | 3.16177 × 10⁻¹⁵ |
| F21 | −3.27047482 | 1.35504 × 10⁻¹⁵ | −3.3224 | 1.35504 × 10⁻¹⁵ | −3.3224 | 1.35504 × 10⁻¹⁵ | −3.27472 | 0.059394127 |
| F22 | −195.629022 | 8.6681 × 10−100 | −195.629 | 5.78152 × 10⁻¹⁴ | −195.629 | 5.78152 × 10⁻¹⁴ | −195.629 | 5.78152 × 10⁻¹⁴ |
| F23 | −1 | 0.001496152 | −1 | 0 | −1 | 0 | −1 | 0 |
| F24 | −50 | 1.1292 × 10⁻¹⁶ | −50 | 0 | −49.9974033 | 0.002460934 | −50 | 0 |
| F25 | 0.0625 | 376.9030802 | −0.869 | 1.1292 × 10⁻¹⁶ | −2.8739 | 9.03362 × 10⁻¹⁶ | −0.769653 | 0.145673467 |
| F26 | 0.006813334 | 6.84966 × 10⁻⁵ | 3.713554417 | 0.184655 | 0.844420333 | 0.054168498 | 0.745567333 | 0.038563 |
Results of Multimodal Benchmarks Functions (not fixed) for (QSO, BMSO and GWO).
| No. | QSO | BMSO | GWO | |||
|---|---|---|---|---|---|---|
| AV | STD | AV | STD | AV | STD | |
| F27 | 8.8818 × 10⁻¹⁶ | 4.01173 × 10⁻³¹ | 8.8818 × 10⁻¹⁶ | 1.02069 × 10⁻³¹ | 8.882 × 10⁻¹⁶ | 4.01173 × 10⁻³¹ |
| F28 | 5.10094 × 10⁻¹¹ | 2.7584 × 10⁻¹⁰ | 4.20319 × 10⁻¹⁰ | 7.08186 × 10⁻¹² | 0.551828 | 0.323495536 |
| F29 | 0.004705647 | 0.002709316 | 0.014140107 | 0.204521986 | 0.0009717 | 0.000902519 |
| F30 | −1.0316 | 6.77522 × 10⁻¹⁶ | −1.0316 | 4.59676 × 10⁻¹⁶ | −1.0316284 | 4.31084 × 10⁻⁹ |
| F31 | 3 | 0 | 3 | 9.19352 × 10⁻¹⁶ | 3.0000079 | 9.28286 × 10⁻⁶ |
| F32 | −7567.041986 | 1726.386078 | −6111.09 | 782.4899637 | −6095.8133 | 790.1489749 |
| F33 | 2.3558 × 10⁻³¹ | 0 | 2.3558 × 10⁻³¹ | 4.53276 × 10−47 | 1.451 × 10⁻⁸ | 1.49536 × 10⁻⁸ |
| F34 | 1.3498 × 10⁻³² | 8.3511 × 10−48 | 1.3498 × 10⁻³² | 2.83297 × 10−48 | 1.475 × 10⁻⁸ | 1.90331 × 10⁻⁸ |
| F35 | 6.7782 × 10−210 | 0 | 2.05416 × 10−93 | 0 | 0 | 0 |
| F36 | 0 | 0 | 0 | 0 | 0 | 0 |
| F37 | −106.7645 | 7.2269 × 10⁻¹⁴ | −106.7645 | 1.47096 × 10⁻¹⁴ | −106.11607 | 3.551734418 |
| F38 | −2.0626 | 1.35504 × 10⁻¹⁵ | −2.0626 | 4.59676 × 10⁻¹⁶ | −2.0626119 | 3.30268 × 10⁻⁹ |
| F39 | −0.67367 | 0 | −0.6737 | 2.29838 × 10⁻¹⁶ | −0.6737 | 1.1292 × 10⁻¹⁶ |
| F40 | −959.2777 | 0.941293223 | −952.47733 | 1.380524534 | −922.42745 | 208.9098927 |
| F41 | −19.2085 | 3.61345 × 10⁻¹⁵ | −19.2085 | 0 | −19.208493 | 8.17787 × 10⁻⁶ |
| F42 | 0.000025455 | 3.44605 × 10⁻²¹ | 0.000025455 | 0 | 59.219524 | 74.58341127 |
| F43 | −1.8013 | 6.77522 × 10⁻¹⁶ | −1.8013 | 4.59676 × 10⁻¹⁶ | −1.8013 | 6.77522 × 10⁻¹⁶ |
Results of Multimodal Benchmarks Functions (not fixed) for (PSO, GSA, ABC and BBO).
| No. | PSO | GSA | ABC | BBO | ||||
|---|---|---|---|---|---|---|---|---|
| AV | STD | AV | STD | AV | STD | AV | STD | |
| F27 | 1.954 × 10⁻¹⁵ | 1.65589 × 10⁻¹⁵ | 1.70833 × 10⁻¹⁰ | 1.07462 × 10⁻¹⁰ | 0.000346327 | 0.000177635 | 4.73617 × 10⁻⁹ | 1.64321 × 10⁻⁸ |
| F28 | 1.18715 × 10⁻⁸ | 1.94462 × 10⁻⁸ | 2.22948 × 10⁻¹⁷ | 5.39243 × 10⁻¹⁸ | 0.542361333 | 0.457034324 | 1.063618333 | 0.207327884 |
| F29 | 0.695013333 | 0.77173046 | 0.004470523 | 0.002057632 | 0.00892749 | 0.002970026 | 0.001438262 | 0.000917321 |
| F30 | 15.75971404 | 0.008859934 | −1.0316 | 6.77522 × 10⁻¹⁶ | −1.0316 | 6.77522 × 10⁻¹⁶ | −1.0316 | 6.77522 × 10⁻¹⁶ |
| F31 | 3 | 0.463283793 | 3 | 0 | 3 | 0 | 3 | 0 |
| F32 | −3262.13655 | 0.059922957 | −2841.2 | 399.6513196 | −1.199E+119 | 6.0454E+119 | −8198.770697 | 572.1316689 |
| F33 | 14.01837333 | 3246.083228 | 3.15725 × 10⁻²¹ | 2.90684 × 10⁻²¹ | 1.74574 × 10⁻⁷ | 1.67124 × 10⁻⁷ | 1.90837 × 10⁻¹⁰ | 4.1117 × 10⁻¹⁰ |
| F34 | 1.34978 × 10⁻³² | 4.45392 × 10−47 | 1.84318 × 10⁻²¹ | 1.56905 × 10⁻²¹ | 5.11995 × 10⁻⁷ | 6.47527 × 10⁻⁷ | 3.41013 × 10⁻¹² | 1.70128 × 10⁻¹¹ |
| F35 | 2.2713 × 10−100 | 5.5674 × 10−48 | 6.2521 × 10⁻²¹ | 7.70769 × 10⁻²¹ | 2.49639 × 10⁻⁹ | 2.05859 × 10⁻⁹ | 0.039818667 | 0.103253557 |
| F36 | 2.96059 × 10⁻¹⁷ | 3.56623 × 10⁻⁵ | 0 | 0 | 3.18426 × 10⁻⁵ | 2.95654 × 10⁻⁵ | 0.065493007 | 0.101752452 |
| F37 | −103.115109 | 5.78238 × 10⁻¹⁷ | −106.7645 | 7.2269 × 10⁻¹⁴ | −106.7645 | 7.2269 × 10⁻¹⁴ | −106.1160467 | 3.551725182 |
| F38 | −2.06233871 | 19.98873646 | −2.0626 | 1.35504 × 10⁻¹⁵ | −2.0626 | 1.35504 × 10⁻¹⁵ | −2.0626 | 1.35504 × 10⁻¹⁵ |
| F39 | −0.6737 | 0 | −0.670896667 | 0.00417228 | −0.67367 | 0 | −0.519266 | 0.192338314 |
| F40 | 95.54238667 | 0 | −727.0281867 | 123.8680268 | −6.384E+111 | 2.287E+112 | −791.28165 | 147.3338192 |
| F41 | −15.1402239 | 0 | −19.17958667 | 0.042476839 | N/A | N/A | −18.88504 | 1.771663385 |
| F42 | 711.5143067 | 5.42017 × 10⁻¹⁵ | 206.868 | 81.44365973 | −1.969E+113 | 1.0349E+114 | 46.71747279 | 64.84744095 |
| F43 | −1.80108667 | 447.0917171 | −1.8013 | 6.77522 × 10⁻¹⁶ | −1.87884667 | 0.078420492 | −1.8013 | 116.9061103 |
5 Exploitation analysis
The outcomes in Table 4 showed that for all unimodal test functions, QSO is superior to the chosen methods. Employing unimodal functions to evaluate the algorithm’s exploitation capabilities, the findings collected demonstrated QSO’s supremacy in utilizing the best value, demonstrating QSO’s superior exploitation capabilities. Figure 2 displays the average values of QSO, ABC, BMSO, GSA, BBO, GWO, and PSO for the unimodal benchmark functions. According to the findings of the unimodal test functions provided in Tables 5 and 6, QSO gets the optimal value in seven of them (F6, F7, F10, F12, F14, F15, and F16). On the other hand, QSO converges to optimal values in four test functions (F2, F3, F17, and F18). Furthermore, in the remaining seven test functions (F1, F4, F5, F8, F9, F11, and F13), QSO can come close to the best values of the specified algorithms. It should be noted that these values outperformed those achieved by other selected algorithms when tested with the same functions. Compared to the methods mentioned earlier, the findings of QSO demonstrate its effectiveness and competitiveness. Furthermore, it surpasses them in the majority of tests, with the results clearly demonstrating its superior performance. Specifically, when compared to unimodal performance, QSO consistently yields excellent results in identifying the best solution value for unimodal functions, highlighting its superior exploitation search capabilities.
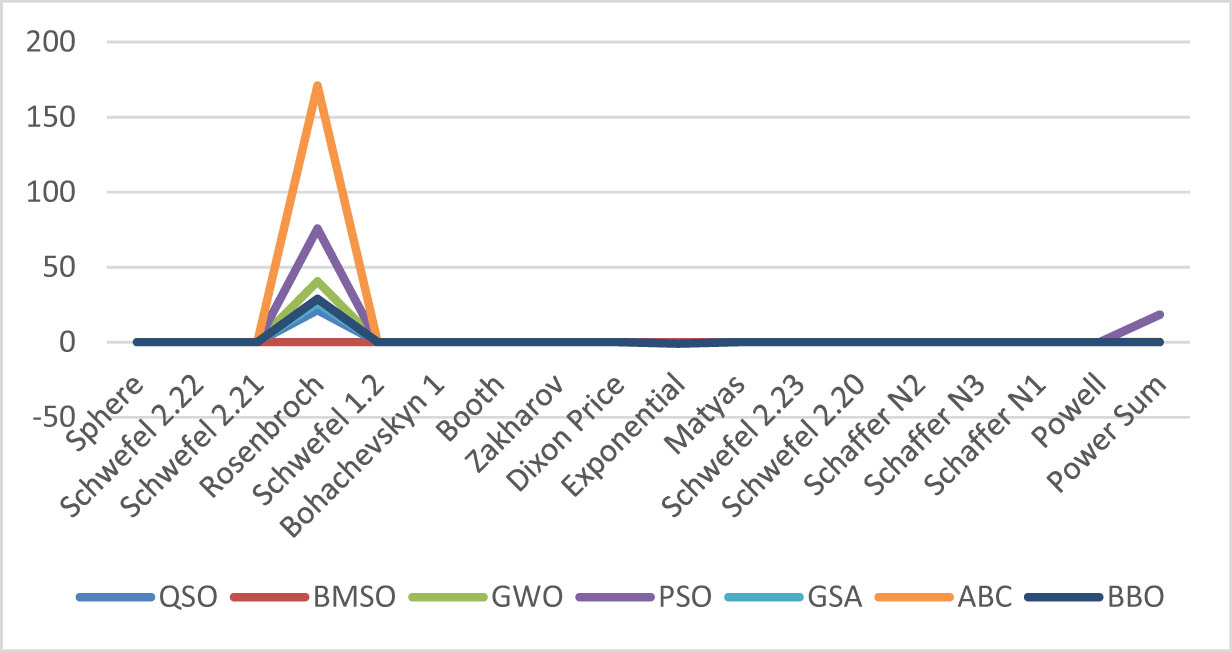
Unimodal benchmark function for QSO and other algorithms.
6 Exploration analysis
The multimodal functions are used to evaluate an algorithm’s capacity for exploration. The multimodal results shown in Tables 7 and 8 for fixed and Tables 9 and 10 for not fixed illustrate how the suggested algorithm was explored. These outcomes demonstrate QSO’s effectiveness and strength in comparison to the other algorithms used for comparison. Using 25 multimodal test functions (17 fixed and 8 non-fixed), QSO is found to be superior and more effective than the other methods. Figures 3 and 4 display the average values of QSO, BMSO, GSA, ABC, BBO, GWO, and PSO for the multimodal benchmark functions. According to the findings of the multimodal (fixed) test functions provided in Tables 7 and 8, QSO gets the optimal value in seven of them (F19, F20, F21, F22, F23, F24, and F25). It, on the other hand, converges to optimal values in one test function (F26). Based on the results in Tables 9 and 10 for multimodal (not fixed) test functions, QSO gets the optimal value in eight of them (F30, F36, F37, F38, F39, F40, F41, and F43), it converges to optimal values in three functions (F29, F34, and F42). Additionally, within the remaining six test functions (F27, F28, F31, F32, F33, and F35), QSO closely approaches the best values attained by the specified algorithms. It is noteworthy that these values outperformed those achieved by other selected algorithms when subjected to the same test functions. In comparison to the methods stated above, QSO findings demonstrate that it is effective and competitive. Furthermore, it excels in the majority of tests, underscoring the accuracy, versatility, and efficiency of QSO’s exploration techniques. The results indicate that, when compared to multimodal performance, QSO consistently achieves strong results in identifying the best solution values for multimodal functions, reinforcing its superiority in exploration search.
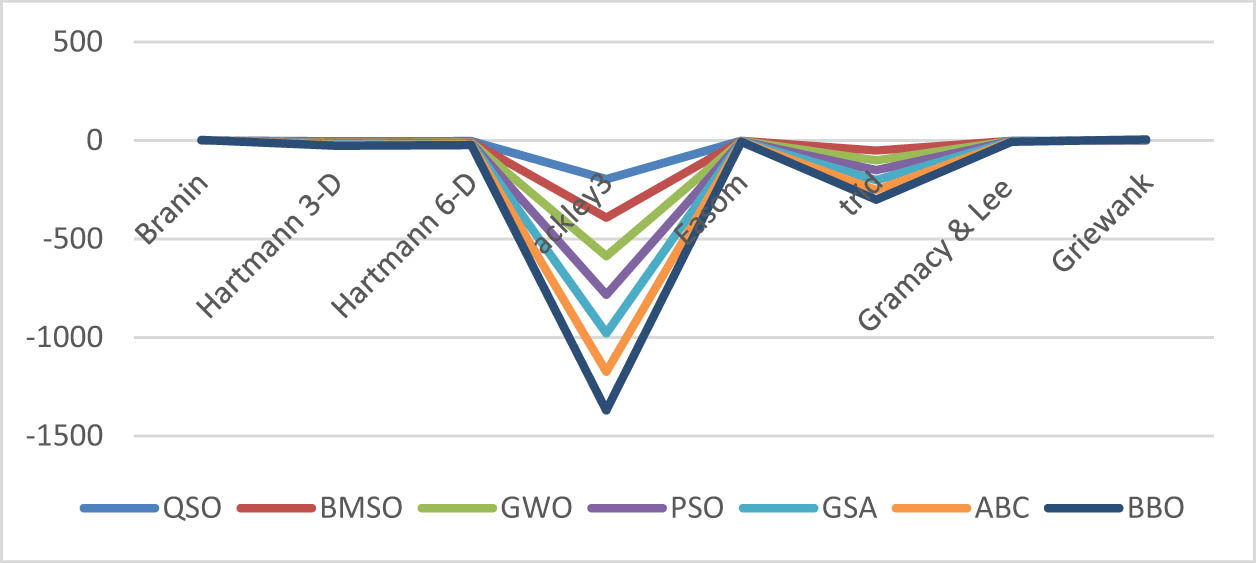
Multimodal benchmark function (fixed) for QSO and other algorithms.
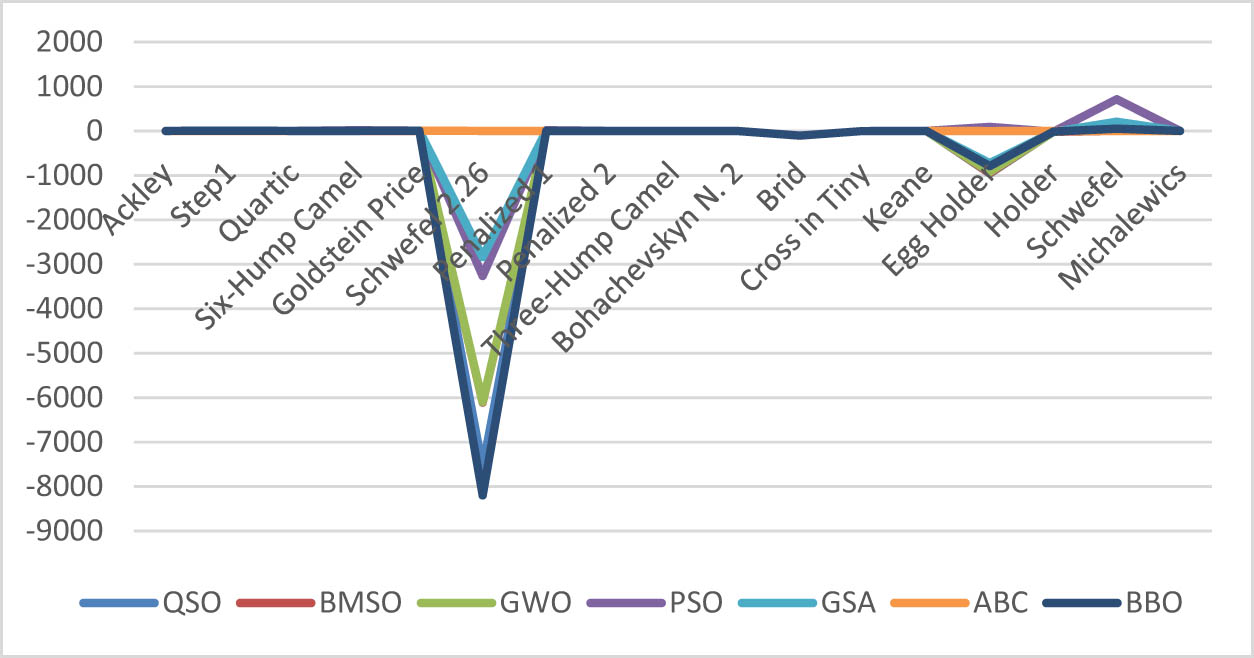
Multimodal benchmark function (not fixed) for QSO and other algorithms.
The scalability of the QSO algorithm may necessitate modifications to parameter settings or adaptation mechanisms to better handle large-scale optimization problems. One limitation of scalability is premature convergence, which may occur as the algorithm struggles to maintain diversity and exploration with increasing problem size. Furthermore, the performance of swarm optimization algorithms can be sensitive to parameter settings such as swarm size and termination criteria. Tuning these parameters becomes more challenging as problem size increases, and finding the best parameter values may require extensive experimentation
7 Conclusion and future work
This study suggests a novel optimization technique based on the quokka animal’s behavior, QSO, as an alternate strategy for tackling optimization problems. The suggested QSO algorithm updates location, causing solutions to move towards or away from the target, ensuring the exploration and utilization of search space. QSO’s performance in terms of exploitation and exploration is evaluated using 43 test functions. The acquired findings showed that QSO outperformed ABC, PSO, GSA, BMSO, BBO, and GWO. The results obtained from the unimodal test function demonstrate the QSO algorithm’s excellence in exploitation. The resulting multimodal test function result then demonstrates QSO’s exploring capacity. The QSO algorithm stands out from other algorithms by having fewer variables, which makes it easier to understand and use. The QSO algorithm can be applied to solve various optimization problems, including function optimization and parameter tuning, because it has the ability to explore large solution spaces and find the best solutions for these problems. Future research avenues could encompass diverse areas, including addressing various optimization challenges and evolving the QSO methodology into a multi-objective optimization algorithm, given its current single-objective nature. Additionally, hybridizing the QSO algorithm with different optimization algorithms could further improve its performance and versatility across a wide range of problem domains. The limitation of the algorithm lies in its single-objective nature; however, it can evolve into a multi-objective optimization algorithm, as discussed in this section.
-
Funding information: Authors state no funding involved.
-
Author contributions: All authors have accepted responsibility for the entire content of this manuscript and consented to its submission to the journal, reviewed all the results and approved the final version of the manuscript. Wijdan Jaber AL-kubaisy and Belal Al-Khateeb designed the experiments and carried them out. Wijdan Jaber AL-kubaisy developed the model code and performed the simulations. Belal Al-Khateeb prepared the manuscript with contributions from all co-authors.
-
Conflict of interest: The authors declare that there is no conflict of interest.
-
Data availability statement: Data sharing is not applicable to this article, as no datasets were generated or analyzed during the current study.
References
[1] Yousefikhoshbakht M. Solving the traveling salesman problem: A modified metaheuristic algorithm. Hind Complex. 2021;2021:1–13. 10.1155/2021/6668345.Suche in Google Scholar
[2] Del Ser J, Osaba E, Molina D, Yang XS, Salcedo-Sanz S, Camacho D, et al. Bio-inspired computation: where we stand and what’s next. Swarm Evolut Comput. 2019;48:220–50. 10.1016/j.swevo.2019.04.008.Suche in Google Scholar
[3] Gogna A, Tayal A. Metaheuristics: Review and application. J Expr Theor A I. 2013;25(4):503–26. 10.1080/0952813X.2013.782347.Suche in Google Scholar
[4] Eiben AE, Smith JE. Introduction to evolutionary computing, natural computing series. Berlin and Heidelberg, Germany: Springer-Verlag Berlin Heidelberg; 2015.10.1007/978-3-662-44874-8Suche in Google Scholar
[5] Michalewicz Z. Evolution strategies and other methods. 1st edn. Berlin and Heidelberg, Germany: Springer-Verlag Berlin Heidelberg; 1992.Suche in Google Scholar
[6] Back T. Evolutionary algorithms in theory and practice: Evolution strategies. 1st edn. New York, NY, USA: Oxford University; 1996.10.1093/oso/9780195099713.001.0001Suche in Google Scholar
[7] Fogel L. Intelligence through simulated evolution: Forty years of evolutionary programming. 1st edn. New York, USA: Wiley Series on Intelligent Systems; 1999.Suche in Google Scholar
[8] Koza JR. Genetic programming: On the programming of computers by means of natural selection. 1st edn. London, England, Cambridge, Massachusetts: MIT Press; 1992.Suche in Google Scholar
[9] Holland JH. Genetic algorithms. Sci Am. 1992;267(1):66–73.10.1038/scientificamerican0792-66Suche in Google Scholar
[10] Rashedi E, Nezamabadi-Pour H, Saryazdi S. GSA: a gravitational search algorithm. Amsterdam, Netherlands: Elsevier; 2009. 10.1016/j.ins.2009.03.004.Suche in Google Scholar
[11] Colorni A, Dorigo M, Maniezzo V, Varela F, Bourgine P. Distributed optimization by ant colonies. Proceedings of the European Conference on Artificial Life; 1992. p. 134–42.Suche in Google Scholar
[12] Mirjalili S, Hashim SZM, Sardroudi HM. Training feedforward neural networks using hybrid particle swarm optimization and gravitational search algorithm. Appl Math Computer. 2012;218(22):11125–37. 10.1016/j.amc.2012.04.069.Suche in Google Scholar
[13] Karaboga D, Basturk B. A powerful and efficient algorithm for numerical function optimization: artificial bee colony (ABC) algorithm. J Glob Optim. 2007;39(3):459–71. 10.1007/s10898-007-9149-x.Suche in Google Scholar
[14] Olorunda O, Engelbrecht AP. Measuring exploration/exploitation in particle swarms using swarm diversity. In Proc. of IEEE World Congress on Computational Intelligence. Hong Kong; 2008. p. 1128–34. 10.1109/TEVC.2008.919004.Suche in Google Scholar
[15] Lin L, Gen M. Auto-tuning strategy for evolutionary algorithms: Balancing between exploration and exploitation. Soft Comput. 2009;13(2):157–68. 10.1007/s00500-008-0303-2.Suche in Google Scholar
[16] Blum C, Li X. Swarm intelligence in optimization. Berlin and Heidelberg, Germany: Springer-Verlag Berlin Heidelberg; 2008. p. 44–85. 10.1007/978-3-540-74089-6_2.Suche in Google Scholar
[17] Sobti S, Singla P. Solving travelling salesman problem using artificial bee colony based approach. Int J Eng Re Tech (IJERT). 2013;2(6):186–9.Suche in Google Scholar
[18] Mirjalili S, Mirjalili SM, Lewis A. Grey wolf optimizer. Adv Eng Soft. 2014;69:46–61. 10.1016/j.advengsoft.2013.12.007.Suche in Google Scholar
[19] Mirjalili S. The ant lion optimizer. Adv Eng Sof. 2015;83:80–98. 10.1016/j.advengsoft.2015.01.010.Suche in Google Scholar
[20] Khalid Ibrahim M, Ali RS. Novel optimization algorithm inspired by camel traveling behavior. Iraqi J Electr Electron Eng. 2016;12:167–77.10.33762/eeej.2016.118375Suche in Google Scholar
[21] Al-Khateeb B, Turki A. Meerkat swarm optimization algorithm for real world university examination timetabling problem. J Adv Res Dyn Con Sys. 2018;2103–13.Suche in Google Scholar
[22] Mahmood M, Al-Khateeb B. The blue monkey: A new nature inspired metaheuristic optimization algorithm. Peri Eng Nat Sci. 2019;7(3):1054–66. 10.21533/pen. v7i3.621.Suche in Google Scholar
[23] Al-Khateeb B, Ahmed K, Mahmood M, Le DN. Rock hyraxes swarm optimization: A new nature-inspired metaheuristic optimization algorithm. Comput Mat Cont. 2020;68(1):644–55. 10.32604/cmc.2021.013648.Suche in Google Scholar
[24] Chen Z, Francis A, Li S, Liao B, Xiao D, Ha TT, et al. Egret swarm optimization algorithm: An evolutionary computation approach for model free optimization. Bio MDPI J. 2022;7:1–34. 10.3390/biomimetics7040144.Suche in Google Scholar PubMed PubMed Central
[25] Mclean LG, Scmitt N. Copulation and associated behavior in the quokka Setonix brachyurus. Aust Mam. 1999;21:139–41.10.1071/AM99139Suche in Google Scholar
[26] Hayward MW. Diet of the quokka (Setonix brachyurus) (Macropodidae:Marsupialia) in the northern jarrah forest of Western Australia|. Wildl Res. 2005;32:15–22.10.1071/WR03051Suche in Google Scholar
[27] Hayward MW, de Tores PJ, Dillon MJ, Banks PB. Predicting the occurrence of the quokka, Setonix brachyurus (Macropodidae:Marsupialia), in Western Australia’s northern Jarrah forest. Wildl Res. 2007;34:194–9. 10.1071/WR03051.Suche in Google Scholar
[28] Basturk B, Karaboga D. An artificial bee colony (ABC) algorithm for numeric function optimization. In: Proceedings of the IEEE Swarm Intelligence Symposium, Indianapolis, IN, USA; 2006. p. 4–12.Suche in Google Scholar
[29] Kennedy J, Eberhart R. Particle swarm optimization. In Neural Networks. IEEE International Conference; 1995. p. 1942–8.10.1109/ICNN.1995.488968Suche in Google Scholar
[30] Rashedi E, Nezamabadi-pour H, Saryazdi S. GSA: A gravitational search algorithm. Info Sci. 2009;179(13):2232–48. 10.1016/j.ins.2009.03.004.Suche in Google Scholar
[31] Mirjalili S, Mirjalili SM, Lewis A. Grey wolf optimizer. Adv Eng Soft. 2014;69:46–61. 10.1016/j.advengsoft.2013.12.007.Suche in Google Scholar
[32] Simon D. Biogeography-based optimization. IEEE Trans Evol Comp. 2008;12(6). 10.1109/TEVC.2008.919004.Suche in Google Scholar
© 2024 the author(s), published by De Gruyter
This work is licensed under the Creative Commons Attribution 4.0 International License.
Artikel in diesem Heft
- Research Articles
- A study on intelligent translation of English sentences by a semantic feature extractor
- Detecting surface defects of heritage buildings based on deep learning
- Combining bag of visual words-based features with CNN in image classification
- Online addiction analysis and identification of students by applying gd-LSTM algorithm to educational behaviour data
- Improving multilayer perceptron neural network using two enhanced moth-flame optimizers to forecast iron ore prices
- Sentiment analysis model for cryptocurrency tweets using different deep learning techniques
- Periodic analysis of scenic spot passenger flow based on combination neural network prediction model
- Analysis of short-term wind speed variation, trends and prediction: A case study of Tamil Nadu, India
- Cloud computing-based framework for heart disease classification using quantum machine learning approach
- Research on teaching quality evaluation of higher vocational architecture majors based on enterprise platform with spherical fuzzy MAGDM
- Detection of sickle cell disease using deep neural networks and explainable artificial intelligence
- Interval-valued T-spherical fuzzy extended power aggregation operators and their application in multi-criteria decision-making
- Characterization of neighborhood operators based on neighborhood relationships
- Real-time pose estimation and motion tracking for motion performance using deep learning models
- QoS prediction using EMD-BiLSTM for II-IoT-secure communication systems
- A novel framework for single-valued neutrosophic MADM and applications to English-blended teaching quality evaluation
- An intelligent error correction model for English grammar with hybrid attention mechanism and RNN algorithm
- Prediction mechanism of depression tendency among college students under computer intelligent systems
- Research on grammatical error correction algorithm in English translation via deep learning
- Microblog sentiment analysis method using BTCBMA model in Spark big data environment
- Application and research of English composition tangent model based on unsupervised semantic space
- 1D-CNN: Classification of normal delivery and cesarean section types using cardiotocography time-series signals
- Real-time segmentation of short videos under VR technology in dynamic scenes
- Application of emotion recognition technology in psychological counseling for college students
- Classical music recommendation algorithm on art market audience expansion under deep learning
- A robust segmentation method combined with classification algorithms for field-based diagnosis of maize plant phytosanitary state
- Integration effect of artificial intelligence and traditional animation creation technology
- Artificial intelligence-driven education evaluation and scoring: Comparative exploration of machine learning algorithms
- Intelligent multiple-attributes decision support for classroom teaching quality evaluation in dance aesthetic education based on the GRA and information entropy
- A study on the application of multidimensional feature fusion attention mechanism based on sight detection and emotion recognition in online teaching
- Blockchain-enabled intelligent toll management system
- A multi-weapon detection using ensembled learning
- Deep and hand-crafted features based on Weierstrass elliptic function for MRI brain tumor classification
- Design of geometric flower pattern for clothing based on deep learning and interactive genetic algorithm
- Mathematical media art protection and paper-cut animation design under blockchain technology
- Deep reinforcement learning enhances artistic creativity: The case study of program art students integrating computer deep learning
- Transition from machine intelligence to knowledge intelligence: A multi-agent simulation approach to technology transfer
- Research on the TF–IDF algorithm combined with semantics for automatic extraction of keywords from network news texts
- Enhanced Jaya optimization for improving multilayer perceptron neural network in urban air quality prediction
- Design of visual symbol-aided system based on wireless network sensor and embedded system
- Construction of a mental health risk model for college students with long and short-term memory networks and early warning indicators
- Personalized resource recommendation method of student online learning platform based on LSTM and collaborative filtering
- Employment management system for universities based on improved decision tree
- English grammar intelligent error correction technology based on the n-gram language model
- Speech recognition and intelligent translation under multimodal human–computer interaction system
- Enhancing data security using Laplacian of Gaussian and Chacha20 encryption algorithm
- Construction of GCNN-based intelligent recommendation model for answering teachers in online learning system
- Neural network big data fusion in remote sensing image processing technology
- Research on the construction and reform path of online and offline mixed English teaching model in the internet era
- Real-time semantic segmentation based on BiSeNetV2 for wild road
- Online English writing teaching method that enhances teacher–student interaction
- Construction of a painting image classification model based on AI stroke feature extraction
- Big data analysis technology in regional economic market planning and enterprise market value prediction
- Location strategy for logistics distribution centers utilizing improved whale optimization algorithm
- Research on agricultural environmental monitoring Internet of Things based on edge computing and deep learning
- The application of curriculum recommendation algorithm in the driving mechanism of industry–teaching integration in colleges and universities under the background of education reform
- Application of online teaching-based classroom behavior capture and analysis system in student management
- Evaluation of online teaching quality in colleges and universities based on digital monitoring technology
- Face detection method based on improved YOLO-v4 network and attention mechanism
- Study on the current situation and influencing factors of corn import trade in China – based on the trade gravity model
- Research on business English grammar detection system based on LSTM model
- Multi-source auxiliary information tourist attraction and route recommendation algorithm based on graph attention network
- Multi-attribute perceptual fuzzy information decision-making technology in investment risk assessment of green finance Projects
- Research on image compression technology based on improved SPIHT compression algorithm for power grid data
- Optimal design of linear and nonlinear PID controllers for speed control of an electric vehicle
- Traditional landscape painting and art image restoration methods based on structural information guidance
- Traceability and analysis method for measurement laboratory testing data based on intelligent Internet of Things and deep belief network
- A speech-based convolutional neural network for human body posture classification
- The role of the O2O blended teaching model in improving the teaching effectiveness of physical education classes
- Genetic algorithm-assisted fuzzy clustering framework to solve resource-constrained project problems
- Behavior recognition algorithm based on a dual-stream residual convolutional neural network
- Ensemble learning and deep learning-based defect detection in power generation plants
- Optimal design of neural network-based fuzzy predictive control model for recommending educational resources in the context of information technology
- An artificial intelligence-enabled consumables tracking system for medical laboratories
- Utilization of deep learning in ideological and political education
- Detection of abnormal tourist behavior in scenic spots based on optimized Gaussian model for background modeling
- RGB-to-hyperspectral conversion for accessible melanoma detection: A CNN-based approach
- Optimization of the road bump and pothole detection technology using convolutional neural network
- Comparative analysis of impact of classification algorithms on security and performance bug reports
- Cross-dataset micro-expression identification based on facial ROIs contribution quantification
- Demystifying multiple sclerosis diagnosis using interpretable and understandable artificial intelligence
- Unifying optimization forces: Harnessing the fine-structure constant in an electromagnetic-gravity optimization framework
- E-commerce big data processing based on an improved RBF model
- Analysis of youth sports physical health data based on cloud computing and gait awareness
- CCLCap-AE-AVSS: Cycle consistency loss based capsule autoencoders for audio–visual speech synthesis
- An efficient node selection algorithm in the context of IoT-based vehicular ad hoc network for emergency service
- Computer aided diagnoses for detecting the severity of Keratoconus
- Improved rapidly exploring random tree using salp swarm algorithm
- Network security framework for Internet of medical things applications: A survey
- Predicting DoS and DDoS attacks in network security scenarios using a hybrid deep learning model
- Enhancing 5G communication in business networks with an innovative secured narrowband IoT framework
- Quokka swarm optimization: A new nature-inspired metaheuristic optimization algorithm
- Digital forensics architecture for real-time automated evidence collection and centralization: Leveraging security lake and modern data architecture
- Image modeling algorithm for environment design based on augmented and virtual reality technologies
- Enhancing IoT device security: CNN-SVM hybrid approach for real-time detection of DoS and DDoS attacks
- High-resolution image processing and entity recognition algorithm based on artificial intelligence
- Review Articles
- Transformative insights: Image-based breast cancer detection and severity assessment through advanced AI techniques
- Network and cybersecurity applications of defense in adversarial attacks: A state-of-the-art using machine learning and deep learning methods
- Applications of integrating artificial intelligence and big data: A comprehensive analysis
- A systematic review of symbiotic organisms search algorithm for data clustering and predictive analysis
- Modelling Bitcoin networks in terms of anonymity and privacy in the metaverse application within Industry 5.0: Comprehensive taxonomy, unsolved issues and suggested solution
- Systematic literature review on intrusion detection systems: Research trends, algorithms, methods, datasets, and limitations