
RGB-to-hyperspectral conversion for accessible melanoma detection: A CNN-based approach
-
Sondos Mahmoud Bsharat
 ,
Ragad Ahmed
,
Ragad Ahmed

Abstract
One major difficulty facing the healthcare industry is the early and precise detection of melanoma. With its capacity to record a broad spectrum of electromagnetic wavelengths, hyperspectral imaging (HSI) is a promising technique for accurate melanoma diagnosis. However, the limited accessibility of HSI technology prevents it from being widely used. This article introduces a novel method for converting readily available red green blue (RGB) images to their hyperspectral counterparts using convolutional neural networks (CNNs). Through this conversion process, spectral information is improved, enabling a more thorough examination to detect melanoma. Principal component analysis (PCA) aids the machine learning algorithm in differentiating between melanoma and healthy moles in the classification model. Accuracy is significantly increased when spot detection and PCA are combined; Naïve Bayes achieves 76% accuracy in this way. These models are used in the developed web-based program SkinScan for real-time melanoma analysis, providing a useful and accessible solution. This work emphasizes how CNN-driven RGB-to-HSI conversion might improve melanoma detection accuracy and accessibility.
1 Introduction
Cells that produce mela-nin are the primary source of melanoma, the most serious type of skin cancer. Despite being less frequent than other skin cancers, its tendency to metastasize early emphasizes how crucial it is to diagnose it as soon as possible. The effectiveness of existing diagnostic approaches is a topic of increasing concern as the incidence of melanoma rises, especially in populations under the age of 40 [1]. The mainstay of diagnosis has been traditional techniques including physical examination, biopsy, and imaging studies. However, without the use of cutting-edge imaging technologies – which remain out of reach for many due to expensive costs and complicated operational requirements – these approaches are frequently intrusive and can be inconclusive.
Effective melanoma treatment depends on early detection. The development of precise diagnostic techniques and a knowledge of the disease are largely dependent on research and cutting-edge technologies. A medical professional must carefully examine any unusual or suspicious skin areas and do appropriate tests to rule out melanoma or other forms of skin cancer. Further tests are carried out to provide comprehensive details regarding the nature and degree of the disease if melanoma is suspected. This procedure highlights the critical connection between early identification and effective intervention in melanoma and is necessary for making well-informed judgments regarding available treatment options.
Innovations that keep pace with the rapidly changing medical technology landscape are still desperately needed in the search for more approachable and user-friendly melanoma detection methods. Although there has been great improvement in the last 10 years in facilitating painless and smooth melanoma identification, one major restriction continues to be the reliance on subjective assessments by medical professionals, particularly when it comes to judging skin patterns and pigmentation. While cutting-edge imaging methods, including hyper-spectral imaging, have shown promise in improving diagnosis and detection accuracy, their general implementation is hindered by prohibitive costs. This study raises critical questions that are essential for advancing melanoma detection:
How can emerging technologies enhance accessibility in melanoma detection?
What novel approaches can mitigate the limitations of current diagnostic methods?
In what ways can cost-effective utilization of advanced imaging techniques be optimized for widespread melanoma screening?
The subsequent sections of this article are organized as follows: Section 2 reviews the historical context of skin lesion examination, emphasizing the evolution of dermoscopy and the recent advancements in hyperspectral imaging (HSI). Section 3 outlines the methodology employed, including the use of an open-source dataset for HSI analysis and data processing. Section 4 elucidates the experimental configuration and parameters employed in the study. Section 5 presents the outcomes of the analysis, compares findings with existing literature, and engages in a detailed discussion of the implications of the results.
2 Related work
Examining skin lesions, especially nevi, has long been a field that combines technology support with clinical knowledge. Dermoscopy has historically been an essential tool in this field, enabling improved imaging of pigmented skin lesions and nevi that are not visible to the unaided eye. Dermoscopes are used in this procedure, which frequently involves applying pigments to improve contrast. Despite popular belief, dermoscopes are not inherently digital equipment. Dermoscopes are complex equipment that may interact with digital technology to offer comprehensive skin lesion pictures. They were first used as purely optical instruments even before the development of what is now known as modern medicine [2].
Recent advancements have introduced HSI as a cutting-edge modality in dermatological examination. By gathering information across the electromagnetic spectrum, including the visible and, critically, the infrared area, HSI expands the capabilities of standard imaging. Strong evidence from the literature suggests that HSI’s diagnostic capability is enhanced by its capacity to study the infrared spectrum, which has been demonstrated to be extraordinarily helpful for the diagnosis of a variety of skin disorders [3,4,5]. This ability to see beyond the constraints of human eyesight offers a substantial benefit in biomedical imaging as well as the possibility of early and precise skin cancer detection [6,7].
In the literature, the importance of HSI in the identification and examination of skin lesions has been progressively emphasized. The basis for this technology’s application in dermatology was established by studies by McIntosh et al. [8] and Zherdeva et al. [9], which pioneered the study of skin lesions using near-infrared spectroscopy and in vivo HSU, respectively. These methods have been further refined by later research, which now uses the spectral characteristics of tissues to distinguish between normal and malignant skin with amazing accuracy [10,11]. Moreover, HSI has recently been integrated with sophisticated computational techniques like deep learning to improve the classification accuracy of skin malignancies [12] (Table 1).
Comparative analysis of HSI methods in dermatology
| No. | Author(s) | Date of publication | Input format | Methodological framework | Accessibility | Unique features |
|---|---|---|---|---|---|---|
| 1 | Salomatina et al. [2] | 2006 | Optical/digital dermoscopy | Analysis of optical properties in visible and NIR range | Not specified | Pioneering work in combining optical and digital dermoscopy techniques |
| 2 | Kuzmina et al. [3] | 2011 | HSI | Noncontact melanoma selection by multispectral analysis | Not specified | Early adoption of multispectral imaging for noncontact analysis |
| 3 | Pardo et al. [4] | 2018 | HSI | Non-parametric classification for melanoma detection in HSI | Not specified | Focus on non-parametric methods for spectral signature analysis |
| 4 | Halicek et al. [5] | 2019 | HSI | Deep learning for cancer margin detection in HSI | Not specified | Application of deep learning for surgical margin detection |
| 5 | Leon et al. [6] | 2020 | HSI | Non-invasive diagnosis using HSI for clinical support | Not specified | Emphasizing non-invasive and in-situ diagnostic capabilities |
| 6 | Courtenay et al. [7,12] | 2021, 2022 | HSI | Robust statistics and deep learning for skin cancer analysis | Not specified | Integrating robust statistics with deep learning for classification |
In the domain of melanoma detection, various studies have explored HSI utilizing different methodologies, but many have not provided accessible technology to end-users [13,14,15,16,17]. A comparative summary of the limitations and approaches of current published research is presented in Table 2.
Comparative analysis of studies using HS dermoscopy dataset [17]
| No. | Author(s) | Date of publication | Dataset | Methodological framework and constraints |
|---|---|---|---|---|
| 1 | Zia et al. [13] | 2021 | HS Dermoscopy |
|
| 2 | Chen [14] | 2020 | HS Dermoscopy |
|
| 3 | Karhu [15] | 2020 | HS Dermoscopy |
|
| 4 | Curiel-Lewandrowski et al. [16] | 2019 | HS Dermoscopy |
|
| 5 | Gu [17] | 2019 | HS Dermoscopy |
|
While various studies have explored the HS Dermoscopy for melanoma detection, the contribution of this paper to the field of dermatological imaging is marked by the development of a new methodology that utilizes the capabilities of deep learning to transform red green blue (RGB) images into hyperspectral images (HSI). The significance of this approach lies in its ability to bypass the requirements for direct HSI, which is often costly and complex. The conversion of widely available RGB images to HSI data is expected to make advanced imaging technology more accessible in clinical environments.
In light of these developments, this study aims to further the application of HSI in dermatology by employing a novel approach that utilizes deep learning for the conversion of RGB images to hyperspectral images. This is followed by dimensionality reduction through principal component analysis (PCA) and classification via a machine learning algorithm. The main idea of this research work lies in the innovative conversion process, to allow for the use of more accessible RGB images to derive hyperspectral data. This approach holds the promise of making HSI more widely applicable in clinical settings where hyperspectral sensors may not be readily available or economically feasible.
3 Proposed system
In this research, the proposed system distinguishes itself by employing a conversion methodology that transforms RGB into hyperspectral imagery. The approach is designed to enhance technological accessibility for practitioners. The system employs a dual-strategy framework: initially deploying a deep learning model for the RGB-to-hyperspectral conversion, thereby enriching the data spectrum for subsequent analysis. Subsequently, a machine learning classifier, incorporating PCA, is utilized to discern melanoma from benign nevi within the transformed hyperspectral images (Figure 1).
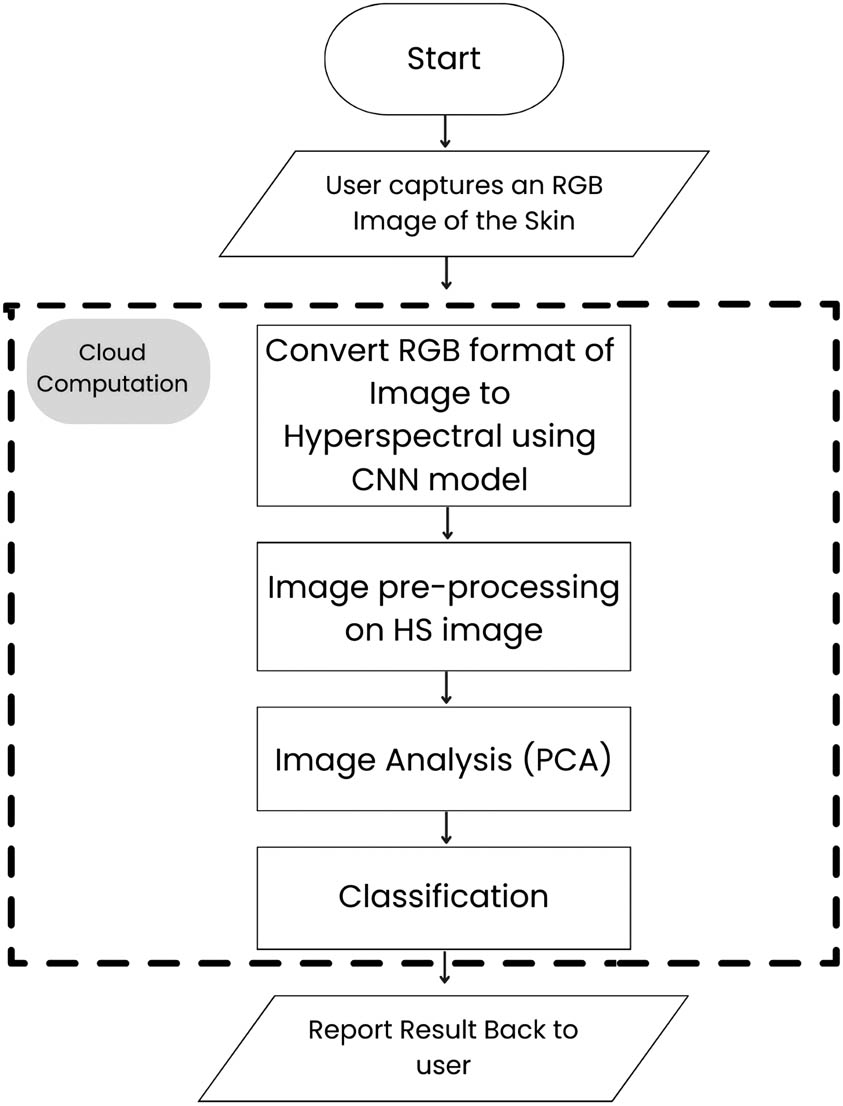
The flowchart of the proposed system.
3.1 Dataset
The research utilized an open-source dataset [17] comprising 344 meticulously curated hyperspectral images. These images were captured using the Xiema camera, which facilitated the acquisition of hyperspectral images across 16 bands within the spectrum of 465–630 nm. Each band image is constituted of approximately 512 × 272 pixels. Each captured image consists of 1,024 × 2,048 pixels arranged in 256 × 512 blocks of spatial information. Each block contains 4 rows and 4 columns of grayscale values, corresponding to spectral information from 16 wavelength-indexed bands. Within this dataset, there were 296 images portraying melanoma and 48 images depicting normal moles. Given the relatively limited number of images, augmentation techniques were systematically employed.
3.2 Light absorption analysis
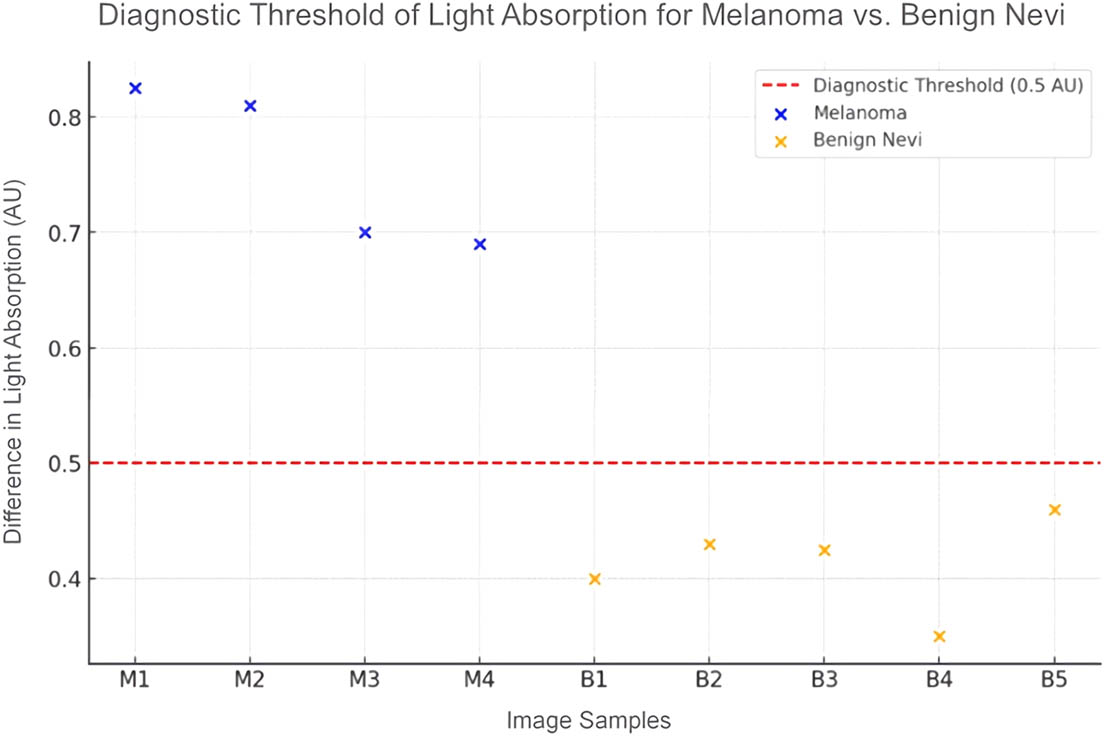
The diagnostic potential of light absorption in classifying skin lesions was investigated by comparing absorption levels within various bandwidths among melanoma, benign nevi, and normal skin. Absorbance unit (AU), the metric for quantifying light absorption, reflects the concentration of absorptive molecules in the skin, with higher values indicating greater absorption. The investigation included five melanoma skin samples and five benign nevi samples, each juxtaposed with healthy skin. The analysis led to the establishment of a diagnostic threshold: a light absorption difference exceeding 0.5 AU is considered indicative of melanoma. This is demonstrated in Figure 2, a scatter plot that plots the absorption differences for each type of lesion, with a clear demarcation line representing the 0.5 AU threshold. Data points above this line correspond to melanoma, while those below suggest benign or normal skin.
Light absorption for different HS image samples.
The visualization offers an intuitive understanding of the light absorption differences that underpin the diagnostic criteria, illustrating the potential of HSI in the identification of malignant skin lesions.
3.3 Reflectance spectra analysis
Following the assessment of light absorption, the diagnostic value of reflectance spectra in differentiating between malignant and benign skin conditions was further examined. Reflectance spectra offer an additional dimension of analysis, providing insights into the scattering and reflection properties of the skin samples under investigation. Using the same samples as with the light absorption, the analysis revealed a distinctive pattern: melanoma samples presented with reflectance spectra values consistently above 1 (Figure 3).
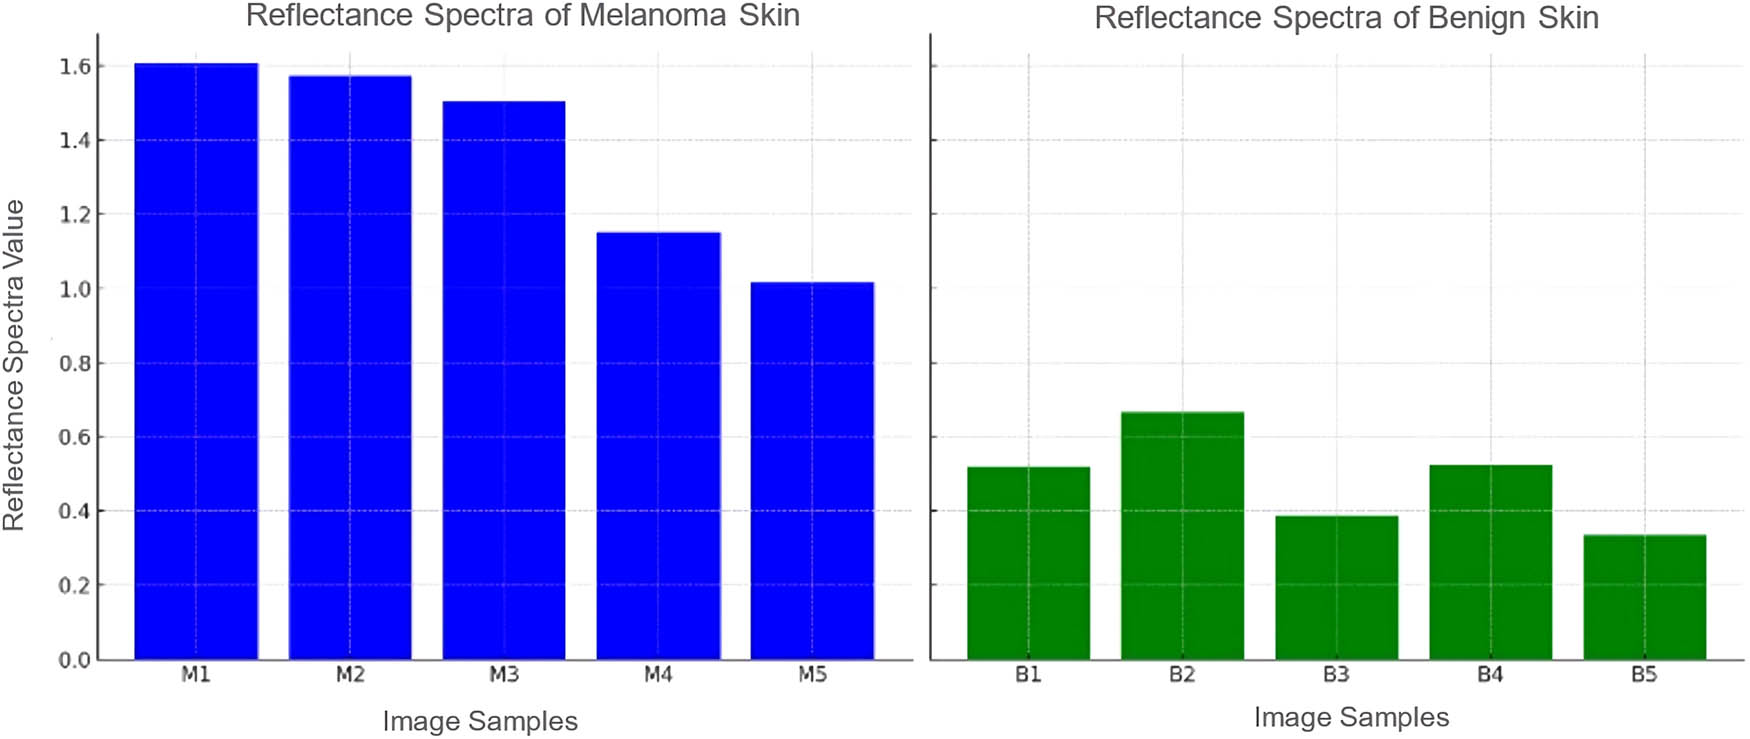
Reflectance spectra for different HS image samples.
The established threshold from reflectance spectra analysis complements the light absorption diagnostic criteria, enhancing the validity of the spectral diagnostic approach. These spectral measurements, when combined, strengthen the overall diagnostic capability of hyperspectral imagingHSI techniques in identifying malignant skin lesions with high accuracy.
4 Experimental setup
The used dataset contained hyperspectral images, without their corresponding RGB image. However, to train the conversion model, each hyperspectral image should have its associated RGB image. Therefore, the RGB images were first extracted from the hyperspectral images by simply extracting the three channels (red, green, and blue) and then combining them into one image.
4.1 RGB preprocessing
To sufficiently prepare the RGB images for integration into the conversion model, a preliminary pre-processing phase encompassed the execution of the subsequent steps.
4.1.1 Resizing for consistency and equal dimensionality
The initial pivotal stage entailed adjusting the dimensions of the RGB images to establish uniformity. By adjusting the size of the images, uniformity was achieved, enabling better compatibility during subsequent processing stages. This resizing step was essential in ensuring that all images were of the same size, facilitating smooth data manipulation throughout the training process [18].
4.1.2 Data augmentation for enhanced diversity
To expand the diversity of the training data, various data augmentation techniques were employed. Rotation, translation, scaling, flipping, and noise addition were some of the augmentation techniques incorporated. By applying these techniques, the dataset’s variability was increased, enabling the conversion model to better generalize and capture a wider range of image transformations. This step was critical in enhancing the model’s reliability and robustness.
4.1.3 Shuffling to mitigate bias
To prevent any bias or patterns from influencing the learning process, shuffling is necessary. By randomly distributing the data across subsets such as the training, validation, and testing sets, the risk of inadvertently imposing order or sequence-based biases was minimized. This step greatly improved the model’s ability to generalize accurately and perform well on unseen data.
4.1.4 Oversampling for addressing class imbalance
Class imbalance, a common issue in the dataset, was effectively managed through the implementation of oversampling techniques. Specifically, existing samples of normal moles were replicated, effectively boosting their representation in the dataset. By addressing class imbalance, the model was trained to not favor any particular class, ensuring a more unbiased and accurate conversion process. This significantly improved the model’s performance on both underrepresented and overrepresented classes.
4.1.5 Normalization for consistent scaling
The fifth step involved normalizing pixel values. RGB images were normalized to ensure that pixel values are on a common scale, aiding in better convergence during model training and improving compatibility with various network architectures. This step contributed to enhancing the model’s stability and overall performance.
5 Results and discussion
5.1 Utilizing CNN for the conversion model
The proposed CNN model’s architecture comprises multiple layers, commencing with the convolution layer, which applies filters to the input image for the extraction of crucial features. Subsequently, it undergoes a series of operations within pooling layers to achieve downsampling, followed by traversal through the fully connected layer to formulate the ultimate prediction [19]. These layers systematically execute sequential operations on the RGB images, leading to the generation of hyperspectral images. The CNN conversion model’s input dimensions were set at 272, 512, 3, with 272 × 512 representing the width and height of the RGB image, and the third dimension signifying the number of channels, corresponding to the red, green, and blue channels in the RGB image. This RGB image then traverses through a sequence of maxpooling, convolution, and upsampling layers. Ultimately, it is directed through the output convolution layer, poised to predict the hyperspectral image with dimensions (272, 512, 16). Here, 272 × 512 denotes the width and height of the hyperspectral image, while the third dimension pertains to the number of channels (bands) characterizing the hyperspectral image. The architectural configuration, complete with its selected parameters, is outlined in Table 3.
CNN architecture of the conversion model
| Layer (type) | Output shape | Param# |
|---|---|---|
| Input_1 (InputLayer) | [(None, 272, 512, 3)] | 0 |
| Conv2d (Conv2D) | [(None, 272, 512, 16)] | 448 |
| Max_pooling2d (MaxPooling2D) | [(None, 136, 256, 16)] | 0 |
| Conv2d_1 (Conv2D) | [(None, 136, 256, 8)] | 1160 |
| Up_sampling2d (UpSamling2D) | [(None, 272, 512, 8)] | 0 |
| Conv2d_2 (Conv2D) | [(None, 272, 512, 32)] | 2336 |
| Conv2d_3 (Conv2D) | [(None, 272, 512, 16)] | 4624 |
| Conv2d_4 (Conv2D) | [(None, 272, 512, 16)] | 2320 |
| Conv2d_5 (Conv2D) | [(None, 272, 512, 16)] | 2320 |
| Conv2d_6 (Conv2D) | [(None, 272, 512, 16)] | 2320 |
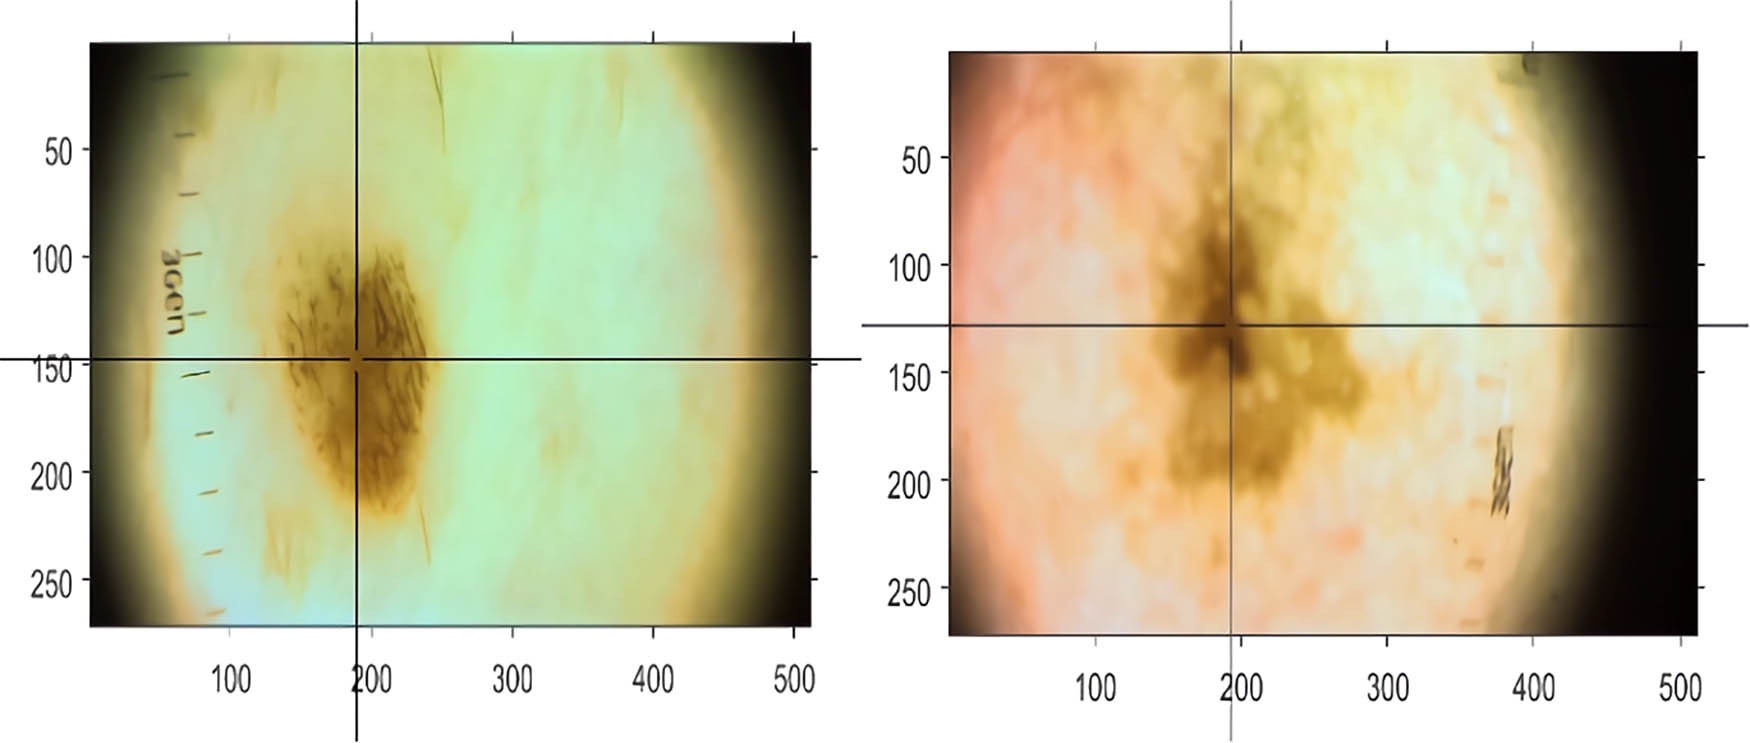
To visualize the results of this conversion, an example is presented in Figure 4. This figure illustrates a skin lesion’s initial RGB image (left) and its transformation into 16 superresolved hyperspectral bands (right), showcasing the enhanced detail captured by the proposed CNN model.
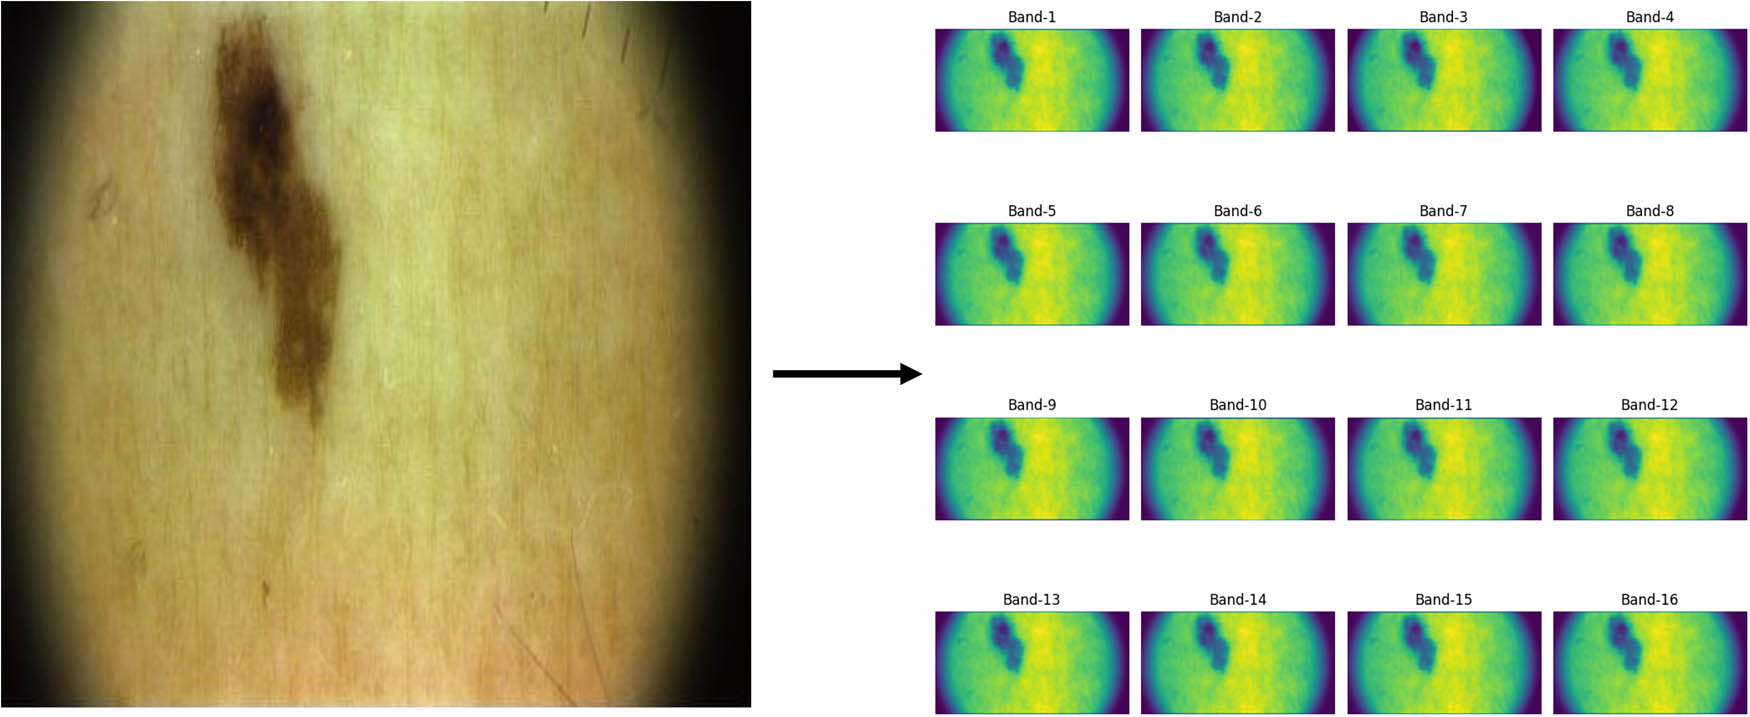
RGB image to the supperresovled hyperspectral image.
5.2 Model evaluation
To evaluate the performance of the model, three main metrics were used: the mean squared error (MSE), mean absolute error (MAE), and R 2 score, shown in Table 4 [20,21]
Evaluation of model performance
| MSE | MAE | R 2 |
|---|---|---|
| 0.021 | 0.09 | 0.7661 |
where
The model’s performance during the training process was evaluated using a model loss graph as shown in Figure 5. The graph displays two lines: the dotted line represents the validation loss, while the solid line represents the training loss. It is evident that the training loss consistently decreases with each epoch, indicating that the model is effectively learning from the data. Additionally, the decreasing trend of the validation loss suggests that the model generalizes well and avoids overfitting the training data. The result obtained based on the matrices and the model loss graph shows that the model’s predictions are generally close to the actual values.
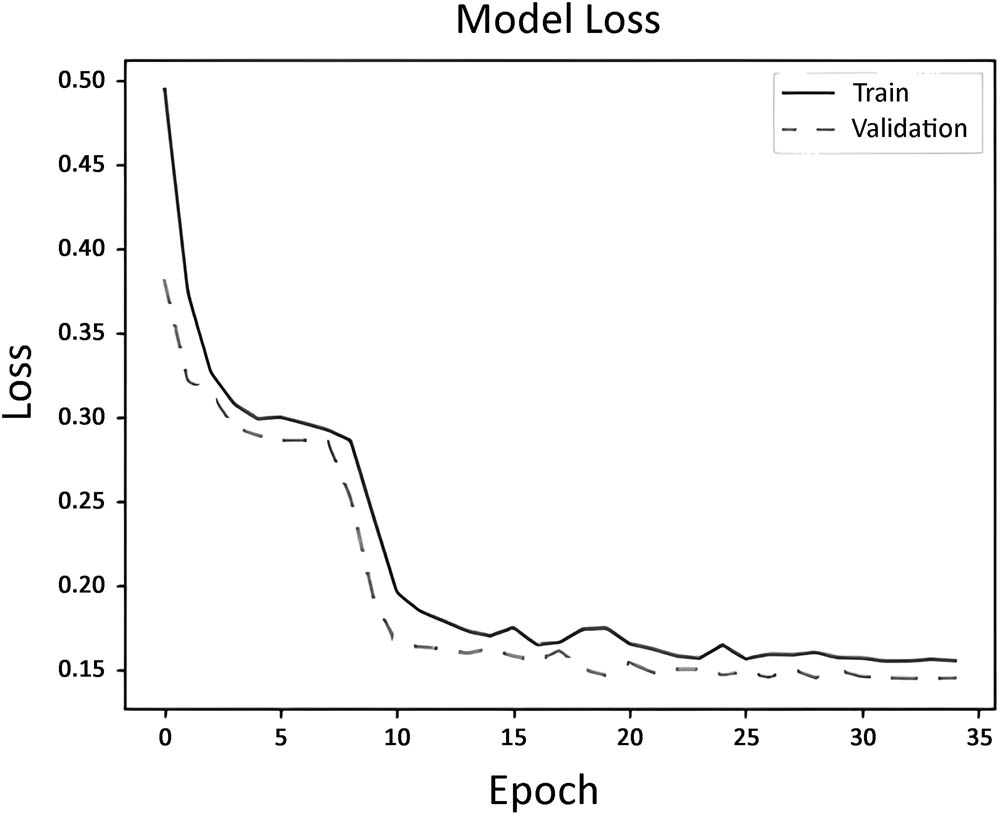
Neural network loss (MSE) over epoch.
5.3 Classification of melanoma
For the classification task of distinguishing cancerous (melanoma) from non-cancerous hyperspectral images, a number of machine learning algorithms were employed, along with two analysis techniques. These techniques include PCA and spot analysis with the PCA.
5.3.1 PCA
PCA is considered a dimensional reduction method that is often used to reduce the dimensions of large datasets, which is done by transforming a large set of variables into a smaller one that still contains most of the information. Hence, the number of variables is reduced, while preserving as much information as possible. This decreases the possibility of overfitting the machine learning models.
The results of the PCA are visualized through a scatter plot, as shown in Figure 6. This plot illustrates the distribution of the data based on the values of its corresponding principal components. It is evident from the plot and the machine learning results later shown in Table 5 that there is some overlap among the data points, indicating that the features generated from the PCA alone are not sufficient for distinguishing between the classes.
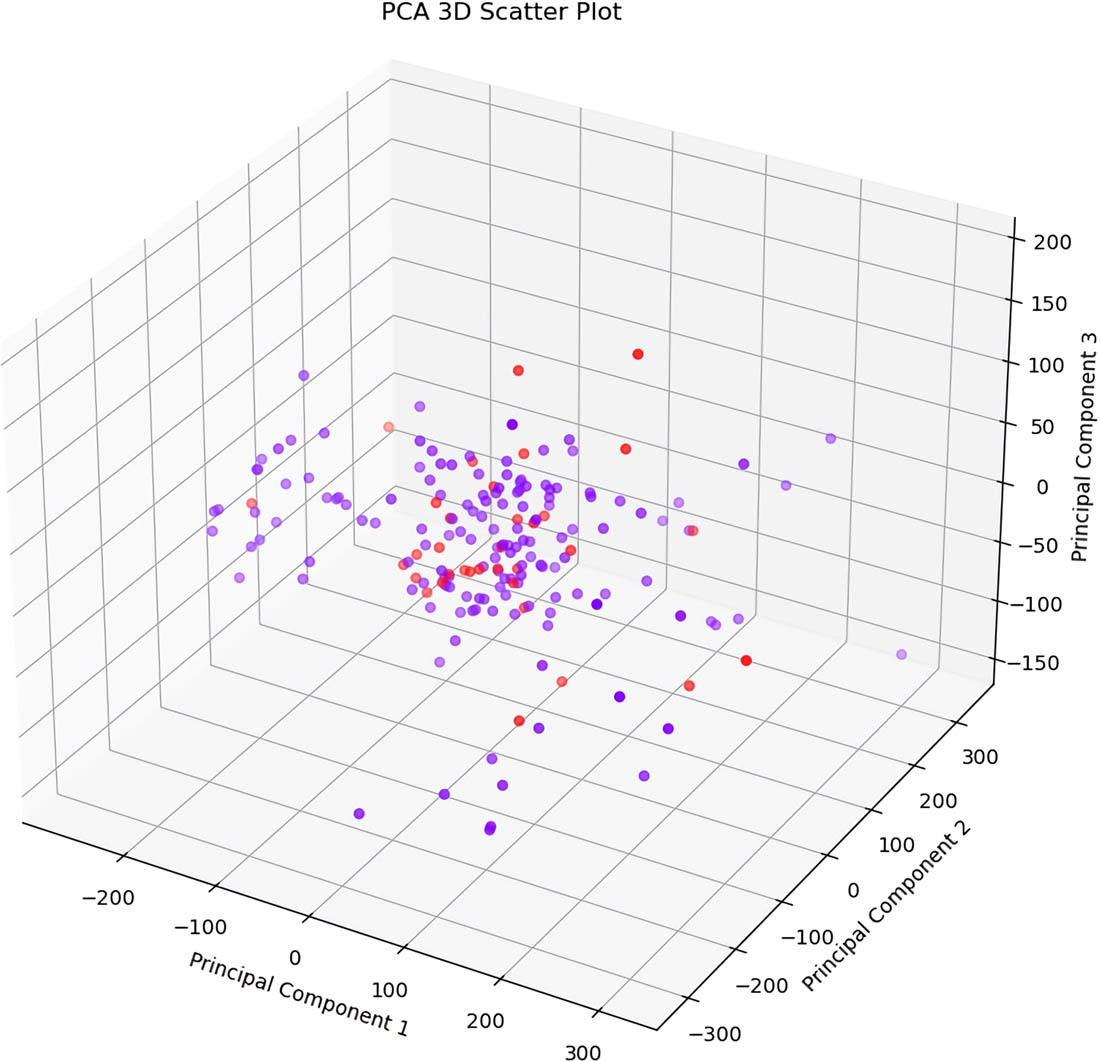
PCA 3D scatter plot (n_components = 4).
Algorithms’ performance using different analysis techniques
| Analysis technique | ML algorithm | Accuracy (%) | Precision (%) |
|---|---|---|---|
| PCA | Logistic regression | 68 | 17 |
| Support vector machine (SVM) | 86 | 0 | |
| KNeighborsClassifier (KNN) | 41 | 12 | |
| RandomForestClassifier | 53 | 14.5 | |
| Naive Bayes classifier | 52 | 16.9 | |
| Decision tree classifier | 50 | 16.3 | |
| PCA with spot detection | Logistic regression | 74 | 40.6 |
| Support vector machine (SVM) | 63 | 31.7 | |
| KNeighborsClassifier (KNN) | 72 | 37.5 | |
| RandomForestClassifier | 69 | 30.7 | |
| Naive Bayes classifier | 76 | 41.9 | |
| Decision tree classifier | 72 | 33 |
Bold emphasis indicates highest values.
5.3.2 Spot detection with PCA
This approach specifically applies PCA to a designated region of interest within the mole, as opposed to its application across the entire hyperspectral image. The PCA is performed on this selected spot, and the resulting features are then used as input for the machine learning algorithms. The process is initiated with the selection of spot coordinates positioned at the center of each mole in the hyperspectral image, as visually represented in Figure 7. Within each designated spot, the extraction of all hyperspectral bands was conducted, ensuring the comprehensive incorporation of the full spectral range existing in the hyperspectral data for subsequent analysis.
Spot detection.
Following the extraction of hyperspectral bands at each spot, a PCA was executed with an “n_components” value set to 4. Subsequently, the output was channeled through multiple stages of machine-learning algorithms, as detailed in Table 5, for the purpose of identifying the optimal algorithm in terms of accuracy and precision.
As seen in Table 5, when the data processed through PCA is used as input for the support vector machine (SVM) algorithm, it achieves the highest accuracy among the machine learning algorithms tested. However, the precision for this SVM algorithm is 0%. In contrast, combining spot detection with PCA to inform the Naive Bayes classifier significantly surpasses the capability of other machine learning algorithms in distinguishing between melanoma and normal moles, while also maintaining high accuracy.
Based on the findings and the conducted analysis, it becomes clear that spot detection through the PCA technique achieved the best results compared to solely using the PCA technique. This approach entails the selection of a specific region within a mole, followed by the application of PCA to extract vital features essential for melanoma classification.
In terms of the machine learning algorithm, the Naïve Bayes algorithm demonstrated the highest level of accuracy, as sustained by the confusion matrix presented in Figure 8. The merge of spot identification through PCA with the Naïve Bayes classifier proves to be a robust and effective methodology for precise melanoma classification. This approach not only highlights its potential utility in the fields of dermatology and cancer detection but also hints at promising applications for the future.
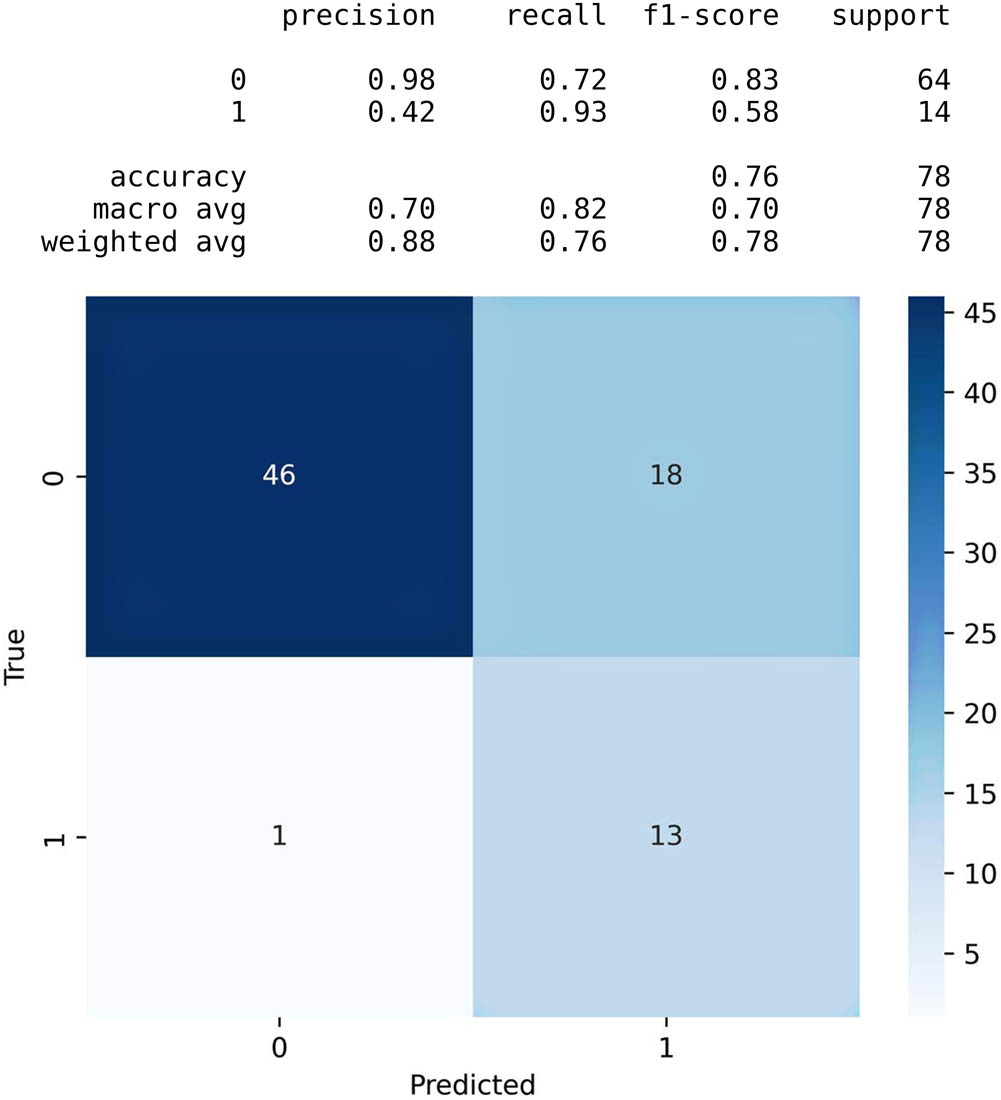
Naïve Bayes accuracy table and confusion matrix.
In this study, a novel approach based on convolutional neural networks (CNNs) for converting RGB images into their hyperspectral counterparts for melanoma detection is introduced. The effectiveness of this method is evaluated in comparison with an existing SVM classifier method detailed in prior research by Gu et al. [17]. It is to be noted that this is the sole study available for comparison, as it utilizes the same dataset for the purpose of melanoma detection, whereas other studies have utilized it for different objectives.
A sensitivity comparison between the proposed approach and the SVM classifier is presented in Table 6. Sensitivity reflects the ability to correctly identify true positive cases. The importance of sensitivity in such applications is significant as it directly impacts the potential to reduce false negative rates, therefore enhancing early detection and treatment outcomes.
Although the SVM classifier shows a marginally higher sensitivity rate, the proposed approach is distinguished by the following significant advantages:
Accessibility to end users is notably enhanced, with the method allowing for direct melanoma detection without necessitating specialized equipment or expertise.
Provision of real-time results by the model facilitates immediate feedback, crucial for the timely monitoring of skin health.
The model’s architecture has the capacity to incrementally improve predictive accuracy as more data becomes available, highlighting a scalable accuracy feature for the advancement of machine learning models in medical applications.
The approach described in this paper signifies a progressive step towards making melanoma detection more accessible, efficient, and ultimately improving early detection rates and patient outcomes.
5.4 Deployment and hosting infrastructure
Gradio and Hugging Face were chosen for their simplicity, convenience, and high-performance deployment capabilities. Gradio was leveraged to enhance user experience and streamline the deployment process by creating an intuitive web interface. This interface seamlessly hosted both models, eliminating the need for additional platforms and improving the efficiency of the deployment workflow.
The user-provided image is resized and normalized, then converted into a hyperspectral image using the conversion model. The resulting image is resized and reshaped to match the classification model’s dimensions. It is then passed through the “cancer_model” for classification. The prediction obtained determines if the mole is classified as “High Risk of being a Cancerous Mole” or “Normal Mole.” The classification result is displayed to the user as seen in Figure 9.
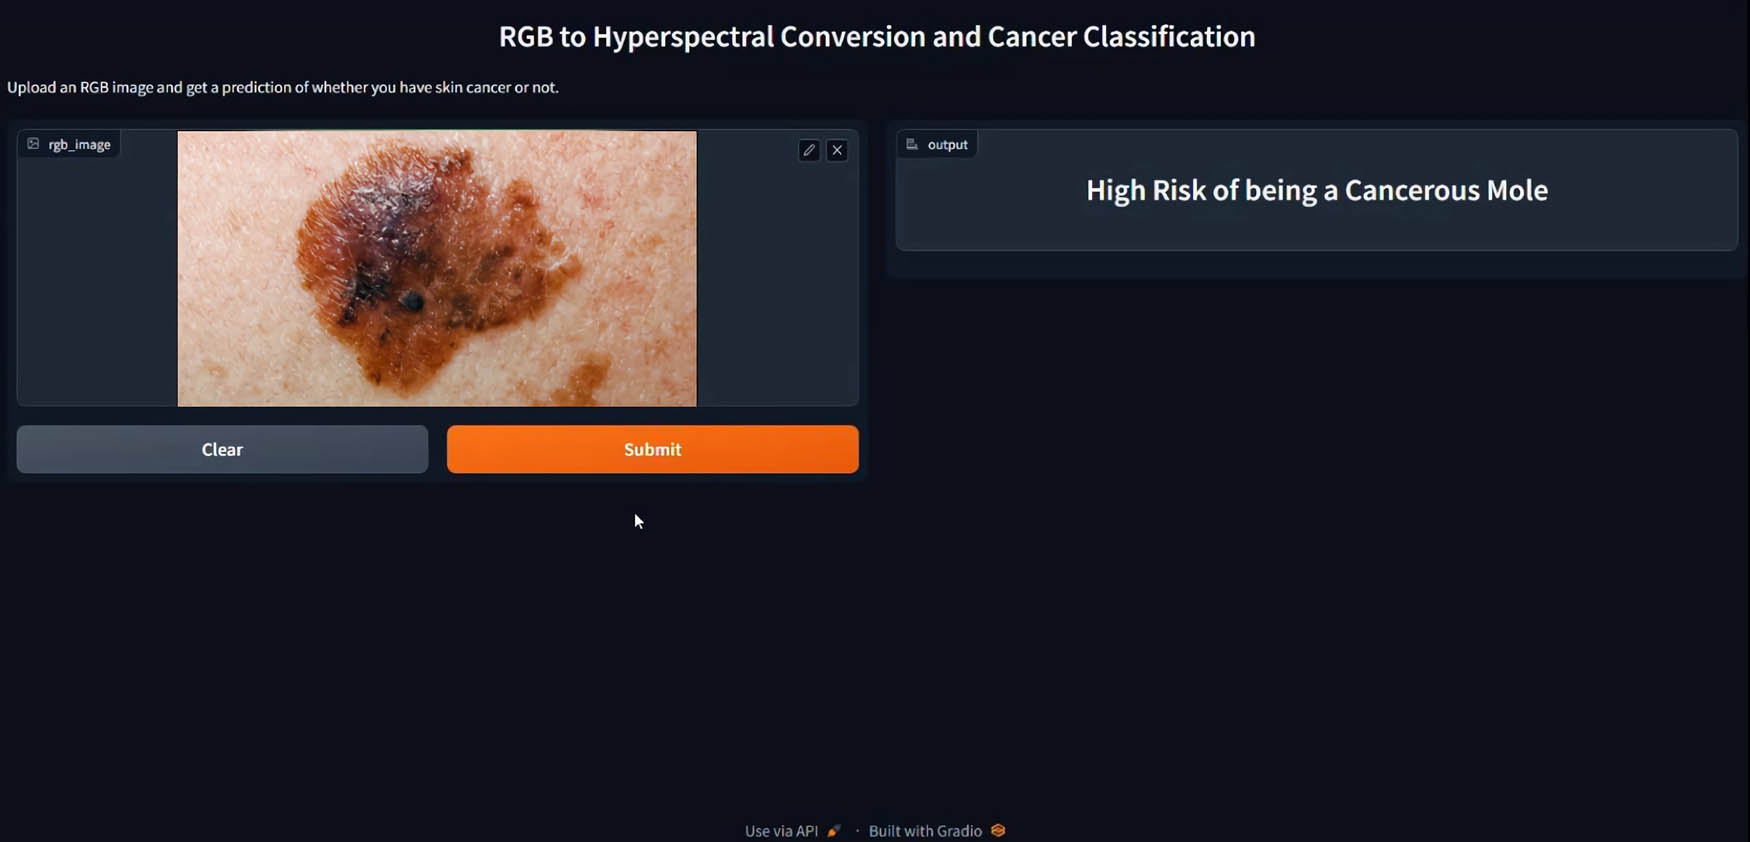
Inserted RGB image with classification result in Gradio interface.
SkinScan is a web-based application that offers individuals convenient access to the advanced skin cancer detection technology developed in this work. With its captivating and user-friendly interface, SkinScan allows users to upload skin images for real-time analysis and receive immediate results. The working concept of this work is highlighted in the web-based application in Figure 10. The website ensures a coherent user experience, providing an accessible and efficient process for skin cancer detection that promotes timely medical intervention and overall skin health. The user clicks on “Click to Scan” button depicted in Figure 10, which redirects the user to the Gradio interface.

User interface of the developed web-based application.
6 Conclusions and future work
This study highlights how cutting-edge technologies, in particular CNNs, can improve accessibility for the detection of melanoma. A new methodology that overcomes the shortcomings of existing diagnostic techniques is presented using CNN-enabled RGB picture conversion to hyperspectral data. Through spectral information expansion, this methodology reduces the limitations of traditional methods and presents a possible path toward more accurate melanoma diagnosis. The study demonstrated the validity of machine learning methods, particularly Naïve Bayes, in correctly differentiating between normal and malignant moles. Spot detection combined with PCA greatly increases accuracy and helps to maximize the economical use of modern imaging methods for mass melanoma screening. As a practical illustration, the built web-based application SkinScan uses these models to provide accessible and real-time skin cancer analysis. This work establishes the foundation for future developments in dermatological imaging and healthcare accessibility, as well as highlighting the potential of CNN-enabled RGB-to-HSI conversion for improving accessibility and precision in melanoma detection.
Beyond its current emphasis on Melanoma patients, a thorough analysis of the suggested CNN’s clinical value is necessary to determine the future course of the research. It is imperative that the CNN’s performance evaluation be extended to include a wider range of skin lesions, such as squamous cell and basal cell carcinomas. It is imperative to collaborate with multiple dermatology institutions worldwide to ensure external validation. The reliability of the model is improved across a range of clinical settings because to this collaborative effort that takes into account patient variability, contextual effects, and diagnostic procedures. Comprehensive datasets encompassing a range of skin tones and ethnicities will be vetted to guarantee wider applicability. By optimizing the model’s training to take into account variances in real-world tissues, cutting down on biases and improving inclusivity in skin cancer diagnosis across diverse global demographics, advanced machine learning techniques will be employed to help detect skin cancer.
Acknowledgments
The publication charges are supported by Ajman University. The research findings presented in this article are solely the authors’ responsibility.
-
Funding information: The APC of this research was funded by Ajman University.
-
Author contributions: Conceptualization, W. Shehieb, K. Arshad, S. Bsharat, S. Abouelnour, R. Ahmed, M. Elkhatib, and S. Gaber; methodology, S. Bsharat, R. Ahmed, and S. Abouelnour; software, M. Elkhatib and S. Bsharat; validation, S. Bsharat; formal analysis, W. Shehieb and K. Arshad; investigation, S. Bsharat, S. Abouelnour, R. Ahmed, M. Elkhatib, and S. Gaber; resources, W. Shehieb and S. Gaber; data curation, S. Bsharat and R. Ahmed; writing – original draft preparation, S. Abouelnour; writing – review and editing, S. Bsharat, S. Abouelnour, R. Ahmed, M. Elkhatib, and S. Gaber; visualization, S. Bsharat and S. Abouelnour; supervision, W. Shehieb, K. Arshad, and K. Assaleh; project administration, K. Arshad and W. Shehieb; funding acquisition, K. Arshad. S. Abouelnour, R. Ahmed, M. Elkhatib, and S. Gaber contributed equally to this work. All authors have read and agreed to the published version of the manuscript.
-
Conflict of interest: The authors declare no conflict of interest.
-
Ethical approval: The research conducted is not related to either the use of human participants or animals.
-
Data availability statement: The data are publicly available at: https://github.com/heugyy/HSIDermoscopy. The RGB image used in our gradio interface in figure 9 for the purpose of demonstration is from https://www.nhs.uk/conditions/melanoma-skin-cancer/symptoms/. The source of the image used in the generation our website in figure 10 is from https://www.cnet.com/health/personal-care/how-to-use-your-smartphone-to-detect-skin-cancer/.
References
[1] Mayo Clinic. “Melanoma - Symptoms and causes,” mayoclinic.org. https://www.mayoclinic.org/diseases-conditions/melanoma/symptoms-causes/syc-20374884.Suche in Google Scholar
[2] Salomatina E, Jiang B, Novak J, Yaroslavsky AN. Optical properties of normal and cancerous human skin in the visible and near-infrared spectral range. J Biomed Opt. 2006;11(6):064026. 10.1117/1.2398928.Suche in Google Scholar PubMed
[3] Kuzmina I, Diebele I, Jakovels D, Spigulis J, Valeine L, Kapostinsh J, et al. Towards noncontact skin melanoma selection by multispectral imaging analysis. J Biomed Opt Lett. 2011;16(6):060502. 10.1117/1.3584846.Suche in Google Scholar PubMed
[4] Pardo A, Gutiérrez-Gutiérrez JA, Lihacova I, López-Higuera JM, Conde OM. On the spectral signature of melanoma: A non-parametric classification framework for cancer detection in hyperspectral imaging of melanocytic lesions. Biomed Opt Express. 2018 Dec;9(12):6283–301. 10.1364/BOE.9.006283.Suche in Google Scholar PubMed PubMed Central
[5] Halicek M, Dormer JD, Little JV, Chen AY, Myers L, Sumer BD, et al. Hyperspectral imaging of head and neck squamous cell carcinoma for cancer margin detection in surgical specimens from 102 patients using deep learning. Cancers. 2019 Sep;11(9):1367. 10.3390/cancers11091367.Suche in Google Scholar PubMed PubMed Central
[6] Leon R, Martinez-Vega B, Fabelo H, Ortega S, Melian V, Castaño I, et al. Non-invasive skin cancer diagnosis using hyperspectral imaging for in-situ clinical support. J Clin Med. 2020 Jun;9(6):1662. 10.3390/jcm9061662.Suche in Google Scholar PubMed PubMed Central
[7] Courtenay LA, González-Aguilera D, Lagüela S, Del Pozo S, Ruiz-Mendez C, Barbero-García I, et al. Hyperspectral imaging and robust statistics in non-melanoma skin cancer analysis. Biomed Opt Express. 2021 Aug;12(8):5107–27. 10.1364/BOE.428143.Suche in Google Scholar PubMed PubMed Central
[8] McIntosh LM, Summers R, Jackson M, Mantsch HH, Mansfield JR, Howlett M, et al. Towards non-invasive screening of skin lesions by near-infrared spectroscopy. J Investig Dermatol. 2001;116(1):175–81. 10.1046/j.1523-1747.2001.00212.x.Suche in Google Scholar PubMed
[9] Zherdeva LA, Bratchenko IA, Myakinin OO, Moryatov AA, Kozlov SV, Zakharov VP. In vivo hyperspectral imaging and differentiation of skin cancer. In Proc. of SPIE 10024, Optics in Health Care and Biomedical Optics VII, 100244G. 2016. 10.1117/12.2246433.Suche in Google Scholar
[10] Salmivuori M, Neittaanmäki N, Pölönen I, Jeskanen L, Snellman E, Grönroos M. Hyperspectral imaging system in the delineation of Ill-defined basal cell carcinomas: a pilot study. J Eur Acad Dermatol Venereol. 2019 Jan;33(1):71–8. 10.1111/jdv.15102.Suche in Google Scholar PubMed
[11] Brouwer de Koning SG, Weijtmans P, Karakullukcu MB, Shan C, Baltussen E, Smit LA, et al. Toward assessment of resection margins using hyperspectral diffuse reflection imaging (400–1700 nm) during tongue cancer surgery. Lasers Surg Med. 2020;52(6):496–502. 10.1002/lsm.23161.Suche in Google Scholar PubMed
[12] Courtenay LA, González-Aguilera D, Lagüela S, Pozo SD, Ruiz C, Barbero-García I, et al. Deep convolutional neural support vector machines for the classification of basal cell carcinoma hyperspectral signatures. J Clin Med. 2022;11(4):2315. 10.3390/jcm11092315.Suche in Google Scholar PubMed PubMed Central
[13] Zia A, Zhou J, Gao Y. Exploring chromatic aberration and defocus blur for relative depth estimation from monocular hyperspectral image. IEEE Trans Image Process. 2021;30:4357–70. 10.1109/tip.2021.3071682.Suche in Google Scholar PubMed
[14] Chen H. Microscopic hyperspectral image analysis via deep learning. Queensland, Australia: Griffith University; 2020. 10.25904/1912/3909.Suche in Google Scholar
[15] Karhu A. Deep semantic segmentation for skin cancer detection from hyperspectral images. Jyväskylä, Finland: University of Jyväskylä; 2020.Suche in Google Scholar
[16] Curiel-Lewandrowski C, Novoa RA, Berry E, Celebi ME, Codella N, Giuste F, et al. Artificial intelligence approach in melanoma. Melanoma. 2019;599–628. 10.1007/978-1-4614-7147-9_43.Suche in Google Scholar
[17] Gu Y, Partridge Y-P, Zhou J. A hyperspectral dermoscopy dataset for melanoma detection. In OR 2.0 Context-aware operating theaters, Computer assisted robotic endoscopy, Clinical image-based procedures, and skin image analysis. Lecture Notes in Computer Science, Vol. 11041. Cham: Springer; 2018.10.1007/978-3-030-01201-4_29Suche in Google Scholar
[18] Saponara S, Elhanashi A. Impact of image resizing on deep learning detectors for training time and model performance. In: Saponara S, De Gloria A, editors. Applications in Electronics Pervading Industry, Environment and Society. ApplePies 2021. Lecture Notes in Electrical Engineering. Vol. 866. Cham: Springer; 2022. 10.1007/978-3-030-95498-7_2.Suche in Google Scholar
[19] Introduction to Convolution Neural Network, GeeksforGeeks, Aug. 21, 2017. https://www.geeksforgeeks.org/introduction-convolution-neural-network/.Suche in Google Scholar
[20] Agrawal R. Know the best evaluation metrics for your regression model!. Analytics Vidhya, May 19, 2021. https://www.analyticsvidhya.com/blog/2021/05/know-the-best-evaluation-metrics-for-your-regression-model/#:∼:text=Commonly%20used%20meics%20include%20mean.Suche in Google Scholar
[21] DataTechNotes. Regression accuracy check in Python (MAE, MSE, RMSE, R-Squared). https://www.datatechnotes.com/2019/10/accuracy-check-in-python-mae-mse-rmse-r.html.Suche in Google Scholar
© 2024 the author(s), published by De Gruyter
This work is licensed under the Creative Commons Attribution 4.0 International License.
Artikel in diesem Heft
- Research Articles
- A study on intelligent translation of English sentences by a semantic feature extractor
- Detecting surface defects of heritage buildings based on deep learning
- Combining bag of visual words-based features with CNN in image classification
- Online addiction analysis and identification of students by applying gd-LSTM algorithm to educational behaviour data
- Improving multilayer perceptron neural network using two enhanced moth-flame optimizers to forecast iron ore prices
- Sentiment analysis model for cryptocurrency tweets using different deep learning techniques
- Periodic analysis of scenic spot passenger flow based on combination neural network prediction model
- Analysis of short-term wind speed variation, trends and prediction: A case study of Tamil Nadu, India
- Cloud computing-based framework for heart disease classification using quantum machine learning approach
- Research on teaching quality evaluation of higher vocational architecture majors based on enterprise platform with spherical fuzzy MAGDM
- Detection of sickle cell disease using deep neural networks and explainable artificial intelligence
- Interval-valued T-spherical fuzzy extended power aggregation operators and their application in multi-criteria decision-making
- Characterization of neighborhood operators based on neighborhood relationships
- Real-time pose estimation and motion tracking for motion performance using deep learning models
- QoS prediction using EMD-BiLSTM for II-IoT-secure communication systems
- A novel framework for single-valued neutrosophic MADM and applications to English-blended teaching quality evaluation
- An intelligent error correction model for English grammar with hybrid attention mechanism and RNN algorithm
- Prediction mechanism of depression tendency among college students under computer intelligent systems
- Research on grammatical error correction algorithm in English translation via deep learning
- Microblog sentiment analysis method using BTCBMA model in Spark big data environment
- Application and research of English composition tangent model based on unsupervised semantic space
- 1D-CNN: Classification of normal delivery and cesarean section types using cardiotocography time-series signals
- Real-time segmentation of short videos under VR technology in dynamic scenes
- Application of emotion recognition technology in psychological counseling for college students
- Classical music recommendation algorithm on art market audience expansion under deep learning
- A robust segmentation method combined with classification algorithms for field-based diagnosis of maize plant phytosanitary state
- Integration effect of artificial intelligence and traditional animation creation technology
- Artificial intelligence-driven education evaluation and scoring: Comparative exploration of machine learning algorithms
- Intelligent multiple-attributes decision support for classroom teaching quality evaluation in dance aesthetic education based on the GRA and information entropy
- A study on the application of multidimensional feature fusion attention mechanism based on sight detection and emotion recognition in online teaching
- Blockchain-enabled intelligent toll management system
- A multi-weapon detection using ensembled learning
- Deep and hand-crafted features based on Weierstrass elliptic function for MRI brain tumor classification
- Design of geometric flower pattern for clothing based on deep learning and interactive genetic algorithm
- Mathematical media art protection and paper-cut animation design under blockchain technology
- Deep reinforcement learning enhances artistic creativity: The case study of program art students integrating computer deep learning
- Transition from machine intelligence to knowledge intelligence: A multi-agent simulation approach to technology transfer
- Research on the TF–IDF algorithm combined with semantics for automatic extraction of keywords from network news texts
- Enhanced Jaya optimization for improving multilayer perceptron neural network in urban air quality prediction
- Design of visual symbol-aided system based on wireless network sensor and embedded system
- Construction of a mental health risk model for college students with long and short-term memory networks and early warning indicators
- Personalized resource recommendation method of student online learning platform based on LSTM and collaborative filtering
- Employment management system for universities based on improved decision tree
- English grammar intelligent error correction technology based on the n-gram language model
- Speech recognition and intelligent translation under multimodal human–computer interaction system
- Enhancing data security using Laplacian of Gaussian and Chacha20 encryption algorithm
- Construction of GCNN-based intelligent recommendation model for answering teachers in online learning system
- Neural network big data fusion in remote sensing image processing technology
- Research on the construction and reform path of online and offline mixed English teaching model in the internet era
- Real-time semantic segmentation based on BiSeNetV2 for wild road
- Online English writing teaching method that enhances teacher–student interaction
- Construction of a painting image classification model based on AI stroke feature extraction
- Big data analysis technology in regional economic market planning and enterprise market value prediction
- Location strategy for logistics distribution centers utilizing improved whale optimization algorithm
- Research on agricultural environmental monitoring Internet of Things based on edge computing and deep learning
- The application of curriculum recommendation algorithm in the driving mechanism of industry–teaching integration in colleges and universities under the background of education reform
- Application of online teaching-based classroom behavior capture and analysis system in student management
- Evaluation of online teaching quality in colleges and universities based on digital monitoring technology
- Face detection method based on improved YOLO-v4 network and attention mechanism
- Study on the current situation and influencing factors of corn import trade in China – based on the trade gravity model
- Research on business English grammar detection system based on LSTM model
- Multi-source auxiliary information tourist attraction and route recommendation algorithm based on graph attention network
- Multi-attribute perceptual fuzzy information decision-making technology in investment risk assessment of green finance Projects
- Research on image compression technology based on improved SPIHT compression algorithm for power grid data
- Optimal design of linear and nonlinear PID controllers for speed control of an electric vehicle
- Traditional landscape painting and art image restoration methods based on structural information guidance
- Traceability and analysis method for measurement laboratory testing data based on intelligent Internet of Things and deep belief network
- A speech-based convolutional neural network for human body posture classification
- The role of the O2O blended teaching model in improving the teaching effectiveness of physical education classes
- Genetic algorithm-assisted fuzzy clustering framework to solve resource-constrained project problems
- Behavior recognition algorithm based on a dual-stream residual convolutional neural network
- Ensemble learning and deep learning-based defect detection in power generation plants
- Optimal design of neural network-based fuzzy predictive control model for recommending educational resources in the context of information technology
- An artificial intelligence-enabled consumables tracking system for medical laboratories
- Utilization of deep learning in ideological and political education
- Detection of abnormal tourist behavior in scenic spots based on optimized Gaussian model for background modeling
- RGB-to-hyperspectral conversion for accessible melanoma detection: A CNN-based approach
- Optimization of the road bump and pothole detection technology using convolutional neural network
- Comparative analysis of impact of classification algorithms on security and performance bug reports
- Cross-dataset micro-expression identification based on facial ROIs contribution quantification
- Demystifying multiple sclerosis diagnosis using interpretable and understandable artificial intelligence
- Unifying optimization forces: Harnessing the fine-structure constant in an electromagnetic-gravity optimization framework
- E-commerce big data processing based on an improved RBF model
- Analysis of youth sports physical health data based on cloud computing and gait awareness
- CCLCap-AE-AVSS: Cycle consistency loss based capsule autoencoders for audio–visual speech synthesis
- An efficient node selection algorithm in the context of IoT-based vehicular ad hoc network for emergency service
- Computer aided diagnoses for detecting the severity of Keratoconus
- Improved rapidly exploring random tree using salp swarm algorithm
- Network security framework for Internet of medical things applications: A survey
- Predicting DoS and DDoS attacks in network security scenarios using a hybrid deep learning model
- Enhancing 5G communication in business networks with an innovative secured narrowband IoT framework
- Quokka swarm optimization: A new nature-inspired metaheuristic optimization algorithm
- Digital forensics architecture for real-time automated evidence collection and centralization: Leveraging security lake and modern data architecture
- Image modeling algorithm for environment design based on augmented and virtual reality technologies
- Enhancing IoT device security: CNN-SVM hybrid approach for real-time detection of DoS and DDoS attacks
- High-resolution image processing and entity recognition algorithm based on artificial intelligence
- Review Articles
- Transformative insights: Image-based breast cancer detection and severity assessment through advanced AI techniques
- Network and cybersecurity applications of defense in adversarial attacks: A state-of-the-art using machine learning and deep learning methods
- Applications of integrating artificial intelligence and big data: A comprehensive analysis
- A systematic review of symbiotic organisms search algorithm for data clustering and predictive analysis
- Modelling Bitcoin networks in terms of anonymity and privacy in the metaverse application within Industry 5.0: Comprehensive taxonomy, unsolved issues and suggested solution
- Systematic literature review on intrusion detection systems: Research trends, algorithms, methods, datasets, and limitations