Online English writing teaching method that enhances teacher–student interaction
-
Yaqiu Jiang


Abstract
A significant component of the online learning platform is the online exercise assessment system, which has access to a wealth of past student exercise data that may be used for data mining research. However, the data from the present online exercise system is not efficiently used, making each exercise less relevant for students and decreasing their interest and interaction with the teacher as she explains the activities. In light of this, this research creates an exercise knowledge map based on the connections between workouts, knowledge points, and previous tournaments. The neural matrix was then improved using cross-feature sharing and feature augmentation units to deconstruct the workout recommendation model. The study also developed an interactive text sentiment analysis model based on the expansion of the self-associative word association network to assess how students interacted after the introduction of the personalized exercise advice teaching approach. The outcomes demonstrated that the suggested model’s mean diversity value at completion was 0.93, an increase of 0.14 and 0.23 over collaborative filtering algorithm and DeepFM (deep factor decompose modle), respectively, and that the proposed model’s final convergence value was 92.3%, an improvement of 2.3 and 4.1% over the latter two models. The extended model used in the study outperformed the support vector machine (SVM) and Random Forest models in terms of accuracy by 5.9 and 1.7%, respectively. In terms of F1 value indicator, the model proposed by the research has a value of 90.4%, which is 2.5 and 2.1% higher than the SVM model and Random Forest model; in terms of recall rate indicators, the model proposed by the research institute has a value of 94.3%, which is an increase of 6.2 and 9.8% compared to the latter two models. This suggests that the study’s methodology has some application potential and is advantageous in terms of customized recommendation and interactive sentiment recognition.
1 Introduction
In a specific teaching and learning setting, classroom interaction is the process through which different components interact to accomplish a certain teaching task and teaching aim. For educators to truly engage students in the teaching and learning activity, it necessitates the use of interactive, communication, and feedback abilities on both sides of the interaction [1]. The teaching and learning process is viewed as a growing and changing process of mutual impact and activity in the interactive model of teaching and learning. Teaching and learning activities are viewed as a sort of mental contact and communication between teachers and students. The “teaching interaction” is optimized during this process to improve the efficiency of teaching and learning. However, there are not enough cutting-edge teaching strategies in use today to improve teacher–student engagement, and there are not enough digital tools available to do so. The main goal of individualized education is to maximize each student’s unique abilities in light of their unique traits [2]. The conventional collaborative filtering method and the deep learning method are the two primary categories of individualized recommendation techniques. The majority of individualized learning resource suggestions now available are based on collaborative filtering, which has a “cold start” issue with new users and low recommendation accuracy because of the absence of structural data pertaining to the exercises. Since knowledge graphs may lay out the intricate relationships between knowledge and knowledge, they can be utilized to study the implicit links between workouts to improve the performance of the exercise recommendation model. Text sentiment analysis is an important research direction in opinion mining. It is the process of analyzing and summarizing emotional text content using natural language processing technology [3,4]. The main methods of sentiment analysis include dictionary-based methods and statistical-based methods. The dictionary-based method utilizes a semantic construction of sentiment word dictionaries for sentiment analysis. This approach can effectively utilize existing data, reduce the computational complexity of machine algorithms, and also reduce the tedious work of manually annotating samples. However, the use of which method to dynamically construct an emotional word polarity dictionary is a very important issue. The dictionary method maximizes the coverage of language rules to various possibilities of text representation, but due to the diversity and complexity of language, text in online environments is often filled with various network terms, making it difficult to cover all language rules using this method, resulting in low accuracy in text sentiment analysis [5]. Statistical methods are generally divided into traditional machine learning-based methods and deep learning-based methods. Traditional machine learning methods analyze words that represent their features in a text, input them into a classifier, and finally use the classifier for sentiment polarity classification, such as support vector machines (SVMs) and maximum entropy. They are not deep learners, and the data used in establishing algorithm models is relatively simple. At the same time, traditional machine learners overly rely on the results of feature extraction, neglecting the connection between partial semantics and global semantics of the text, so they do not perform well in the accuracy of sentiment analysis. In order to meet the personalized training needs of online learning and understand the interaction between teachers and students, the study will construct a knowledge graph-enhanced exercise recommendation model. In order to optimize the effectiveness of sentiment analysis in short texts, an interactive text sentiment analysis model based on the expansion of autocorrelation word association networks was adopted to examine students’ interaction.
2 Related work
Online English writing training has been the subject of extensive and diverse research by numerous academics. Chinese university students’ attitudes toward written corrective feedback and their usage of self-regulated learning writing procedures in an online English writing course during the new coronary pneumonia were investigated by scholar Xu using a mixed-study approach. About 311 and 12 students, respectively, were given questionnaires and semi-structured interviews. In accordance with the findings, students usually had favorable opinions of online WCF (written corrective feedback) during New Crown Pneumonia, and teachers offered more tutorials and feedback and could evaluate them at any time, which made for a relaxing learning environment for students [6]. Scholar A descriptive qualitative study was employed by Fitria to offer an overview of “grammar” as an AI (artificial intelligence) tool for English writing. The findings revealed that kids’ test scores were 34 before grammar was used. Following the usage of grammar, pupils’ performance on the text resulted in a score of 77 out of 100. This rating showed that the text’s writing quality has improved [7]. Writing teachers’ use of online formative assessment and the factors affecting it were the subjects of an investigation by Zou et al. A qualitative case study established three types of teacher participation: interfering, supporting, and integrating [8], by analyzing the involvement of three English writing instructors at three Chinese institutions in online formative assessment during the NCCP (national college entrance examination). With the goal to better understand how students felt about the use of online feedback as a formative evaluation to enhance their writing abilities in the English classroom, Prastikawati et al. employed a mixed-methods approach. The results showed that people had favorable opinions of using the online reverse channel as a formative assessment to advance writing abilities [9]. University students’ perceptions of and difficulties in using synchronous online discussions were the subject of research by Rinekso et al. A number of current university students participated in semi-structured interviews and virtual observations for the study. The findings indicated that the usage of synchronous online conversations was well received by the students [10].
Numerous academics have created sophisticated algorithms or teaching-related strategies. Ramos G. and other academics described interactive machine teaching and its potential to make the building of machine learning models simpler. They also suggested an integrated teaching environment to help teachers [11]. A novel marine predator algorithm based on teaching was proposed by academics like Zhong et al. The outcomes demonstrated that the algorithm outperformed other cutting-edge metaheuristics [12]. To help to achieve a good balance between local and global search as well as to raise the standard of the solution, Kumar and Singh provide an algorithm for solving optimization issues based on pedagogical learning and including local search methods. In accordance with experimental findings, the algorithm performs well while solving benchmark test functions. The technique is also used to address clustering issues. In comparison with other methods, the algorithm produced better clustering results [13]. Shukla et al. created a brand-new optimization technique based on instruction. On 25 numerical test sets, it was contrasted with various metaheuristic algorithms such as PSO (particle swarm optimization) and GA (genetic algorithm). The approach beats the PSO and GA algorithms in terms of convergent solutions, according to experimental results [14]. A feature selection and integrated teaching-based optimization technique was put out by Allam and colleagues. The algorithm proved more reliable in tests using various data sets.
In light of this, this project will develop a text analysis model based on sentiment relevance to study the student interaction and a tailored workout recommendation model based on knowledge mapping enhancement to increase students’ interactive feedback.
3 Building a personalized writing exercise recommendation model for teaching interaction enhancement
3.1 Improved neural matrix decomposition (INMD) construction based on knowledge graph enhancement
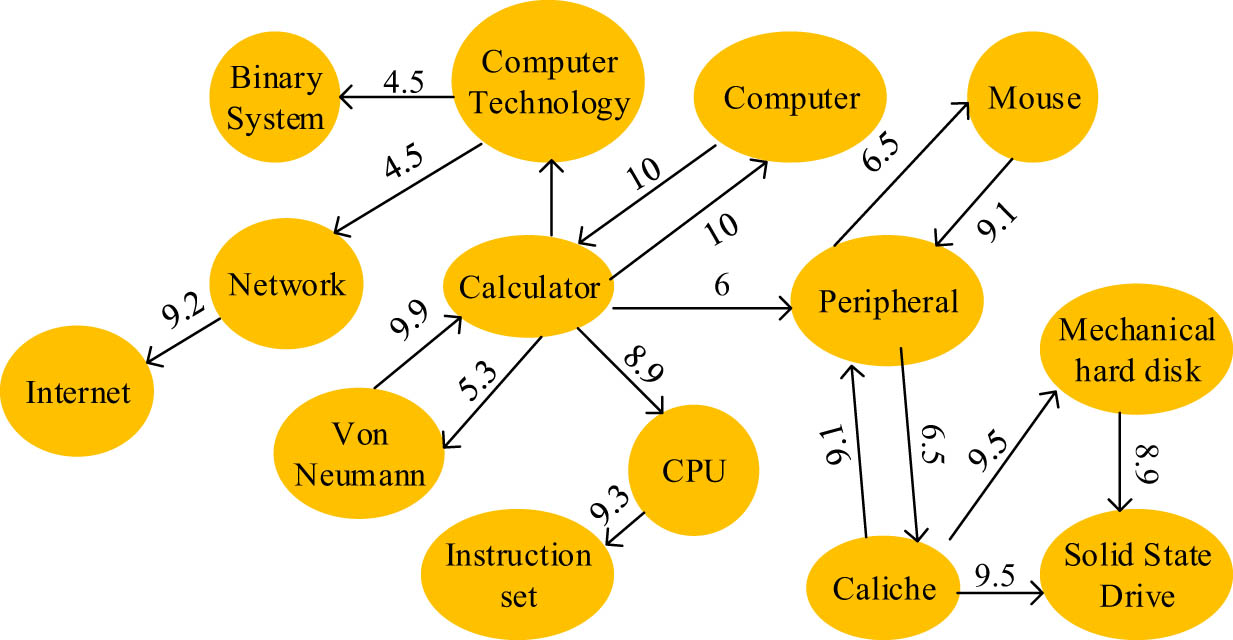
An online English writing-assisted teaching model for personalized exercise recommendation is created by using students’ online assessment exercise data to enable students to choose from a set of questions the exercises that match their present level of study. The exercise recommendation model is made up of an Exercise Knowledge Graph structure and an INMD model. The creation of the Exercise Knowledge Graph is shown in Figure 1.
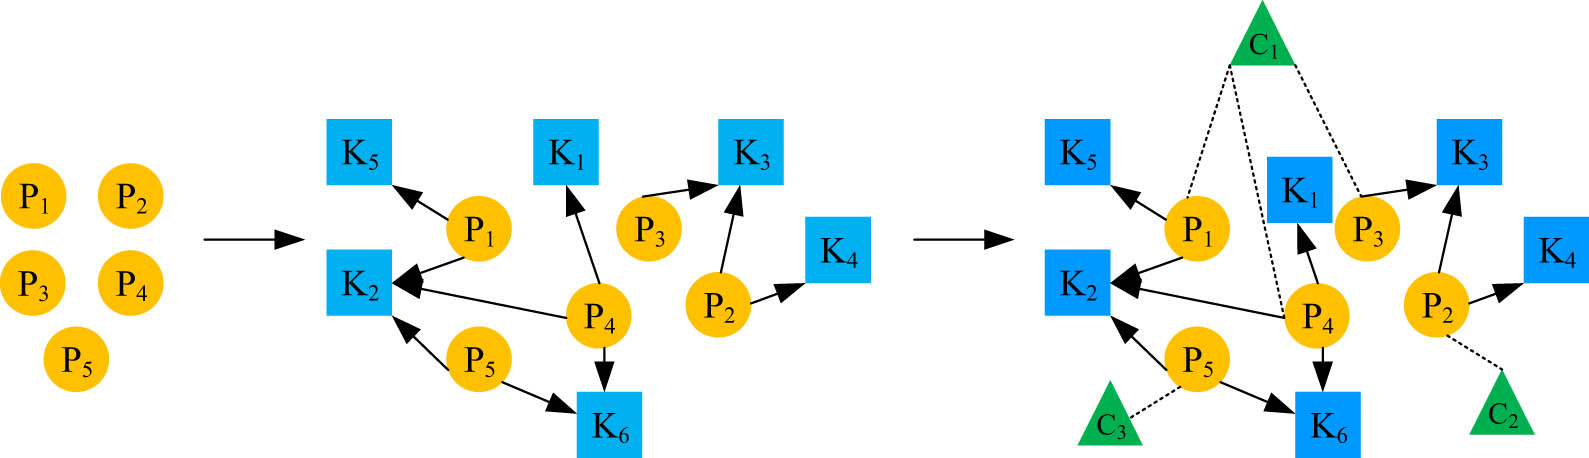
Schematic diagram of the establishment process of exercise knowledge map.
As can be observed from Figure 1, the exercise knowledge map first establishes the exercise nodes, then establishes the exercise and knowledge point relationships, and finally establishes the exercise and event relationships [15]. The exercises are constituted by a number of knowledge points. Knowledge points represent the smallest units of relatively independent information such as knowledge and theory. Events represent the set of exercises that students need to complete within a limited time frame.
The exercises will be designated as
INMD exercise recommendation model.
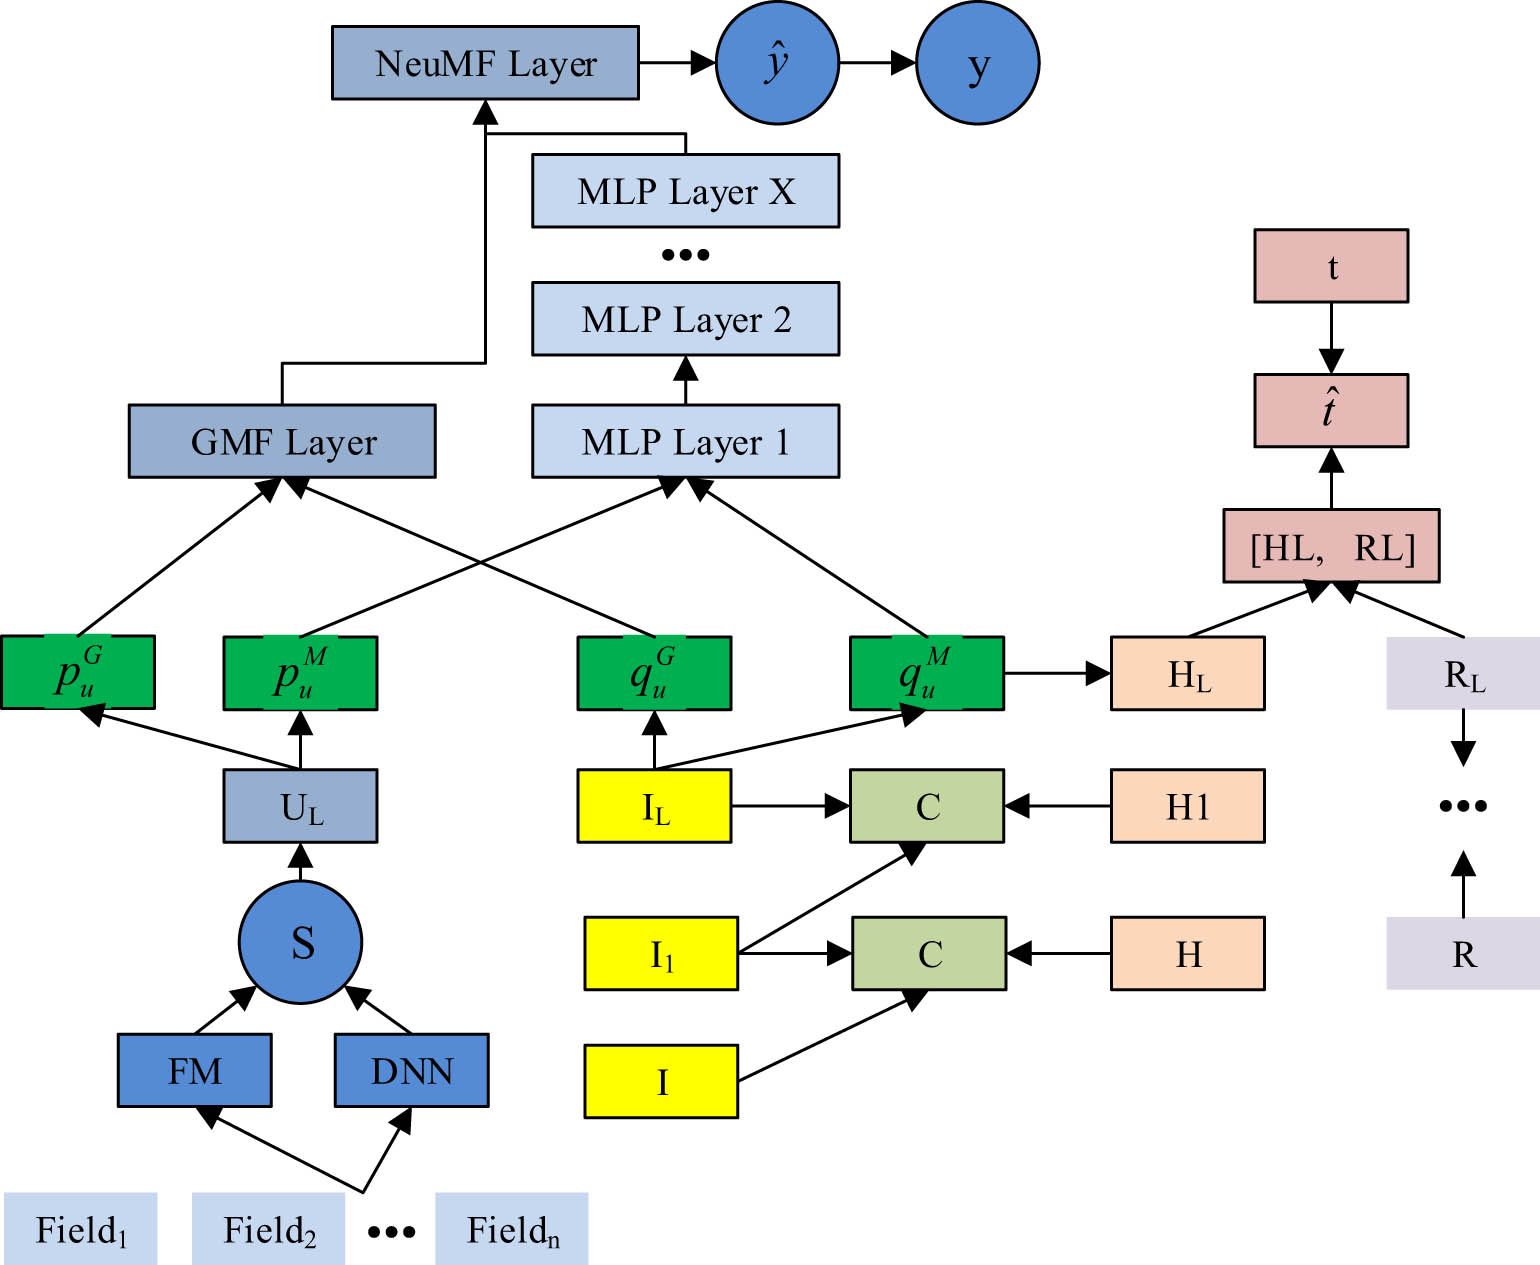
A feature sharing unit, a feature improvement unit, a neural matrix decomposition unit, and a knowledge graph embedding unit make up the model, as shown in Figure 2. The enhanced neuromatrix decomposition exercise recommendation model has a multi-task learning architecture and is trained in an alternating learning mode, enabling the alternate training of the exercise recommendation task and the knowledge graph learning job [17,18]. The knowledge graph feature learning task is integrated into the training process of the recommendation task by the feature sharing unit through crossover and compression operations, enhancing the effectiveness of the recommendation task with the knowledge graph data. The feature sharing unit’s structure is shown in Figure 3.
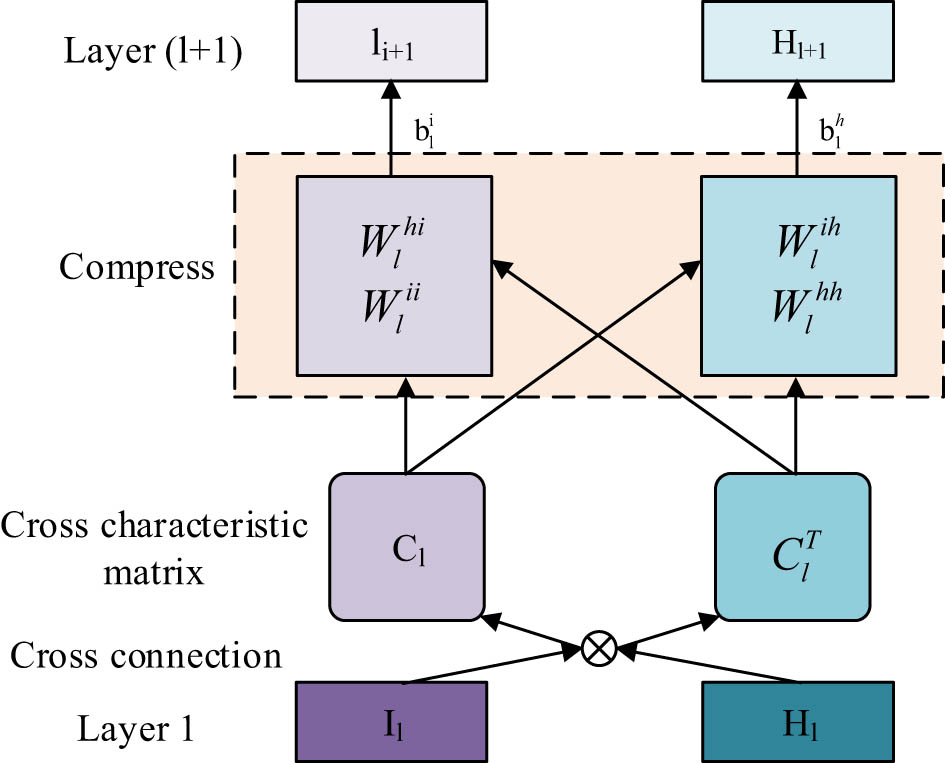
Structural diagram of feature sharing unit.
A vector input layer, crossover operation processing, crossover feature matrix creation, compression operation processing, and a vector output layer are all components of the feature sharing unit, as shown in Figure 3. The vector compression operation is carried out by the unit after the vector crossover operation. The two one-dimensional input vectors are ready to be operated upon at the crossover step. The operation is a vector multiplication, and the resulting two-dimensional matrix is then used to merge the data [19]. The weight matrix is multiplied by the two 2D matrices containing the input vector information during the vector compression step to produce the compressed 1D vectors for sharing vector information. It is clear that the feature sharing unit will be crucial to raising the effectiveness of the recommendation model. The crossover operation’s mathematical equation is as follows:
where
The weight matrix and bias vector necessary for the compression process are denoted in equation (2) by the letters
where
where the letters
where
where
3.2 Interactive short-text sentiment analysis model construction
The study began with textual sentiment analysis to look at students’ attitudinal tendencies toward learning comments in order to objectively analyze students’ interactive qualities in online learning. The brief text type includes the interactive remarks made by students. Due to the considerable feature sparsity of this text type, direct text sentiment analysis typically produces inaccurate results. To improve the extraction of sentiment data from short messages, a text extension method will be employed. The approach begins by pre-processing data for short-text datasets. To increase data purity, pre-processing cleans and eliminates abrasive information from the raw data, such as stop words and pointless symbols. The pre-processed text data type must be converted into numerical input data based on a vectorized representation because it cannot be supplied directly into the algorithm model. The Word2Vec model often serves as the foundation for the vectorized representation of text. The Continuous Jumping Word Model and the Continuity Bag of Words (CBOW) model make up the model. The CBOW model was chosen because of its quick transformation of text properties into high-dimensional vectors, which was all that the investigation required. The CBOW model’s structure is shown in Figure 4.
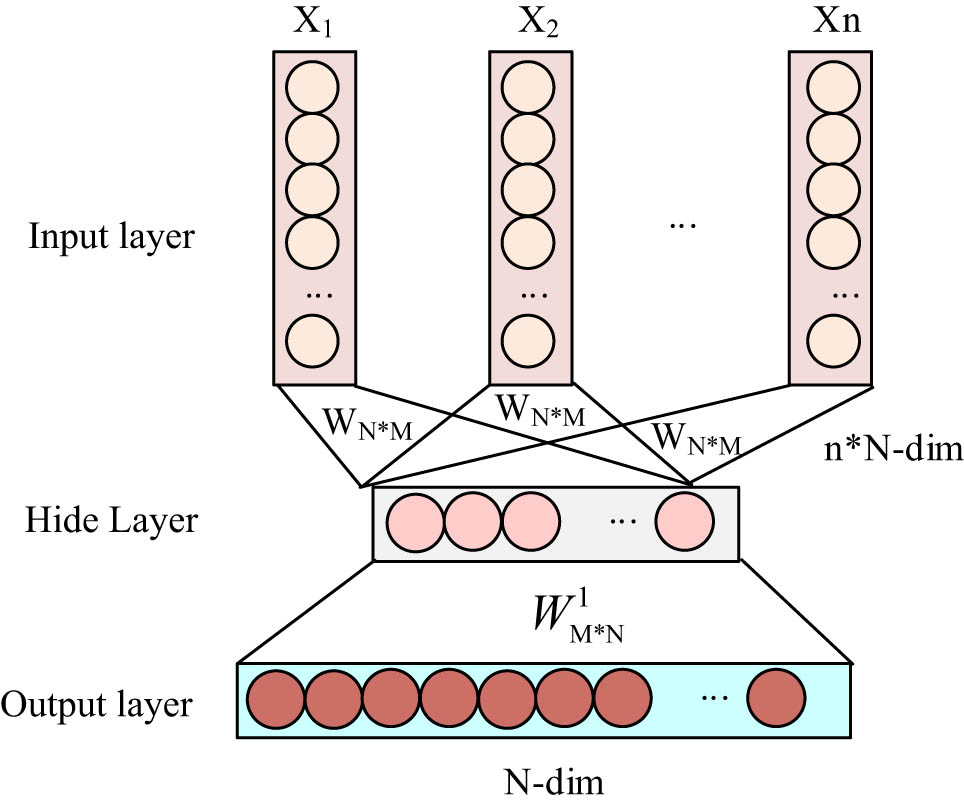
Structural diagram of the CBOW model.
As seen in Figure 4, the CBOW model’s input layer uses one-hot coding to convert the text into an N-dimensional vector. The input layer contains n N-dimensional vectors. The letters W stand for the mapping weight matrix, N stands for the number of words in a phrase, and M stands for the dimensionality of the word vector. The N-dimensional word vectors are averaged to get the implied layer vectors. A classifier with Softmax is used as the output layer, and the output values are probabilities. For the calculation of sentiment relevance, the vectorized representation of the text features will be employed. Lexical classification weights are calculated before the sentiment relevance computation. The study uses Word Frequency-Inverse Document Frequency (TF-IDF) to calculate the importance of different words and obtain their weights for classification purposes. The TF-IDF calculation is expressed as:
where
The unimproved TF-IDF does not account for feature category information, which can reduce the algorithm’s clustering power for short texts. As a result, the study will use the term “information gain” to define the degree to which features contribute to the themes that are categorized. The information gain is expressed in the following equation:
where
where
Example diagram of self-associative word association network.
The word association network is made up of three components, as shown in Figure 5: graph nodes, connected edges, and weight values. The weights are used to gauge how closely subsets are related. Co-occurrence probabilities and feature dependencies are computed to construct a word association network. The co-occurrence probability shows the likelihood that one trait will emerge when another one does. The percentage of the feature set’s feature sequence that is represented by feature dependency. The co-occurrence probability can be calculated as follows:
where both
where
4 Analysis of the results of a personalized exercise recommendation model for teaching interaction enhancement
4.1 Utility analysis of INMD models based on knowledge graph enhancement
Exercises, competitions, user data, user records, and knowledge data will all be included in the dataset for the study, which was derived from the online testing platform Codeforces. There are 6,920, 1,315, 45,469, 89,365, and 262 entries in total. The event name and the event exercise set make up the event data. The submission result, event name, and submission time are all included in the user record, as shown in Table 1.
Codeforces user – Exercise-related dataset
| Data name | Data item description | Data volume |
|---|---|---|
| Exercise data | Including the event ID of the exercise, the list of knowledge points involved in the exercise, the name of the exercise, the number of passes, and other data items | 6,920 |
| User data | Including user nicknames, ability values, and other data items | 1,315 |
| Event data | Including event ID, event type, and other data items | 45,469 |
| User question making record | Including data items such as exercise ID and pass or not | 89,365 |
| Knowledge point data | Including all the knowledge points involved in the exercises | 262 |
In this study, the training and test sets were split into two groups in a 3:1 ratio. Accuracy, recall, F1 value, and diversity mean were chosen as the measures for evaluating the model. The knowledge graph’s vector length was also set to 8, the knowledge graph embedding model’s learning rate was set to 0.02, and the INMD exercise recommendation model’s learning rate was set to 0.05. The recall rate and F1 value comparison curves for several models are shown in Figure 6.

Comparison curve of recall rate and F1 value of different models: (a) recall and (b) F1 value.
As can be noted from Figure 6, the proposed model obtained the highest values in terms of recall as well as F1 values. The proposed model achieved the highest recall and F1 values. The collaborative filtering algorithm (CFA) and deep factor decomposition module (DeepFM) observed the second highest and lowest values, respectively. All three models’ recall and F1 curves exhibit a sharp ascent followed by a gradual turn toward convergence. The recall measure for the proposed model starts to converge at a value of 84.6%, whereas the corresponding values for the CFA and DeepFM methods are 70.1 and 58.2%. When there had been 200 iterations, the recall of the suggested model had finally converged to 94.6%, as opposed to 90.2 and 88.5% for the other two algorithms. At the end of the iterations, the recall metrics of the proposed model outperformed those of the CFA and DeepFM algorithms by 4.4 and 6.1%, respectively. Additionally, the proposed model’s ultimate convergence rate was 92.3% when 200 iterations were used, as opposed to 90.0 and 88.2% for the CFA and DeepFM methods. As can be observed from the comparison, the suggested model improved by 2.3 and 4.1%, respectively. This demonstrates that the suggested model may successfully include the knowledge graph information from the exercises and enhance the efficacy of the task of providing learners with personalized exercise recommendations. Figure 7 displays the mean diversity curves of the comparison models as well as the mean diversity curves for various matching criteria.
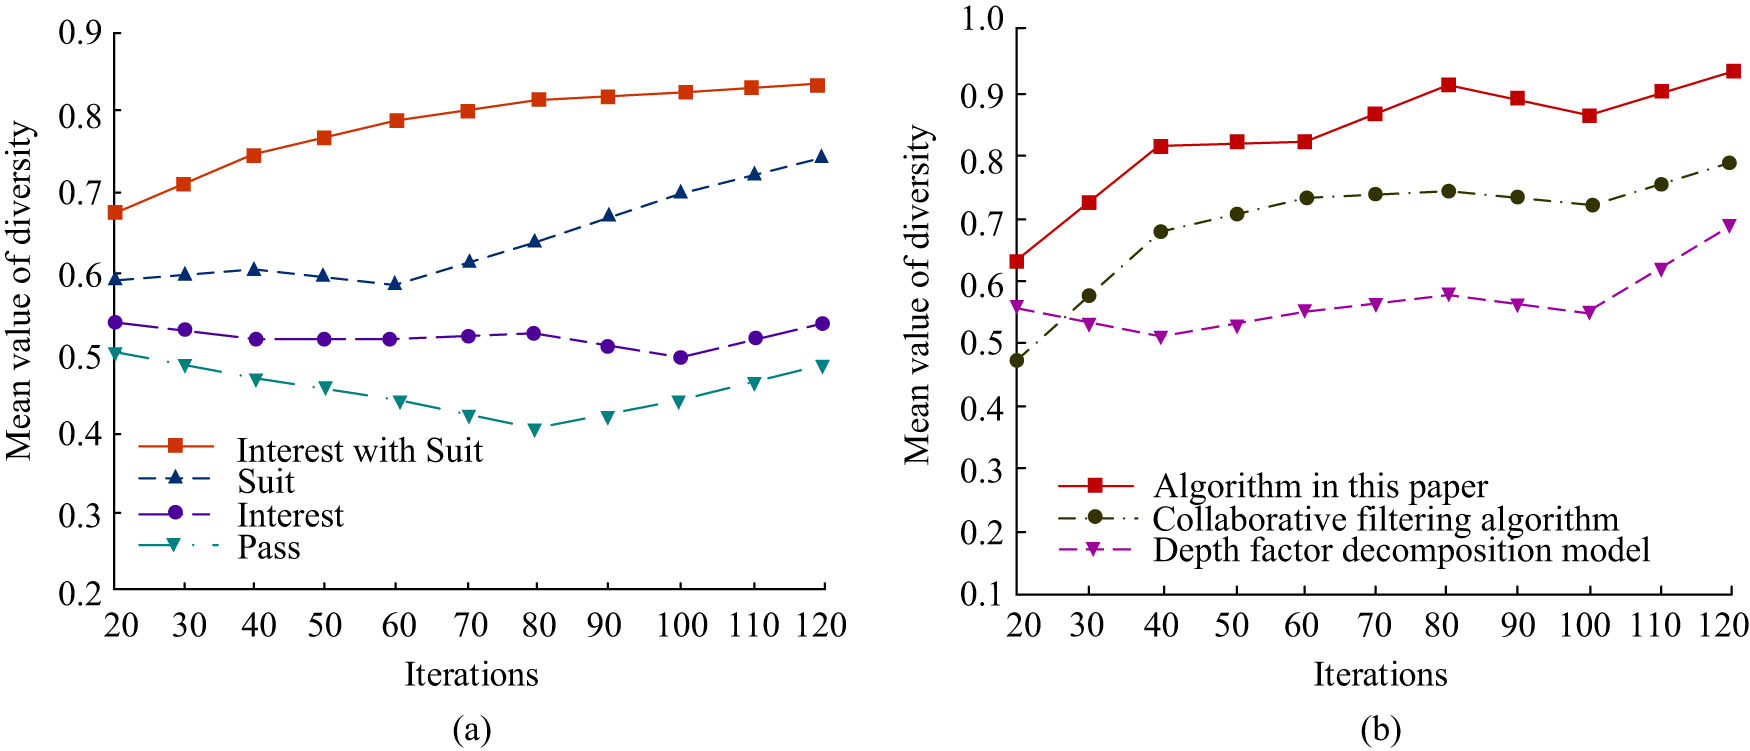
Diversity mean curve under different matching conditions and comparison model diversity mean curve: (a) mean value of diversity under different matching conditions and (b) comparison model diversity mean.
Figure 7 illustrates how the study’s matching conditions were Pass, Interest, Suit, and Interest with Suit (IWS). For each of the several matching criteria, the study’s suggested mean values for model diversity varied. When there were 20 iterations, IWS increased the diversity mean metric over the first three matching conditions by 0.19, 0.16, and 0.09, respectively. When there were 120 iterations, or when the iterations were finished, the IWS matching condition had the highest diversity mean (0.83), compared to the Pass, Interest, and Suit matching conditions’ 0.74, 0.55, and 0.48, respectively. The comparison reveals that the IWS matching condition is better than the subsequent three by 0.09, 0.28, and 0.35. The diversity mean curves for the three various models under the IWS matching requirement are displayed in Figure 7(b). The experiments show that the mean value of diversity for the proposed model is 0.93 at the end of the iteration, while the corresponding mean values for CFA and DeepFM are 0.79 and 0.70, respectively. The comparison reveals that the proposed model outperforms the other two algorithms by 0.14 and 0.23. Therefore, this indicates that the model can simultaneously consider the learner’s interest and difficulty adaptation in the exercises, making the diversity of exercise recommendation results the most abundant. The accuracy and loss value comparison curves for the various models are displayed in Figure 8.
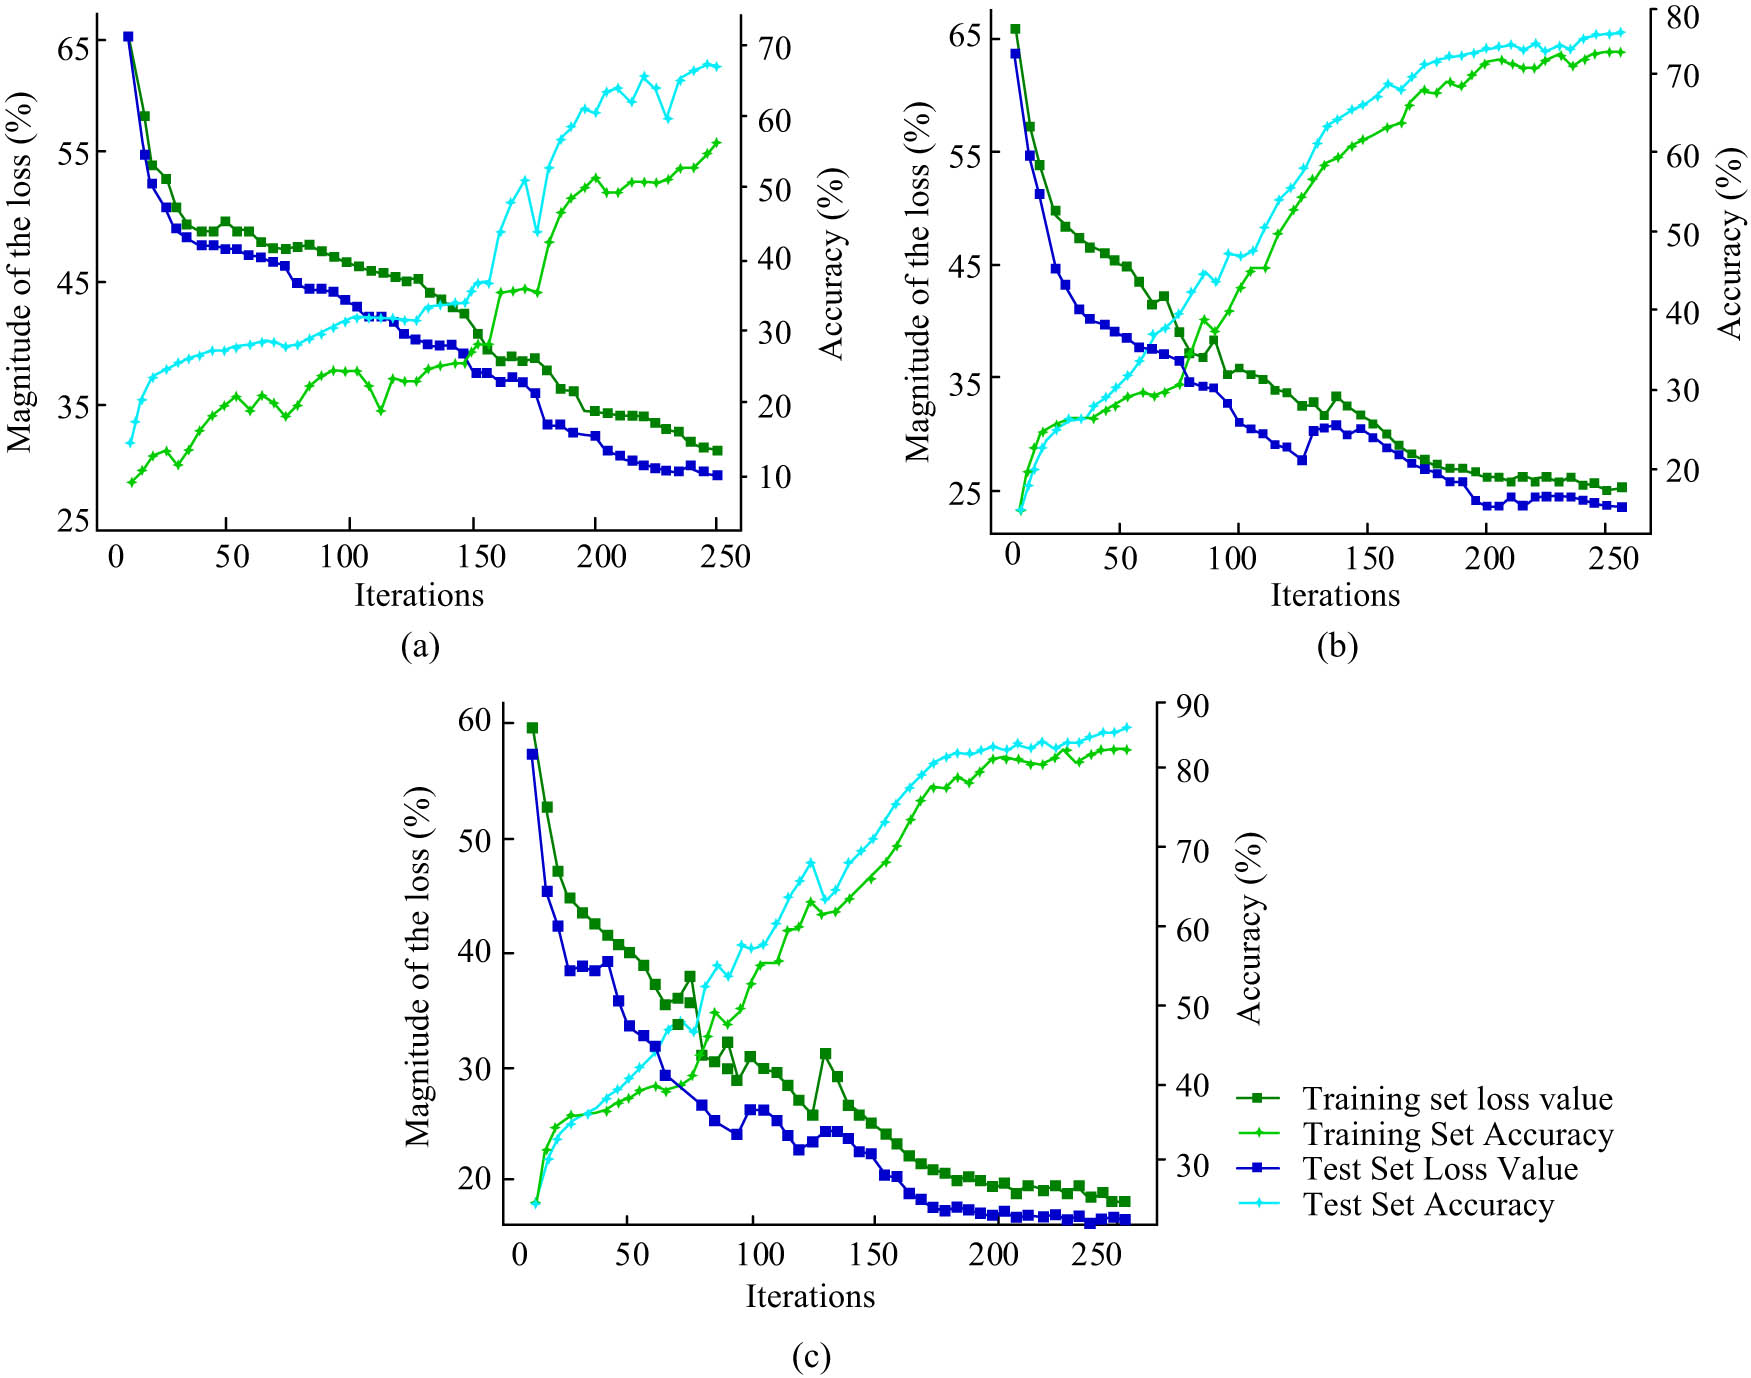
Comparison curve of accuracy and loss value of different models: (a) DeepFM, (b) CFA, and (c) model in this article.
The loss value curve for the DeepFM algorithm’s test set declines at the slowest pace, followed by the loss value curve for the proposed model’s test set, which decreases at the fastest rate, and the loss value curve for the CFA method, which decreases at a moderate rate. Before 200 iterations, the loss value of the CFA algorithm’s test set began to converge, eventually settling at 23.5%. After 150 iterations, the loss value curve for the test set of the suggested model begins to converge, with a final convergence value of 15.8%. The proposed model achieved the greatest value of recommendation accuracy based on the test set. Figure 8(c) shows that the model’s accuracy curve climbs more quickly and begins to converge at iteration number 170, eventually reaching a maximum accuracy of 88.6% at iteration number 250. The most accurate algorithms, CFA and DeepFM, had accuracy rates of 78.2 and 68.9%, respectively. The comparison reveals that the proposed model outperformed the latter two algorithms in terms of accuracy metrics by 10.4 and 19.7%. This proves that the model is better at recommending exercises that are specific to each individual.
4.2 Analysis of the utility of the sentiment analysis model for interactive short texts
Student interactive texts from the MOOC website’s College English Writing course were chosen for analysis as part of the study’s effort to evaluate the efficacy of the sentiment analysis model of interactive texts based on sentiment relevance. Positive and negative attitudes were separated into separate categories in the student interactive text. Three dimensions made up positive emotions: satisfaction, happiness, and enjoyment. There were three types of negative emotions: dissatisfaction, dislike, and boredom. Accuracy, recall, and F1 value were chosen as the model evaluation criteria. Random Forest and SVM were the comparison algorithms of choice. The accuracy curves for the three models are shown in Figure 9 both before and after the brief text expansion.
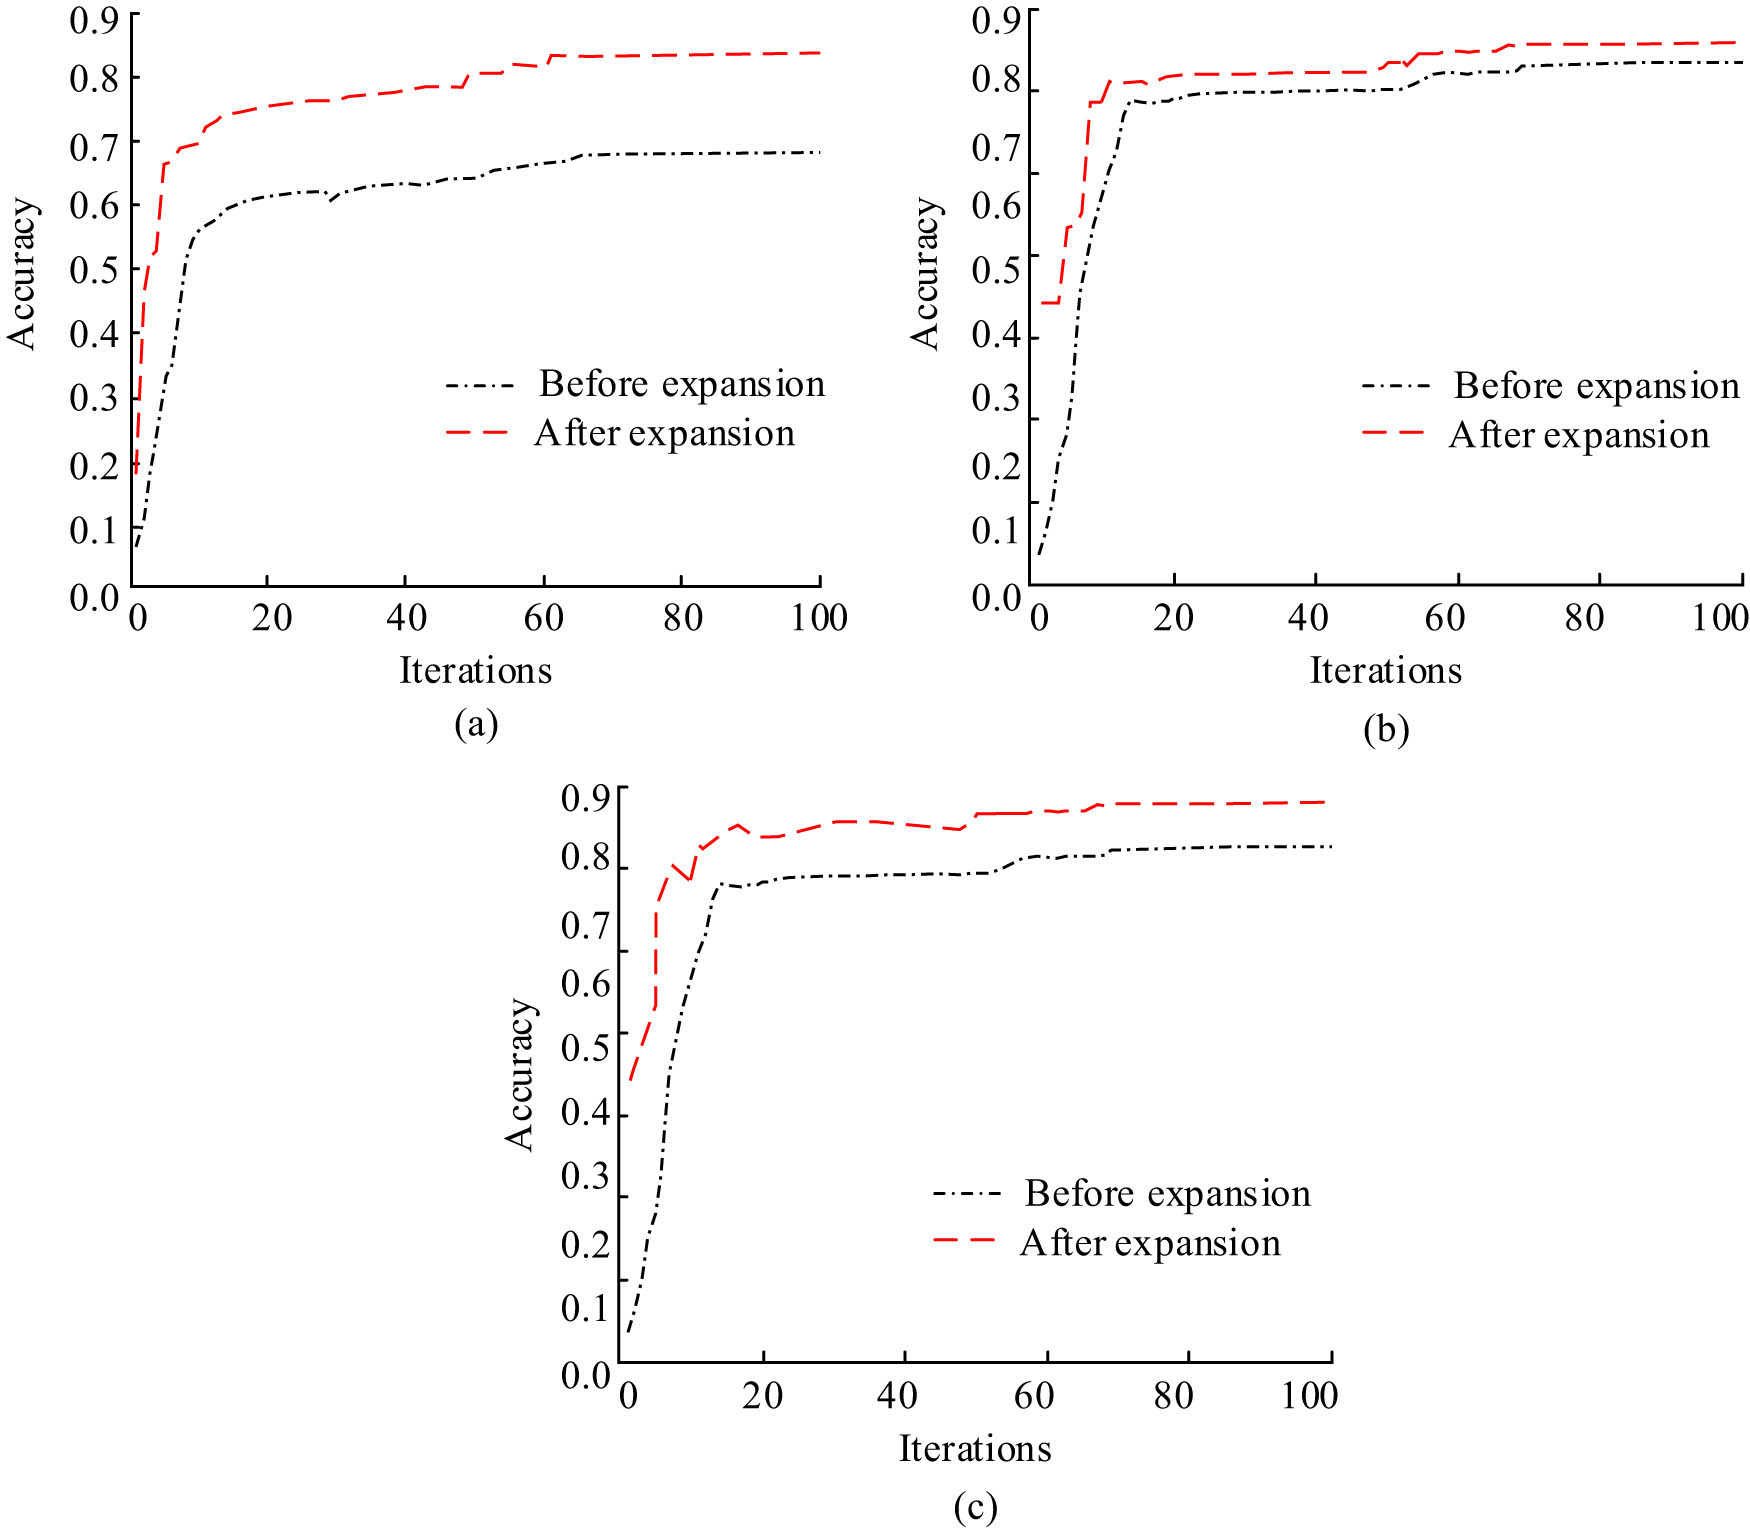
Accuracy curves of three models before and after short text expansion: (a) SVM, (b) Random Forest, and (c) model in this article.
Figure 9 shows that, regardless of the model, the accuracy curves before and after the expansion grew. When there were 100 iterations, the pre-expansion accuracy convergence value for the SVM model was 69.3%. The accuracy convergence after extension increased by 14.1% between before and after, to 83.4%. At the end of the iterations, the Random Forest model’s pre- and post-expansion accuracy convergence values were 83.8 and 87.6%, respectively. Pre- and post-extension accuracy for the study’s model was 82.1 and 89.3%, respectively, indicating an improvement in accuracy of 7.2%. The comparison revealed that the study’s model outperformed the first two models after extension by 5.9 and 1.7%. Figure 10 displays the F1 value curves and recall for the three models both before and after the brief text expansion.
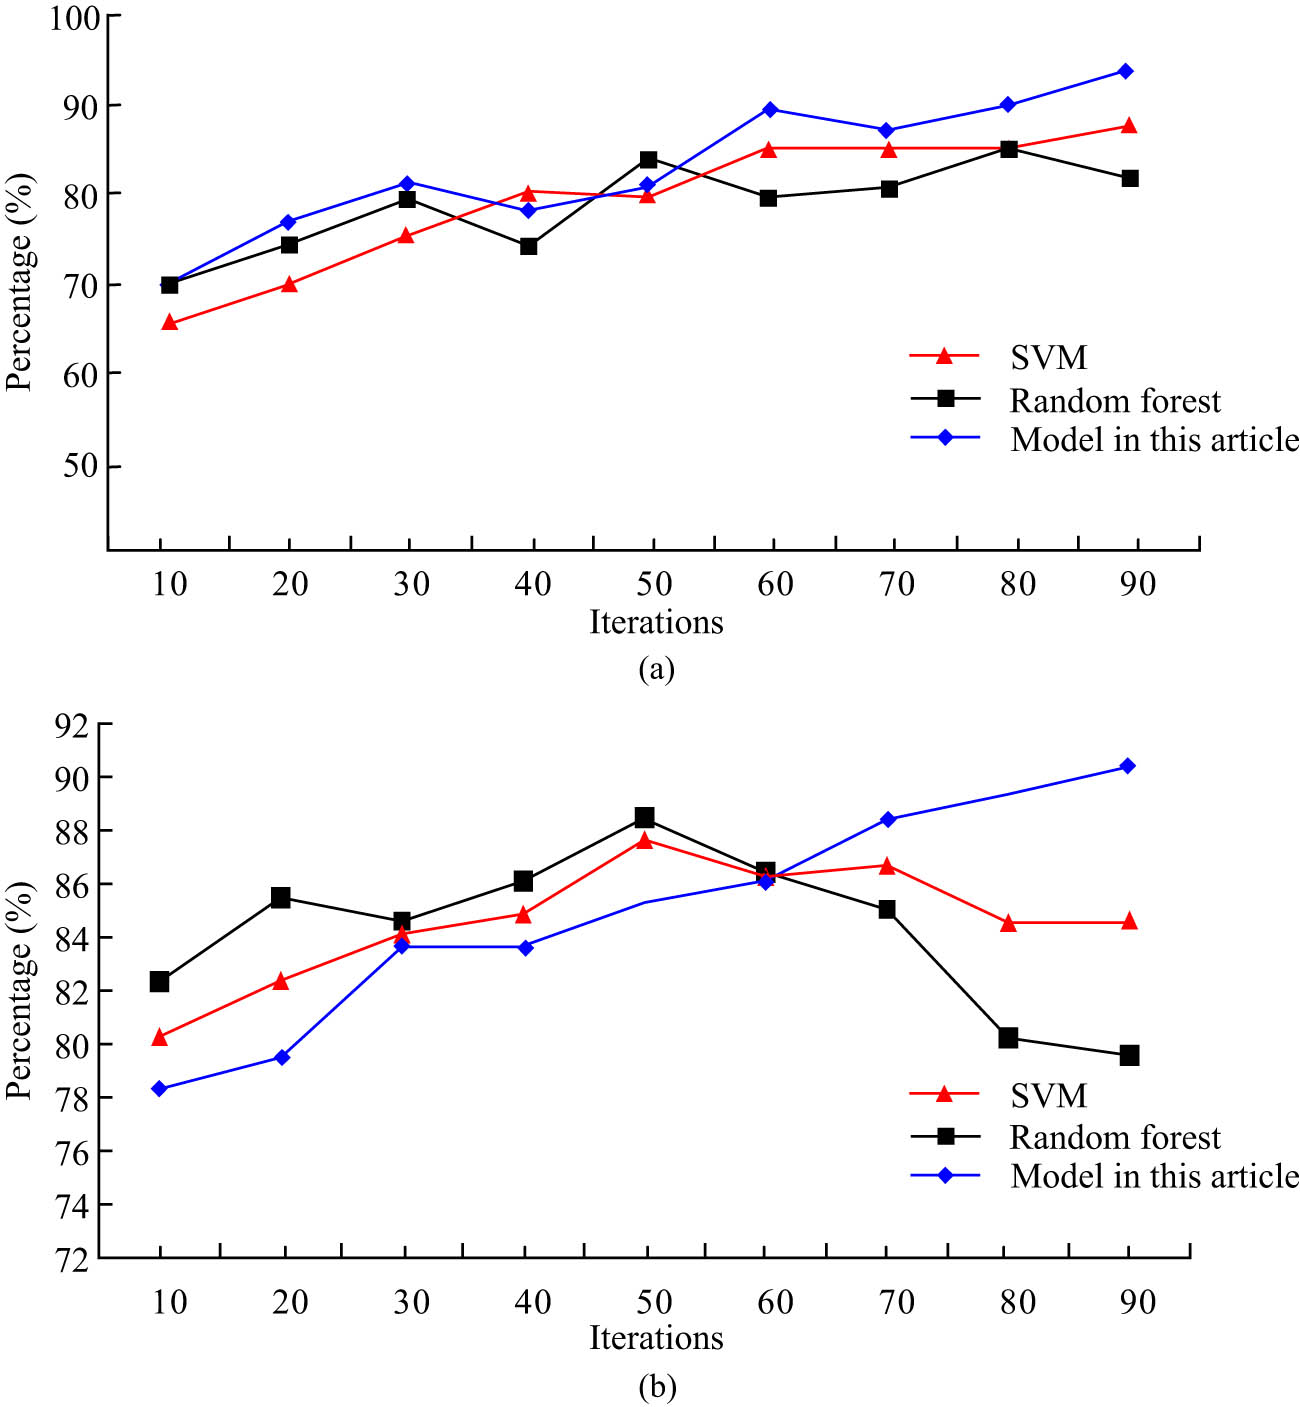
Recall rate and F1 value curve of three models after short-text expansion: (a) recall and (b) F1 value.
Figure 10(a) illustrates the overall growing trend in recall curves for the extended SVM, Random Forest, and the study’s adopted sentiment relevance-based interactive text sentiment analysis model. The SVM model, which had a size of 88.1%, had the highest recall rate among them after 90 iterations. With a size of 84.5%, the Random Forest model achieved the highest recall after 50 iterations. The study’s model, which had a size of 94.3%, had the highest recall after 90 iterations. The comparison reveals that the model’s recall is up to 6.2 and 9.8% from the previous two models. The F1 value curves of the extended SVM and randomness forest models all exhibit a rising and then a declining trend, while the F1 value curves of the study’s suggested model exhibit an increasing trend, as can be shown in Figure 10(b). The highest F1 value of the SVM model among them is 87.9%. The Random Forest model’s greatest F1 value was 88.3%. The study’s model has an F1 value as high as 90.4%. Comparing the two models reveals that this model has boosted the F1 value by 2.5 and 2.1%. This indicates that the model has an advantage in interactive text sentiment analysis. Figure 11 shows the results of the performance metrics of the model proposed in the study under different extensions.
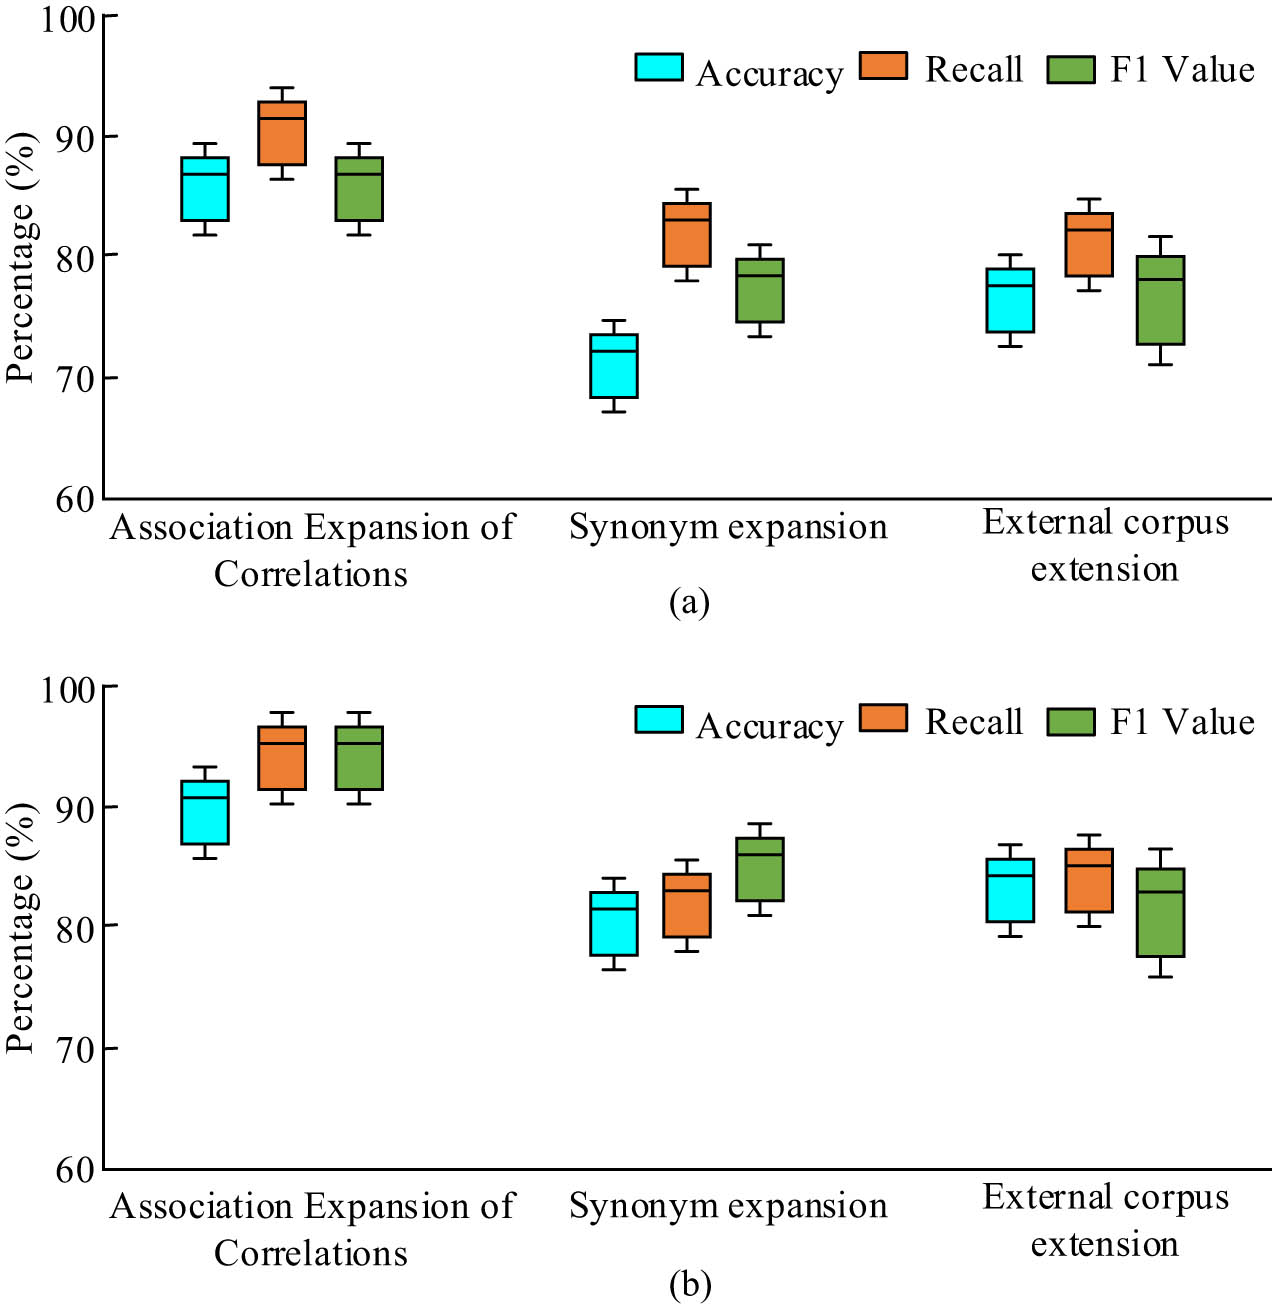
Performance index results of the model proposed in the study under different expansion methods: (a) training set and (b) test set.
Figure 11 shows that in terms of accuracy, recall, and F1 value for both the training and test sets, the associative word association expansion technique used in the study is superior to the synonym expansion approach and the external corpus expansion approach. The study’s expansion method yields accuracy rates of 90.1%, recall rates of 96.8%, and F1 values of 96.8% for the test set, which are 9.6, 10.5, and 8.9% higher than the synonym expansion method and 6.7, 7.2, and 9.2% higher than the external corpus expansion method, respectively.
5 Conclusion
Due to unsupervised pupils, online learning frequently suffers from low interest in studying, limited classroom interaction, and low learning effectiveness. The study developed an INMD exercise recommendation model based on knowledge graph enhancement and an interactive text sentiment analysis model based on sentiment relevance to increase students’ interest in learning and improve the teaching interaction between students and teachers. In comparison with the CFA and DeepFM algorithms, which had recall convergence values of 90.2 and 88.5%, respectively, the study’s proposed model had a recall convergence value of 94.6%, an improvement of 4.4 and 6.1%. The convergence value of the F1 value of the proposed model was 92.3%, while the convergence values of the F1 values of the CFA and DeepFM algorithms were 90.0 and 88.2%, an improvement of 2.3 and 4.1%. The convergence value of the loss value of the test set of the model proposed in the study was 15.8%, while the convergence values of the loss value of the test set of the CFA algorithm and DeepFM algorithm were 23.5 and 28.2% respectively, a decrease of 7.7 and 12.4%. In the post-expansion experiments of the interactive short text, the F1 value curves of the SVM and randomness forest models all showed a rising and then decreasing trend, while the F1 value curves of the proposed model of the study showed an increasing trend. Over the previous two models, the model’s F1 values increased by 2.5 and 2.1% respectively. Additionally, the study’s associative word association expansion method outperformed the synonym expansion method by improvements of 9.6, 10.5, and 8.9%, respectively, in accuracy, recall, and F1 values. This showed that the study’s proposed methodology was more suited for both sentiment analysis of interactive short texts and customized workout recommendations. The innovation of the exercise recommendation model proposed in this study lies in the use of cross-compressed shared units and the use of correlation information between exercises in the knowledge graph to alleviate the cold start problem and data sparsity problem of traditional recommendation algorithms. In addition, the innovation of the interactive text sentiment analysis model proposed by the research institute lies in its belonging to the short-text extension algorithm based on emotional features, which helps to address the problem of feature sparsity caused by short missing features in short texts.
-
Funding information: Jilin Provincial Association of Higher Education (JPAHE), A Study on the Multi-modal Teaching Mode of Ideological and Political Aspects of College English Courses under the Background of Informatization, (NO. JGJX2023D760).
-
Author contributions: Yaqiu Jiang wrote original draft, participated in literature search and analyses, evaluations and manuscript preparation, as well as wrote the paper.
-
Conflict of interest: The authors declare no conflict of interest.
-
Data availability statement: The datasets generated during and/or analyzed during the current study are available from the corresponding author on reasonable request.
References
[1] Gao X. Australian students’ perceptions of the challenges and strategies for learning Chinese characters in emergency online teaching. Int J Chin Lang Teach. 2020;1(1):83–98.Suche in Google Scholar
[2] Siyuan Y. Online active learning activities to enhance English writing skills for non-native speakers in vocational college. Int J Educ Commun Technol. 2023;3(1):42–53.Suche in Google Scholar
[3] Susilawati S. Integrating content and language to teach ESP writing online with the assistance of Google docs. J Lang Lang Teach. 2023;11(1):14–26.10.33394/jollt.v11i1.6617Suche in Google Scholar
[4] Cahyono BY, Astuti UP, Suryati N. Online writing instruction in Indonesia: Causes of anxiety problems and strategies of solutions. Pegem J Educ Instr. 2023;13(1):31–40.10.47750/pegegog.13.01.04Suche in Google Scholar
[5] Awada GM, Diab NM. Effect of online peer review versus face-to-face peer review on argumentative writing achievement of EFL learners. Comput Assist Lang Learn. 2023;36(1–2):238–56.10.1080/09588221.2021.1912104Suche in Google Scholar
[6] Xu J. Chinese university students’ L2 writing feedback orientation and self-regulated learning writing strategies in online teaching during COVID-19. Asia-Pac Educ Res. 2021;30(6):563–74.10.1007/s40299-021-00586-6Suche in Google Scholar
[7] Fitria TN. Grammarly as AI-powered English writing assistant: Students’ alternative for writing English. Metathesis: J Engl Lang Lit Teach. 2021;5(1):65–78.10.31002/metathesis.v5i1.3519Suche in Google Scholar
[8] Zou M, Kong D, Lee I. Teacher engagement with online formative assessment in efl writing during COVID-19 pandemic: The case of China. Asia-Pac Educ Res. 2021;30(6):487–98.10.1007/s40299-021-00593-7Suche in Google Scholar
[9] Prastikawati EF, Wiyaka W, Adi ABPK. Online backchannel as a formative assessment in improving writing skills. J Engl Foreign Lang. 2020;10(2):359–84.10.23971/jefl.v10i2.2044Suche in Google Scholar
[10] Rinekso AB, Muslim AB. Synchronous online discussion: teaching English in higher education amidst the covid-19 pandemic. J Engl Educ Soc. 2020;5(2):155–62.10.21070/jees.v5i2.646Suche in Google Scholar
[11] Ramos G, Meek C. Interactive machine teaching: A human-centered approach to building machine-learned models. Hum–Comput Interact. 2020;35(5–6):413–51.10.1080/07370024.2020.1734931Suche in Google Scholar
[12] Zhong K, Luo Q, Zhou Y. TLMPA: Teaching-learning-based Marine Predators algorithm. Aims Math. 2021;6(2):1395–442.10.3934/math.2021087Suche in Google Scholar
[13] Kumar Y, Singh PK. A chaotic teaching learning-based optimization algorithm for clustering problems. Appl Intell. 2019;49(3):1036–62.10.1007/s10489-018-1301-4Suche in Google Scholar
[14] Shukla AK, Pippal SK, Chauhan SS. An empirical evaluation of teaching–learning-based optimization, genetic algorithm and particle swarm optimization. Int J Comput Appl. 2023;45(1):36–50.10.1080/1206212X.2019.1686562Suche in Google Scholar
[15] Allam M, Malaiyappan N. Wrapper based feature selection using integrative teaching learning-based optimization algorithm. Int Arab J Inf Technol. 2020;17(6):885–94.10.34028/iajit/17/6/7Suche in Google Scholar
[16] Liu G, Zhuang H. Evaluation model of multimedia-aided teaching effect of physical education course based on random forest algorithm. J Intell Syst. 2022;31(1):555–67.10.1515/jisys-2022-0041Suche in Google Scholar
[17] Hu X. Analysis and research on the integrated English teaching effectiveness of internet of things based on stochastic forest algorithm. Int J Contin Eng Educ Life Long Learn. 2022;32(1):1–18.10.1504/IJCEELL.2022.121222Suche in Google Scholar
[18] Chen J, Lu H. Evaluation method of classroom teaching effect under intelligent teaching mode. Mob Netw Appl. 2022;27(3):1262–70.10.1007/s11036-022-01946-2Suche in Google Scholar
[19] Wang M, Lv Z. Construction of personalized learning and knowledge system of chemistry specialty via the internet of things and clustering algorithm. J Supercomput. 2022;78(8):10997–1014.10.1007/s11227-022-04315-8Suche in Google Scholar
© 2024 the author(s), published by De Gruyter
This work is licensed under the Creative Commons Attribution 4.0 International License.
Artikel in diesem Heft
- Research Articles
- A study on intelligent translation of English sentences by a semantic feature extractor
- Detecting surface defects of heritage buildings based on deep learning
- Combining bag of visual words-based features with CNN in image classification
- Online addiction analysis and identification of students by applying gd-LSTM algorithm to educational behaviour data
- Improving multilayer perceptron neural network using two enhanced moth-flame optimizers to forecast iron ore prices
- Sentiment analysis model for cryptocurrency tweets using different deep learning techniques
- Periodic analysis of scenic spot passenger flow based on combination neural network prediction model
- Analysis of short-term wind speed variation, trends and prediction: A case study of Tamil Nadu, India
- Cloud computing-based framework for heart disease classification using quantum machine learning approach
- Research on teaching quality evaluation of higher vocational architecture majors based on enterprise platform with spherical fuzzy MAGDM
- Detection of sickle cell disease using deep neural networks and explainable artificial intelligence
- Interval-valued T-spherical fuzzy extended power aggregation operators and their application in multi-criteria decision-making
- Characterization of neighborhood operators based on neighborhood relationships
- Real-time pose estimation and motion tracking for motion performance using deep learning models
- QoS prediction using EMD-BiLSTM for II-IoT-secure communication systems
- A novel framework for single-valued neutrosophic MADM and applications to English-blended teaching quality evaluation
- An intelligent error correction model for English grammar with hybrid attention mechanism and RNN algorithm
- Prediction mechanism of depression tendency among college students under computer intelligent systems
- Research on grammatical error correction algorithm in English translation via deep learning
- Microblog sentiment analysis method using BTCBMA model in Spark big data environment
- Application and research of English composition tangent model based on unsupervised semantic space
- 1D-CNN: Classification of normal delivery and cesarean section types using cardiotocography time-series signals
- Real-time segmentation of short videos under VR technology in dynamic scenes
- Application of emotion recognition technology in psychological counseling for college students
- Classical music recommendation algorithm on art market audience expansion under deep learning
- A robust segmentation method combined with classification algorithms for field-based diagnosis of maize plant phytosanitary state
- Integration effect of artificial intelligence and traditional animation creation technology
- Artificial intelligence-driven education evaluation and scoring: Comparative exploration of machine learning algorithms
- Intelligent multiple-attributes decision support for classroom teaching quality evaluation in dance aesthetic education based on the GRA and information entropy
- A study on the application of multidimensional feature fusion attention mechanism based on sight detection and emotion recognition in online teaching
- Blockchain-enabled intelligent toll management system
- A multi-weapon detection using ensembled learning
- Deep and hand-crafted features based on Weierstrass elliptic function for MRI brain tumor classification
- Design of geometric flower pattern for clothing based on deep learning and interactive genetic algorithm
- Mathematical media art protection and paper-cut animation design under blockchain technology
- Deep reinforcement learning enhances artistic creativity: The case study of program art students integrating computer deep learning
- Transition from machine intelligence to knowledge intelligence: A multi-agent simulation approach to technology transfer
- Research on the TF–IDF algorithm combined with semantics for automatic extraction of keywords from network news texts
- Enhanced Jaya optimization for improving multilayer perceptron neural network in urban air quality prediction
- Design of visual symbol-aided system based on wireless network sensor and embedded system
- Construction of a mental health risk model for college students with long and short-term memory networks and early warning indicators
- Personalized resource recommendation method of student online learning platform based on LSTM and collaborative filtering
- Employment management system for universities based on improved decision tree
- English grammar intelligent error correction technology based on the n-gram language model
- Speech recognition and intelligent translation under multimodal human–computer interaction system
- Enhancing data security using Laplacian of Gaussian and Chacha20 encryption algorithm
- Construction of GCNN-based intelligent recommendation model for answering teachers in online learning system
- Neural network big data fusion in remote sensing image processing technology
- Research on the construction and reform path of online and offline mixed English teaching model in the internet era
- Real-time semantic segmentation based on BiSeNetV2 for wild road
- Online English writing teaching method that enhances teacher–student interaction
- Construction of a painting image classification model based on AI stroke feature extraction
- Big data analysis technology in regional economic market planning and enterprise market value prediction
- Location strategy for logistics distribution centers utilizing improved whale optimization algorithm
- Research on agricultural environmental monitoring Internet of Things based on edge computing and deep learning
- The application of curriculum recommendation algorithm in the driving mechanism of industry–teaching integration in colleges and universities under the background of education reform
- Application of online teaching-based classroom behavior capture and analysis system in student management
- Evaluation of online teaching quality in colleges and universities based on digital monitoring technology
- Face detection method based on improved YOLO-v4 network and attention mechanism
- Study on the current situation and influencing factors of corn import trade in China – based on the trade gravity model
- Research on business English grammar detection system based on LSTM model
- Multi-source auxiliary information tourist attraction and route recommendation algorithm based on graph attention network
- Multi-attribute perceptual fuzzy information decision-making technology in investment risk assessment of green finance Projects
- Research on image compression technology based on improved SPIHT compression algorithm for power grid data
- Optimal design of linear and nonlinear PID controllers for speed control of an electric vehicle
- Traditional landscape painting and art image restoration methods based on structural information guidance
- Traceability and analysis method for measurement laboratory testing data based on intelligent Internet of Things and deep belief network
- A speech-based convolutional neural network for human body posture classification
- The role of the O2O blended teaching model in improving the teaching effectiveness of physical education classes
- Genetic algorithm-assisted fuzzy clustering framework to solve resource-constrained project problems
- Behavior recognition algorithm based on a dual-stream residual convolutional neural network
- Ensemble learning and deep learning-based defect detection in power generation plants
- Optimal design of neural network-based fuzzy predictive control model for recommending educational resources in the context of information technology
- An artificial intelligence-enabled consumables tracking system for medical laboratories
- Utilization of deep learning in ideological and political education
- Detection of abnormal tourist behavior in scenic spots based on optimized Gaussian model for background modeling
- RGB-to-hyperspectral conversion for accessible melanoma detection: A CNN-based approach
- Optimization of the road bump and pothole detection technology using convolutional neural network
- Comparative analysis of impact of classification algorithms on security and performance bug reports
- Cross-dataset micro-expression identification based on facial ROIs contribution quantification
- Demystifying multiple sclerosis diagnosis using interpretable and understandable artificial intelligence
- Unifying optimization forces: Harnessing the fine-structure constant in an electromagnetic-gravity optimization framework
- E-commerce big data processing based on an improved RBF model
- Analysis of youth sports physical health data based on cloud computing and gait awareness
- CCLCap-AE-AVSS: Cycle consistency loss based capsule autoencoders for audio–visual speech synthesis
- An efficient node selection algorithm in the context of IoT-based vehicular ad hoc network for emergency service
- Computer aided diagnoses for detecting the severity of Keratoconus
- Improved rapidly exploring random tree using salp swarm algorithm
- Network security framework for Internet of medical things applications: A survey
- Predicting DoS and DDoS attacks in network security scenarios using a hybrid deep learning model
- Enhancing 5G communication in business networks with an innovative secured narrowband IoT framework
- Quokka swarm optimization: A new nature-inspired metaheuristic optimization algorithm
- Digital forensics architecture for real-time automated evidence collection and centralization: Leveraging security lake and modern data architecture
- Image modeling algorithm for environment design based on augmented and virtual reality technologies
- Enhancing IoT device security: CNN-SVM hybrid approach for real-time detection of DoS and DDoS attacks
- High-resolution image processing and entity recognition algorithm based on artificial intelligence
- Review Articles
- Transformative insights: Image-based breast cancer detection and severity assessment through advanced AI techniques
- Network and cybersecurity applications of defense in adversarial attacks: A state-of-the-art using machine learning and deep learning methods
- Applications of integrating artificial intelligence and big data: A comprehensive analysis
- A systematic review of symbiotic organisms search algorithm for data clustering and predictive analysis
- Modelling Bitcoin networks in terms of anonymity and privacy in the metaverse application within Industry 5.0: Comprehensive taxonomy, unsolved issues and suggested solution
- Systematic literature review on intrusion detection systems: Research trends, algorithms, methods, datasets, and limitations