
Evaluation of cumulative rainfall and rainfall event–duration threshold based on triggering and non-triggering rainfalls: Northern Thailand case
-
Avirut Chinkulkijniwat

 ,
Rattana Salee
,
Rattana Salee

Abstract
A recently introduced rainfall threshold for landslide early warning systems combined a cumulative rainfall threshold with a rainfall event–duration (ED) threshold. Cumulative rainfall with rainfall event–duration, known as the CED threshold, was reported to perform better than the conventional ED threshold. However, the establishment of the CED threshold was based on a frequentist approach which required an adequate number of landslide-triggering rainfall data. An alternative to the use of landslide-triggering rainfall data is the use of non-triggering rainfall data. These rainfall events supply much bigger amount of data to the susceptibility model. Although the establishment of a rainfall threshold based on non-triggering rainfall events is seldom considered, previous scholars reported that this approach has produced better results than the conventional approach based on landslide-triggering events. This study investigates the reliability and prediction performance of the CED threshold based on non-triggering rainfall data. The performance of this threshold, designated as the negative-CED (CEDN) threshold, was compared with the positive-CED (CEDP) threshold based on landslide-triggering rainfall data. North Thailand, a landslide hot spot, was chosen as the study area. The proposed threshold was assessed from three skill scores, including (1) the true positive fraction (TPF), (2) the false positive fraction (FPF), and (3) the positive predictive value (PPV), and their variations over the range of threshold uncertainties. Rather than possessing lower uncertainties of the threshold parameters, the negative threshold provided better compromise predictions of TPF and FPF scores than the positive thresholds. Integrating the cumulative rainfall threshold and an event-based rainfall threshold resulted in a significant improvement in FPF scores, and hence enhanced the compromise predictions of TPF and FPF scores. Keeping in mind that the negative thresholds were not established from landslide data, care must be taken when using these thresholds and it is recommended that they should be applied only to areas where landslide data are limited.
1 Introduction
Rainfall is the factor that most commonly affects the stability of many geotechnical structures [1,2,3], including sloping ground [4,5,6,7,8,9,10,11]. The stability of any slope can be assessed through an analysis of physical and mechanical parameters of the sloping ground. However, due to the difficulty of obtaining the physical and mechanical parameters of the rock and soil masses of large areas of land, this approach can only be applied within limited areas. This approach to slope stability assessment is therefore of limited use in the design and implementation of landslide warning systems, which are only really effective if they are reliable over a wide area. Landslide rainfall thresholds are more commonly used for warning systems since they can be based mainly on rainfall data.
According to Guzzetti et al. [12], there are three categories of landslide rainfall threshold. The first category includes thresholds derived from precipitation measurements associated with specific landslide events [13,14,15,16,17,18,19]. The second category includes thresholds based on antecedent conditions [20,21,22]. The third category includes all other thresholds, including hydrological thresholds [23,24,25].
Salee et al. [26] introduced a modified landslide rainfall threshold for the Southern Thailand region that combined cumulative rainfall (CR) and rainfall event–duration (ED). They described the threshold as the cumulative rainfall with rainfall event–duration (CED) threshold. The false alarm score from the CED threshold was significantly improved compared with the false alarm scores produced by the pre-existing ED thresholds that were derived from precipitation measurements associated with specific landslide events. Chinkulkijniwat et al. [27] introduced the CED threshold for the Northern Thailand region, which is a hotspot for landslides in Thailand. This CED threshold was based on 48 rainfall events that triggered 59 landslides in this region from 2002 to 2018 and was assessed by the use of a contingency matrix and relevant skill scores. The developed CED threshold showed better performances than the existing ED threshold, which belongs to the first threshold category described by Guzzetti et al. [12]. However, the CED threshold was established by applying a frequentist approach, which requires an adequate number of landslide-triggering rainfall events to ensure reliability and robustness. As indicated by Peres and Cancelliere [28], for a given geomorphologically homogeneous area, at least 200 landslide triggering events should be taken into account for establishing reliable threshold. Since this threshold was based on 48 triggering rainfalls, questions might justifiably be raised about the predictions obtained from its application.
The shortcomings of the frequentist approach to threshold establishment could perhaps be avoided either by using both triggering and non-triggering rainfall data [29,30,31] or by using only non-triggering rainfall data [32]. Although the latter approach is seldom considered, thresholds established in this way have shown good robustness, low sampling variation, and performances that are acceptable and sometimes better than thresholds derived only from triggering events [28,32]. Perhaps the approach deserves wider attention.
The work presented in this study incorporated data from non-landslide-triggering rainfall events into the recently integrated CED threshold to establish a negative-CED (CEDN) threshold. Quantile regression was employed to generate a set of thresholds at various probabilistic levels. The uncertainty of the threshold parameters generated from the regression was investigated and then the reliability of the thresholds was assessed. The assessment of reliability was based on the variation in three skill scores within the ranges of parameter uncertainty: the true positive fraction (TPF), the false positive fraction (FPF), and the positive predictive value (PPV). To the best of our knowledge, this study presents the first comprehensive investigation of the reliability of the CED threshold derived from triggering rainfall events, designated here as the positive-CED (CEDP) threshold. We compared the reliability of the CEDP threshold with that of the CEDN threshold. Besides assessing the performance of the CEDP threshold, which will enhance the landslide early warning system (LEWS) in Northern Thailand, this study explores the differences between CEDP and CEDN thresholds to clarify the applicability of the CEDN threshold.
2 Study area
Northern Thailand (Figure 1) comprises nine administrative provinces, namely, Chiang Rai, Mae Hong Son, Chiang Mai, Lamphun, Lampang, Phayao, Nan, Phrae, Uttaradit, and Phayao. The region covers approximately 93,691 km2. The average annual high temperature is 37°C. The average low temperature is 21°C. The average annual rainfall is 1,230 mm. The landscape is dominated by mountain ranges in the western and northeastern parts. These mountain ranges are part of the system of hills that extends through Laos, Myanmar, and China to the Himalayas, of which they may be considered foothills. The highlands in the north of Thailand are characterized by a pattern of generally steep hill ranges, intermontane basins, and alluvial gorges. Elevations are generally moderate, little above 2,000 m (6,600 ft) for the highest summits. There is a wide range of elevations though, with floors ranging between 200 and 500 m (660 and 1,640 ft) above sea level. Toward the Lao border, approaching the Mekong Basin, elevations become higher with peaks occasionally rising above 1,500 m (4,900 ft) and streams flowing in narrow steep valleys.
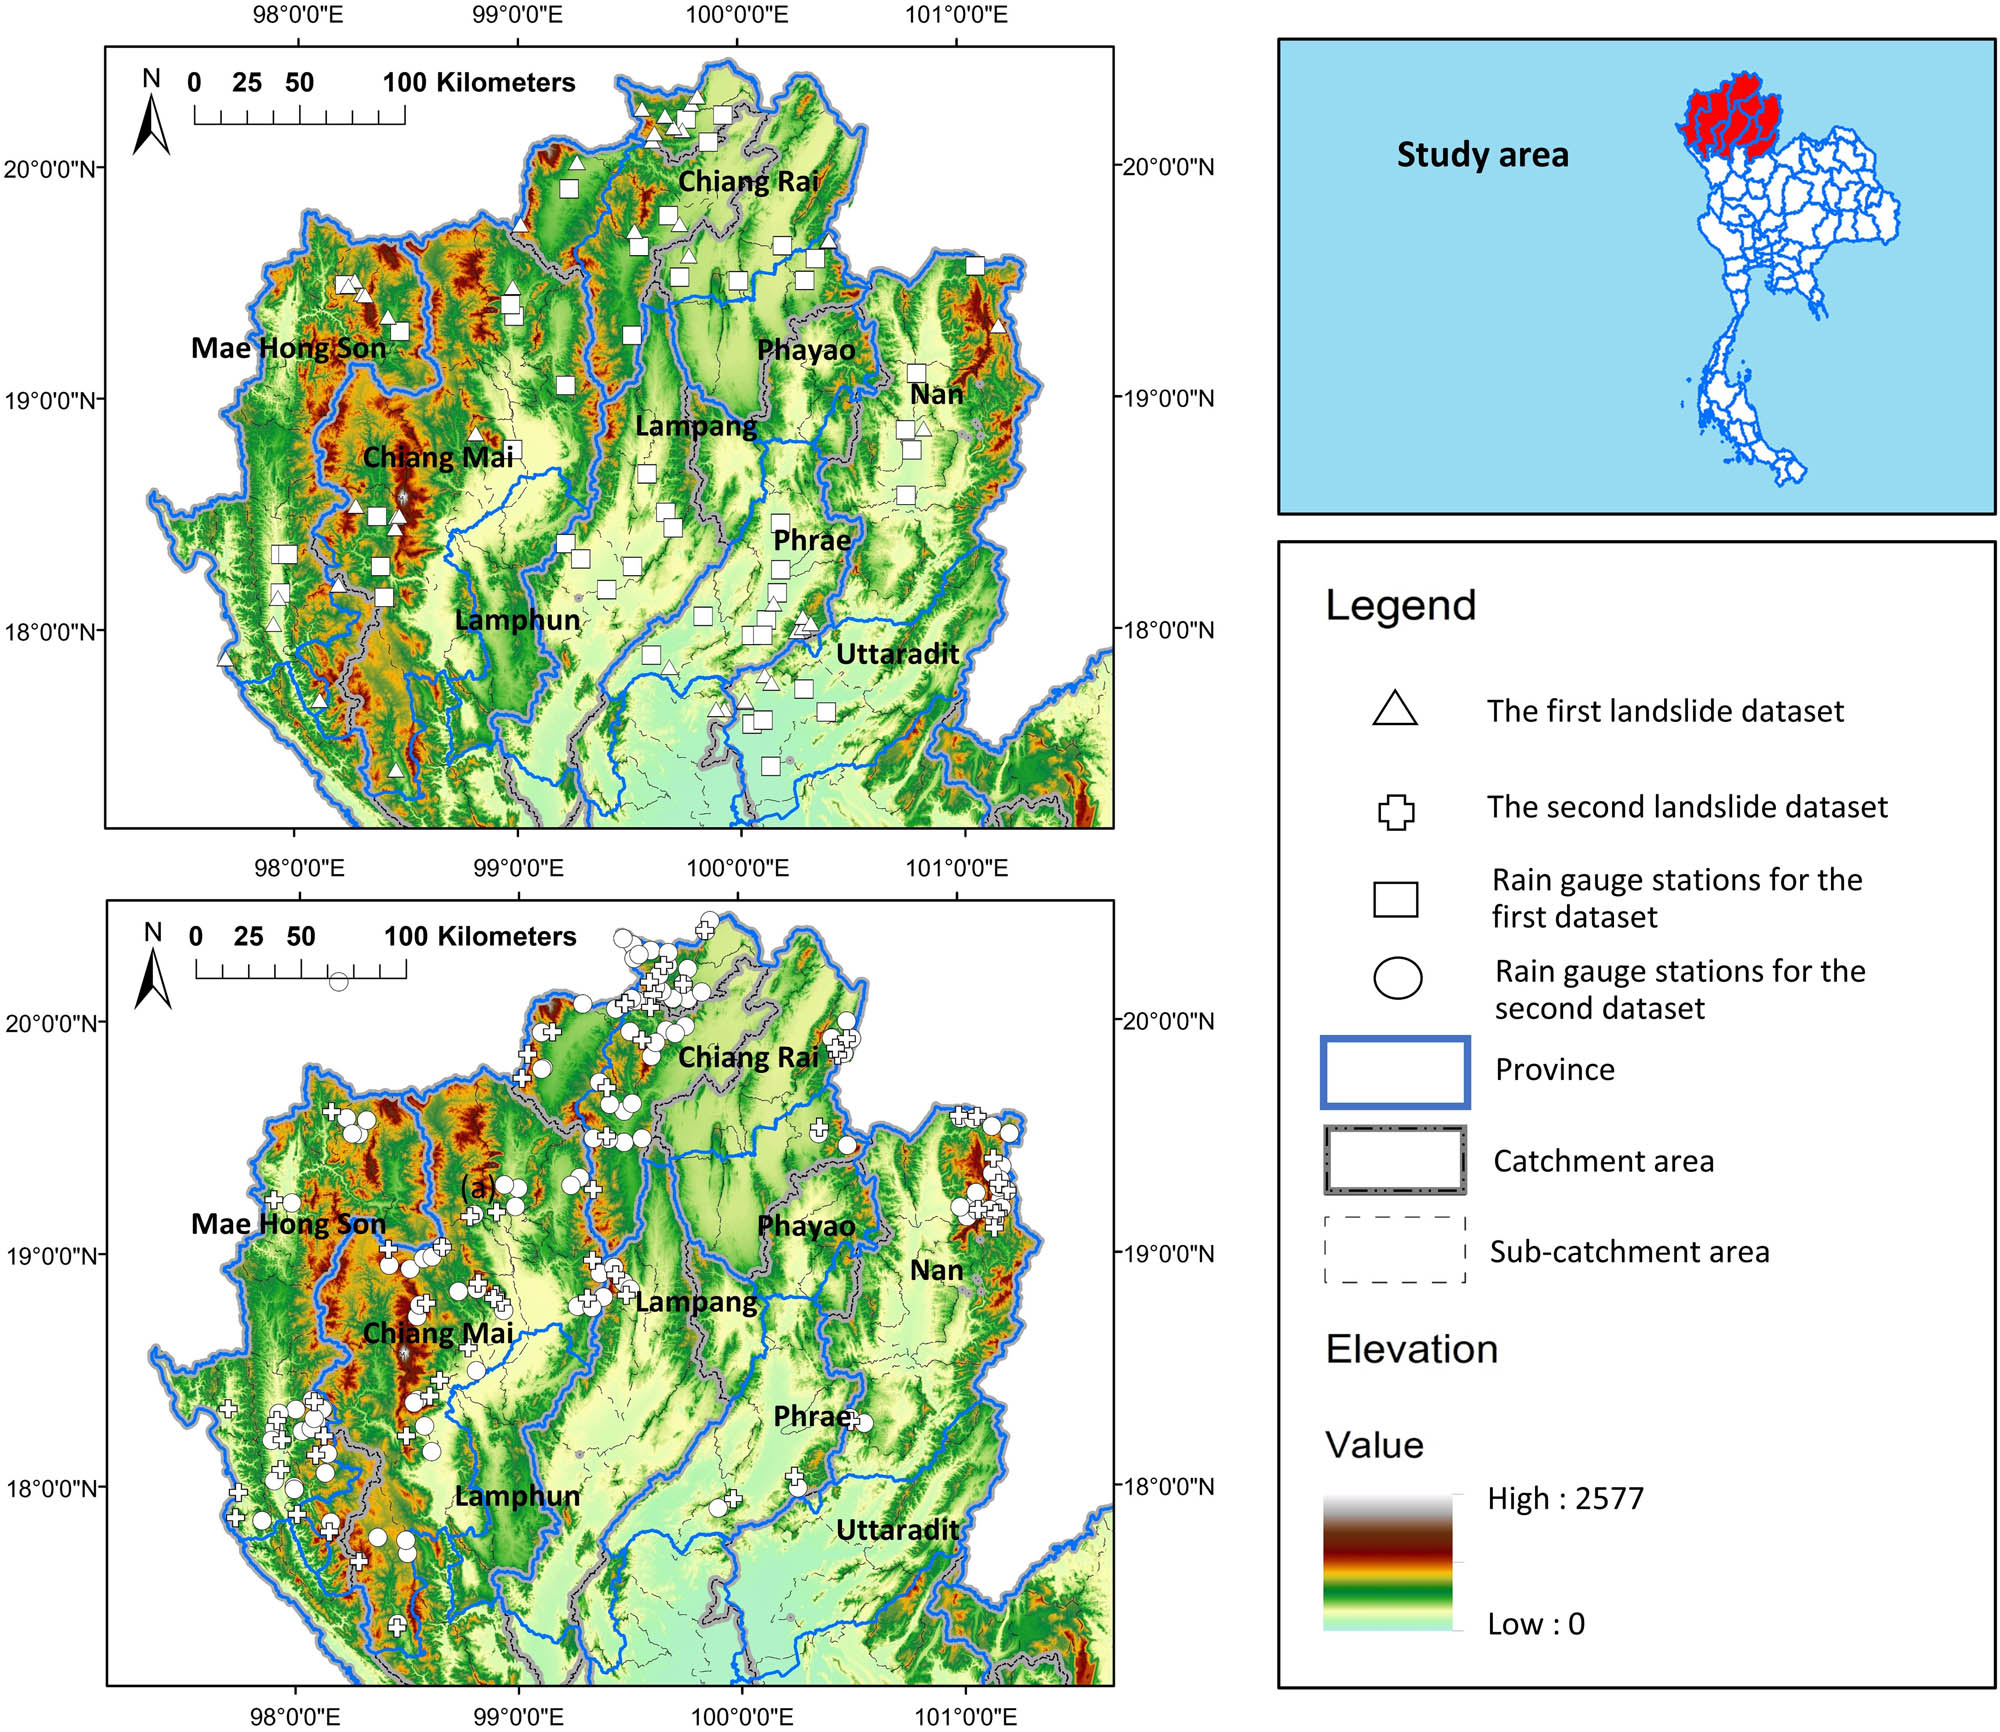
Map of Northern Thailand showing locations of landslides and rain gauge stations for the first dataset and the rain gauge stations for the second dataset. The upper left map presents locations for the first dataset. The white triangles and white squares are for the first dataset for landslides and rain gauge stations, respectively. The lower left map presents locations for the second dataset. The white crosses and white circles are for the second dataset for landslides and rain gauge stations, respectively. (Figure created using ESRI ArcGIS 10.5 software, https://www.esri.com/en-us/arcgis/about-arcgis/overview.).
Dominated by this hilly terrain, Northern Thailand often experiences damaging landslides triggered by prolonged rainfall. The Environmental Geology Division of Thailand [33] considered that 6,563 villages in 1,084 rural subdistricts, in 54 provinces, mostly in Northern Thailand, were in landslide hazard zones. In 2001, after continuous heavy rainfall, a landslide occurred in the Wang Chin district of Phrae Province that caused 40 deaths [34]. In the same year, the return period for the heavy rains that fell during these events is more than 50 years, a significant landslide event occurred on March 11, in the village of Nam Ko in Phetchabun Province, further south. The debris flows killed 136 people and economic losses were approximately 100 million THB. In 2006, landslides and serious flash floods in Sukhothai, Uttaradit, Phrae, Lampang, and Nan Provinces caused 87 deaths. More recently, in 2018, a landslide at the Baan Huay Khab community in Nan Province killed 8 people and more than 200 residents were evacuated to a temporary shelter nearby.
3 Materials and methodology
The collected data included landslide data and the corresponding rainfall data. Landslide data comprised dates of occurrence, geographical coordinates, and landslide consequences. Based on the landslide data, the corresponding rainfall data for the years of occurrence were assigned to landslide locations using inverse distance weighting (IDW). The IDW assigned a larger weight, based on inverse functions of distance, to a station closer to a landslide location than a station further away. The rainfall stations used for synthesizing the rainfall data for a given landslide were selected from all the stations located in the catchment area where the landslide occurred. Although IDW is a deterministic model, the reliability of the method for spatial interpolation has been demonstrated in various applications, including point spread function derivation [35], baseflow and baseflow index calculation [36], and rainfall estimation [37,38,39,40].
Here to define a rainfall event, an inter-event criterion (IEC) was first defined. Rainfall events were defined as separate events if the IEC was met. The IEC was applied as shown in Figure 2, where the inter-event criterion IECA,B is a combination of the rainfall intensity threshold A (mm/day) and duration B (days). The condition that distinguished two consecutive rainfall events had to satisfy the combined criterion. If rainfall intensity remained below threshold A for at least the same number of consecutive days (B) that preceded the last occasion on which threshold A was exceeded, two consecutive rainfall events were considered to have occurred. Conversely, if the rainfall intensity and duration of two rainfalls did not meet the IECA,B, these two rainfalls were considered as one continuous rainfall. All inter-event times between the two consecutive rainfalls were read and then employed to calculate the variation coefficient (CV) of inter-event times, where the CV was the ratio of the standard deviation to the mean value. Based on the assumption that inter-event times have an exponential distribution for which the mean equals the standard deviation [41], the suitable IEC was identified based on a CV of inter-event times equal to 1.0.

The chart shows how consecutive rainfall events were determined to have satisfied both conditions of the IEC used to define a single rainfall event in this study.
This study used two sets of landslide and rainfall data. The first dataset was used for establishing landslide rainfall thresholds. The second dataset was used to assess the established thresholds. The first dataset was based on 59 landslides recorded during the years 2002–2018. This dataset included dates of landslide occurrence, geographical coordinates, and consequences of the landslides. The data were gathered from scientific papers published by the Department of Mineral Resources (DMR), the Ministry of Natural Resources and Environment. The rainfall data corresponding to the landslide locations taking place within the years of occurrences were synthesized from Thai Meteorological Department (TMD) rain gauge stations and Royal Irrigation Department (RID) located in catchment areas where the landslides occurred. The rainfall data available from TMD and RID rain gauges are based on daily measurements and adjusted to have a resolution of 0.5 mm. Using the condition in which rainfall intensity was no greater than 5 mm/day for at least 1 day (IEC5,1) as a criterion for separating two consecutive rainfall events, 48 triggering rainfall events were defined. The other rainfall events at the landslide locations in the same year but before the triggering rainfall event were also determined and known as non-triggering rainfall events. In total, there were 1,843 non-triggering rainfall events for the first dataset. It is worth noting that this dataset was identical to the data reported by Chinkulkijniwat et al. [27], which introduced a rainfall threshold for the Northern Thailand Region. The use of IEC5,1 here was based on the study by Chinkulkijniwat et al. [27].
The second dataset was based on 71 landslides that occurred during the period 2017–2022. The data were retrieved from the geographic information system of the DMR (https://gis.dmr.go.th/DMR-GIS/). This database system reports a larger number of landslides and the retrieved data possess duplicated years from 2017 to 2018 of the first dataset. Landslides from these years that were reported in both datasets were not included in the second dataset used in this work. Again, the landslide data include dates of occurrence, geographical coordinates, and consequences of the landslide. In the second dataset, the daily rainfall data corresponding to the landslide locations and in the years of occurrence were synthesized from 131 weather stations of the Department of Water Resources (DWR) across Northern Thailand. All of the DWR rain gauges used in this study have a resolution of 0.1 mm. For the second dataset, the suitability of IEC5,1 was checked. It was found that IEC5,1 yielded an average rainfall of 5.23 mm/day with a standard deviation of 5.40, and hence a CV of 1.03, which confirmed the applicability of IEC5,1 as the IEC for the DWR rainfall data. Accordingly, the second dataset comprised 71 landslide-triggering rainfall events and 2,083 non-triggering rainfall events. The non-triggering rainfall events in the second dataset were acquired in the same way as the non-triggering rainfall event in the first dataset. The locations of the landslides and rain stations reported in this study are mapped in Figure 1.
To assess the performance of the established thresholds, we considered a number of events related to correct and false threshold predictions, including the number of true positives (TP), true negatives (TN), false positives (FP), and false negatives (FN). Figure 3 presents the distributions of triggering rainfalls and non-triggering rainfalls, and correct and false threshold predictions for both types. The following skill scores were applied in this study:
The TPF, calculated according to equation (1), indicates the proportion of landslide-triggering rainfall events that were correctly predicted by the threshold. The TPF ranges from zero (0) at the poor end to one (1) at the good end.
(1)The FPF, calculated according to equation (2), indicates the proportion of non-triggering rainfall events that were predicted as triggering events by the threshold. The FPF ranges from zero (0) at the good end to one (1) at the poor end.
(2)The PPV, calculated according to equation (3), measures the fraction of forecasted events that were correctly predicted. The PPV ranges from zero (0) at the poor end to one (1) at the good end.
(3)The receiver operating characteristic (ROC) curve measures the goodness-of-fit and the prediction performance of the model [42]. The ROC was obtained by plotting the TPF and FPF for different susceptibility threshold values. An ideal prediction would be TPF = 1 and FPF = 0 (coordinate (0, 1)). The Euclidean distance, δ, was calculated between the point on the ROC curve that corresponded to the threshold and the ideal coordinate (0, 1). The value of δ indicates the performance of the prediction: the shorter the distance δ, the better the compromise prediction.
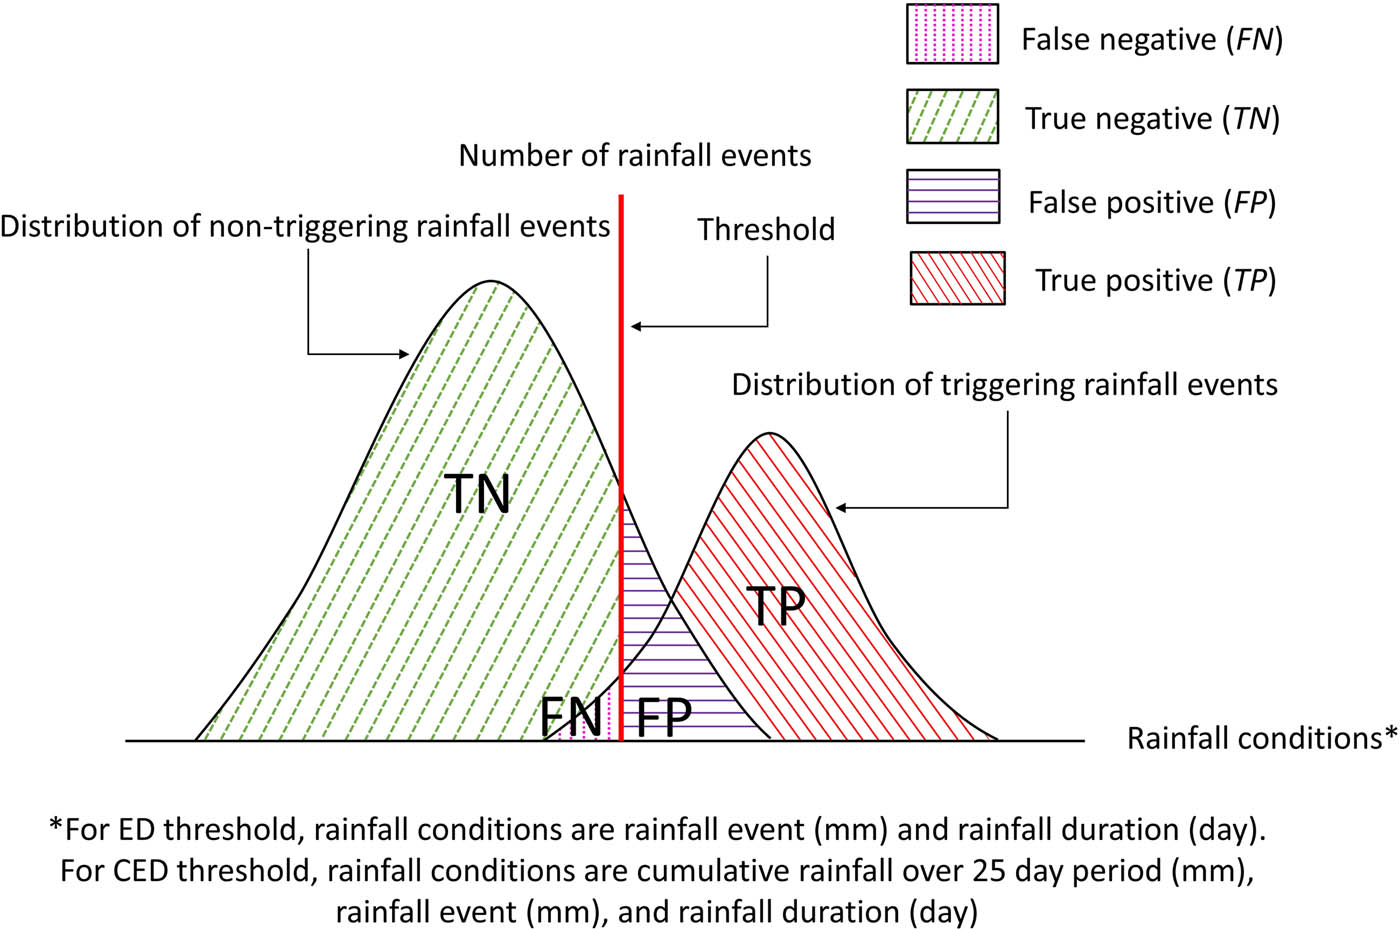
The distribution chart of landslide-triggering and non-triggering rainfall events and the threshold produced a contingency matrix comprising four scenarios: TP, TN, FP, and FN.
4 Results
4.1 Landslide rainfall thresholds
Landslide-triggering and non-triggering rainfall events from the first dataset (the TMD and RID datasets) were plotted on a double logarithmic scale as rainfall event (E, mm) vs rainfall duration (D, day) (Figure 4). The relationship between E and D was considered. Based on the observed relationship, two types of rainfall threshold were established: a positive-ED (EDP) threshold and a negative-ED (EDN) threshold. The EDP thresholds were established from triggering rainfall events, while the EDN thresholds were established from non-triggering rainfall events. Both EDP and EDN thresholds were defined based on the log-linear relationship between E and D expressed in equation (4).
where a and b are threshold parameters and Δa and Δb are the uncertainties of a and b. Using the above relationship, the ED thresholds gave a straight line in double logarithmic scale. Quantile regression [43] was employed to generate rainfall thresholds at various probabilistic levels using equation (4). Figure 5a presents the EDP thresholds generated at 5, 10, 15, 20, 30, 50, 75, 90, and 95% exceedance probabilities. The corresponding threshold parameters and the uncertainty of the threshold parameters at each probabilistic level are given in Table 1. Note that these exceedance probabilities indicate the probabilities of a missing alarm being produced. Figure 5b presents the EDN thresholds generated at 5, 10, 15, 20, 30, 50, 75, 90, and 95% non-exceedance probabilities. Table 1 also gives the corresponding threshold parameters and the uncertainty of the threshold parameters at each probabilistic level. Also note that these non-exceedance probabilities indicate the probabilities of a false alarm being produced. Due to the greater amount of rainfall data available for non-triggering rainfall events, the uncertainty of the EDN threshold parameters is lower than the uncertainty of the EDP threshold parameters. These results are consistent with previously reported findings [28,32]. Furthermore, higher parameter uncertainties were found at the high E–D level for both positive and negative thresholds. It should be noted that the distribution of rainfall data points plotted in the E vs D plane was not uniform. For example, the data points at the upper part of the E vs D plot of triggering landslides were less dense than that at the lower part. We inferred that the difference in parameter uncertainty at the high E vs D level could be attributed to the non-uniform distribution of the rainfall data points in the E–D plane and that this non-uniformity cannot be ignored particularly when assigning rainfall threshold at high E–D level.

The scatter plot, in double logarithmic scale, shows the ED plane of 48 landslide-triggering rainfall events (red circles) and 1,843 non-triggering events (green circles).

The ED threshold was determined at various probability levels using quantile regression. Based on 48 landslide-triggering rainfall events, (a) presents EDP thresholds at nine exceedance probabilities (P). (b) Presents, based on 1,843 non-triggering events, EDN thresholds at nine non-exceedance probabilities (NP).
Threshold parameters a and b and their uncertainties for EDP and EDN thresholds
| EDP thresholds | EDN thresholds | ||||||||||||||
|---|---|---|---|---|---|---|---|---|---|---|---|---|---|---|---|
| Threshold parameters | Threshold parameters | ||||||||||||||
| a | Δa | Δa/a (%) | B | Δb | Δb/b (%) | a | Δa | Δa/a (%) | b | Δb | Δb/b (%) | ||||
| Probabilistic levels (%) | 5 | 0.841 | 0.102 | 12 | 1.320 | 0.174 | 13 | Probabilistic levels (%) | 95 | 1.656 | 0.045 | 3 | 0.571 | 0.133 | 23 |
| 10 | 0.950 | 0.203 | 21 | 1.243 | 0.348 | 28 | 90 | 1.450 | 0.035 | 2 | 0.798 | 0.101 | 13 | ||
| 15 | 0.955 | 0.171 | 18 | 1.361 | 0.294 | 22 | 75 | 1.381 | 0.028 | 2 | 0.800 | 0.083 | 10 | ||
| 20 | 1.023 | 0.174 | 17 | 1.295 | 0.298 | 23 | 50 | 1.305 | 0.027 | 2 | 0.855 | 0.079 | 9 | ||
| 30 | 1.175 | 0.185 | 16 | 1.179 | 0.317 | 27 | 30 | 1.204 | 0.022 | 2 | 0.932 | 0.317 | 34 | ||
| 50 | 1.426 | 0.164 | 12 | 0.988 | 0.282 | 29 | 20 | 1.016 | 0.019 | 2 | 1.068 | 0.057 | 5 | ||
| 75 | 1.655 | 0.199 | 12 | 0.954 | 0.34 | 36 | 15 | 0.845 | 0.018 | 2 | 1.161 | 0.052 | 4 | ||
| 90 | 1.668 | 0.393 | 24 | 1.187 | 0.673 | 57 | 10 | 0.741 | 0.012 | 2 | 1.110 | 0.034 | 3 | ||
| 95 | 1.925 | 0.476 | 25 | 0.879 | 0.816 | 93 | 5 | 0.717 | 0.006 | 1 | 1.072 | 0.016 | 1 | ||
Note: These parameters were read from quantile regression at nine exceedance probabilities of a missed alarm for the EDP thresholds and nine non-exceedance probabilities of a false alarm for the EDN thresholds.
Number of scholars reported that both event and antecedent rainfalls influence slope stability [44,45,46,47,48]. To account for antecedent rainfall events, the relation between the rainfall on a failure day (DRf) is plotted in Figure 6 against CR prior to the failure day over six different periods. A 1:1 line was drawn to divide the plots into two groups: those with a bias toward DRf and those with a bias toward CR. From 48 landslide-triggering rainfall events, the number of biases toward CR were 34, 35, 40, 42, 42, and 46 when the periods of CR were 3, 5, 10, 15, 20, and 25 days, respectively. Since the number of biases toward CR was highest for a 25-day CR period prior to the failure day, CR25 was considered the most suitable threshold variable for landslides in the study area.
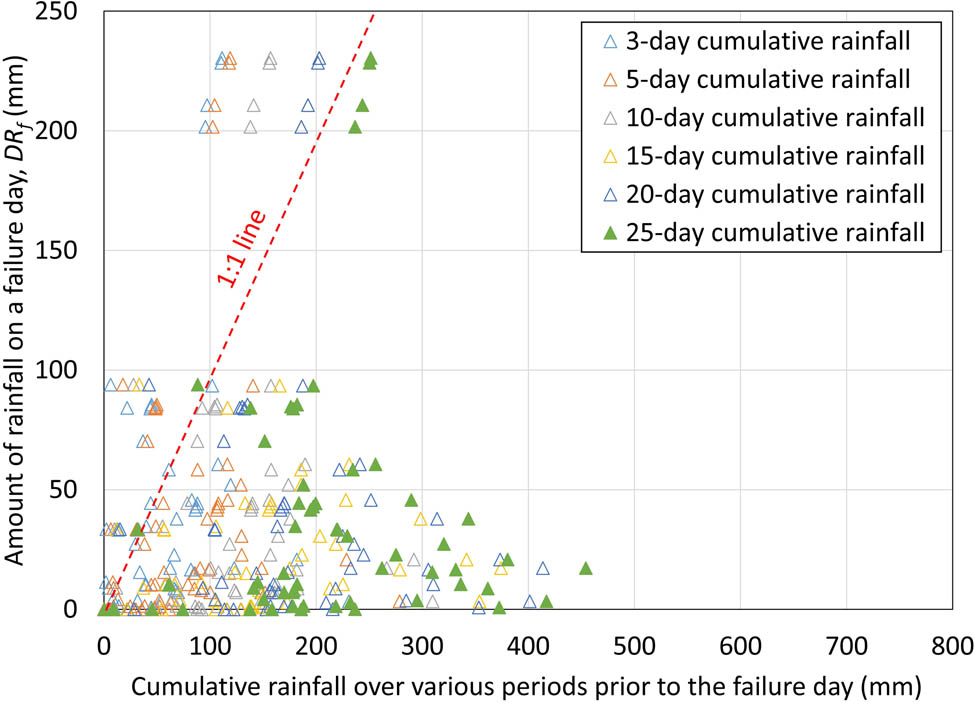
Rainfall depth on a failure day is plotted against various CR depths before the failure day.
To determine the threshold value of CR25 for both triggering and non-triggering events, the frequency distribution of the intensity of CR25 was plotted based on intensity intervals of 20 mm. Distributions were plotted for 48 landslide-triggering rainfall events and 1,834 non-triggering rainfall events (Figure 7a and b). Using a CR25 threshold of 130 mm, only 6.25% of the triggering rainfalls (3 events out of 48) would not produce a required alarm and only 5% (95 events out of 1,843) of the non-triggering rainfalls would produce a false alarm.

The charts show the distribution of CR (in mm) over a 25-day period prior to a failure day (CR25) for (a) 48 landslide-triggering rainfall events, and (b) 1,834 non-triggering rainfall events.
The CR25 of 130 mm was then integrated into the EDP and EDN thresholds, to give an appropriate CEDP and an appropriate CEDN. The CEDP and CEDN thresholds are applied as follows:
The CR25 is assessed.
Any rainfall event preceded by a CR25 lower than 130 mm will be ignored.
Only rainfall events preceded by a CR25 of 130 mm or more will be fitted to the ED threshold model.
If the rainfall event yields a rainfall depth and duration above the ED threshold, the landslide warning will be activated.
4.2 Assessment of the thresholds
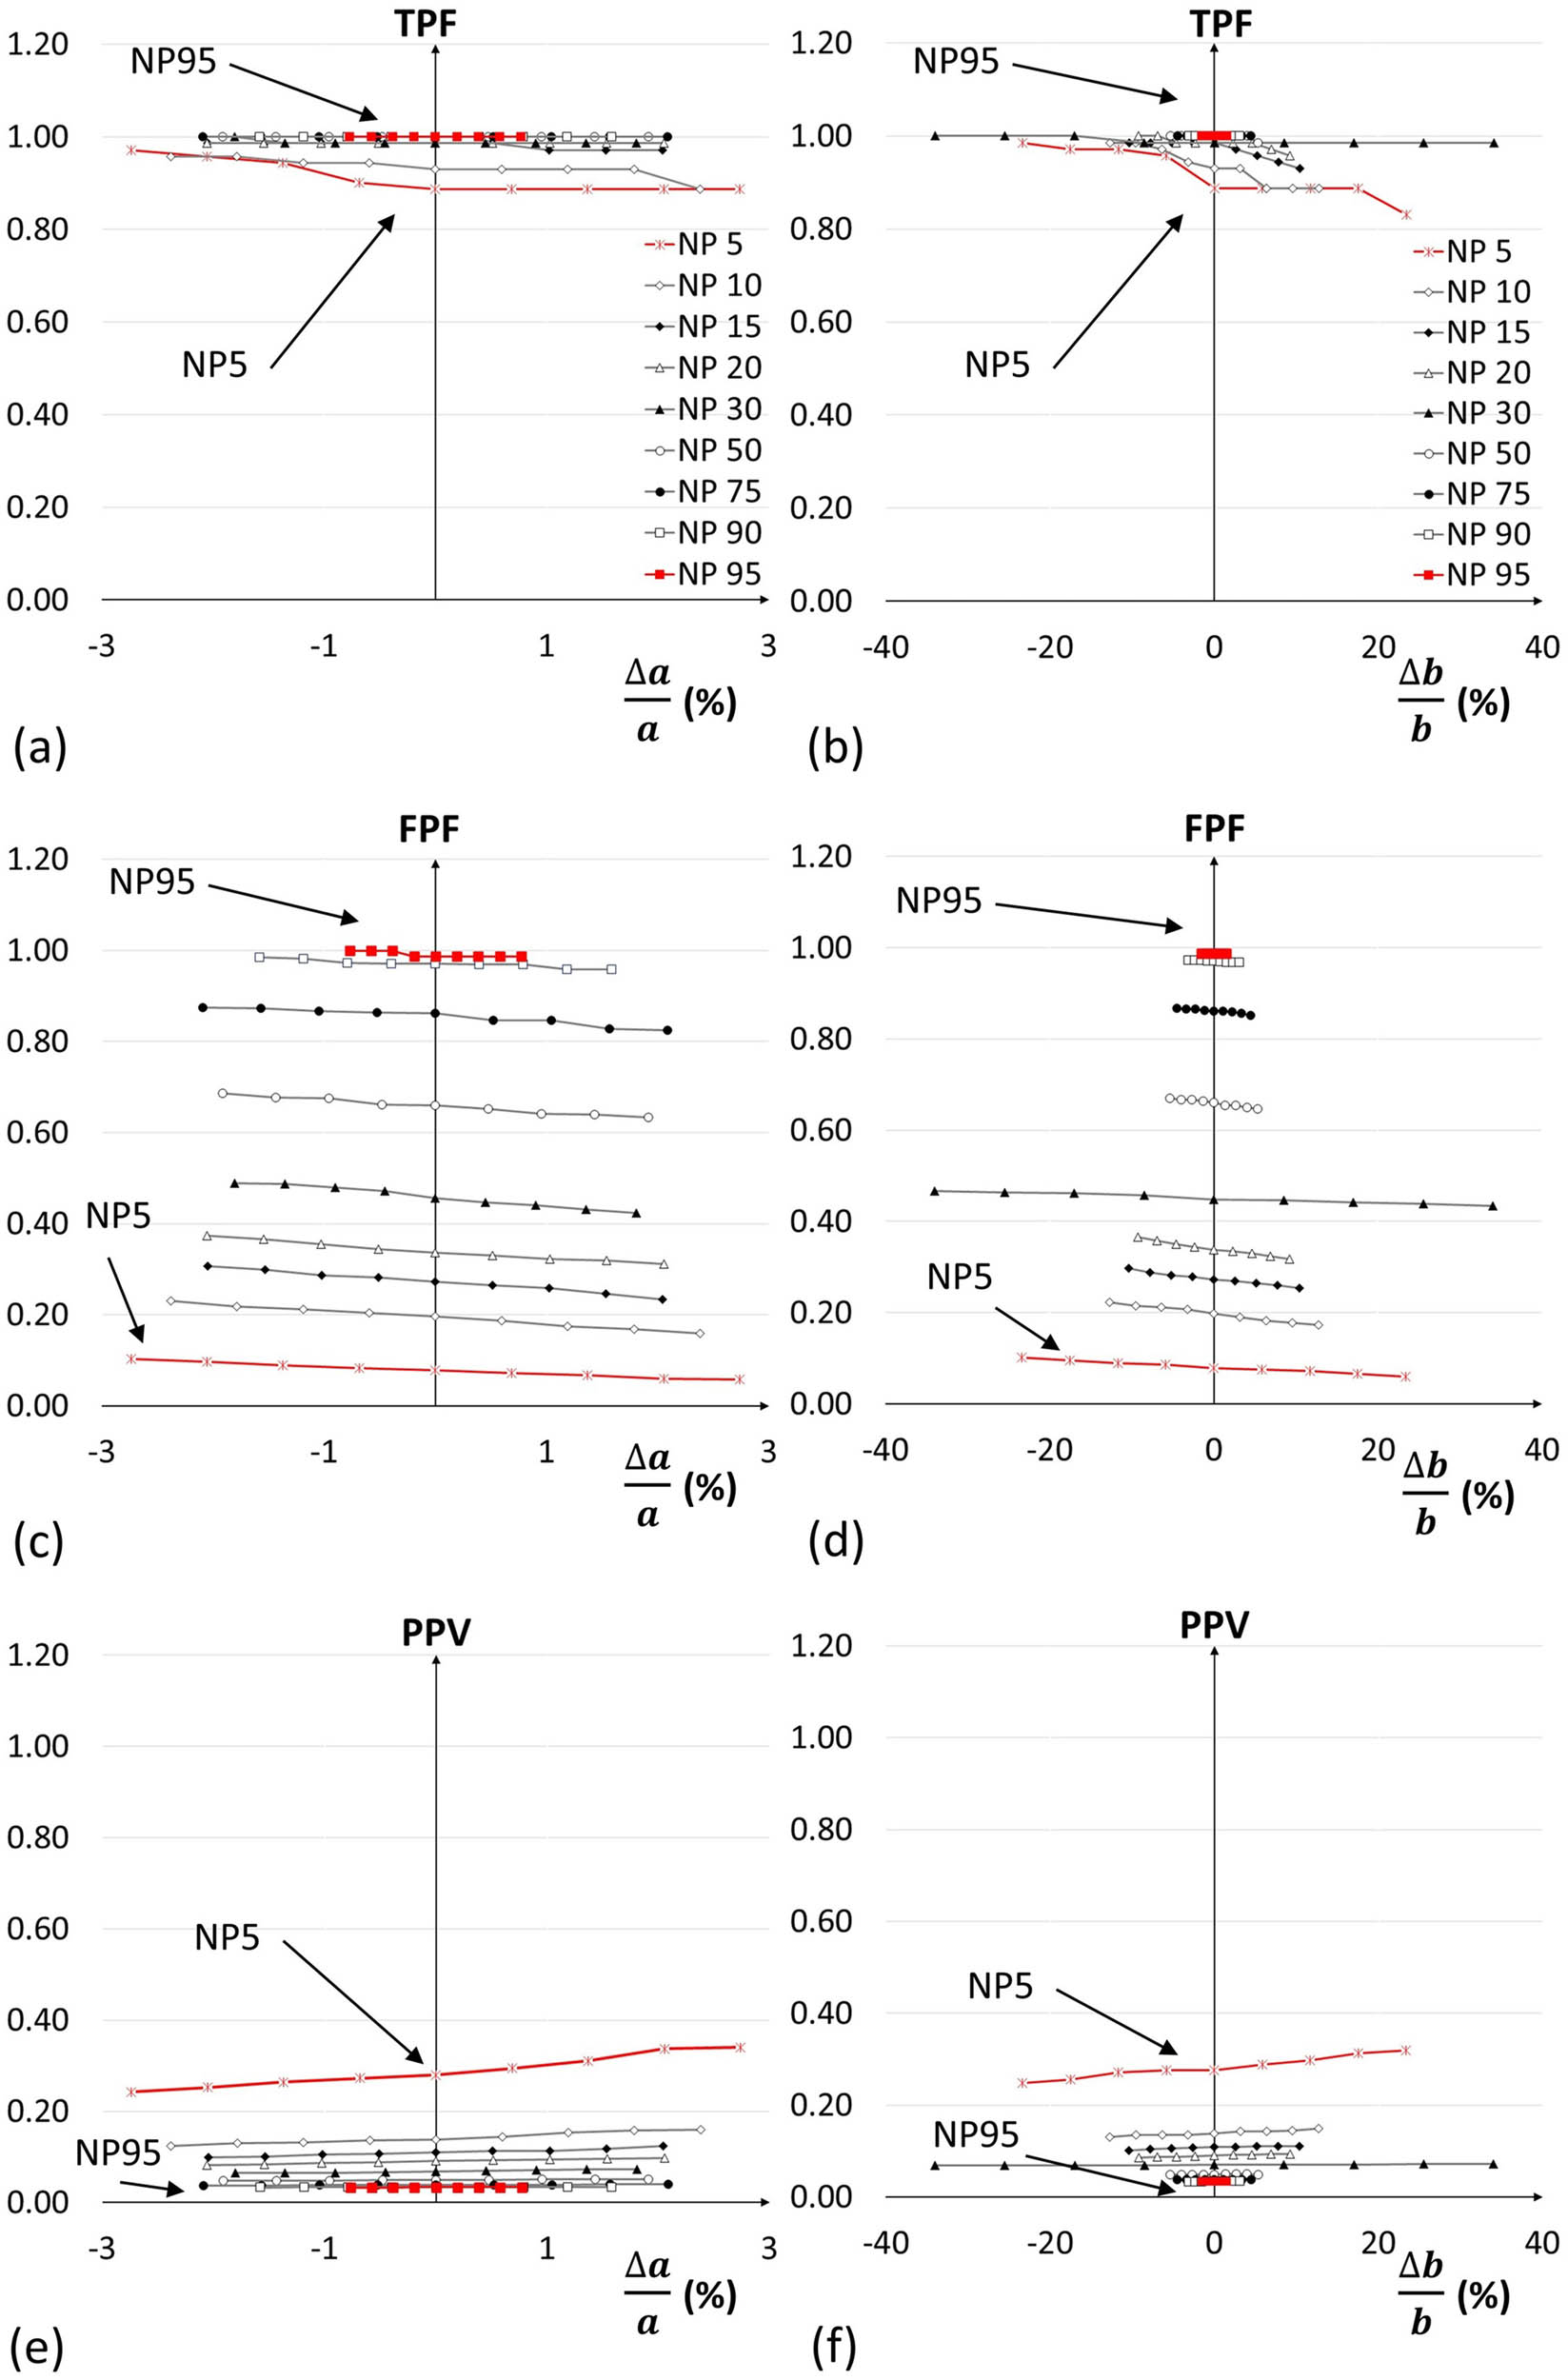
The performances of the established EDP, EDN, CEDP, and CEDN thresholds were assessed by evaluating TPF, FPF, and PPV. Figures 8–11 present the variation in TPF, FPF, and PPV scores returned from the four established thresholds over probabilistic levels from 5 to 95%, and over the parameter uncertainty ranges (from −∆a/a to +∆a/a and from −∆b/b to +∆b/b). The variation in each skill score over the full range of probabilistic levels can be measured along the y-axis (at Δa/a = 0 or Δb/b = 0). At every probabilistic level, the variation in each skill score over the parameter uncertainty ranges is equal to the vertical distance of the skill scores read from the right end through the left end of the plot.
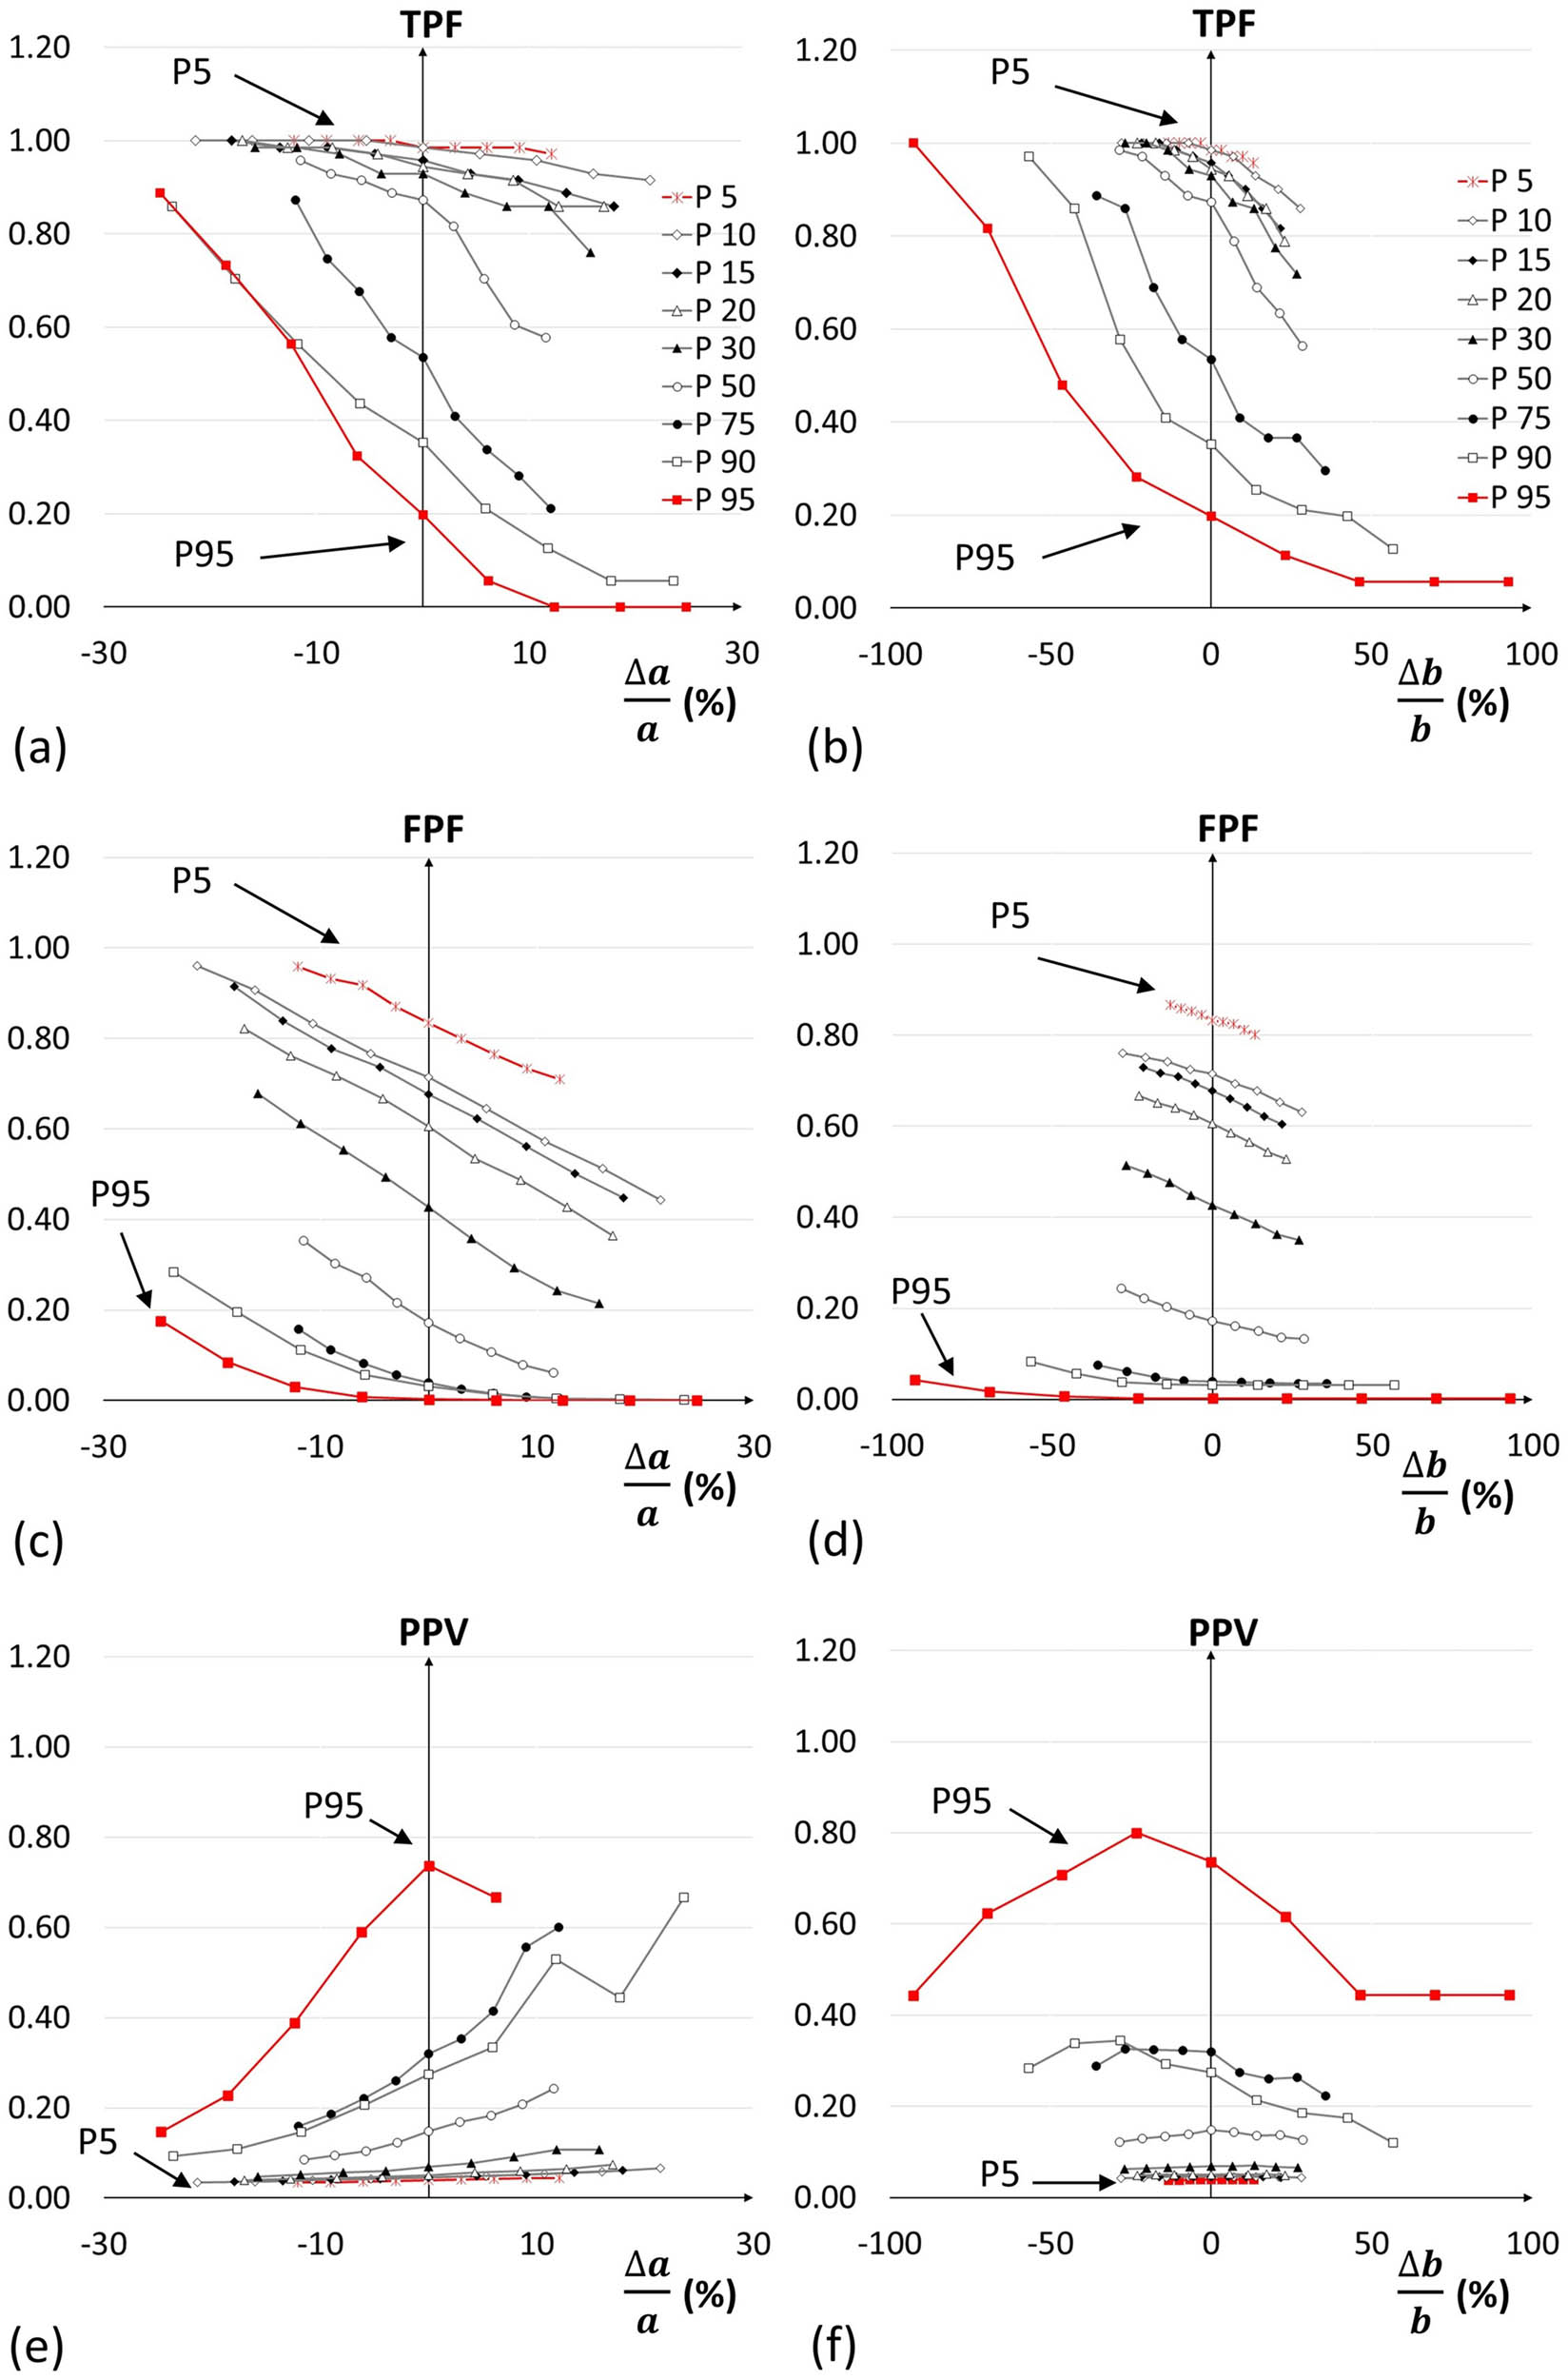
The EDP thresholds returned variations in three skill scores over nine exceedance probabilities and over the range of uncertainty of threshold parameters a and b. The charts show the variation at all probability levels for threshold parameters a and b in the TPF ((a) and (b), respectively), the FPF ((c) and (d), respectively), and the PPV ((e) and (f), respectively).

The EDN thresholds returned variations in three skill scores over nine exceedance probabilities and over the range of uncertainty of threshold parameters a and b. The charts show the variation at all probability levels for threshold parameters a and b in the TPF ((a) and (b), respectively), the FPF ((c) and (d), respectively), and the PPV ((e) and (f), respectively).

The charts show the variations in the TPF ((a) and (b)), FPF ((c) and (d)), and PPV ((e) and (f)) returned from CEDP thresholds over nine exceedance probabilities and over the range of uncertainty of threshold parameters a, and b.
The charts show the variations in the TPF ((a) and (b)), FPF ((c) and (d)), and PPV ((e) and (f)) returned from C-EDN thresholds over nine exceedance probabilities and the range of uncertainty of threshold parameters a and b.
The performance of the EDP is presented in Figure 8. The EDP threshold returned a wide variation in TPF (from 0.20 to 0.99) over the full range of exceedance probabilities. Over both parameter uncertainty ranges, the EDP threshold yielded a small variation in TPF at low probabilistic levels, but a greater variation at higher probabilistic levels. The EDP threshold also returned a wide variation in FPF (from 0.00 to 0.83) over the full range of probabilistic levels. At every probabilistic level, the EDP threshold returned a moderate variation in FPF over both parameter uncertainty ranges. Over the full range of probabilistic levels, the EDP threshold returned a wide variation in PPV (from 0.04 to 0.74). However, a significant improvement in PPV was found when the probabilistic level increased from 90 to 95%. At probabilistic levels below 95%, the PPV score was never greater than 0.32. Over both parameter uncertainty ranges, the variation in PPV was small at low probabilistic levels and became greater at higher probabilistic levels.
The performance of the EDN threshold is presented in Figure 9. This threshold returned a narrow variation in TPF over the full range of non-exceedance probabilities. The lowest TPF score returned from the EDN threshold was 0.89 at 5% probabilistic level. Over both parameter uncertainty ranges, the variation in TPF was also narrow. The FPF scores from the EDN threshold were distributed widely (from 0.08 to 0.99) over the full range of probabilistic levels. However, the variation in FPF over both parameter uncertainty ranges was low for every probabilistic level. Over the full range of probabilistic levels, the EDN threshold returned PPV scores from 0.03 to 0.28. Over both parameter uncertainty ranges, the variation in PPV was low at every probabilistic level. A significant improvement in PPV was found when the probabilistic level fell from 10 to 5%.
The performance of the CEDP is presented in Figure 10. The CEDP threshold was applied by removing rainfall events that had a CR25 lower than 130 mm before applying the EDP threshold. The variations in TPF and PPV scores over the full range of probabilistic levels and the variations in TPF, FPF, and PPV scores over both parameter uncertainty ranges produced by the CEDP threshold are similar to that produced by the EDP threshold. Compared with the EDP threshold, the CEDP threshold provided a significant improvement in the FPF score, which did not exceed 0.35 (compared to 0.83 from the EDP threshold).
Figure 11 presents the variations in TPF, FPF, and PPV returned from the CEDN threshold. The variations in TPF and PPV over the full range of probabilistic levels and variations and the variations in TPF, FPF, and PPV over both parameter uncertainty ranges produced by the CEDN threshold are similar to that produced by the EDN threshold. The CEDN threshold also provided a significant improvement in the FPF score, which did not exceed 0.41 (compared with 0.99 from the EDN threshold).
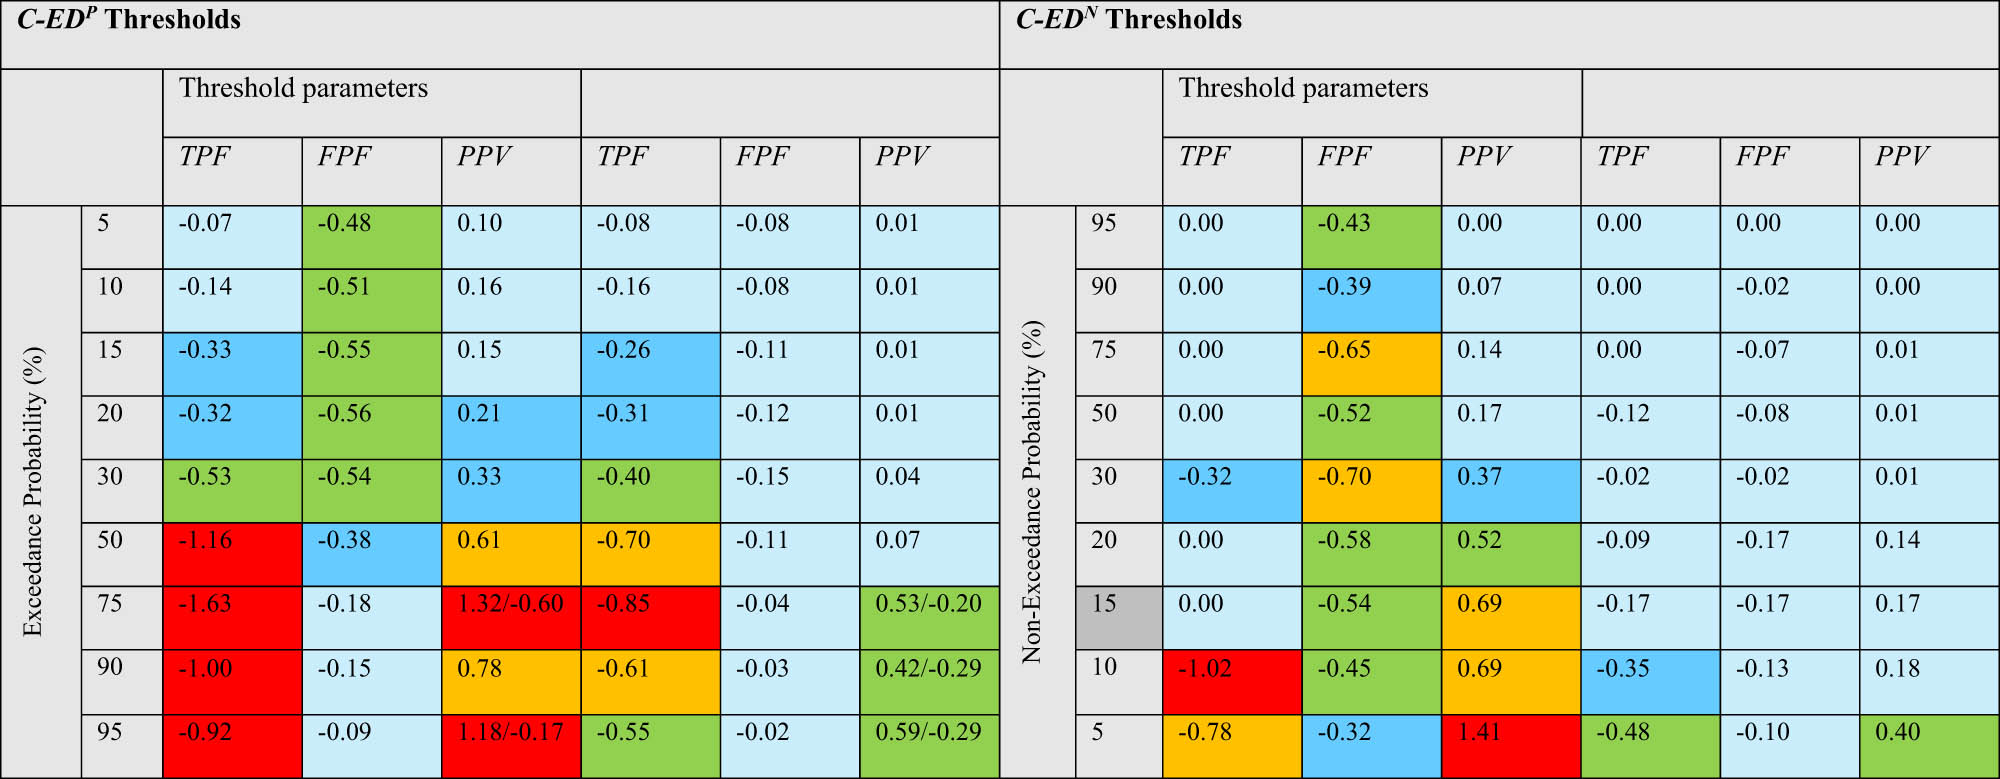
The effects of the threshold parameters on the skill scores (TPF, FPF, and PPV) returned from the established thresholds were analyzed through a sensitivity analysis. In this study, we focused on the skill scores returned from both CED thresholds. The sensitivity scores returned by the threshold parameters for TPF, FPF, and PPV at every probabilistic level are presented in Table 2. At every probabilistic level, the sensitivity score for each skill was calculated from the change in the skill score over the full uncertainty range of both parameters per unit change in the threshold parameter. The change in each skill score at any probabilistic level was read from Figures 10 and 11. If the variation in a skill score produced a concave line, as for PPV at the probabilistic level of 95% in Figure 10e and f, the sensitivity of that skill score would be calculated from the difference between the maximum and minimum values read from both ends of the curve and the calculations from both ends were reported. Based on an absolute value of sensitivity, we ranked sensitivity at five levels: (1) a score less than 0.20 indicated negligible to slight sensitivity; (2) a score from 0.20 to 0.39 indicated moderate sensitivity; (3) a score from 0.40 to 0.59 indicated high sensitivity; (4) a score from 0.60 to 0.79 indicated very high sensitivity; and (5) a score equal to or greater than 0.80 indicated extremely high sensitivity.
Sensitivity of skill scores to the change in the model parameters a and b provided from the CEDP and CEDN thresholds
 |
Note: Based on an absolute value of sensitivity, we ranked sensitivity at five levels: (1) a score less than 0.20  indicated negligible to light sensitivity; (2) a score of 0.20–0.39
  indicated moderate sensitivity; (3) a score of 0.40–0.59
  indicated high sensitivity; (4) a score of 0.60–0.79
  indicated very high sensitivity; (5) a score equal to or greater than 0.80
  indicated extremely high sensitivity.
In general, the skill scores from both thresholds were more sensitive to threshold parameter a than parameter b. The skill scores from the CEDN threshold were less sensitive than those from the CEDP threshold. Among the skill scores returned from CEDP threshold, the TPF score was the most sensitive. At high probabilistic levels, the sensitivity of the PPV score from the CEDP threshold was high to extremely high. At low to moderate probabilistic levels, the sensitivity of the FPF score from the CEDP threshold was very high to the change in threshold parameter a.
From the CEDN threshold, the sensitivity of skill scores to threshold parameter b was mostly negligible to light (cf. Table 2). The sensitivity of the FPF score from the CEDN threshold was high to very high to the change in threshold parameter a at almost all probabilistic levels. At low probabilistic levels, the sensitivity of TPF and PPV scores from the CEDN threshold was very high to extremely high to the change in threshold parameter a.
5 Discussion
The highest TPF scores returned by the EDP and EDN thresholds were 0.99 and 1.00, respectively. However, the other TPF scores returned by the EDN threshold were significantly better than the TPF scores returned by the EDP threshold. The lowest TPF score returned from the EDN threshold was 0.89 compared to the lowest TPF score of 0.20 from the EDP threshold. Because the EDN threshold was applied to rainfall events of low intensity, high TPF scores were produced at every probabilistic level. The EDP threshold provided better FPF and PPV scores than the EDN threshold, but the most desirable threshold should return high TPF with low FPF scores. Figure 12a presents ROC curves representing the variation, at various probabilistic levels, in TPF against FPF obtained from the EDP and the EDN thresholds. A perfect prediction lies at the coordinate point (0, 1) that yields TPF = 1 and FPF = 0. Based on Euclidean distances, the best compromise predictions were obtained from the EDP threshold at a 50% exceedance probability and from the EDN threshold at a 5% non-exceedance probability. For these two compromise predictions, the Euclidean distance indicated that the EDN threshold outperformed the EDP threshold. Furthermore, in terms of variations in skill scores over the parameter uncertainty ranges, the EDN threshold again outperformed the EDP threshold.
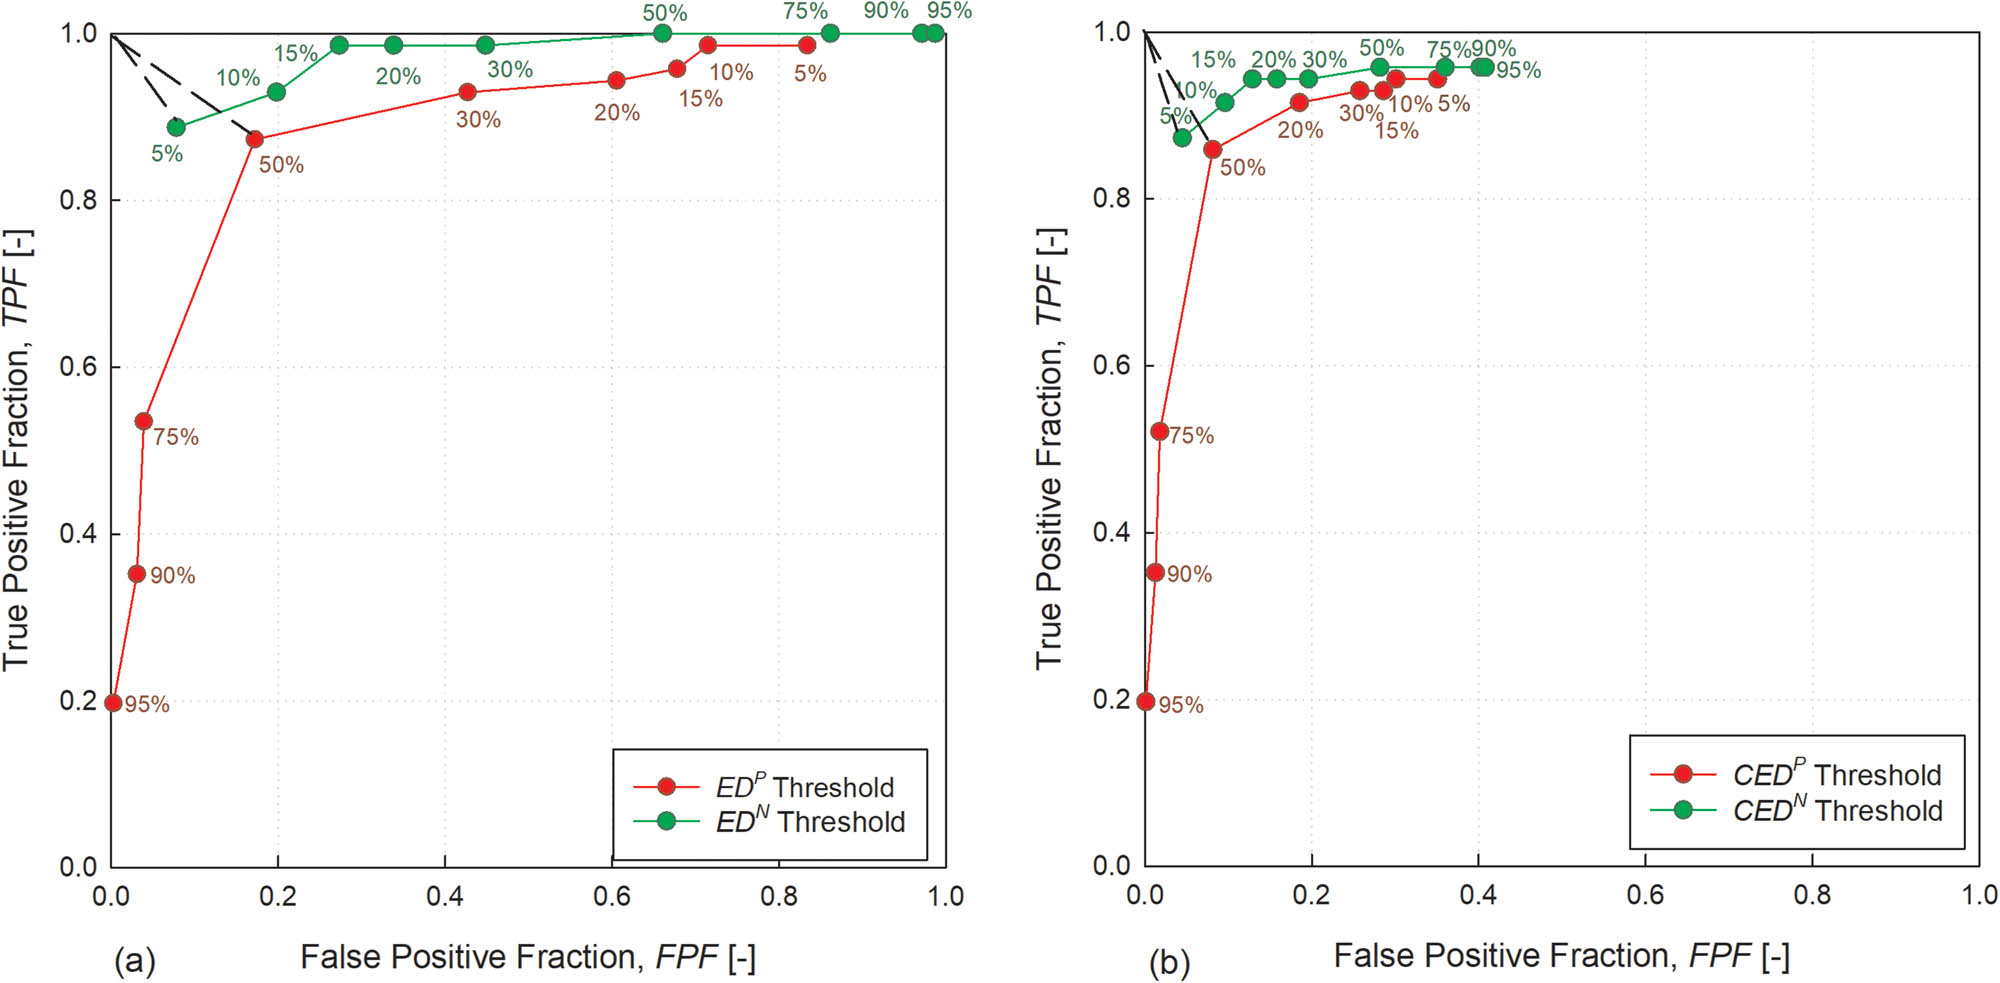
ROC curves. (a) ROC curves were generated from the EDP threshold (red line) and the EDN threshold (green line). (b) ROC curves were generated from the CEDP threshold (red line) and the CEDN threshold (green line).
The highest TPF scores provided by the CEDP and CEDN thresholds were a little lower than highest TPF scores provided by the ED thresholds. We explained that removing rainfall events with a CR25 lower than 130 mm before applying the ED threshold might produce missed alarms for a few triggering rainfalls preceded by a CR25 lower than 130 mm, which was reflected by the higher TPF scores. Again, other than the highest scores, the other TPF scores returned by the CEDN threshold were significantly better than TPF scores from the CEDP threshold. Applying a CR25 of 130 mm to the model, the performance of the CED thresholds improved significantly compared to the ED thresholds in terms of FPF scores. The highest FPF scores given from the CEDP and CEDN thresholds were, respectively, 0.35 and 0.41. These scores compared favorably with the highest FPF scores of 0.83 and 0.99 from the EDP and EDN thresholds, respectively. Again, FPF and PPV scores from the CEDP threshold were preferable to those from the CEDN threshold. However, the superior TPF score provided by the CEDN threshold gave the best compromise prediction on the ROC curve. Figure 12b presents ROC curves generated by the CEDP and CEDN thresholds. The best compromise predictions were obtained at a 50% exceedance probability for the CEDP threshold and at a 5% non-exceedance probability for the CEDN threshold. The Euclidean distances indicated that the CEDN threshold provided a better compromise between TPF and FPF scores than the CEDP threshold, which is in accordance with the findings of previous works [28,32]. The advantage is that the CEDN threshold gained from the larger dataset produced significantly lower uncertainties than the CEDP threshold produced. Sensitivity analysis also revealed that the skill scores returned from the CEDN threshold were less sensitive to the change in the threshold parameters than the skill scores from the CEDP threshold.
The sensitivity analysis also showed that, at the best compromise predictions for the CEDP- (50% exceedance probability) and CEDN- (5% non-exceedance probability) thresholds, the sensitivity of the TPF and PPV to change in the threshold parameters was very high to extremely high. Since TPF is a vital parameter for effective LEWSs, we should focus on the levels where the sensitivity of TPF is not very high. Hence, when implementing the CED thresholds in at-risk areas where the correct prediction of the TPF is vital, the safest approach would be to apply the CEDP at an exceedance probability of 20% (TPF = 0.93 and FPF = 0.26) and the CEDN at a non-exceedance probability of 15% (TPF = 0.94 and FPF = 0.13).
6 Conclusion
Landslide-triggering and non-triggering rainfall events matching 59 landslides in Northern Thailand during 2002–2018 were used to establish positive and negative landslide rainfall thresholds. Cumulative rainfall of 130 mm over a 25-day period (CR25) was found to be a suitable threshold for both triggering and non-triggering rainfall events. The CR25 of 130 mm was integrated into the threshold, which was defined as the CED threshold. Once established, the positive and negative thresholds were assessed by inputting a different rainfall dataset associated with 71 landslides that occurred in Northern Thailand during 2017–2022. The parameters of the negative thresholds showed smaller uncertainty than the parameters of the positive thresholds. The FPF and PPV scores provided by the positive thresholds were preferable to the scores provided by the negative thresholds. However, the negative thresholds provided better compromise prediction between TPF and FPF scores. The inclusion of CR25 to both EDP and EDN thresholds produced a significant improvement in FPF and little improvement in PPV. Sensitivity analysis revealed that the skill scores from the CEDN threshold are less sensitive than those from the CEDP threshold. Furthermore, the sensitivity of the skill scores from both CEDP and CEDN thresholds were very high at the probabilistic levels on the upper part of the threshold bands (above a 50% exceedance probability for the CEDP or below a 50% non-exceedance probability for the CEDN threshold). The application of a rainfall threshold should be avoided if the probability level is associated with highly sensitive skill scores. Although the negative threshold outperformed the positive threshold in prediction performance and reliability, one must keep in mind that the negative threshold is established from non-landslide-triggering rainfall events. Attention must be paid to the use of these thresholds, which is recommended only for areas where landslide data are limited.
-
Funding information: This work was supported by a grant from Suranaree University of Technology.
-
Author contributions: Avirut Chinkulkijniwat: study design, analysis and interpretation of data, and writing the article. Rattana Salee: data collection and manipulation. Somjai Yubonchit: analysis of data and writing the article. Hai La Duong: writing the article. Suksun Horpibulsuk: interpretation of data. Menglim Hoy: interpretation of data.
-
Conflict of interest: On behalf of all the authors of this work, the corresponding author confirms that there is no conflict of interest to declare.
-
Data availability statement: Data will be made available on request.
References
[1] Shibuya S, Kawaguchi T, Chae J. Failure of reinforced earth as attacked by typhoon No. 23 in 2004. Soils Found. 2007;47:153–60. 10.3208/sandf.47.153.Search in Google Scholar
[2] Wong NH, Ho K. The 23 July 1994 landslide at Kwun Lung Lau, Hong Kong. Can Geotech J. 2011;34:825–40. 10.1139/t97-051.Search in Google Scholar
[3] Chinkulkijniwat A, Horpibulsuk S, Bui Van D, Udomchai A, Goodary R, Arulrajah A. Influential factors affecting drainage design considerations for mechanical stabilised earth walls using geocomposites. Geosynth Int. 2017;24(3):224–41. 10.1680/jgein.16.00027.Search in Google Scholar
[4] Ng CWW, Shi Q. A numerical investigation of the stability of unsaturated soil slopes subjected to transient seepage. Comput Geotech. 1998;22(1):1–28.10.1016/S0266-352X(97)00036-0Search in Google Scholar
[5] Rahardjo H, Li XW, Toll DG, Leong EC. The effect of antecedent rainfall on slope stability. In Unsaturated soil concepts and their application in geotechnical practice. Netherland: Springer; 2001. p. 371–99.10.1007/978-94-015-9775-3_8Search in Google Scholar
[6] Lee YS, Cheuk CY, Bolton MD. Instability caused by a seepage impediment in layered fill slopes. Can Geotech J. 2008;45(10):1410–25. 10.1139/T08-067.Search in Google Scholar
[7] Kim J, Jeong S, Kim Y, Lee KW. Proposal of design method for landslides considering antecedent rainfall and in-situ matric suction. J Korean Geotech Soc. 2013;29:11–24. 10.7843/kgs.2013.29.12.11.Search in Google Scholar
[8] Chinkulkijniwat A, Yubonchit S, Horpibulsuk S, Jeeptaku C, Arulrajah A. Hydrological responses and stability analysis of shallow slopes with cohesionless soil subjected to continuous rainfall. Can Geotech J. 2016;53(12):2001–13. 10.1139/cgj-2016-0143.Search in Google Scholar
[9] Yubonchit S, Chinkulkijniwat A, Horpibulsuk S, Jothityangkoon C, Arulrajah A, Suddeepong A. Influence factors involving rainfall-induced shallow slope failure: Numerical study. Int J Geomech. 2017;17(7):0000865. 10.1061/(ASCE)GM.1943-5622.0000865.Search in Google Scholar
[10] Chinkulkijniwat A, Tirametatiparat T, Supotayan C, Yubonchit S, Horpibulsuk S, Salee R, et al. Stability characteristics of shallow landslide triggered by rainfall. J Mt Sci. 2019;16:2171–83. 10.1007/s11629-019-5523-7.Search in Google Scholar
[11] Li Z, Yin Z. Failure pattern of dispersive soil slopes under the action of rainfall conditions. Alex Eng J. 2024;104:193–210. 10.1016/j.aej.2024.06.045.Search in Google Scholar
[12] Guzzetti F, Peruccacci S, Rossi M, Stark CP. Rainfall thresholds for the initiation of landslides in central and southern Europe. Meteorol Atmos Phys. 2007;98:239–67.10.1007/s00703-007-0262-7Search in Google Scholar
[13] Caine N. The rainfall intensity - Duration control of shallow landslides and debris flows. Geografiska Annaler: Ser A, Phys Geogr. 1980;62(1–2):23–7. 10.1080/04353676.1980.11879996.Search in Google Scholar
[14] Brunetti MT, Peruccacci S, Rossi M, Luciani S, Valigi D, Guzzetti F. Rainfall thresholds for the possible occurrence of landslides in Italy. Nat Hazards Earth Syst Sci,Sci. 2010;10(3):447–58. 10.5194/nhess10-447-2010.Search in Google Scholar
[15] Zhou W, Tang C, Van Asch TW, Zhou C. Rainfall-triggering response patterns of post-seismic debris flows in the Wenchuan earthquake area. Nat Hazards. 2014;70(2):1417–35. 10.1007/s11069-013-0883-8.Search in Google Scholar
[16] Vessia G, Parise M, Brunetti MT, Peruccacci S, Rossi M, Vennari C, et al. Automated reconstruction of rainfall events responsible for shallow landslides. Nat Hazards Earth Syst Sci. 2014;14:2399–408. 10.5194/nhess-14-2399-2014.Search in Google Scholar
[17] Gariano SL, Brunetti MT, Iovine G, Melillo M, Peruccacci S, Terranova O, et al. Calibration and validation of rainfall thresholds for shallow landslide forecasting in Sicily, southern Italy. Geomorphology. 2015;228:653–65. 10.1016/j.geomorph.2014.10.019.Search in Google Scholar
[18] Gariano SL, Melillo M, Peruccacci S, Brunetti MT. How much does the rainfall temporal resolution affect rainfall thresholds for landslide triggering? Nat Hazards. 2020;100:655–70. 10.1007/s11069-019-03830-x.Search in Google Scholar
[19] Pradhan AMS, Kang HS, Lee JS, Kim YT. An ensemble landslide hazard model incorporating rainfall threshold for Mt. Umyeon, South Korea. B Eng Geol Env. 2019;78:131–46. 10.1007/s10064-017-1055-y.Search in Google Scholar
[20] Glade T, Crozier MJ, Smith P. Applying probability determination to refine landslide-triggering rainfall thresholds using an empirical “Antecedent Daily Rainfall Model”. Pure Appl Geophys. 2000;157(6/8):1059–79.10.1007/s000240050017Search in Google Scholar
[21] Cardinali M, Galli M, Guzzetti F, Ardizzone F, Reichenbach P, Bartoccini P. Rainfall induced landslides in December 2004 in Southwestern Umbria, Central Italy. Nat Hazards Earth Syst. 2006;6:237–60.10.5194/nhess-6-237-2006Search in Google Scholar
[22] Osanai N, Shimizu T, Kuramoto K, Kojima S, Noro T. Japanese early-warning for debris flows and slope failures using rainfall indices with Radial Basis Function Network. Landslides. 2010;7:325–38.10.1007/s10346-010-0229-5Search in Google Scholar
[23] Jakob M, Weatherly H. A hydroclimatic threshold for landslide initiation on the North Shore Mountains of Vancouver, British Columbia. Geomorphology. 2003;54:137–56.10.1016/S0169-555X(02)00339-2Search in Google Scholar
[24] Thomas MA, Collins BD, Mirus BB. Assessing the feasibility of satellite-based thresholds for hydrologically driven landsliding. Water Resour Res. 2019;55:9023. 10.1029/2019WR025577.Search in Google Scholar
[25] Marino P, Peres DJ, Cancelliere A, Greco R, Bogaard TA. Soil moisture information can improve shallow landslide forecasting using the hydrometeorological threshold approach. Landslides. 2020;17:2041–54. 10.1007/s10346-020-01420-8.Search in Google Scholar
[26] Salee R, Chinkulkijniwat A, Yubonchit S, Wangfaoklang C, Soisompong S. New threshold for landslide warning in the southern part of Thailand integrates cumulative rainfall with event rainfall depth-duration. Nat Hazards. 2022;113:125–41. 10.1007/s11069-022-05292-0.Search in Google Scholar
[27] Chinkulkijniwat A, Salee R, Horpibulsuk S, Arulrajah A, Hoy M. Landslide rainfall threshold for landslide warning in Northern Thailand. Geomatics Nat Hazards Risk. 2022;13(1):2425–41. 10.1080/19475705.2022.2120833.Search in Google Scholar
[28] Peres DJ, Cancelliere A. Comparing methods for determining landslide early warning thresholds: Potential use of non-triggering rainfall for locations with scarce landslide data availability. Landslides. 2021;18:3135–47.10.1007/s10346-021-01704-7Search in Google Scholar
[29] Berti M, Martina MLV, Franceschini S, Pignone S, Simoni A, Pizziolo M. Probabilistic rainfall thresholds for landslide occurrence using a Bayesian approach. J Geophys Res Earth Surf. 2012;117:1–20. 10.1029/2012JF002367.Search in Google Scholar
[30] Staley DM, Kean JW, Cannon SH, Schmidt KM, Laber JL. Objective definition of rainfall intensity-duration thresholds for the initiation of post-fire debris flows in southern California. Landslides. 2013;10:547–62. 10.1007/s10346-012-0341-9.Search in Google Scholar
[31] Tien Bui D, Pradhan B, Lofman O, Revhaug I, Dick Ø. Regional prediction of landslide hazard using probability analysis of intense rainfall in the Hoa Binh province, Vietnam. Nat Hazards. 2013;66:707–30. 10.1007/s11069-012-0510-0.Search in Google Scholar
[32] Zhang S, Pecoraro G, Jiang Q, Calvello M. Definition of rainfall thresholds for landslides using unbalanced datasets: Two case studies in Shaanxi Province, China. Water. 2023;15(6):1058. 10.3390/w15061058.Search in Google Scholar
[33] Environmental Geology Division. A manual of landslide geo-hazard prevention and list of landslide risk villages of the north region of Thailand. Bangkok, Thailand: Department of Mineral Resources; 2003. p. 113 (in Thai).Search in Google Scholar
[34] Teerarungsigul S, Torizin J, Fuchs M, Kuhn F, Chonglakmani C. An integrative approach for regional landslide susceptibility assessment using weight of evidence method: A case study of Yom River Basin, Phrae province, Northern Thailand. Landslides. 2016;13(5):1151–65. 10.1007/s10346-015-0659-1.Search in Google Scholar
[35] Gentile M, Courbin F, Meylan G. Interpolating point spread function anisotropy. Astron Astrophys. 2012;549:A1. 10.1051/0004-6361/201219739.Search in Google Scholar
[36] Ditthakit P, Nakrod S, Viriyanantavong N, Tolche AD, Pham QB. Estimating baseflow and baseflow index in ungauged basins using spatial interpolation techniques: A case study of the Southern River Basin of Thailand. Water. 2021;13:3113. 10.3390/w13213113.Search in Google Scholar
[37] Kong YF, Tong WW. Spatial exploration and interpolation of the surface precipitation data. Geogr Res. 2008;27(5):1097–108.Search in Google Scholar
[38] Kurtzman D, Navon S, Morin E. Improving interpolation of daily precipitation for hydrologic modeling: spatial patterns of preferred interpolators. Hydrol Process. 2009;23:3281–329.10.1002/hyp.7442Search in Google Scholar
[39] Chen D, Ou T, Gong L, Xu CY, Li W, Ho CH, et al. Spatial Interpolation of Daily Precipitation in China: 1951-2005. Adv Atmos Sci. 2010;27:1221–32. 10.1007/s00376-010-9151-y.Search in Google Scholar
[40] Yang X, Xie X, Liu DL, Ji F, Wang L. Spatial interpolation of daily rainfall data for local climate impact assessment over Greater Sydney region. Adv Meteorol. 2015;2015:563629. 10.1155/2015/563629.Search in Google Scholar
[41] Bonta JV, Rao AR. Factors affecting the identification of independent storm events. J Hydrol. 1988;98(3–4):275–93. 10.1016/0022-1694(88)90018-2.Search in Google Scholar
[42] Fawcett T. An introduction to ROC analysis. Pattern Recognit Lett. 2006;27:861–74. 10.1016/j.patrec.2005.10.010.Search in Google Scholar
[43] Koenker R, Bassett G. Regression quantiles. Econometrica. 1978;46(1):33. 10.2307/1913643.Search in Google Scholar
[44] Rahardjo H, Melinda F, Leong EC, Rezaur RB. Stiffness of a compacted residual soil. Eng Geol. 2011;120(1–4):60–7. 10.1016/j.enggeo.2011.04.006.Search in Google Scholar
[45] Rahimi A, Rahardjo H, Leong EC. Effect of antecedent rainfall patterns on rainfall-induced slope failure. J Geotech Geoenviron Eng. 2011;137(5):483–91. 10.1061/(asce)gt.1943-5606.0000451.Search in Google Scholar
[46] Wicki A, Lehmann P, Hauck C, Seneviratne SI, Waldner P, Stähli M. Assessing the potential of soil moisture measurements for regional landslide early warning. Landslides. 2020;17:1881–96. 10.1007/s10346-020-01400-y.Search in Google Scholar
[47] Rosi A, Segoni S, Canavesi V, Monni A, Gallucci A, Casagli N. Definition of 3D rainfall thresholds to increase operative landslide early warning system performances. Landslides. 2021;18:1045–57. 10.1007/s10346-020-01523-2.Search in Google Scholar
[48] Yang W, Liu L, Shi P. Detecting precursors of an imminent landslide along the Jinsha River. Nat Hazards Earth Syst Sci. 2020;20:3215–24. 10.5194/nhess-20-3215-2020.Search in Google Scholar
© 2025 the author(s), published by De Gruyter
This work is licensed under the Creative Commons Attribution 4.0 International License.
Articles in the same Issue
- Research Articles
- Seismic response and damage model analysis of rocky slopes with weak interlayers
- Multi-scenario simulation and eco-environmental effect analysis of “Production–Living–Ecological space” based on PLUS model: A case study of Anyang City
- Remote sensing estimation of chlorophyll content in rape leaves in Weibei dryland region of China
- GIS-based frequency ratio and Shannon entropy modeling for landslide susceptibility mapping: A case study in Kundah Taluk, Nilgiris District, India
- Natural gas origin and accumulation of the Changxing–Feixianguan Formation in the Puguang area, China
- Spatial variations of shear-wave velocity anomaly derived from Love wave ambient noise seismic tomography along Lembang Fault (West Java, Indonesia)
- Evaluation of cumulative rainfall and rainfall event–duration threshold based on triggering and non-triggering rainfalls: Northern Thailand case
- Pixel and region-oriented classification of Sentinel-2 imagery to assess LULC dynamics and their climate impact in Nowshera, Pakistan
- The use of radar-optical remote sensing data and geographic information system–analytical hierarchy process–multicriteria decision analysis techniques for revealing groundwater recharge prospective zones in arid-semi arid lands
- Effect of pore throats on the reservoir quality of tight sandstone: A case study of the Yanchang Formation in the Zhidan area, Ordos Basin
- Hydroelectric simulation of the phreatic water response of mining cracked soil based on microbial solidification
- Spatial-temporal evolution of habitat quality in tropical monsoon climate region based on “pattern–process–quality” – a case study of Cambodia
- Early Permian to Middle Triassic Formation petroleum potentials of Sydney Basin, Australia: A geochemical analysis
- Micro-mechanism analysis of Zhongchuan loess liquefaction disaster induced by Jishishan M6.2 earthquake in 2023
- Prediction method of S-wave velocities in tight sandstone reservoirs – a case study of CO2 geological storage area in Ordos Basin
- Ecological restoration in valley area of semiarid region damaged by shallow buried coal seam mining
- Hydrocarbon-generating characteristics of Xujiahe coal-bearing source rocks in the continuous sedimentary environment of the Southwest Sichuan
- Hazard analysis of future surface displacements on active faults based on the recurrence interval of strong earthquakes
- Structural characterization of the Zalm district, West Saudi Arabia, using aeromagnetic data: An approach for gold mineral exploration
- Research on the variation in the Shields curve of silt initiation
- Reuse of agricultural drainage water and wastewater for crop irrigation in southeastern Algeria
- Assessing the effectiveness of utilizing low-cost inertial measurement unit sensors for producing as-built plans
- Analysis of the formation process of a natural fertilizer in the loess area
- Machine learning methods for landslide mapping studies: A comparative study of SVM and RF algorithms in the Oued Aoulai watershed (Morocco)
- Chemical dissolution and the source of salt efflorescence in weathering of sandstone cultural relics
- Molecular simulation of methane adsorption capacity in transitional shale – a case study of Longtan Formation shale in Southern Sichuan Basin, SW China
- Evolution characteristics of extreme maximum temperature events in Central China and adaptation strategies under different future warming scenarios
- Estimating Bowen ratio in local environment based on satellite imagery
- 3D fusion modeling of multi-scale geological structures based on subdivision-NURBS surfaces and stratigraphic sequence formalization
- Comparative analysis of machine learning algorithms in Google Earth Engine for urban land use dynamics in rapidly urbanizing South Asian cities
- Study on the mechanism of plant root influence on soil properties in expansive soil areas
- Simulation of seismic hazard parameters and earthquakes source mechanisms along the Red Sea rift, western Saudi Arabia
- Tectonics vs sedimentation in foredeep basins: A tale from the Oligo-Miocene Monte Falterona Formation (Northern Apennines, Italy)
- Investigation of landslide areas in Tokat-Almus road between Bakımlı-Almus by the PS-InSAR method (Türkiye)
- Predicting coastal variations in non-storm conditions with machine learning
- Cross-dimensional adaptivity research on a 3D earth observation data cube model
- Geochronology and geochemistry of late Paleozoic volcanic rocks in eastern Inner Mongolia and their geological significance
- Spatial and temporal evolution of land use and habitat quality in arid regions – a case of Northwest China
- Ground-penetrating radar imaging of subsurface karst features controlling water leakage across Wadi Namar dam, south Riyadh, Saudi Arabia
- Rayleigh wave dispersion inversion via modified sine cosine algorithm: Application to Hangzhou, China passive surface wave data
- Fractal insights into permeability control by pore structure in tight sandstone reservoirs, Heshui area, Ordos Basin
- Debris flow hazard characteristic and mitigation in Yusitong Gully, Hengduan Mountainous Region
- Research on community characteristics of vegetation restoration in hilly power engineering based on multi temporal remote sensing technology
- Identification of radial drainage networks based on topographic and geometric features
- Trace elements and melt inclusion in zircon within the Qunji porphyry Cu deposit: Application to the metallogenic potential of the reduced magma-hydrothermal system
- Pore, fracture characteristics and diagenetic evolution of medium-maturity marine shales from the Silurian Longmaxi Formation, NE Sichuan Basin, China
- Study of the earthquakes source parameters, site response, and path attenuation using P and S-waves spectral inversion, Aswan region, south Egypt
- Source of contamination and assessment of potential health risks of potentially toxic metal(loid)s in agricultural soil from Al Lith, Saudi Arabia
- Regional spatiotemporal evolution and influencing factors of rural construction areas in the Nanxi River Basin via GIS
- An efficient network for object detection in scale-imbalanced remote sensing images
- Effect of microscopic pore–throat structure heterogeneity on waterflooding seepage characteristics of tight sandstone reservoirs
- Environmental health risk assessment of Zn, Cd, Pb, Fe, and Co in coastal sediments of the southeastern Gulf of Aqaba
- A modified Hoek–Brown model considering softening effects and its applications
- Evaluation of engineering properties of soil for sustainable urban development
- The spatio-temporal characteristics and influencing factors of sustainable development in China’s provincial areas
- Application of a mixed additive and multiplicative random error model to generate DTM products from LiDAR data
- Gold vein mineralogy and oxygen isotopes of Wadi Abu Khusheiba, Jordan
- Prediction of surface deformation time series in closed mines based on LSTM and optimization algorithms
- 2D–3D Geological features collaborative identification of surrounding rock structural planes in hydraulic adit based on OC-AINet
- Spatiotemporal patterns and drivers of Chl-a in Chinese lakes between 1986 and 2023
- Land use classification through fusion of remote sensing images and multi-source data
- Nexus between renewable energy, technological innovation, and carbon dioxide emissions in Saudi Arabia
- Analysis of the spillover effects of green organic transformation on sustainable development in ethnic regions’ agriculture and animal husbandry
- Factors impacting spatial distribution of black and odorous water bodies in Hebei
- Large-scale shaking table tests on the liquefaction and deformation responses of an ultra-deep overburden
- Impacts of climate change and sea-level rise on the coastal geological environment of Quang Nam province, Vietnam
- Reservoir characterization and exploration potential of shale reservoir near denudation area: A case study of Ordovician–Silurian marine shale, China
- Seismic prediction of Permian volcanic rock reservoirs in Southwest Sichuan Basin
- Application of CBERS-04 IRS data to land surface temperature inversion: A case study based on Minqin arid area
- Geological characteristics and prospecting direction of Sanjiaoding gold mine in Saishiteng area
- Research on the deformation prediction model of surrounding rock based on SSA-VMD-GRU
- Geochronology, geochemical characteristics, and tectonic significance of the granites, Menghewula, Southern Great Xing’an range
- Hazard classification of active faults in Yunnan base on probabilistic seismic hazard assessment
- Characteristics analysis of hydrate reservoirs with different geological structures developed by vertical well depressurization
- Estimating the travel distance of channelized rock avalanches using genetic programming method
- Landscape preferences of hikers in Three Parallel Rivers Region and its adjacent regions by content analysis of user-generated photography
- New age constraints of the LGM onset in the Bohemian Forest – Central Europe
- Characteristics of geological evolution based on the multifractal singularity theory: A case study of Heyu granite and Mesozoic tectonics
- Soil water content and longitudinal microbiota distribution in disturbed areas of tower foundations of power transmission and transformation projects
- Oil accumulation process of the Kongdian reservoir in the deep subsag zone of the Cangdong Sag, Bohai Bay Basin, China
- Investigation of velocity profile in rock–ice avalanche by particle image velocimetry measurement
- Optimizing 3D seismic survey geometries using ray tracing and illumination modeling: A case study from Penobscot field
- Sedimentology of the Phra That and Pha Daeng Formations: A preliminary evaluation of geological CO2 storage potential in the Lampang Basin, Thailand
- Improved classification algorithm for hyperspectral remote sensing images based on the hybrid spectral network model
- Map analysis of soil erodibility rates and gully erosion sites in Anambra State, South Eastern Nigeria
- Identification and driving mechanism of land use conflict in China’s South-North transition zone: A case study of Huaihe River Basin
- Evaluation of the impact of land-use change on earthquake risk distribution in different periods: An empirical analysis from Sichuan Province
- A test site case study on the long-term behavior of geotextile tubes
- An experimental investigation into carbon dioxide flooding and rock dissolution in low-permeability reservoirs of the South China Sea
- Detection and semi-quantitative analysis of naphthenic acids in coal and gangue from mining areas in China
- Comparative effects of olivine and sand on KOH-treated clayey soil
- YOLO-MC: An algorithm for early forest fire recognition based on drone image
- Earthquake building damage classification based on full suite of Sentinel-1 features
- Potential landslide detection and influencing factors analysis in the upper Yellow River based on SBAS-InSAR technology
- Assessing green area changes in Najran City, Saudi Arabia (2013–2022) using hybrid deep learning techniques
- An advanced approach integrating methods to estimate hydraulic conductivity of different soil types supported by a machine learning model
- Hybrid methods for land use and land cover classification using remote sensing and combined spectral feature extraction: A case study of Najran City, KSA
- Streamlining digital elevation model construction from historical aerial photographs: The impact of reference elevation data on spatial accuracy
- Analysis of urban expansion patterns in the Yangtze River Delta based on the fusion impervious surfaces dataset
- A metaverse-based visual analysis approach for 3D reservoir models
- Late Quaternary record of 100 ka depositional cycles on the Larache shelf (NW Morocco)
- Integrated well-seismic analysis of sedimentary facies distribution: A case study from the Mesoproterozoic, Ordos Basin, China
- Study on the spatial equilibrium of cultural and tourism resources in Macao, China
- Urban road surface condition detecting and integrating based on the mobile sensing framework with multi-modal sensors
- Application of improved sine cosine algorithm with chaotic mapping and novel updating methods for joint inversion of resistivity and surface wave data
- The synergistic use of AHP and GIS to assess factors driving forest fire potential in a peat swamp forest in Thailand
- Dynamic response analysis and comprehensive evaluation of cement-improved aeolian sand roadbed
- Rock control on evolution of Khorat Cuesta, Khorat UNESCO Geopark, Northeastern Thailand
- Gradient response mechanism of carbon storage: Spatiotemporal analysis of economic-ecological dimensions based on hybrid machine learning
- Comparison of several seismic active earth pressure calculation methods for retaining structures
- Mantle dynamics and petrogenesis of Gomer basalts in the Northwestern Ethiopia: A geochemical perspective
- Study on ground deformation monitoring in Xiong’an New Area from 2021 to 2023 based on DS-InSAR
- Paleoenvironmental characteristics of continental shale and its significance to organic matter enrichment: Taking the fifth member of Xujiahe Formation in Tianfu area of Sichuan Basin as an example
- Equipping the integral approach with generalized least squares to reconstruct relict channel profile and its usage in the Shanxi Rift, northern China
- InSAR-driven landslide hazard assessment along highways in hilly regions: A case-based validation approach
- Attribution analysis of multi-temporal scale surface streamflow changes in the Ganjiang River based on a multi-temporal Budyko framework
- Maps analysis of Najran City, Saudi Arabia to enhance agricultural development using hybrid system of ANN and multi-CNN models
- Hybrid deep learning with a random forest system for sustainable agricultural land cover classification using DEM in Najran, Saudi Arabia
- Long-term evolution patterns of groundwater depth and lagged response to precipitation in a complex aquifer system: Insights from Huaibei Region, China
- Remote sensing and machine learning for lithology and mineral detection in NW, Pakistan
- Spatial–temporal variations of NO2 pollution in Shandong Province based on Sentinel-5P satellite data and influencing factors
- Numerical modeling of geothermal energy piles with sensitivity and parameter variation analysis of a case study
- Stability analysis of valley-type upstream tailings dams using a 3D model
- Variation characteristics and attribution analysis of actual evaporation at monthly time scale from 1982 to 2019 in Jialing River Basin, China
- Investigating machine learning and statistical approaches for landslide susceptibility mapping in Minfeng County, Xinjiang
- Investigating spatiotemporal patterns for comprehensive accessibility of service facilities by location-based service data in Nanjing (2016–2022)
- A pre-treatment method for particle size analysis of fine-grained sedimentary rocks, Bohai Bay Basin, China
- Study on the formation mechanism of the hard-shell layer of liquefied silty soil
- Comprehensive analysis of agricultural CEE: Efficiency assessment, mechanism identification, and policy response – A case study of Anhui Province
- Simulation study on the damage and failure mechanism of the surrounding rock in sanded dolomite tunnels
- Towards carbon neutrality: Spatiotemporal evolution and key influences on agricultural ecological efficiency in Northwest China
- Review Articles
- Humic substances influence on the distribution of dissolved iron in seawater: A review of electrochemical methods and other techniques
- Applications of physics-informed neural networks in geosciences: From basic seismology to comprehensive environmental studies
- Ore-controlling structures of granite-related uranium deposits in South China: A review
- Shallow geological structure features in Balikpapan Bay East Kalimantan Province – Indonesia
- A review on the tectonic affinity of microcontinents and evolution of the Proto-Tethys Ocean in Northeastern Tibet
- Advancements in machine learning applications for mineral prospecting and geophysical inversion: A review
- Special Issue: Natural Resources and Environmental Risks: Towards a Sustainable Future - Part II
- Depopulation in the Visok micro-region: Toward demographic and economic revitalization
- Special Issue: Geospatial and Environmental Dynamics - Part II
- Advancing urban sustainability: Applying GIS technologies to assess SDG indicators – a case study of Podgorica (Montenegro)
- Spatiotemporal and trend analysis of common cancers in men in Central Serbia (1999–2021)
- Minerals for the green agenda, implications, stalemates, and alternatives
- Spatiotemporal water quality analysis of Vrana Lake, Croatia
- Functional transformation of settlements in coal exploitation zones: A case study of the municipality of Stanari in Republic of Srpska (Bosnia and Herzegovina)
- Hypertension in AP Vojvodina (Northern Serbia): A spatio-temporal analysis of patients at the Institute for Cardiovascular Diseases of Vojvodina
- Regional patterns in cause-specific mortality in Montenegro, 1991–2019
- Spatio-temporal analysis of flood events using GIS and remote sensing-based approach in the Ukrina River Basin, Bosnia and Herzegovina
- Flash flood susceptibility mapping using LiDAR-Derived DEM and machine learning algorithms: Ljuboviđa case study, Serbia
- Geocultural heritage as a basis for geotourism development: Banjska Monastery, Zvečan (Serbia)
- Assessment of groundwater potential zones using GIS and AHP techniques – A case study of the zone of influence of Kolubara Mining Basin
- Impact of the agri-geographical transformation of rural settlements on the geospatial dynamics of soil erosion intensity in municipalities of Central Serbia
- Where faith meets geomorphology: The cultural and religious significance of geodiversity explored through geospatial technologies
- Applications of local climate zone classification in European cities: A review of in situ and mobile monitoring methods in urban climate studies
- Complex multivariate water quality impact assessment on Krivaja River
- Ionization hotspots near waterfalls in Eastern Serbia’s Stara Planina Mountain
- Shift in landscape use strategies during the transition from the Bronze age to Iron age in Northwest Serbia
- Assessing the geotourism potential of glacial lakes in Plav, Montenegro: A multi-criteria assessment by using the M-GAM model
- Flash flood potential index at national scale: Susceptibility assessment within catchments
- SWAT modelling and MCDM for spatial valuation in small hydropower planning