Simultaneous effects of temperature and backbone length on static and dynamic properties of high-density polyethylene-1-butene copolymer melt: Equilibrium molecular dynamics approach
-
Amirhosein Yazdanbakhsh


Abstract
Temperature and chain length play significant roles in determining the physical properties of polymer melts. In the current computational research, a molecular dynamics (MD) approach was implemented to describe the static and dynamic properties of (1) high-density polyethylene-1-butene with 120 beads in backbone (PE120) and (2) entangled high-density polyethylene-1-butene with 600 beads in the backbone (PE600). The transferable potentials for phase equilibria force fields were used for CH2 beads in a defined initial condition. First, the equilibrium phase of the designed systems was reported with total energy and density convergency at various initial temperatures (T 0 = 450, 470, and 490 K). Also, gyration radius (R g) and end-to-end distance (R) were calculated for the static behavior description of the two PEs. Zero-shear viscosity (η 0), mean square displacement, and diffusion coefficient (D) were estimated to define the dynamic behavior of PE120 and PE600 systems. MD outputs predicted that 10 ns is sufficient for equilibrium phase detection inside polymeric samples. After equilibrium phase detection, R g converged to 14.97 and 17.35 Å in PE120 and PE600, respectively (T 0 = 450 K). Furthermore, MD outputs show that temperature variation can considerably affect the time evolution of the system. Numerically, the η 0 of PE120 and PE600 converged to 49 and 168 cp at 450 K. These results of η 0 parameter as a function of temperature are an important output of MD simulations. The results predicted that η 0 decreases to 24 and 44 cp for PE120 and PE600 samples with an increase in temperature from 450 to 490 K. With the creation of the entanglements network, D reached the highest value of 2 × 10⁻⁹ m2·s−1 among the designed polymeric systems. The results are in good consistency with experimental reports. It is expected that the result of this study can be used in designing improved polymeric systems for real applications.
1 Introduction
Ethylene-alpha olefin copolymers exhibit excellent properties and find a wide range of applications due to the flexibility of chain design and tailoring during polymerization. The addition of 1-butene comonomer to ethylene monomer in the polymerization reactor results in short-chain branches (SCBs) of ethyl on the polyethylene (PE) backbone (1). The number, density, and distribution of these SCBs can strongly influence the physical and dynamic melt properties of PE (2). Chain entanglements significantly influence the melt properties, particularly zero-shear viscosity (η 0) of PE. This parameter in PE melt-based systems is crucial for understanding their flow behavior under processing conditions. η 0 influences the material’s processing efficiency, product quality, and performance in applications. η 0 calculations provide insights into molecular interactions and entanglements, affecting how PE behaves during extrusion and molding. By analyzing these viscosity results, manufacturers can optimize processing parameters, enhance material properties, and predict performance in end-use applications, ultimately leading to better product design and reduced production costs (3). When the backbone length is sufficient to form entanglements, segmental motions, and consequently, the dynamic properties of the chains will differ before and after entanglement (4). Therefore, it is important to study the dynamic behavior of PE chains above entanglement molecular weight (M e). η 0 experiences a large increase at M e. Investigating the physical and dynamic behavior of the chains beyond this weight is of paramount importance (5). In thermodynamic equilibrium, temperature plays a crucial role in the melt behavior of PE, and temperature variations induce changes in the dynamics of the PE chains. Additionally, the dependence of the dynamic diffusion coefficient (D) on temperature is considered one of the most important variables in the equilibrium of PE melt. At equilibrium, the activation energy of PE signifies the temperature dependence of D (6,7).
Simulating the melt flow of PE provides useful and applied information for its processing. The melt processability of PE is strongly influenced by its structure, molecular weight and physical properties (8). As a result, recent investigations into the melt behavior of PE have garnered attention, particularly for entangled chains and branched molecular architectures (9,10). Molecular dynamics (MD) approach is an interesting and adequate method for studying the physical behavior of PE due to its ease of application and its ability to provide direct and effective information on the evolution of physical and dynamic properties over time (11,12). Therefore, given that simultaneous oscillatory movements of atoms and segmental motions occur in the PE chain, selecting a very short time step and a high number of steps in MD simulation is essential. To address this limitation, the use of coarse-grained models, including bead-spring models, is common to achieve satisfactory simulation times (13). Many coarse-grained models consider CH, CH2, and CH3 groups as unified carbon atoms when describing the melt behavior of PE (14,15). η 0 can be directly calculated in equilibrium MD simulations using the time integral of the stress tensor components (16).
The study by Harmandaris et al. (17) stands out as one of the earliest research endeavors exploring the dynamic properties of PE melt through MD simulation. They simulated linear PE melt under equilibrium conditions using the MD method. Additionally, they employed the Rouse model to calculate friction and diffusion coefficients and η
0 for various chain lengths of PE, both below and above the entanglement molecular weight. They compared these calculations with the results of experimental studies. They showed that η
0 and D are strongly correlated with backbone length. In a MD simulation by Padding and Briels (5) in coarse-grain mode, linear PE melt with backbone lengths ranging from 80 to 1,000 carbon atoms was examined under equilibrium conditions for structural and dynamic analysis. Each set of 20 carbon atoms was considered as one bead in this simulation. The results indicated an expected increase in the average mean square gyration radius (
In the present study, PE chains with 120 and 600 numbers of CH2 beads in the backbone containing varying amounts and distributions of SCBs of ethyl are modeled. The temporal transformations of the system are investigated at molecular weights above the entanglement molecular weight and above the critical molecular weight at different temperatures. Most MD simulation studies conducted on the structure and dynamics of molten PE so far have either modeled its linear structure, examined the modeled system’s transformations below the critical molecular weight, or been limited to a constant temperature. The present improved MD simulations investigate the dynamic behavior of PE melt in the presence of chain entanglements as a function of temperature, which shows good compatibility with experimental results. So, the current research introduced the effect of molecular weight and temperature parameters on valuable physical properties of the molten PE samples (such as R g, D, and η 0) with particle-based simulations for the first time. A united atomic structure suitable for the studied branched copolymer was developed then an appropriate force field was used to create thermodynamic equilibrium. The melt density, static and dynamic parameters of PEs at two MWs, and varying content and distribution of SCBs and three temperature levels were calculated. Subsequently, structural and static transformations of the modeled copolymer chains were evaluated by calculating R g, interaction/total energies, and R parameters. Furthermore, the melt dynamics of PE was studied by calculating properties such as η 0, mean square displacement (MSD), and D for the produced structures at three temperature levels.
2 MD details and molecular samples
M e at which chains start to entangle is defined in the literature as 1,680 g·mol−1 or 120 beads (CH2) (20). M c at which the slope of zero shear viscosity vs MW increases from 1 to 3.4 is defined in the literature as 5,000 g·mol−1 or 357 beads (CH2) (5). In current computational research, the time evolution of branched PE above M e and M c was described using the MD approach. Polymer chains were modeled as CH2 and CH3 units or united beads. Two various types of chains including 120 and 600 beads were modeled inside the computational box as depicted in Figure 1. Polymeric chains were randomly modeled inside computational boxes using PACKMOL software (21). A minimum distance of 2 Å was set to prevent unactual bonds between polymer chains. Also, a branching degree was set to 1.7% and 1% (22) for the ethyl branch was assigned. The initial temperature was set to 450, 470, and 490 for 15 ns. The large-scale atomic/molecular massively parallel simulator (23) package, released by Sandia National Laboratory, was used in the simulations.
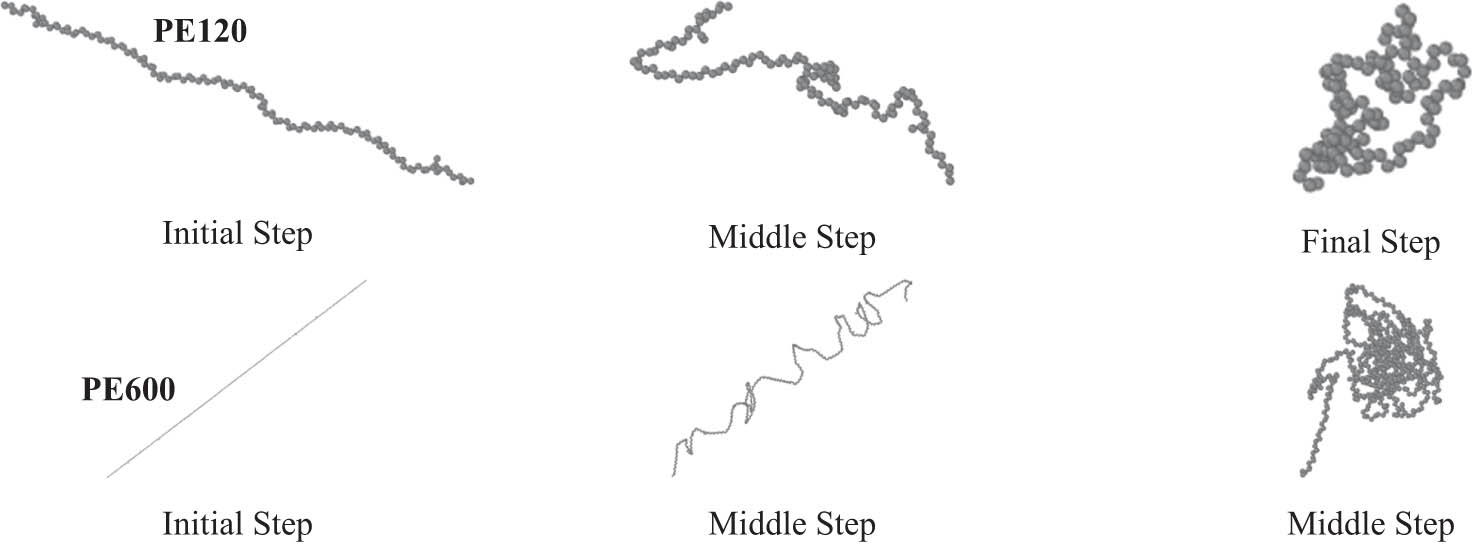
Structural evolution of PE120 and PE600 chains in the modeling phase of current computational research. These graphical outputs were created using OVITO (35) software.
2.1 MD method
MD simulation is a powerful computational method to study the behavior of molecules and atoms over time. In the context of polymeric structure studies, MD simulations are particularly valuable for investigating the dynamic properties and structural characteristics at the molecular level.
In a polymeric system, MD simulations involve representing a polymer chain as a series of connected beads (representing repeating atomic units) interacting with each other through an interatomic force field (potential function). Newton’s law is computationally implemented between beads (24),
where F is the interparticle force, which is described by potential function (E), X and V are the position and velocity of each particle, respectively, with M being mass. These computational functions describe the forces between beads and are used to calculate the motion of the beads over time. In the current research, the Transferable Potentials for Phase Equilibria (TraPPE) force field (25,26) was used to define inter-beads interaction. According to previous investigations, this force field has a better numerical decision rather than other types for PE physical performance description (19). In this force field, the non-bond interaction (27) is described with Lennard–Jones (LJ) potential (28) according to the following equation:
Here, ε and σ represent the energy and distance parameters, respectively. r c defines the cutoff radius in the LJ equation. The energy of simple and angular bonds are described according to the following equations:
where K
b and K
a are harmonic constants and r
0 and
where A and
where X i and V i parameters define the position and velocity of the ith particle. Δt and a represent timestep and acceleration, respectively. Through MD simulations, it can be observed how polymer chains move, interact, and arrange themselves in different initial conditions, here, in various temperatures. This provides insights into properties such as chain configuration, dynamic behavior, and thermodynamic properties of modeled PE-based systems.
2.2 Details of MD simulations
The MD simulations in this work are done in equilibrium conditions. The initial pressure was set to 1 atm, and the initial temperature was set to 450, 470, and 490 K using the Nose Hoover algorithm (31). A temperature/pressure damping value of 1/100 fs was set to reach the equilibrium phase. Structurally, the simulation box was set to 65 × 65 × 65 Å3 and 150 × 150 × 150 Å3 in the presence of polymeric backbones with 120 and 600 beads, respectively. An initial R g of 1.5 nm was considered for the chains with 120 and 600 beads (32). These polymeric chains were modeled by the time evolution of linear pristine samples, as shown in Figure 1. The total number of beads was in the range of 7,440–36,720 (Figure 2). In these models, the timestep value was set to 1 fs, and simulation was run for 15 ns (33) using the NPT ensemble (including first 10 ns for equilibrium simulation and then 5 ns for the calculation of static/dynamics properties) (34). All of our MD simulation settings are listed in Table 1. Also, the TraPPE force field coefficients (16) are given in Table 2.
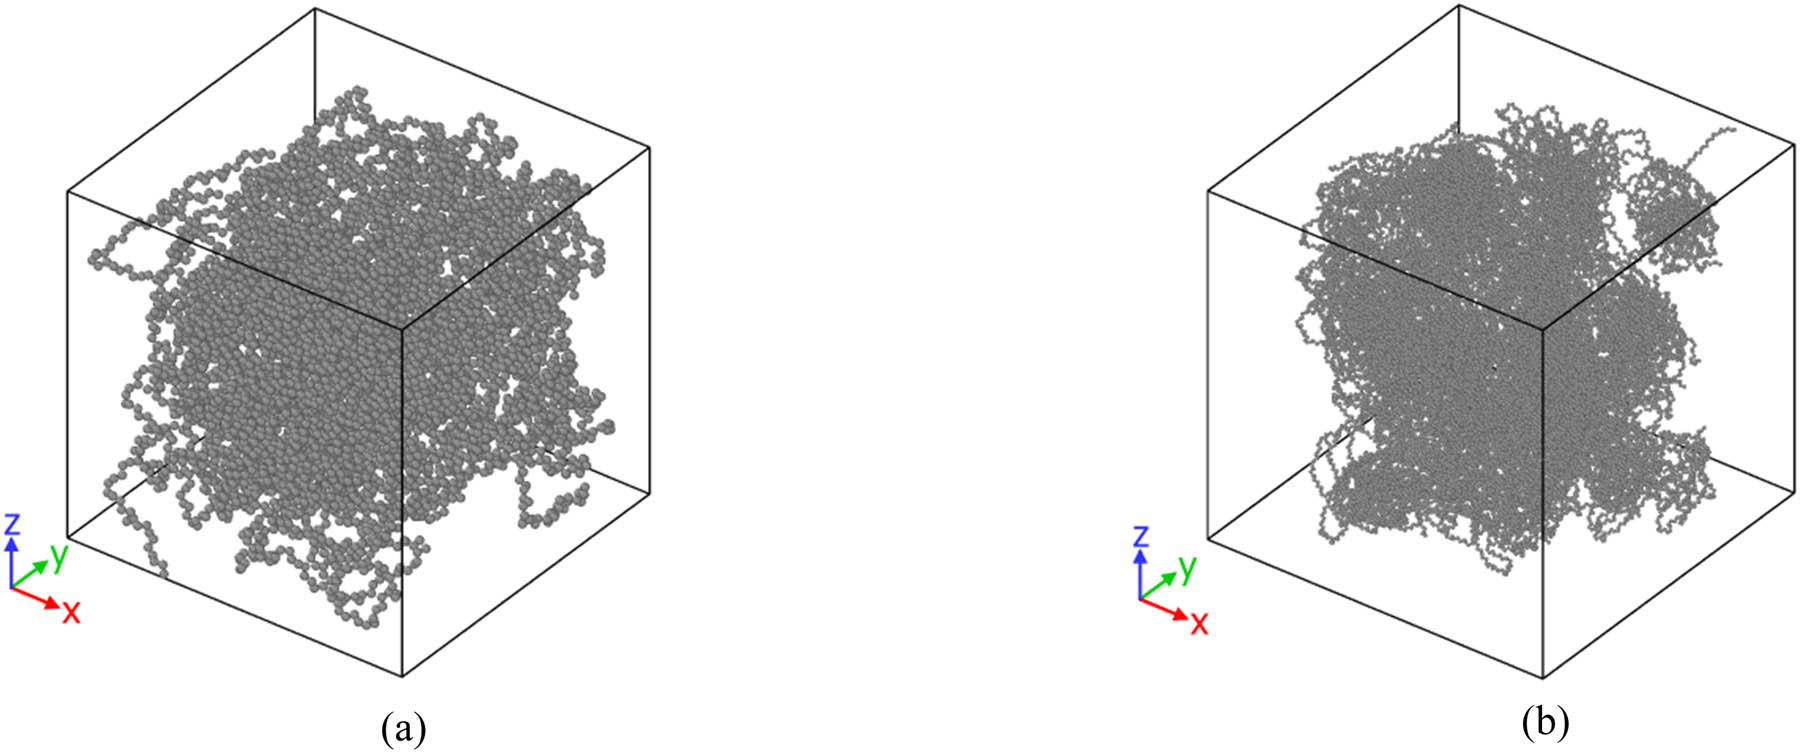
Graphical representation of (a) simulation box in the presence of 60 chains of PE120 and (b) simulation box in the presence of 60 chains of PE600.
MD simulations settings in current computational research
| Computational parameter | Value/setting |
|---|---|
| Box size | 65 × 65 × 65 Å3 (for PE120 sample) 150 × 150 × 150 Å3 (for PE600 sample) |
| Number of total beads | 7,440 (for PE120 sample) 36,720 (for PE600 sample) |
| Temperature | 450, 470, and 490 K |
| Pressure | 1 atm |
| Damping of temperature | 1 fs |
| Damping of pressure | 100 fs |
| Timestep | 1 fs |
| Total simulation time | 15 ns |
TraPPE force field coefficients in current research
| Parameter | Value |
|---|---|
| ε | 0.0914 kcal·mol−1 |
| σ | 3.95 Å |
| r c | 9.085 Å |
| K b | 95.88 kcal·mol−1 |
| r 0 | 1.54 Å |
| K a | 62.1 kcal·mol−1 |
|
|
114° |
| A 0 | 1.9892 kcal·mol−1 |
| A 1 | 4.2328 kcal·mol−1 |
| A 2 | −0.6021 kcal·mol−1 |
| A 3 | −7.1778 kcal·mol−1 |
| A 4 | 4.4255 kcal·mol−1 |
| A 5 | 3.9068 kcal·mol−1 |
| A 6 | −8.9206 kcal·mol−1 |
| A 7 | −3.4498 kcal·mol−1 |
| A 8 | 5.5980 kcal·mol−1 |
| m | 9 |
Several parameters, such as total energy and temperature variation as a function of simulation time, are reported after reaching the equilibrium phase (after 10 ns). Furthermore, physical outputs such as interaction energy, density, MSD, D, η 0, R g, and R are calculated to report static and dynamic behavior of PE-based systems (5 ns later of equilibrium phase detection).
3 MD simulation results
3.1 Equilibrium phase and validation of modeled polymeric samples
In the first step of current computational research, the equilibrium phase of the designed polymeric systems is reported. The atomic arrangements of the equilibrated matrix with 60 chains of polyethylene-1-butene with 120 (PE120) at varying temperatures are shown in Figure 3. The MD outputs showed that the temperature of the systems converged to 453.958, 476.921, and 493.154 K after 10 ns. Physically, these convergencies show that the amplitude of atomic fluctuations decreases by simulation time. The total energy parameter is appropriate to analyze this atomic evolution. The numerical results for the total energy parameter are reported in Figure 4. The total energy normalized to the bead numbers for the PE120 matrix was converged to 29.860, 29.994, and 30.053 kcal·mol−1 at 450, 470, and 490 K, respectively. The total energy convergency in this computational step indicates that the attraction forces between various particles are developed for the applied initial condition. So, it is expected that structural stability occurs after 10 ns inside the MD box.
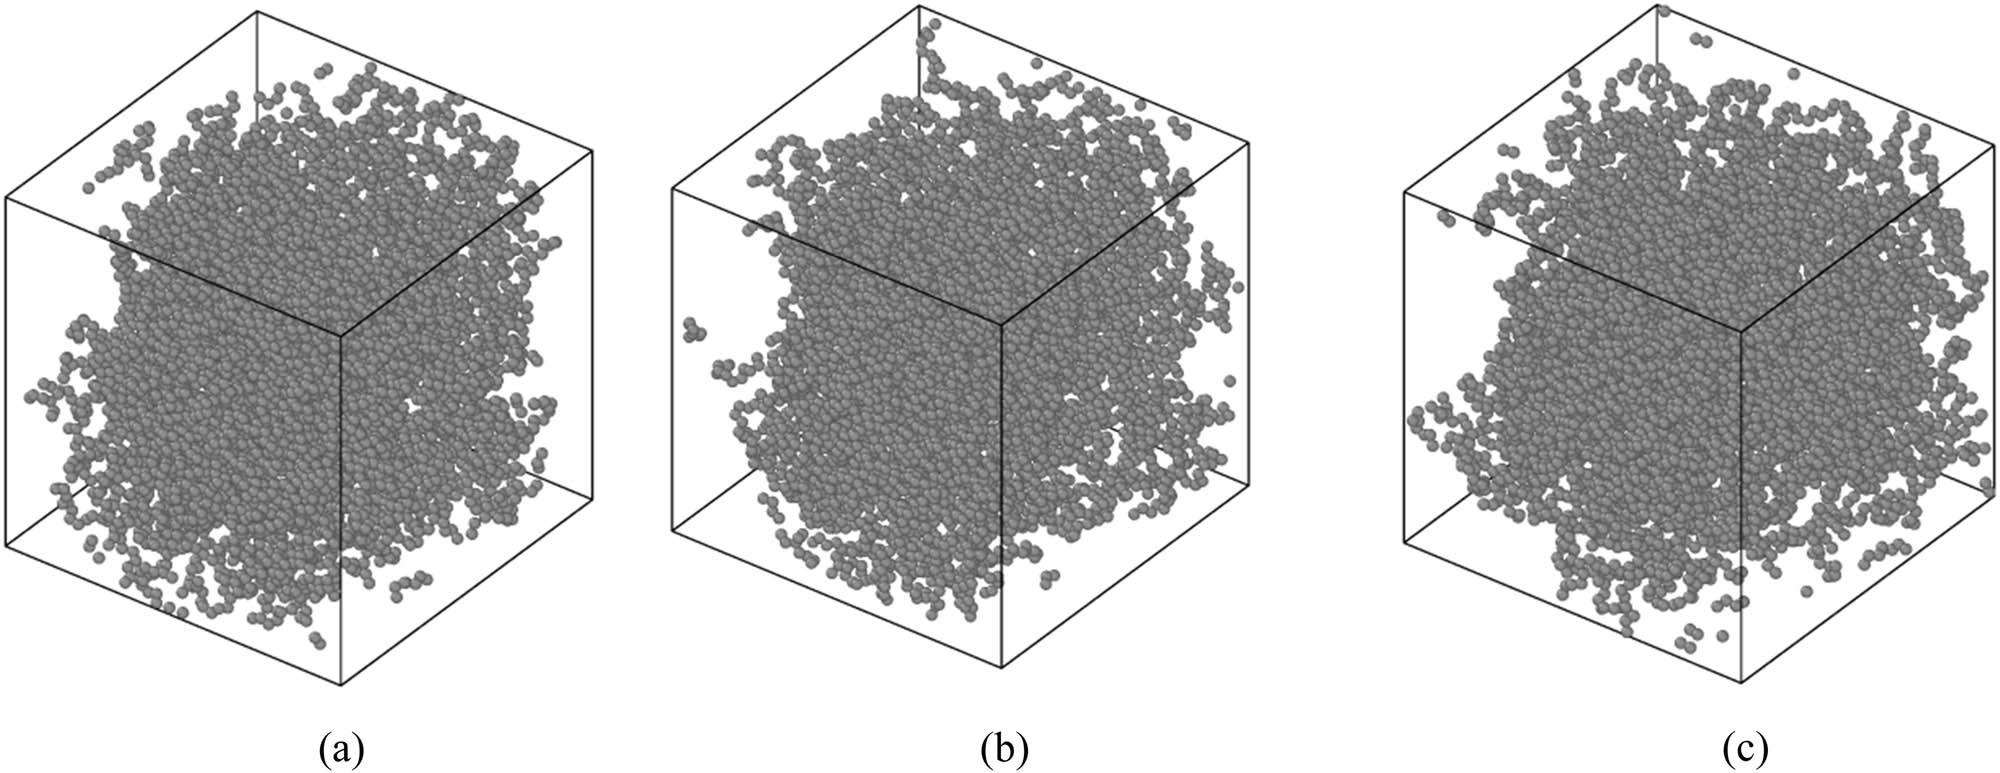
Structure of the PE120 matrix arrangement after equilibrium phase detection at (a) 450, (b) 470, and (c) 490 K.
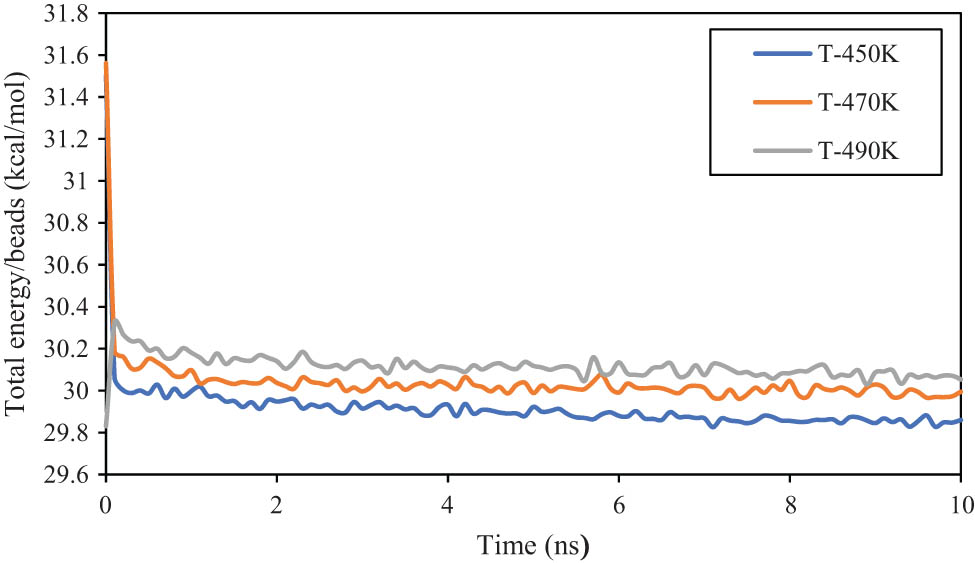
Total energy/bead parameter changes as a function of initial temperature in the modeled PE120 matrix.
The polymeric matrix, which was designed by 60 chains of PE600, shows similar equilibrium behavior as reported before for PE120. As shown in Figure 5, the appropriate structural unity can be seen in the PE600 matrix at various temperatures. These structural unities arise from atomic interactions in various initial conditions. Numerically, the total energy/bead of PE600 matrix converged to 32.862, 33.013, and 33.152 kcal·mol−1 at 450, 470, and 490 K, respectively (Figure 5d). These energy outputs predicted that the PE600 matrix can be stabilized in actual applications.
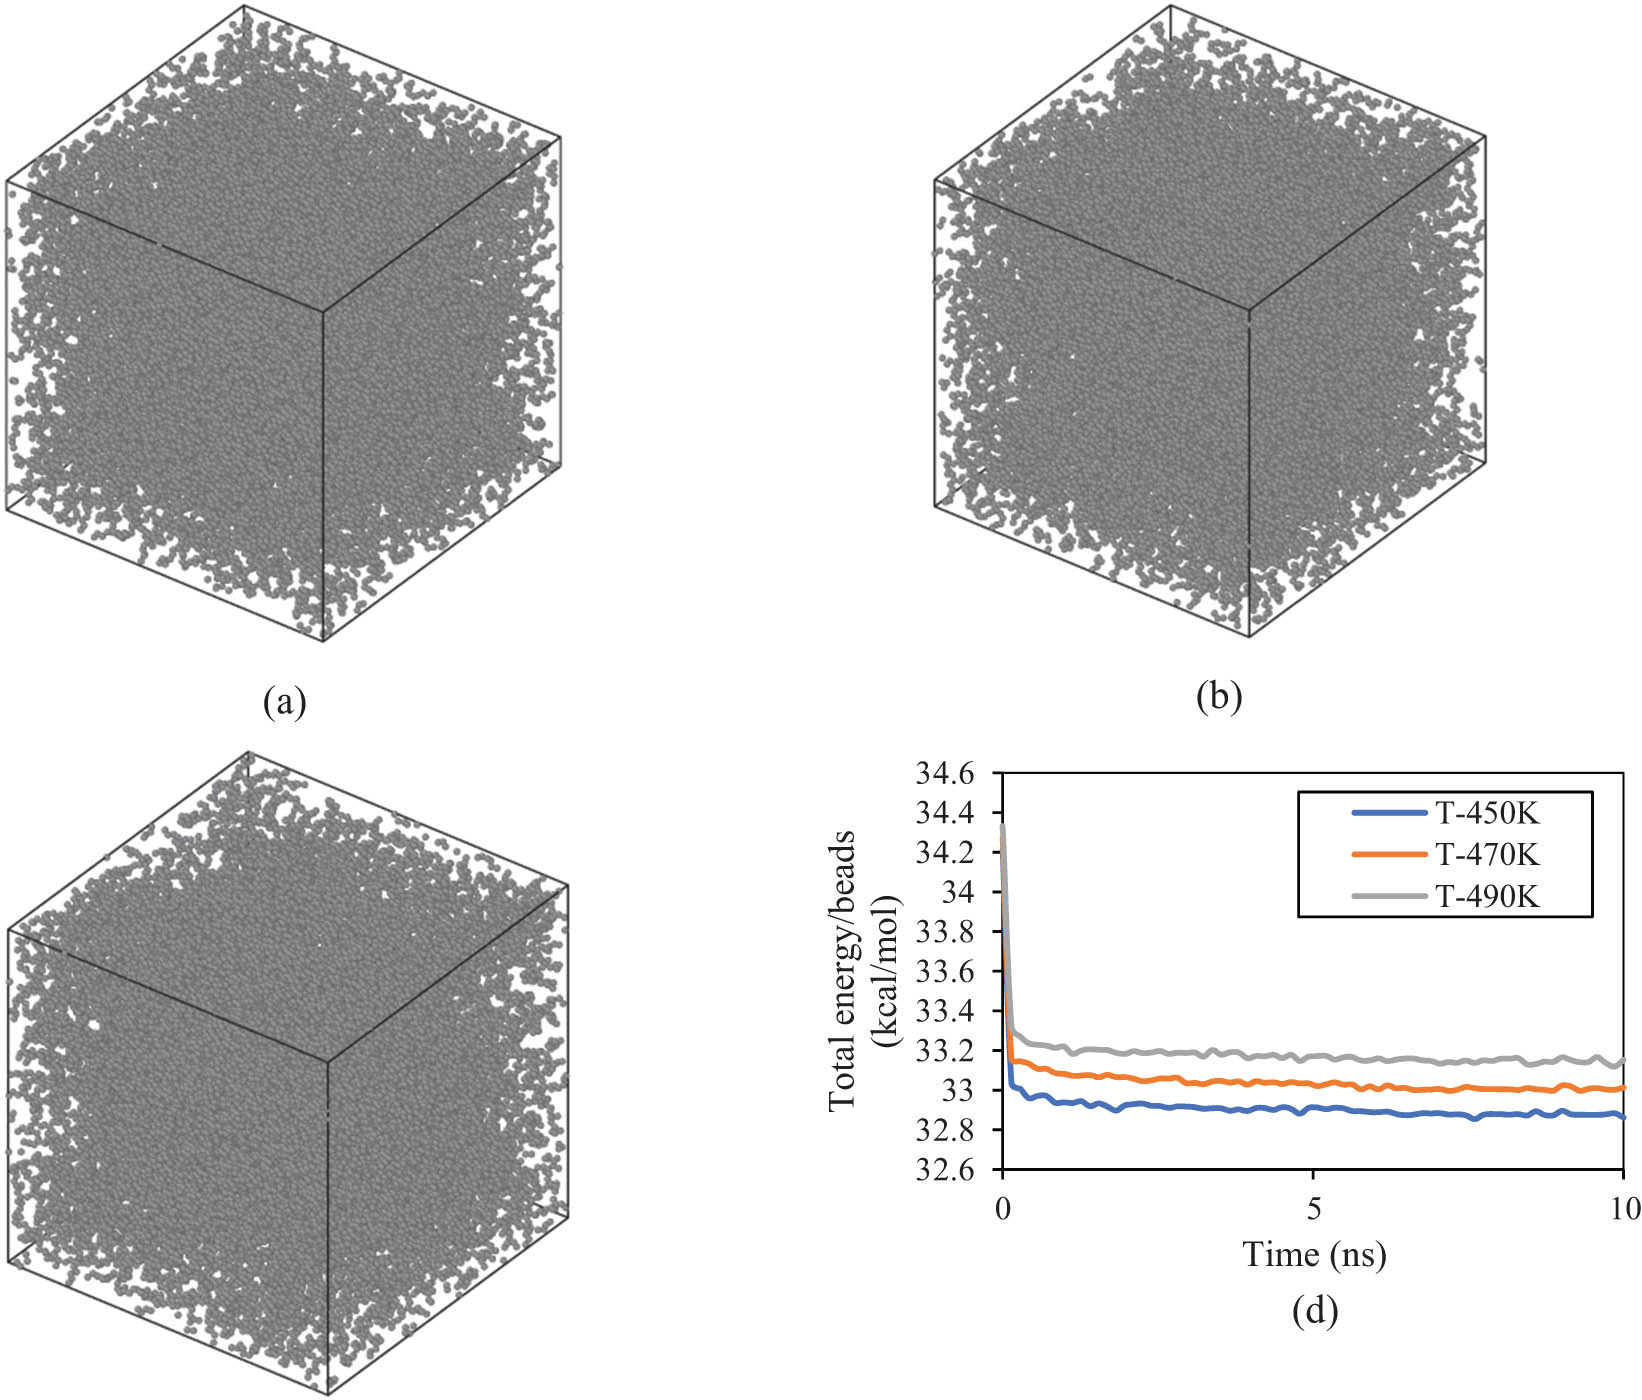
Structure of the PE600 matrix arrangement after 10 ns at (a) 450, (b) 470, and (c) 490 K. (d) (Total energy)/(beads) changes as a function of initial temperature in the PE600 sample.
The detection of the equilibrium phase was a qualitative validation for the computational method. To quantitatively validate the simulation method, the variation of melt density with simulation time at three temperatures is shown in Figure 6a for the PE120 matrix. In this figure, the melt density of the system converges to 0.732, 0.716, and 0.700 g·ml−1 at 450, 470, and 490 K, respectively, which are in agreement with previous reports (18). The reported density convergencies arise from the change of volume from 274,625 to 230,688.52 Å3 as listed in Table 3. Physically, an increase in thermal energy increases the mean distance between the beads and, therefore between the chains, which increases the volume and decreases the density of the system.
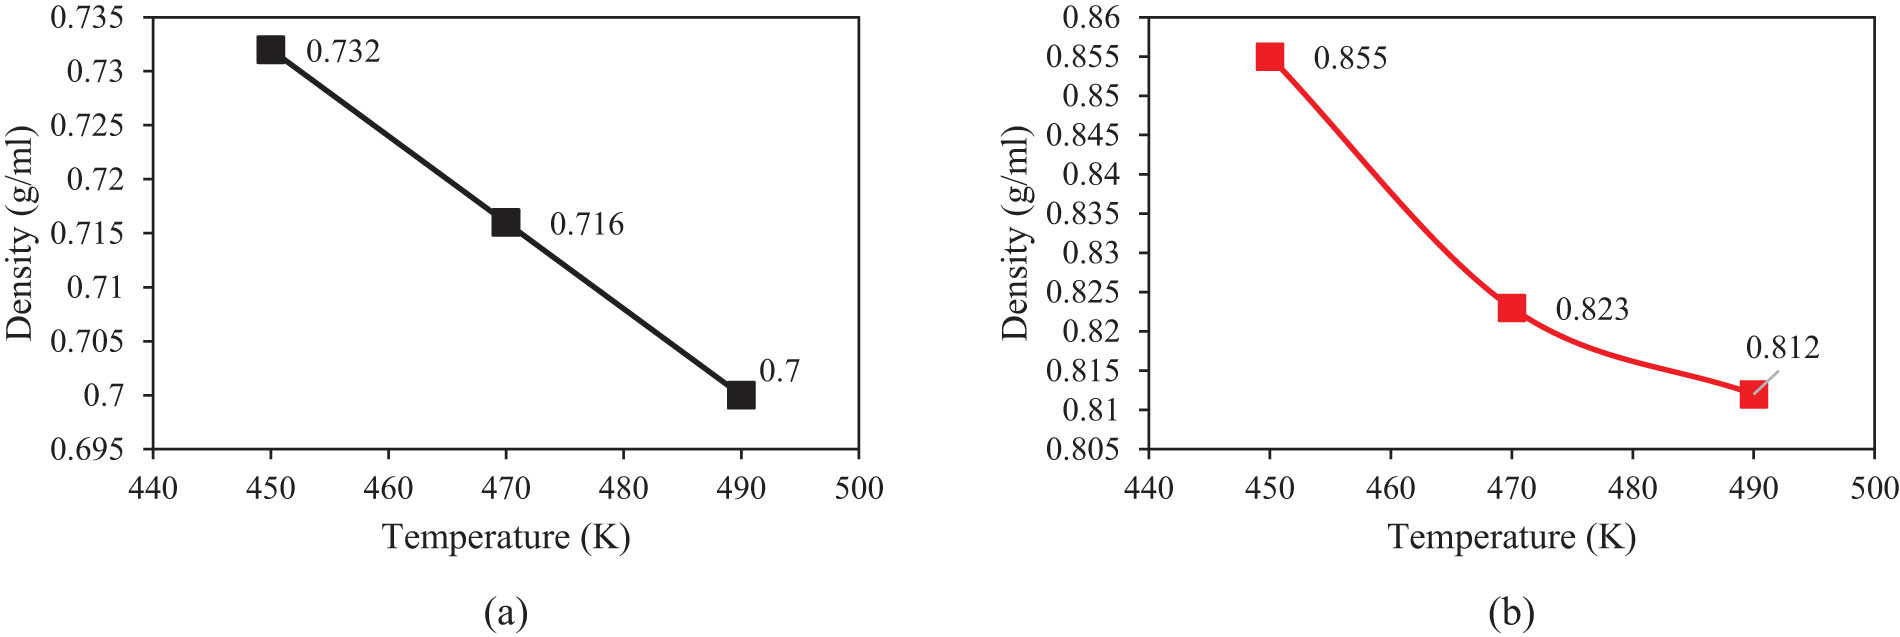
Density changes as a functional initial temperature after 10 ns for (a) PE120 and (b) PE600 matrices.
Density and volume changes (ΔV) in various modeled polymeric matrices
| Matrix-temperature | Density (g·ml−1) | ΔV (Å3) |
|---|---|---|
| PE120-450 K | 0.732 | −38,404.96 |
| PE120-470 K | 0.716 | −33,425.67 |
| PE120-490 K | 0.700 | −43,936.48 |
| PE600-450 K | 0.855 | −2,371,906.82 |
| PE600-470 K | 0.823 | −2,336,978.04 |
| PE600-490 K | 0.812 | −2,325,898.16 |
Furthermore, Figure 6b presents the melt density of the PE600 matrix at the mentioned temperatures. Numerically, the density of PE600 converged to 0.855, 0.823, and 0.812 g·ml−1 for the initial temperatures of 450, 470, and 490 K. The decrease in density with temperature is in agreement with the experimental results (5,18,33). Alnaimi et al. (36) reported that the density of the PE-based system changed with 0.01 g·ml−1 by 20 K enlarging in temperature value. This numeric output is consistent with our work. For the PE600 system in which chain MW is well above M c, the entanglement network is established, attraction forces between various chains are intensified, and the packing ratio increases. Therefore, it is seen that density values are considerably higher than those values of PE120. As reported in Table 3, the volume changes in the PE600 matrix vary from 3,375,000 to 2,371,906.82 Å3, which is much wider than that for PE120.
The described density convergency can be analyzed by the radial distribution function (RDF) parameter (Figure 7). This parameter in polymeric systems describes the probability of finding a bead at a certain distance from a reference one within the polymer chain (37). It provides insights into the spatial arrangement and organization of monomers within the polymer structure, reflecting the polymer’s local ordering and packing characteristics. By analyzing the peaks of various designed structures, it is concluded that these peaks occur in the vicinity of r = 1.5 Å. Furthermore, MD outputs show that the RDF peak values, g(r), decrease for the PE120 matrix with MD runtime. This structural evolution predicted the polymeric chains' mean distance converge to a larger value. Similarly, in PE600, g(r) values decreased in the final time step (10 ns) in comparison to the value at the initial timestep with higher intensity than the value for the PE120 system. It is most likely that the network formation of entanglements above M c has caused this considerable structural behavior for PE600 as compared to PE120.
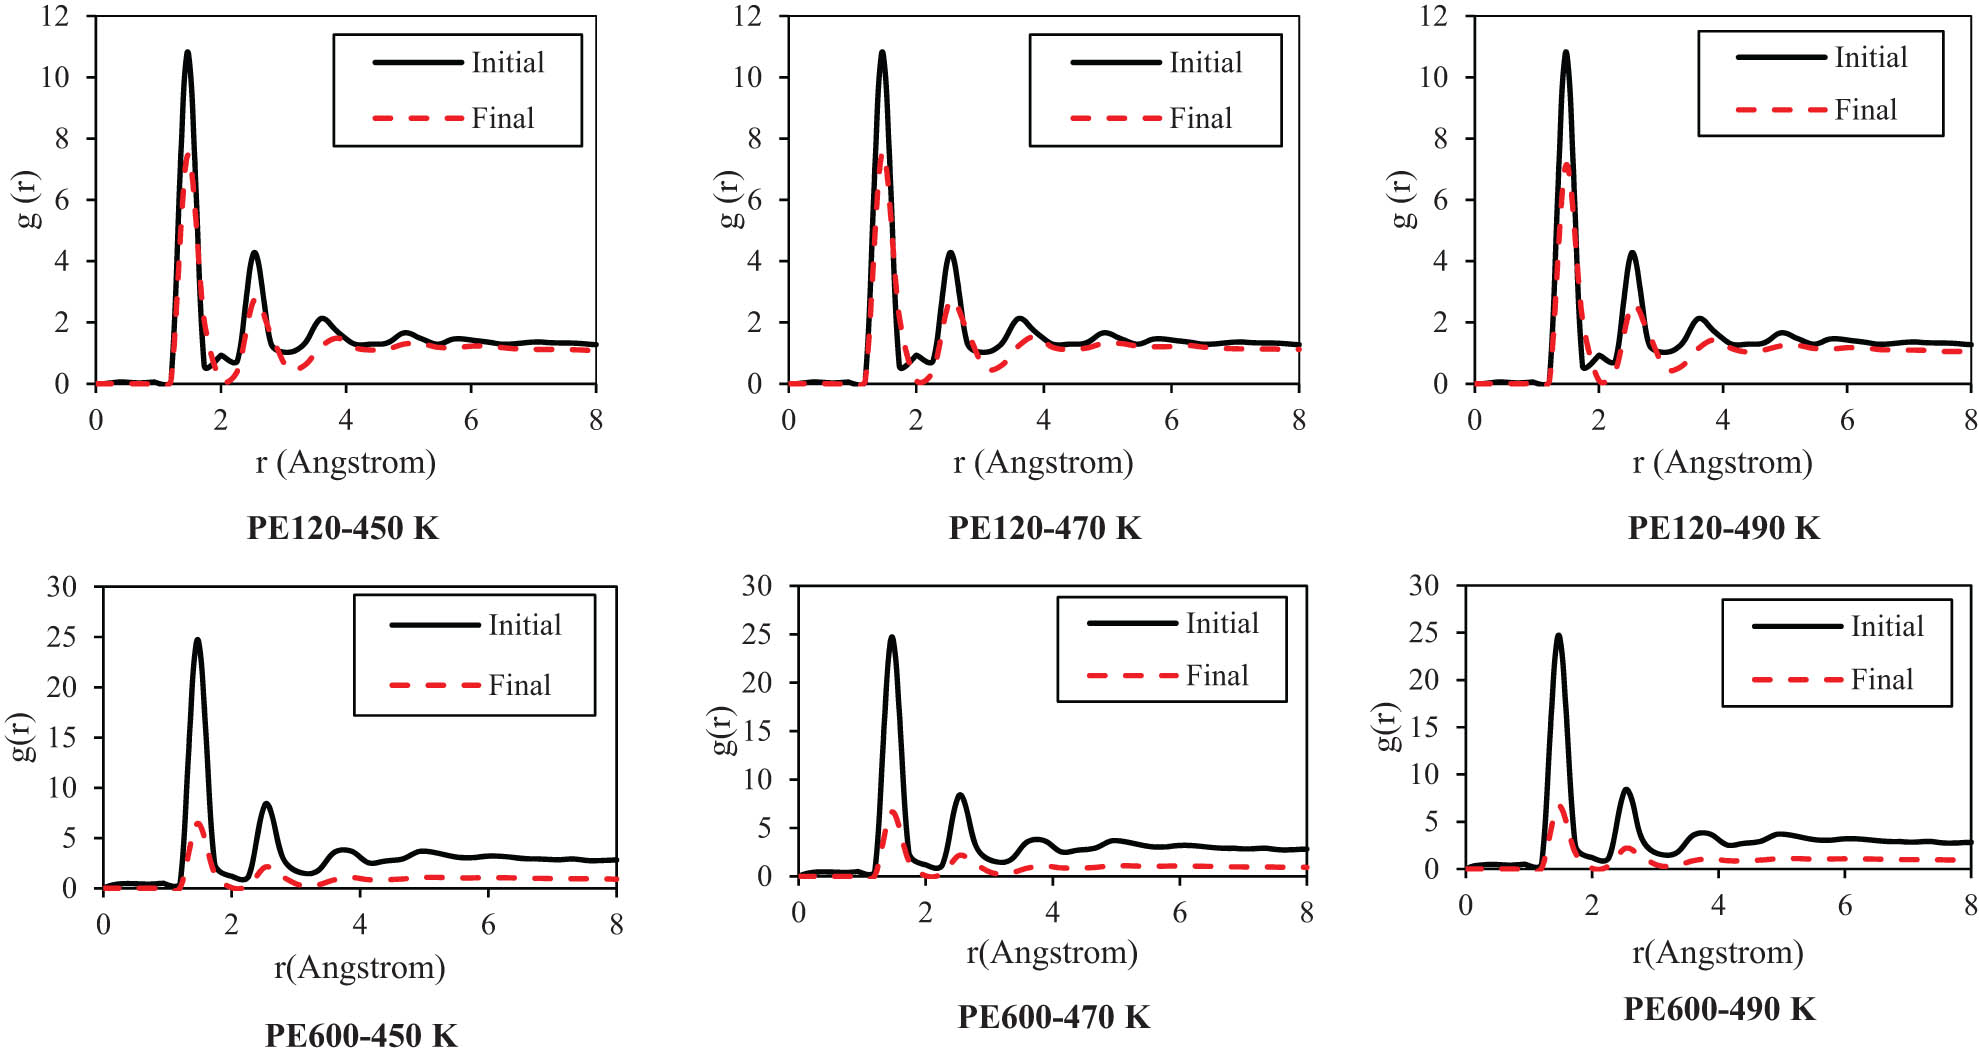
RDF in the initial and final time step of designed polymeric matrices at various temperatures.
In MD simulation of polymer-based systems, the total energy and density convergencies over simulation time are necessary but insufficient. Therefore, to ensure the sufficiency of simulation time to detect the equilibrium phase, the convergence of
3.2 Structural properties of modeled polymeric matrices
MD simulation results showed that 15 ns is the sufficient time to detect the final arrangement of beads in designed polymeric systems. In Figure 9, the RDF of various samples was depicted. This structural output indicated their stability. Furthermore, the potential energy of each PE-based system converged to a constant value in the final time step, as listed in Table 4. This energy convergency arises from the mean attraction force between chains in various regions of the MD box. R
g in polymeric systems is a measure that describes the average size of a polymer chain. It represents the average distance between the center of mass of the chain and its individual constituents. R
g is an important property for understanding the conformation and physical properties of polymer melts. Computationally, this parameter is calculated with R
g =
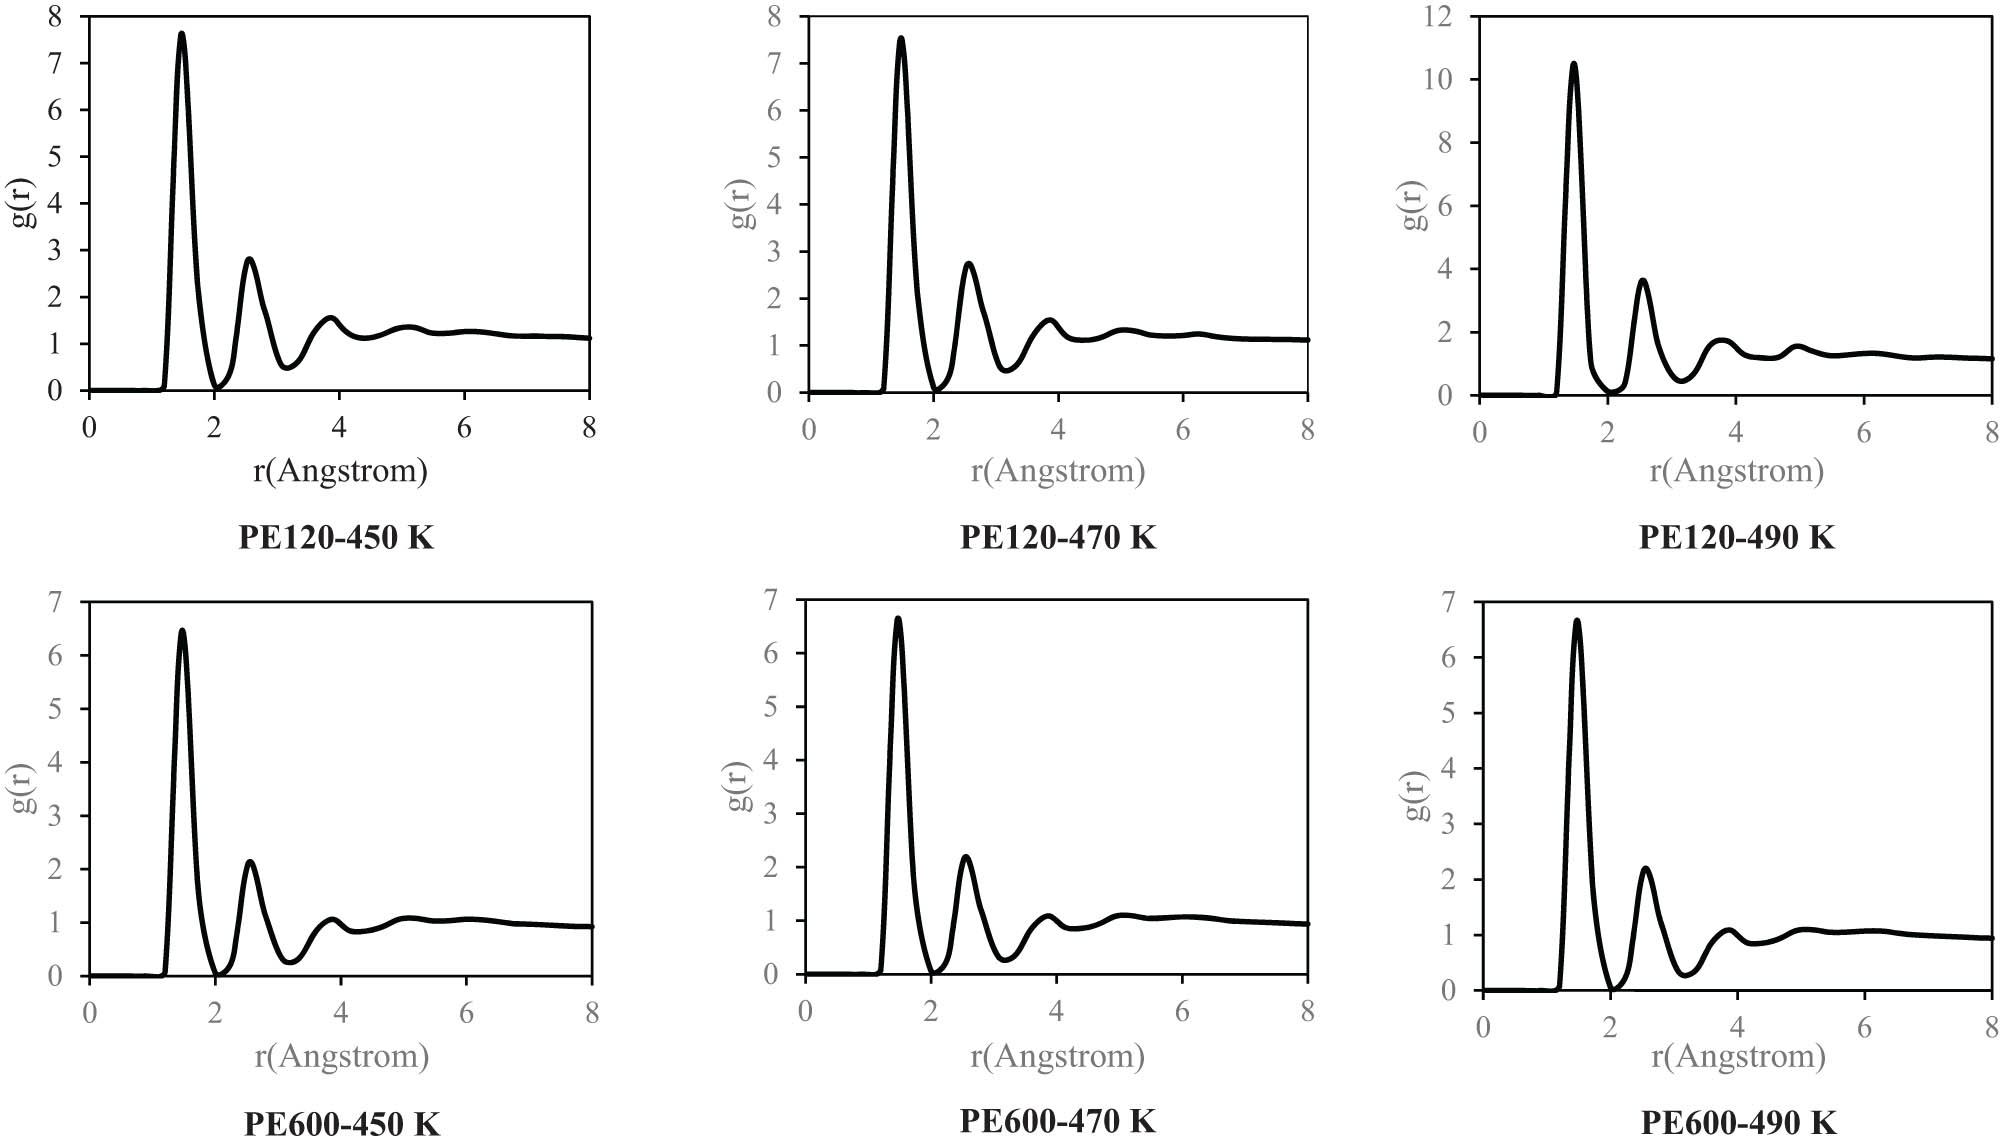
RDF of designed polymeric matrices at various temperatures after 15 ns.
Structural details and potential energy of the designed polymeric matrix with modeled PE600 in current research after 15 ns
| Matrix-temperature | Initial box length (Å) | R g (Å) | R (Å) |
C
∞ (
|
Potential energy/beads (kcal·mol−1) |
|---|---|---|---|---|---|
| PE120-450 K | 65 | 14.973 | 37.910 | 10.646 | 28.508 |
| PE120-470 K | 65 | 15.004 | 37.364 | 10.341 | 28.551 |
| PE120-490 K | 65 | 14.991 | 38.242 | 10.833 | 28.624 |
| PE600-450 K | 150 | 17.167 | 54.100 | 4.336 | 31.526 |
| PE600-470 K | 150 | 17.000 | 47.990 | 3.411 | 31.602 |
| PE600-490 K | 150 | 17.343 | 43.970 | 2.860 | 31.667 |
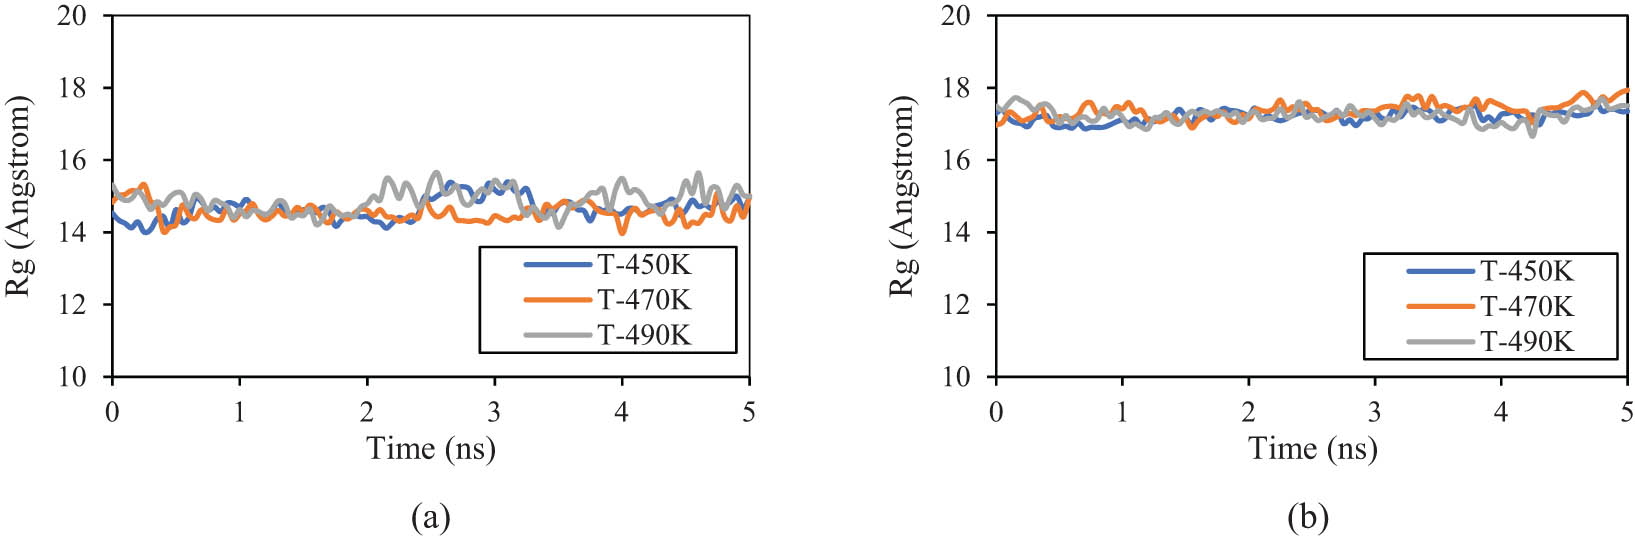
R g parameter changes as a function of the MD simulation time for (a) PE120 and (b) PE600 matrices in various initial temperatures.
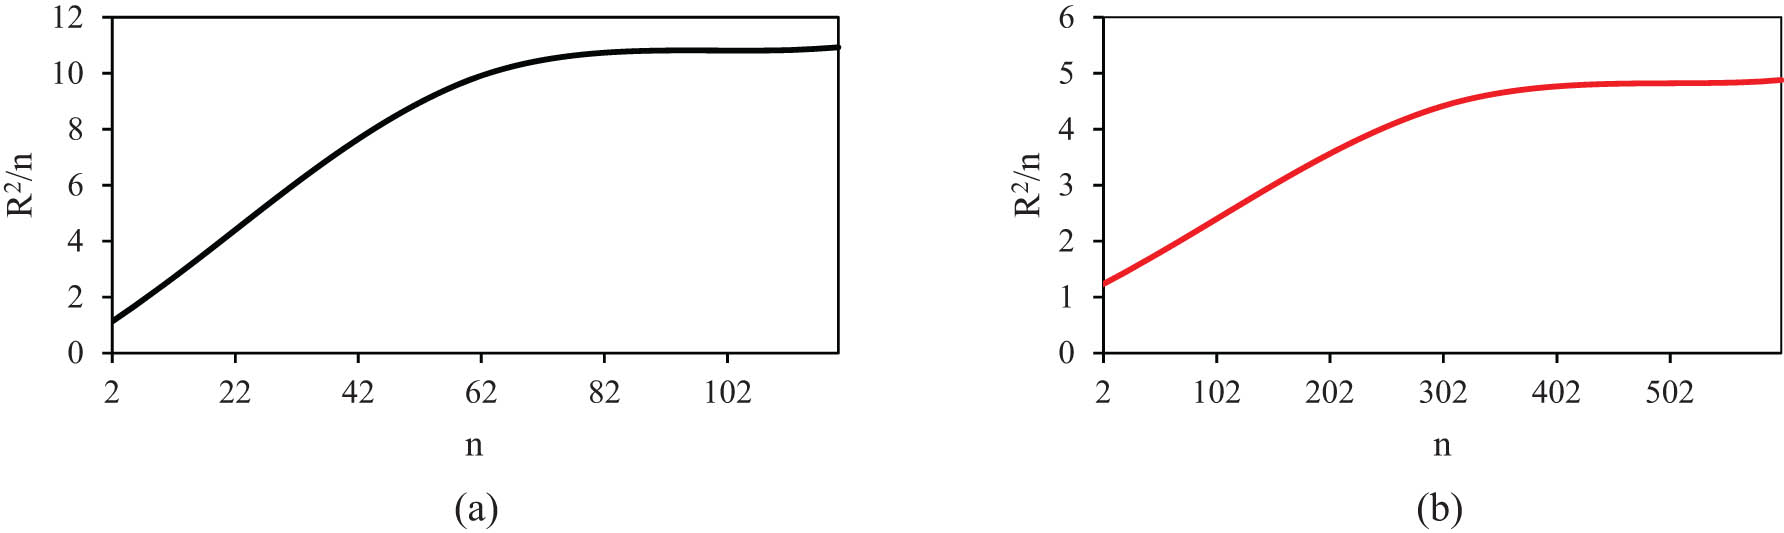
The distance between the ends of a polymer chain, R or end to end distance, is an important property of a polymer chain to understand the physical properties and behavior of polymer chains in defined condition. To calculate this parameter, several chains were selected from various regions of the box and their average end-to-end distance was assigned as R. The change of R with temperature is shown in Figure 11. A monotonic change is not observed for R against temperature for PE120 but it is decreasing for PE600. R was used to calculate C
∞ parameter, which is an indication of chain rigidity. C
∞ values of 10.833 and 4.336 were obtained for PE120 and PE600, respectively (Figure 11), which are in agreement (5,000 g·mol−1 (5)) with previous simulation and experimental data (19,41,42). Numerically, this parameter changed by temperature enlarging and converged to 38.242 from 37.910 Å in the PE120 matrix. This behavior arises from atomic fluctuation intensity enlarging in higher temperatures. This atomic evolution can be described by
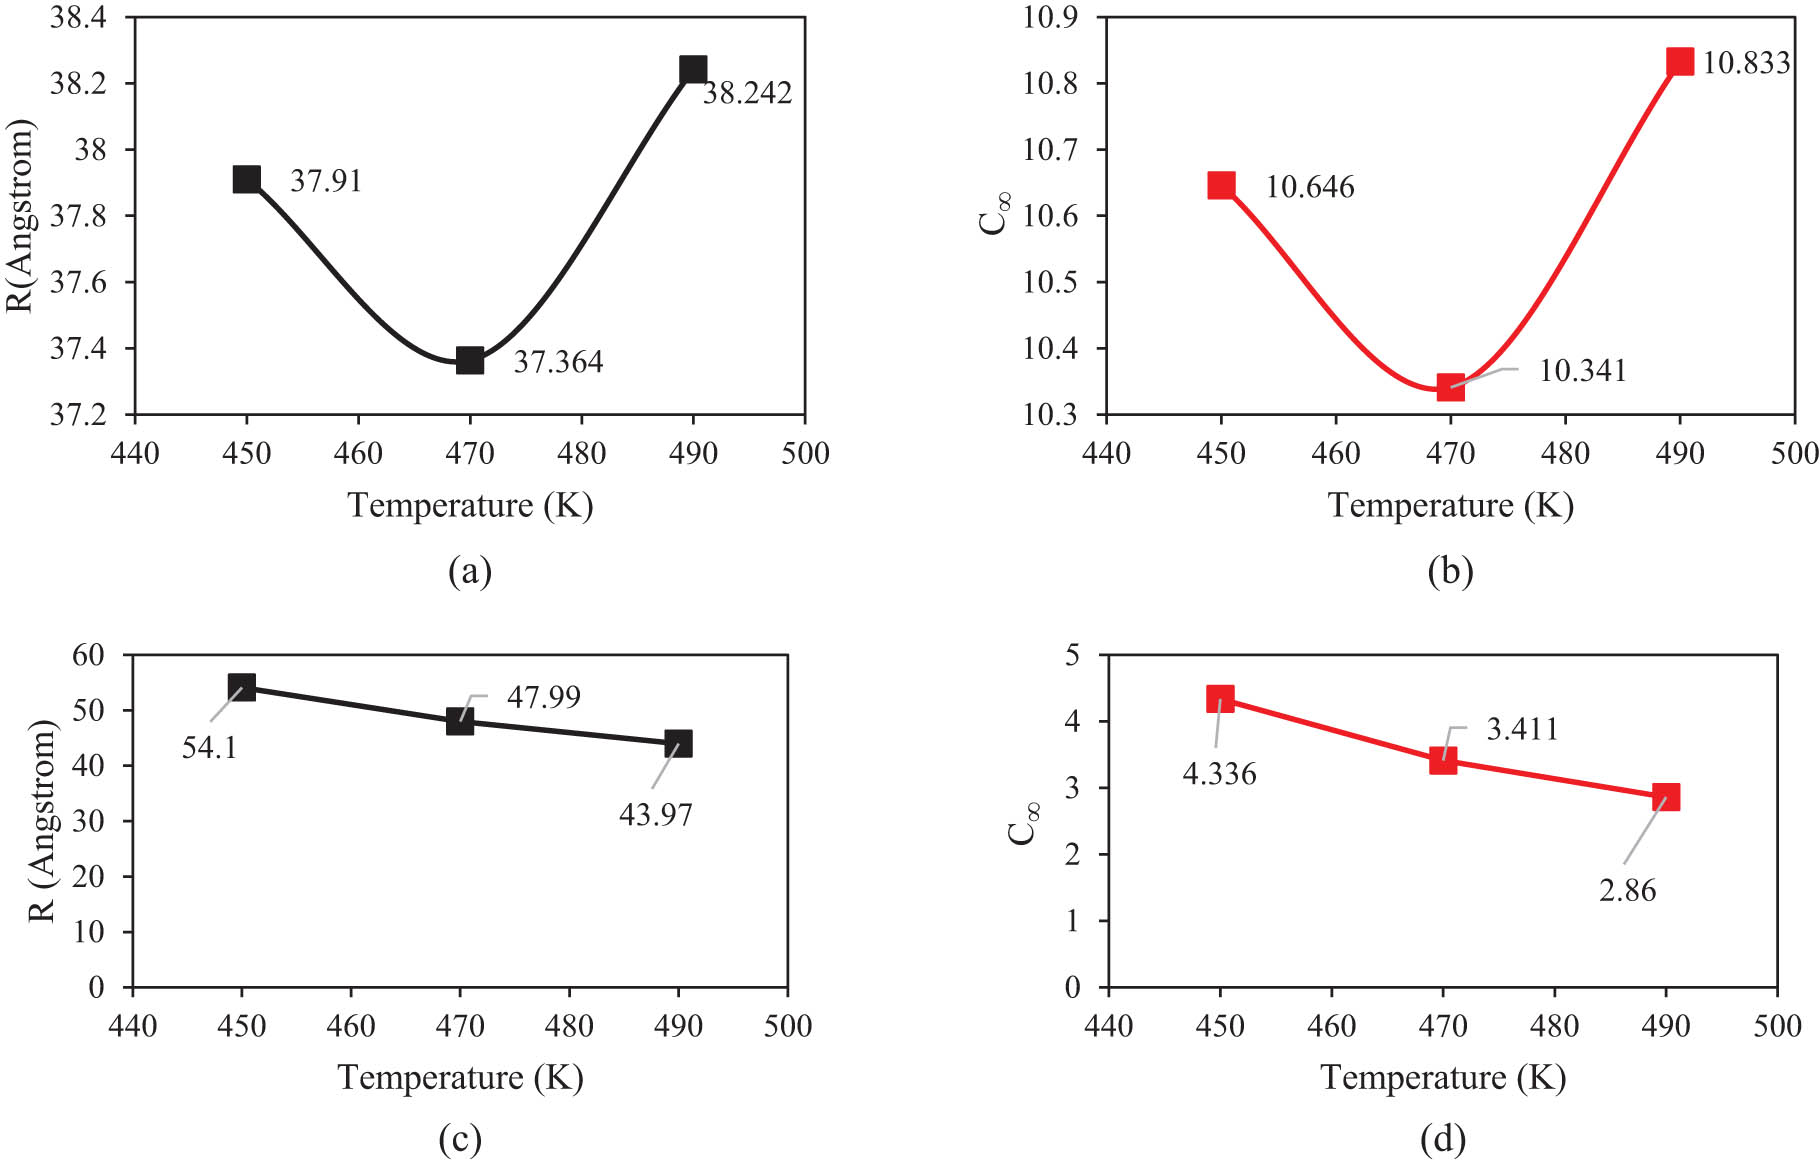
(a) R and (b) C ∞ of PE120 matrix variations in different temperatures after 15 ns. (c) R and (d) C ∞ of PE600 matrix variations in different temperatures after 15 ns.
The stability of structural performance and R parameters can be analyzed with total energy inside designed polymeric samples. This parameter plays a crucial role in describing the interactions between polymer chains. Total energy defines the energy associated with stretching, bending, and torsional movements within the polymer chains, as well as the interactions between different chains (41). MD outputs for total energy changes as a function of simulation time for the PE600 sample depicted in Figure 12a. From this figure, the energy/bead parameter converged to 32.855, 33.012, and 33.138 kcal·mol−1 at 450, 470, and 490 K, respectively. These convergencies arise from polymeric chain mobility restriction in defined conditions. Also, interaction energy value shows similar behavior as depicted in Figure 12b. This energy/bead parameter reached negative values after 15 ns (−0.778, −0.752, and −0.741 kcal·mol−1 at 450, 470, and 490 K, respectively). These negative values predicted the mean attractive force between beads in modeled systems (44,45). These calculated energies predicted the mean distance between polymeric chains in various regions of polymeric samples to get a lesser ratio by MD time passing. The C ∞ of a polymeric system after entanglement network creation has a lesser value due to the mobility of each beads increased, and this structural evolution caused the flexibility of each chain to be enlarged in defined conditions (46). On the other hand, when polymer chains become entangled with higher intensity (in the presence of a large number of monomers),they experience high attraction force. This behavior caused the conformational flexibility (47). In the current case study, the effect of the first phenomenon has more effect on the structural evolution of the PE600 system, which should be supposed in actual application. All structural properties of modeled systems are reported in Table 4.
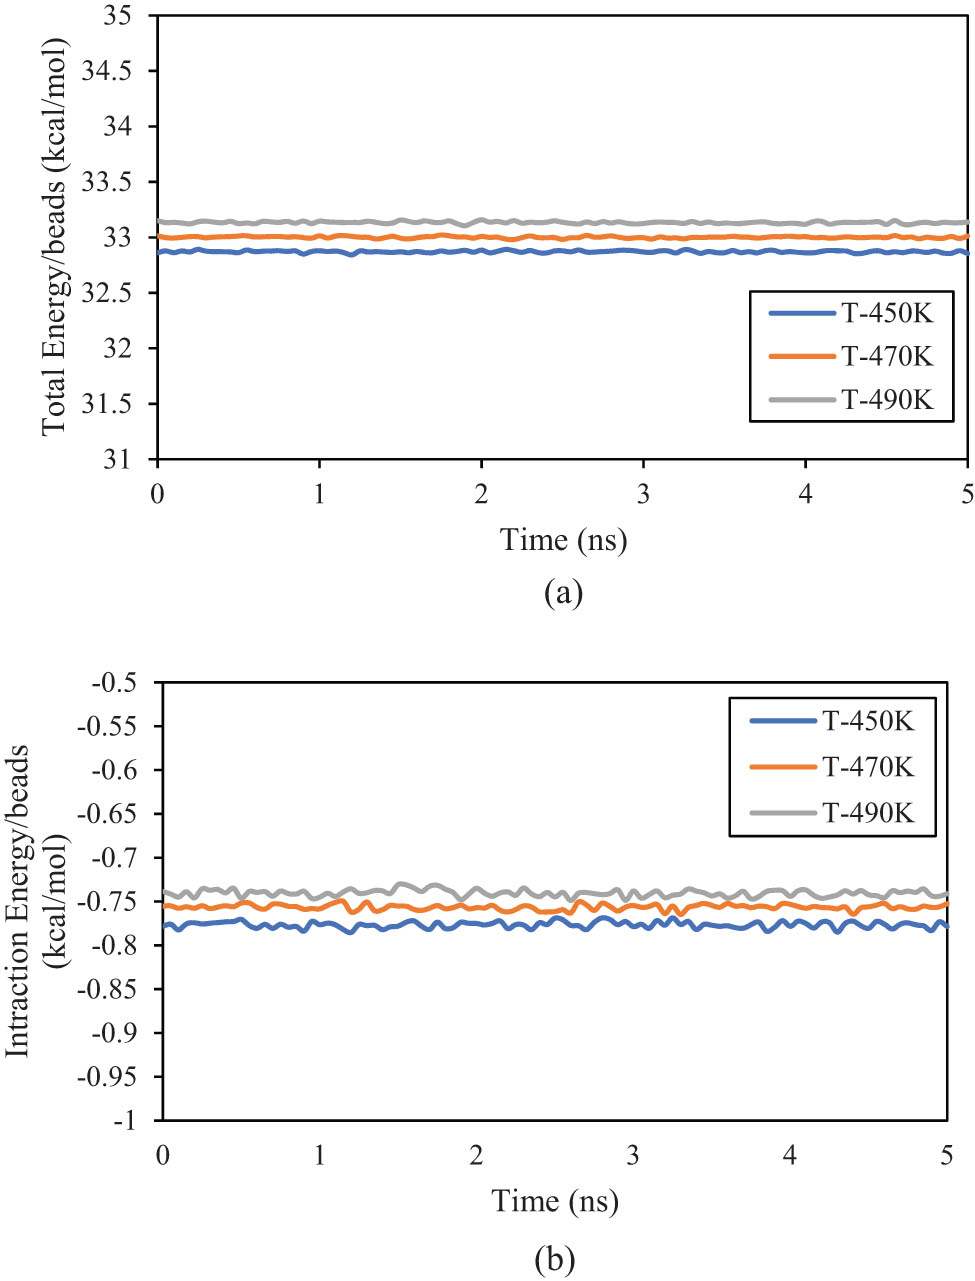
(a) Total and (b) interaction energies change as a function of MD simulation time in modeled PE600 matrices.
3.3 Dynamical properties of modeled polymeric matrices
In polymeric systems, MSD is a measure of the average squared distance that individual polymer segments or molecules move over time. It provides insight into the self-diffusion and mobility of polymeric chains within the modeled matrices. By analyzing how the MSD changes with time, researchers can characterize the dynamics of polymers, including their flexibility, entanglement, and overall motion. Computationally, this parameter is calculated by the average of (r(t) – r(0))2, where r(t) is the position of the particle at time t and r(0) is its initial position (49). Figure 13 shows the MSD outputs for PE120 and PE600 at various temperatures. It is seen that MSD increases with temperature due to the increase in thermal energy and further movement and fluctuations of the segments (50). Also, MSD of PE600 is more than twice higher than PE120 since it is well known that MSD increases with chain length (47). This atomic evolution predicted the MSD of PE120 to reach 1.459 Å2 at 490 K. Furthermore, the D parameter can be calculated with the equation D =
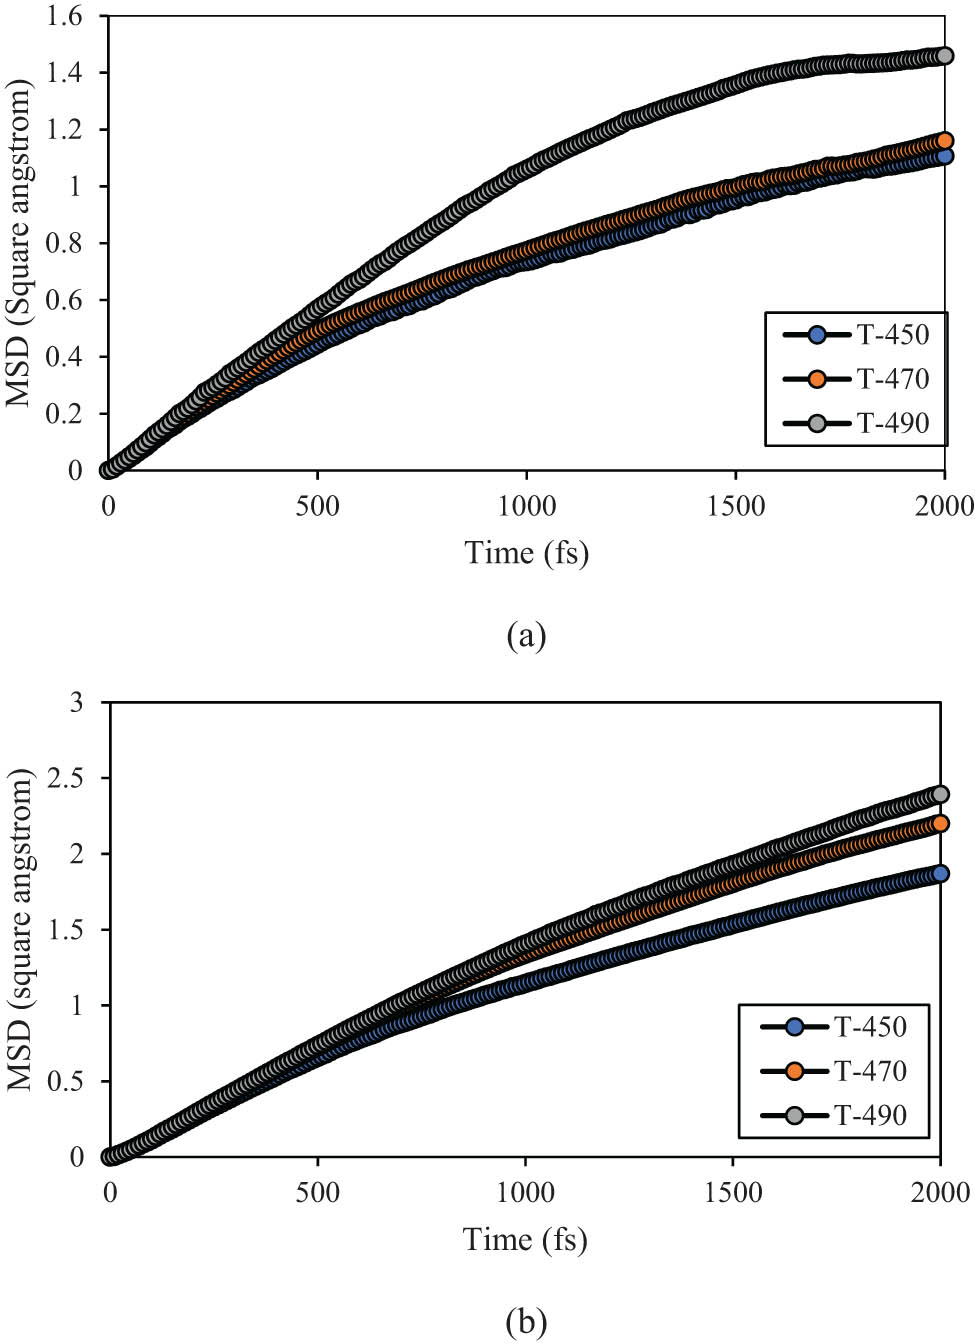
Linear section of MSD parameter vs MD time for (a) PE120 and (b) PE600 at varying temperatures.
Diffusion coefficient D of PE120 and PE600 at varying temperatures matrices after 15 ns in comparison with D values from the Rose model
| Temperature (K) | D (×10−9 m2·s−1) | |||
|---|---|---|---|---|
| PE120 | PE600 |
|
Rose model (PE120–PE600) | |
| 450 | 0.83 | 1.5 | 0.06–0.003 | 0.03–0.06 |
| 470 | 0.92 | 1.83 | NA | 0.03–0.05 |
| 490 | 1.33 | 2.00 | NA | 0.03–0.04 |
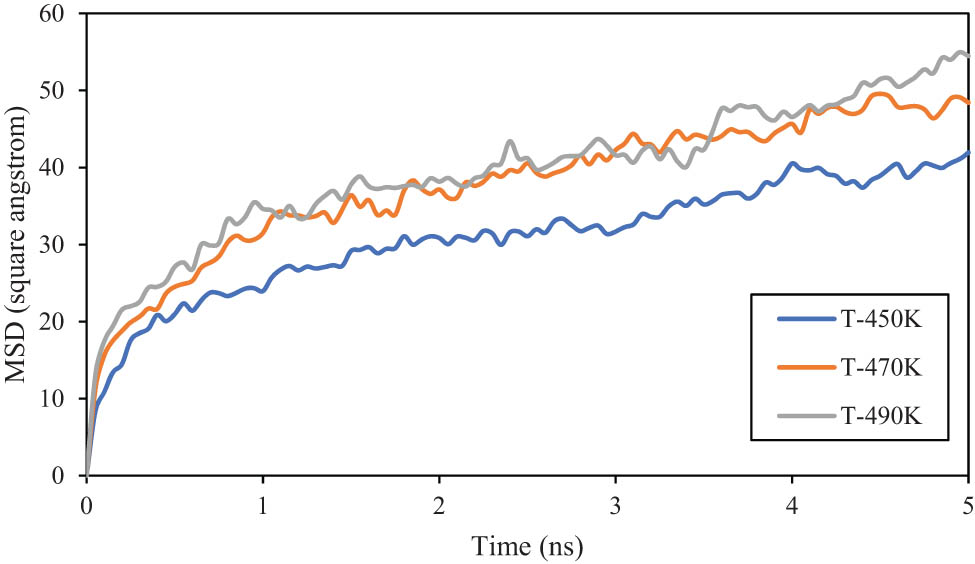
Extended curve of MSD vs MD time for PE600 matrix.
The D parameter obtained from MSD calculations deviates from the Rouse model (D =
In summary, higher temperatures facilitate more energetic collisions of polymer chains, enabling them to overcome barriers and move more freely within the polymeric system. This increased mobility at elevated temperatures leads to a higher self-diffusion coefficient for the bead-base model. From diffusion coefficient outputs and previous experimental results, the E a parameter can be calculated using E a – E a0 = ln(D/D 0) × R(T − T 0) relation (6). Here, E a and D parameters define activation energy and diffusion coefficient (55), respectively. Using the D values of Table 5, ΔE (E a – E a0) is estimated as less than 1 kcal·mol−1 when initial temperature varies from 450 to 490 K (consistent with ref. (6)).
In the final step of the current research, η 0 of various modeled structures was calculated. For this purpose, the “Green–Kubo” approach (56) as an equilibrium MD method was implemented. Here, the ensemble average of the auto-correlation of the stress/pressure tensor was used to calculate the viscosity. Furthermore, the stress tensor for each bead is given by the following formula,
where S
ab
is the stress tensor,
where a and b take on values x, y, z to create the components of the tensor. In Eq. 10, The first term is a pairwise energy contribution where n loops over the N
p neighbors of bead
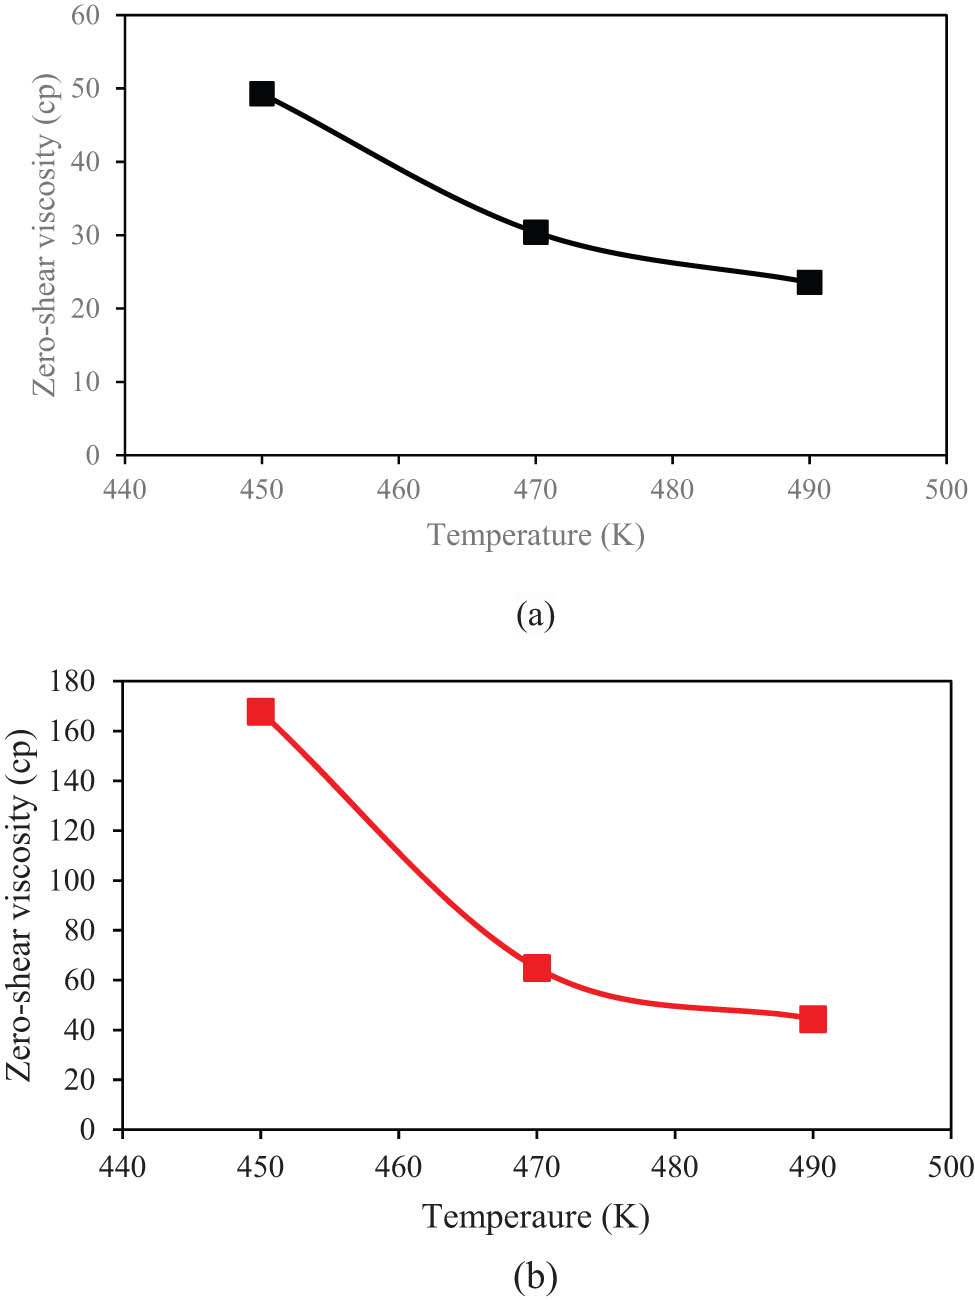
η 0 parameter changes in various temperatures using Green–Kubo methods for (a) PE120 and (b) PE600 matrices.
Viscosity outputs for PE120 and PE600 matrices from the current MD simulation and previous reports
| Matrix | Current simulation (cp) | Experimental reports (54) (cp) | Previous MD simulations (60) (cp) |
|---|---|---|---|
| PE120-450 K | 49 | 14 | 5 |
| PE120-470 K | 30 | NA | NA |
| PE120-490 K | 24 | NA | NA |
| PE600-450 K | 168 | 191 | 18 |
| PE600-470 K | 65 | NA | NA |
| PE600-490 K | 44 | NA | NA |
4 Conclusions
The static and dynamic properties of polymers are crucial in understanding the behavior of polymeric systems. Static properties, such as R g and R, provide insights into the structural arrangement and stability of polymers at rest. Dynamic properties, including MSD and η 0, reveal how polymers respond to external forces and temperature changes over time. Here, the MD approach was used to study two branched PE with 120 carbons, PE120, and 600 carbons, PE600, respectively. The former is below entanglement molecular weight, while the latter is above critical molecular weight. The simulations were performed at three initial temperatures of 450 to 490 K for 15 ns. To this purpose, R g, R, and C ∞ parameters were calculated as static analysis of the equilibrated polymeric samples. Furthermore, MSD, D, and η 0 parameters were calculated to show the dynamic behavior of them. The main outputs of the modeled structures can be listed below:
The equilibrium phase in PE120 and PE600 polymeric matrices was detected after 10 ns. Numerically, the total energy/bead of PE120 and PE600 reached to 29.860 and 32.862 kcal·mol−1 (at T 0 = 450 K). Temperature increase caused the structure evolution of these sample to intensify and the calculated energy reached 30.053 and 33.152 kcal·mol−1, respectively.
The interaction energy/bead changes inside PE120 and PE600 matrices as a function of simulation time predicted structure stability of them. The MD results showed this parameter increased to −0.778 kcal·mol−1 between various beads of the PE600 system. Physically, this behavior arises from the mean attraction force inside the computational box.
By R g and R parameter analysis, the structure evolution of PE120 and PE600 matrices was estimated. The simulations indicated that the entanglements network is intensified by molecular weight. The R g and R parameters reached 17.346 and 54.100 Å at T 0 = 450 K in long polymeric chains.
The MSD parameter outputs predicted that the amplitude of beads’ fluctuations increases with temperature. Similarly, the molecular weight caused the beads’ evolution intensity to increase. MSD parameter in the PE600 matrix converged to 54.472 Å2 after 15 ns (at T 0 = 490 K). This MSD changes caused the D of PE600 polymeric samples varies from 1.5 to 2 (×10−9 m2·s−1).
The viscosity of PE120 and PE600 matrices was affected by the defined initial conditions. All simulations show this dynamic parameter decreased/increased with temperature/molecular weight. The η 0 converged to 24 cp and 44 cp in PE120 and PE600 matrices by temperature setting to 490 K. The value of this parameter increases to 49 cp and 168 cp by decreasing the temperature to 450 K.
It is expected that these MD results can optimize the static and dynamic behavior of PE-based systems in various industrial applications.
-
Author contributions: Amirhosein Yazdanbakhsh: methodology, investigation, modeling and simulations, writing-original draft. Ghodratollah Hashemi Motlagh: resources, review & editing.
-
Conflict of interest: Authors state no conflict of interest.
References
(1) Martín S, Expósito MT, Vega JF, Martínez‐Salazar J. Microstructure and properties of branched polyethylene: application of a three‐phase structural model. J Appl Polym Sci. 2013;128:1871–8.Search in Google Scholar
(2) Walton KL. Metallocene catalyzed ethylene/alpha olefin copolymers used in thermoplastic elastomers. Rubber Chem Technol. 2004;77:552–68.Search in Google Scholar
(3) Tung LH. Melt Viscosity of polyethylene at zero shear. J Polym Sci. 1960;46:409–22.Search in Google Scholar
(4) Gupta BR. Polymer rheology- effect of various parameters. Rheol Appl Polym Process. 2022.Search in Google Scholar
(5) Padding JT, Briels WJ. Time and length scales of polymer melts studied by coarse-grained molecular dynamics simulations. J Chem Phys. 2002;117:925–43. 10.1063/1.1481859.Search in Google Scholar
(6) Wang Roger Porter JS, Wang J, Porter RS. On the viscosity-temperature behavior of polymer melts. Rheol Acta. 1995;34:496–503.Search in Google Scholar
(7) Tschoegl NW, Knauss WG, Emri I. The effect of temperature and pressure on the mechanical properties of thermo-and/or piezorheologically simple polymeric materials in thermodynamic equilibrium-a critical review. Mech Time-Depend Mat. 2002;6:53–99.Search in Google Scholar
(8) Kourtidou D, Grigora ME, Tsongas K, Terzopoulou Z, Tzetzis D, Bikiaris DN, et al. Effect of ball milling on the mechanical properties and crystallization of graphene nanoplatelets reinforced short chain branched‐polyethylene. J Appl Polym Sci. 2021;138:50874.Search in Google Scholar
(9) Baig C, Mavrantzas VG, Kröger M. Flow effects on melt structure and entanglement network of linear polymers: results from a nonequilibrium molecular dynamics simulation study of a polyethylene melt in steady shear. Macromolecules. 2010;43:6886–902. 10.1021/ma100826u.Search in Google Scholar
(10) Pan Y, Bai J, Yang G, Li Z. Progress in the research on branched polymers with emphasis on the chinese petrochemical industry. Molecules. 2023;28:7934.Search in Google Scholar
(11) Lv Y, Ruan C. Molecular dynamics simulation of nonisothermal crystallization of a single polyethylene chain and short polyethylene chains based on OPLS force field. e-Polymers. 2022;22:136–46.Search in Google Scholar
(12) Guo L, Xu H, Wu N, Yuan S, Zhou L, Wang D, et al. Molecular dynamics simulation of the effect of the thermal and mechanical properties of addition liquid silicone rubber modified by carbon nanotubes with different radii. e-Polymers. 2023;23:20228105.Search in Google Scholar
(13) Salerno KM, Agrawal A, Peters BL, Perahia D, Grest GS. Dynamics in entangled polyethylene melts. Eur Phys J: Spec Top. 2016;225:1707–22. 10.1140/epjst/e2016-60142-7.Search in Google Scholar
(14) Hagita K, Fujiwara S, Iwaoka N. Structure formation of a quenched single polyethylene chain with different force fields in united atom molecular dynamics simulations. AIP Adv. 2018;8:115108.Search in Google Scholar
(15) Ranganathan R, Kumar V, Brayton AL, Kroger M, Rutledge GC. Atomistic modeling of plastic deformation in semicrystalline polyethylene: role of interphase topology, entanglements, and chain dynamics. Macromolecules. 2020;53:4605–17.Search in Google Scholar
(16) Sgouros AP, Megariotis G, Theodorou DN. Slip-spring model for the linear and nonlinear viscoelastic properties of molten polyethylene derived from atomistic simulations. Macromolecules. 2017;50:4524–41.Search in Google Scholar
(17) Harmandaris VA, Mavrantzas VG, Theodorou DN. Atomistic molecular dynamics simulation of polydisperse linear polyethylene melts. Macromolecules. 1998;31:7934–43. 10.1021/ma980698p.Search in Google Scholar
(18) Ramos J, Peristeras LD, Theodorou DN. Monte carlo simulation of short chain branched polyolefins in the molten state. Macromolecules. 2007;40:9640–50. 10.1021/ma071615k.Search in Google Scholar
(19) Ramos J, Vega JF, Martínez-Salazar J. Molecular dynamics simulations for the description of experimental molecular conformation, melt dynamics, and phase transitions in polyethylene. Macromolecules. 2015;48:5016–27. 10.1021/acs.macromol.5b00823.Search in Google Scholar
(20) Litvinov VM, Ries ME, Baughman TW, Henke A, Matloka PP. Chain entanglements in polyethylene melts. why is it studied again? Macromolecules. 2013;46:541–7.Search in Google Scholar
(21) Martínez L, Andrade R, Birgin EG, Martínez JM. PACKMOL: a package for building initial configurations for molecular dynamics simulations. J Comput Chem. 2009;30:2157–64.Search in Google Scholar
(22) Zhang M, Lynch DT, Wanke SE. Effect of molecular structure distribution on melting and crystallization behavior of 1-butene/ethylene copolymers. Polymer. 2001;42:3067–75.Search in Google Scholar
(23) LAMMPS molecular dynamics simulator. Available From http://Lammps.Sandia.Gov/, 2017.Search in Google Scholar
(24) Binder K, Horbach J, Kob W, Paul W, Varnik F. Molecular dynamics simulations. J Phys: Condens Matter. 2004;16:S429.Search in Google Scholar
(25) Nath SK, Escobedo FA, de Pablo JJ. On the simulation of vapor–liquid equilibria for alkanes. J Chem Phys. 1998;108:9905–11.Search in Google Scholar
(26) Martin MG, Siepmann JI. Transferable potentials for phase equilibria. 1. united-atom description of n-alkanes. J Phys Chem B. 1998;102:2569–77.Search in Google Scholar
(27) Chen J-A, Chao SD. Intermolecular non-bonded interactions from machine learning datasets. Molecules. 2023;28:7900.Search in Google Scholar
(28) Wang X, Ramírez-Hinestrosa S, Dobnikar J, Frenkel D. The Lennard-Jones potential: when (not) to use it. Phys Chem Chem Phys. 2020;22:10624–33.Search in Google Scholar
(29) Toxvaerd S. Equation of state of alkanes II. J Chem Phys. 1997;107:5197–204.Search in Google Scholar
(30) Spreiter Q, Walter M. Classical molecular dynamics simulation with the velocity verlet algorithm at strong external magnetic fields. J Comput Phys. 1999;152:102–19.Search in Google Scholar
(31) Hoover WG. Canonical dynamics: equilibrium phase-space distributions. Phys Rev A. 1985;31:1695.Search in Google Scholar
(32) Behbahani AF, Vaez Allaei SM, Motlagh GH, Eslami H, Harmandaris VA. Structure, dynamics, and apparent glass transition of stereoregular poly(methyl methacrylate)/graphene interfaces through atomistic simulations. Macromolecules. 2018;51:7518–32. 10.1021/acs.macromol.8b01160.Search in Google Scholar
(33) Moorthi K, Kamio K, Ramos J, Theodorou DN. Monte Carlo simulation of short chain branched polyolefins: structure and properties. Macromolecules. 2012;45:8453–66. 10.1021/ma301322v.Search in Google Scholar
(34) Tschopp MA, Bouvard JL, Ward DK, Bammann DJ, Horstemeyer MF. Influence of ensemble boundary conditions (thermostat and barostat) on the deformation of amorphous polyethylene by molecular dynamics. arXiv preprint; 2013. arXiv:1310.0728.Search in Google Scholar
(35) Stukowski A. Visualization and analysis of atomistic simulation data with OVITO–the open visualization tool. Model Simul Mat Sci Eng. 2009;18:015012.Search in Google Scholar
(36) Alnaimi S, Elouadi B, Kamal I. Structural, thermal and morphology characteristics of low density polyethylene produced by QAPCO. Proceedings of the Proceedings of the 8th international symposium on inorganic phosphate materials. Agadir, Morocco: 2015. p. 13–9.Search in Google Scholar
(37) Brandell D, Liivat A, Aabloo A, Thomas JO. Molecular dynamics simulation of the crystalline short-chain polymer system LiPF 6 PEO 6 (M W∼ 1000). J Mater Chem. 2005;15:4338–45.Search in Google Scholar
(38) Vega-Paz A, Palomeque-Santiago JF, Victorovna Likhanova N. Polymer weight determination from numerical and experimental data of the reduced viscosity of polymer in brine. Rev Mexicana de Fis. 2019;65:321–7. 10.31349/REVMEXFIS.65.321.Search in Google Scholar
(39) Men Y, Rieger J, Lindner P, Enderle H-F, Lilge D, Kristen MO, et al. Structural changes and chain radius of gyration in cold-drawn polyethylene after annealing: small-and wide-angle X-ray scattering and small-angle neutron scattering studies. J Phys Chem B. 2005;109:16650–7.Search in Google Scholar
(40) Andrews J, Blaisten-Barojas E. Exploring with molecular dynamics the structural fate of PLGA oligomers in various solvents. J Phys Chem B. 2019;123:10233–44. 10.1021/acs.jpcb.9b06681.Search in Google Scholar
(41) Jiang Z, Dou W, Sun T, Shen Y, Cao D. Effects of chain flexibility on the conformational behavior of a single polymer chain. J Polym Res. 2015;22:1–9.Search in Google Scholar
(42) Smith GD, Yoon DY, Jaffe RL, Colby RH, Krishnamoorti R, Fetters LJ. Conformations and structures of poly(oxyethylene) melts from molecular dynamics simulations and small-angle neutron scattering experiments. Macromolecules. 1996;29:3462–9.Search in Google Scholar
(43) Shukla GP, Bhatnagar MC. Study the synthesis parameter of tin oxide nanostructure. J Mater Sci Eng B. 2015;5:353.Search in Google Scholar
(44) Ruzette A-VG, Mayes AM. A simple free energy model for weakly interacting polymer blends. Macromolecules. 2001;34:1894–907.Search in Google Scholar
(45) Lu DR, Lee SJ, Park K. Calculation of solvation interaction energies for protein adsorption on polymer surfaces. J Biomater Sci Polym Ed. 1992;3:127–47.Search in Google Scholar
(46) Grijpma DW, Penning JP, Pennings AJ. Chain entanglement, mechanical properties and drawability of poly (lactide). Colloid Polym Sci. 1994;272:1068–81.Search in Google Scholar
(47) Wu S. Predicting chain conformation and entanglement of polymers from chemical structure. Polym Eng Sci. 1992;32:823–30.Search in Google Scholar
(48) Behbahani FA, Vaez Allaei SM, Motlagh HG, Eslami H, Harmandaris VA. Structure and dynamics of stereo-regular poly(methyl-methacrylate) melts through atomistic molecular dynamics simulations. Soft Matter. 2018;14:1449–64. 10.1039/c7sm02008b.Search in Google Scholar
(49) Sarmiento-Gomez E, Santamaría-Holek I, Castillo R. Mean-square displacement of particles in slightly interconnected polymer networks. J Phys Chem B. 2014;118:1146–58.Search in Google Scholar
(50) Hirata F. On the interpretation of the temperature dependence of the mean square displacement (MSD) of protein, obtained from the incoherent neutron scattering. J Mol Liq. 2018;270:218–26. 10.1016/J.MOLLIQ.2018.01.096.Search in Google Scholar
(51) Ramos J, Vega JF, Martínez-Salazar J. Assessment of entanglement features and dynamics from atomistic simulations and experiments in linear and short chain branched polyolefins. Soft Matter. 2012;8:6256–63. 10.1039/c2sm25104c.Search in Google Scholar
(52) Huster D, Schiller J, Naji L, Kaufmann J, Arnold K. NMR studies of cartilage–dynamics, diffusion, degradation. Molecules in interaction with surfaces and interfaces. Berlin Heidelberg: Springer; 2004. p. 465–503.Search in Google Scholar
(53) Padding JT, Briels WJ. Uncrossability constraints in mesoscopic polymer melt simulations: non-rouse behavior of C120H242. J Chem Phys. 2001;115:2846–59. 10.1063/1.1385162.Search in Google Scholar
(54) Pearson DS, Ver Strate G, Von Meerwall E, Schilling FC. Viscosity and self-diffusion coefficient of linear polyethylene. Macromolecules. 1987;20:1133–41.Search in Google Scholar
(55) McKenna GB. Differences in the molecular weight and the temperature dependences of self-diffusion and zero shear viscosity in linear polyethylene and hydrogenated polybutadiene. Polymer. 1985;26:1651–3.Search in Google Scholar
(56) Pavliotis GA. Asymptotic analysis of the Green–Kubo formula. IMA J Appl Math. 2010;75:951–67.Search in Google Scholar
(57) Laun M, Auhl D, Brummer R, Dijkstra DJ, Gabriel C, Mangnus MA, et al. Guidelines for checking performance and verifying accuracy of rotational rheometers: viscosity measurements in steady and oscillatory shear (iupac technical report). Pure Appl Chem. 2014;86:1945–68.Search in Google Scholar
(58) Santos FKG, Dantas Filho AN, Leite RHL, Aroucha EMM, Santos AG, Oliveira TA. Rheological and some physicochemical characteristics of selected floral honeys from plants of caatinga. Acad Bras Cienc. 2014;86:981–94.Search in Google Scholar
(59) Saki TA, Sweah ZJ, Bahili MA. Effect of maleated polyethylene wax on mechanical and rheological properties of ldpe/starch blends. Trop J Nat Product Res. 2021;5:1060–5. 10.26538/tjnpr/v5i6.13.Search in Google Scholar
(60) Mondello M, Grest GS, Webb III EB, Peczak P. Dynamics of N-alkanes: comparison to rouse model. J Chem Phys. 1998;109:798–805.Search in Google Scholar
© 2024 the author(s), published by De Gruyter
This work is licensed under the Creative Commons Attribution 4.0 International License.
Articles in the same Issue
- Research Articles
- Flame-retardant thermoelectric responsive coating based on poly(3,4-ethylenedioxythiphene) modified metal–organic frameworks
- Highly stretchable, durable, and reversibly thermochromic wrapped yarns induced by Joule heating: With an emphasis on parametric study of elastane drafts
- Molecular dynamics simulation and experimental study on the mechanical properties of PET nanocomposites filled with CaCO3, SiO2, and POE-g-GMA
- Multifunctional hydrogel based on silk fibroin/thermosensitive polymers supporting implant biomaterials in osteomyelitis
- Marine antifouling coating based on fluorescent-modified poly(ethylene-co-tetrafluoroethylene) resin
- Preparation and application of profiled luminescent polyester fiber with reversible photochromism materials
- Determination of pesticide residue in soil samples by molecularly imprinted solid-phase extraction method
- The die swell eliminating mechanism of hot air assisted 3D printing of GF/PP and its influence on the product performance
- Rheological behavior of particle-filled polymer suspensions and its influence on surface structure of the coated electrodes
- The effects of property variation on the dripping behaviour of polymers during UL94 test simulated by particle finite element method
- Experimental evaluation on compression-after-impact behavior of perforated sandwich panel comprised of foam core and glass fiber reinforced epoxy hybrid facesheets
- Synthesis, characterization and evaluation of a pH-responsive molecular imprinted polymer for Matrine as an intelligent drug delivery system
- Twist-related parametric optimization of Joule heating-triggered highly stretchable thermochromic wrapped yarns using technique for order preference by similarity to ideal solution
- Comparative analysis of flow factors and crystallinity in conventional extrusion and gas-assisted extrusion
- Simulation approach to study kinetic heterogeneity of gadolinium catalytic system in the 1,4-cis-polyisoprene production
- Properties of kenaf fiber-reinforced polyamide 6 composites
- Cellulose acetate filter rods tuned by surface engineering modification for typical smoke components adsorption
- A blue fluorescent waterborne polyurethane-based Zn(ii) complex with antibacterial activity
- Experimental investigation on damage mechanism of GFRP laminates embedded with/without steel wire mesh under low-velocity-impact and post-impact tensile loading
- Preparation and application research of composites with low vacuum outgassing and excellent electromagnetic sealing performance
- Assessing the recycling potential of thermosetting polymer waste in high-density polyethylene composites for safety helmet applications
- Mesoscale mechanics investigation of multi-component solid propellant systems
- Preparation of HTV silicone rubber with hydrophobic–uvioresistant composite coating and the aging research
- Experimental investigation on tensile behavior of CFRP bolted joints subjected to hydrothermal aging
- Structure and transition behavior of crosslinked poly(2-(2-methoxyethoxy) ethylmethacrylate-co-(ethyleneglycol) methacrylate) gel film on cellulosic-based flat substrate
- Mechanical properties and thermal stability of high-temperature (cooking temperature)-resistant PP/HDPE/POE composites
- Preparation of itaconic acid-modified epoxy resins and comparative study on the properties of it and epoxy acrylates
- Synthesis and properties of novel degradable polyglycolide-based polyurethanes
- Fatigue life prediction method of carbon fiber-reinforced composites
- Thermal, morphological, and structural characterization of starch-based bio-polymers for melt spinnability
- Robust biaxially stretchable polylactic acid films based on the highly oriented chain network and “nano-walls” containing zinc phenylphosphonate and calcium sulfate whisker: Superior mechanical, barrier, and optical properties
- ARGET ATRP of styrene with low catalyst usage in bio-based solvent γ-valerolactone
- New PMMA-InP/ZnS nanohybrid coatings for improving the performance of c-Si photovoltaic cells
- Impacts of the calcinated clay on structure and gamma-ray shielding capacity of epoxy-based composites
- Preparation of cardanol-based curing agent for underwater drainage pipeline repairs
- Preparation of lightweight PBS foams with high ductility and impact toughness by foam injection molding
- Gamma-ray shielding investigation of nano- and microstructures of SnO on polyester resin composites: Experimental and theoretical study
- Experimental study on impact and flexural behaviors of CFRP/aluminum-honeycomb sandwich panel
- Normal-hexane treatment on PET-based waste fiber depolymerization process
- Effect of tannic acid chelating treatment on thermo-oxidative aging property of natural rubber
- Design, synthesis, and characterization of novel copolymer gel particles for water-plugging applications
- Influence of 1,1′-Azobis(cyclohexanezonitrile) on the thermo-oxidative aging performance of diolefin elastomers
- Characteristics of cellulose nanofibril films prepared by liquid- and gas-phase esterification processes
- Investigation on the biaxial stretching deformation mechanism of PA6 film based on finite element method
- Simultaneous effects of temperature and backbone length on static and dynamic properties of high-density polyethylene-1-butene copolymer melt: Equilibrium molecular dynamics approach
- Research on microscopic structure–activity relationship of AP particle–matrix interface in HTPB propellant
- Three-layered films enable efficient passive radiation cooling of buildings
- Electrospun nanofibers membranes of La(OH)3/PAN as a versatile adsorbent for fluoride remediation: Performance and mechanisms
- Preparation and characterization of biodegradable polyester fibers enhanced with antibacterial and antiviral organic composites
- Preparation of hydrophobic silicone rubber composite insulators and the research of anti-aging performance
- Surface modification of sepiolite and its application in one-component silicone potting adhesive
- Study on hydrophobicity and aging characteristics of epoxy resin modified with nano-MgO
- Optimization of baffle’s height in an asymmetric twin-screw extruder using the response surface model
- Effect of surface treatment of nickel-coated graphite on conductive rubber
- Experimental investigation on low-velocity impact and compression after impact behaviors of GFRP laminates with steel mesh reinforced
- Development and characterization of acetylated and acetylated surface-modified tapioca starches as a carrier material for linalool
- Investigation of the compaction density of electromagnetic moulding of poly(ether-ketone-ketone) polymer powder
- Experimental investigation on low-velocity-impact and post-impact-tension behaviors of GFRP T-joints after hydrothermal aging
- The repeated low-velocity impact response and damage accumulation of shape memory alloy hybrid composite laminates
- Exploring a new method for high-performance TPSiV preparation through innovative Si–H/Pt curing system in VSR/TPU blends
- Large-scale production of highly responsive, stretchable, and conductive wrapped yarns for wearable strain sensors
- Preparation of natural raw rubber and silica/NR composites with low generation heat through aqueous silane flocculation
- Molecular dynamics simulation of the interaction between polybutylene terephthalate and A3 during thermal-oxidative aging
- Crashworthiness of GFRP/aluminum hybrid square tubes under quasi-static compression and single/repeated impact
- Review Articles
- Recent advancements in multinuclear early transition metal catalysts for olefin polymerization through cooperative effects
- Impact of ionic liquids on the thermal properties of polymer composites
- Recent progress in properties and application of antibacterial food packaging materials based on polyvinyl alcohol
- Additive manufacturing (3D printing) technologies for fiber-reinforced polymer composite materials: A review on fabrication methods and process parameters
- Rapid Communication
- Design, synthesis, characterization, and adsorption capacities of novel superabsorbent polymers derived from poly (potato starch xanthate-graft-acrylamide)
- Special Issue: Biodegradable and bio-based polymers: Green approaches (Guest Editors: Kumaran Subramanian, A. Wilson Santhosh Kumar, and Venkatajothi Ramarao)
- Development of smart core–shell nanoparticles-based sensors for diagnostics of salivary alpha-amylase in biomedical and forensics
- Thermoplastic-polymer matrix composite of banana/betel nut husk fiber reinforcement: Physico-mechanical properties evaluation
- Special Issue: Electrospun Functional Materials
- Electrospun polyacrylonitrile/regenerated cellulose/citral nanofibers as active food packagings