Research on microscopic structure–activity relationship of AP particle–matrix interface in HTPB propellant
-
Zijie Zou
 ,
Hongfu Qiang
,
Hongfu Qiang

Abstract
The matrix and particle interface of hydroxyl-terminated polybutadiene (HTPB) propellant is the weakest part of its mechanical properties, making it prone to dewetting damage and destroying the structural integrity of the propellant. This article uses nano-indentation, gas cluster ion beam etching, and X-ray photoelectron spectroscopy experimental analyses to study the physicochemical properties of the interface and subsequently construct a microscopic model for the HTPB matrix and ammonium perchlorate particle interface. The model fully considers the existing forms of curing agent toluene diisocyanate, bonding agent Tris (2-methyl-aziridine) phosphine oxide (MAPO), and the aging products of the propellant in the interface structure. Meanwhile, the physicochemical properties, mechanical properties, and adhesive properties of the interface under different tensile loading conditions were analyzed. The results indicate that the bonding agent MAPO significantly enhances the mechanical and adhesive properties of the interface. The interface is sensitive to changes in temperature and tensile rate, and the aged interface is more fragile.
1 Introduction
Hydroxyl-terminated polybutadiene (HTPB) propellant is formed by HTPB matrix and many ammonium perchlorate (AP) particles, Aluminum (Al) particles, and other fillers. During the production process of the propellant, the matrix will soak and solidify on the surface of the fillers, forming an interface that combines the two substances into a whole. However, the particle–matrix interface is a relatively weak feature of the mechanical properties of propellant. The phenomenon of particle and matrix separation caused by interface damage is called dewetting, which is the most common and influential form of damage to the mechanical properties of propellant.
Molecular dynamics (MD) method is an effective tool for simulating physical and chemical processes at the atomic scale of materials. In recent years, more and more studies have applied MD simulation to propellant materials, bringing new research methods for microscale analysis of propellants. As early as 1957, Alder and Wainwright first used the MD method for numerical simulation calculation (1). Kendrick et al. reported the MD simulation of the interaction between HMX (cyclotetramethylene-tetranitramine) and hydroxyl-terminated poly-3-nitratomethyl-3-methyloxetane (2). The University of Illinois has been using the MD method to simulate composite solid propellant since 1997 (3,4,5). Zhang et al. found from binding energy calculations that there is a strong hydrogen bonding interaction between GAP (glycidyl azide polymer)–PDMH (3-propargyl-5,5-dimethylhydantoin) adhesive and filler (6). Lan et al. and Fu et al. studied the interaction between polyethylene glycol, HTPB, and Al particles and obtained their binding energies (7,8). Jiao et al. simulated the interface effect of bonding agent on HTPB, Al, and Al2O3 and found that the adsorption energy of bonding agent on Al2O3 surface is higher than that of HTPB on Al2O3 surface, and the higher the adsorption energy, the better the mechanical properties (9). Zhu et al. studied the binding energy between AP and HMX and found that the binding energy first increased with the increase in temperature and then decreased (10). Dong et al. studied the mechanical properties of the AP/HTPB interface under different strain rates and found that the interface strength increased with the increase in strain rate (11). Zhang and Luo found that MAPO with two degrees of cross-linking has the most significant enhancement effect on the interface (12). Segurado and Llorca as well as Shoukry et al. studied a random sequential adsorption algorithm for generating the microstructure model of granular packing (13,14). Yu et al. used MD to find that increasing the relative molecular weight of neutral polymeric bonding agents (NPBA), reducing the processing temperature, and increasing the amount of NPBA can all exacerbate the phase separation degree of NPBA in energetic plasticizer (15).
It can be seen that the MD method can accurately analyze the performance of the interface. Therefore, this article uses microscopic experiments and MD simulation to research the microstructure, mechanical properties, and adhesive properties of the interface in different states. This study aims to provide reference for formula optimization of propellant, improving the processing technology and evaluating the damage of the propellant. Compared to existing research work, this article has improved the accuracy and scale of interface model and provided a more comprehensive analysis of interface performance under different conditions. And microexperiments were conducted to prove the reliability of the simulation results.
2 Interface microscopic characterization experiment
2.1 Nano-indentation experiment
Due to the size of AP particles generally ranging from tens to hundreds of micrometers, they cannot be directly used to produce interface specimen. Therefore, the method of evaporative crystallization is used to produce large-sized single-crystal AP test blocks instead of AP particles, as shown in Figure 1. First, dissolve the AP powder in distilled water and place it in an oven to evaporate the water and precipitate blocky AP single crystals. Use a blade to trim the irregular edges of the single crystals into a 5 mm × 5 mm × 1 mm single-crystal AP test block. Then, apply a layer of uniformly mixed HTPB matrix on the AP test block. The matrix contains three components: adhesive HTPB (91.34%), curing agent toluene diisocyanate (TDI) (7.66%), and bonding agent MAPO (1%). Subsequently, the test block was placed in a drying box at 50°C and cured for 7 days. After curing, cut the test block in the middle to obtain a cross-section of the interface.

Single-crystal AP test block.
The nano-indentation instrument was used to measure the modulus and indentation hardness at different positions of the interface. The following parameters were employed for the experimental condition: load control mode, a triangular diamond pressure needle (tip curvature radius less than 20 nm), maximum load of 2 mN, holding time of 10 s, and surface contact rate of 20 nm·s−1. When the contact stiffness reaches 200 N·m−1, it is considered to have contacted the sample surface. The thermal drift rate is 0.1 nm·s−1, and the loading time is 15 s. The pressure point setting in the interface area is shown in Figure 2, and the spacing between adjacent test points is 50 µm longitudinally and 70 µm horizontally. The indentation modulus and indentation hardness at different positions in the interface area are shown in Table 1.

Nano-indentation experimental points.
Mechanical properties of the indentation points
| Type | Number | Maximum loading (mN) | Maximum indentation depth (nm) | Modulus (MPa) | Hardness(MPa) |
|---|---|---|---|---|---|
| Matrix | 1 | 1.890 | 7,602.85 | 13.175 | 4.075 |
| 2 | 1.924 | 6,206.06 | 19.878 | 8.679 | |
| 3 | 1.913 | 6,098.24 | 20.540 | 9.487 | |
| Average | 1.909 | 6,635.72 | 17.864 | 7.414 | |
| Interface | 4 | 1.907 | 1,960.32 | 4,283.192 | 19.831 |
| 5 | 1.915 | 1,907.39 | 3,967.958 | 21.113 | |
| 6 | 1.931 | 2,863.27 | 3,353.412 | 9.335 | |
| Average | 1.918 | 2,243.66 | 3,868.187 | 16.760 | |
| AP | 7 | 1.932 | 877.83 | 25,320.561 | 99.454 |
| 8 | 1.924 | 504.96 | 29,270.893 | 307.712 | |
| 9 | 1.922 | 191.71 | 40,040.755 | 2,752.941 | |
| Average | 1.926 | 524.83 | 31,544.070 | 1,053.369 |
From Table 1, there are significant differences in the modulus and hardness of the three types of areas. Among them, numbers 1–3 are near the matrix side, with the deepest indentation and the smallest modulus and hardness, indicating that it is the HTPB matrix. Numbers 7–9 represent the far AP particle side, with the shallowest indentation and highest modulus and hardness, indicating AP text block. The depth, modulus, and hardness of areas 4–6 are all located between the first two, indicating the interface area. The indentation modulus and hardness of the interface region are two orders of magnitude higher than those of the matrix, but one order of magnitude lower than those of AP filler, indirectly indicating that the interface is a special region with unique mechanical properties.
2.2 GCIB etching and X-ray photoelectron spectroscopy (XPS) analysis experiment
The GCIB method pressurizes and accelerates the cluster gas ion source, performs impact etching on the sample surface, and then quantitatively analyzes the elements on the etched sample surface using XPS.
Using tweezer to peel off AP from the specimens. The residual AP on the surface is removed by washing the matrix cross-section with water. GCIB and XPS were used to analyze the depth distribution of characteristic elements such as C, O, N, Cl, and P in the interface layer of the exposed adhesive matrix/AP filler interface.
It can be observed that Cl element unique to AP appeared on the side of the matrix cross-section, which is related to the mutual permeation and migration between AP and the matrix at the interface layer. The interface is a special area that combines both the matrix and AP, which is consistent with the conclusion obtained from the nano-indentation experiment. As the etching depth increases, there are significant differences in the distribution of each element content, confirming the existence of gradient changes in the elements at the interface. The overall trend is that as the etching depth increases, the C and P elements approximately show a power function trend of rapid increase followed by a gentle change, while the O, N, and Cl elements show a power function trend of rapid decrease followed by a gentle change. This is consistent with the stacking relationship of the interface specimens. When the etching depth is less than 50 nm, the changes in the content of each element are relatively large, while when the etching depth exceeds 50 nm, it tends to be flat. Based on the equilibrium point of the gradient changes of each element, the interface thickness on the matrix side is estimated to be about 50 nm (Figure 3). If the interface layer thickness of the AP side section is considered, the estimated total thickness of the interface layer is about 1 µm.

Variation in element content with depth: (a) C, (b) O, (c) N, (d) Cl, and (e) P.
3 Basic HTPB/AP interface
3.1 Construction of the HTPB matrix model
The previous experimental results show that HTPB contains three types of isomeric butadiene monomer structures, namely, cis, trans, and vinyl, with a proportion of approximately 2.7:5.3:2 (16). To balance the accuracy of the model and computational efficiency, a HTPB single-chain model with 50 chain links is constructed by Material studio 2020, as shown in Figure 4. Three types of heterogeneous butadiene are randomly cross-linked to generate the HTPB50 polymer chain. Using the HTPB50 polymer chain as the basic component, an amorphous cell containing ten HTPB50 chains is constructed. After the single cell is expanded (3, 3, 2) times in directions (u, v, w), a HTPB supercell that contains 180 HTPB50 is constructed as the matrix for the interface model construction. The average single-chain relative molecular weight is 2,734 (actual 2,500–5,000), with a density of 0.8436 g·cm−3 (actual 0.91 g·cm−3), which is not significantly different from the actual value. To ensure the rationality and stability of the model structure, geometric optimization and 1 ns NPT (three directional pressure of 0.1 MPa, 298 K) relaxation were performed on the model at each stage under the pcff force field.

HTPB matrix modeling process: (a) HTPB chemical formula; (b) cis, trans, and vinyl butadiene; (c) single HTPB polymer chain; (d) HTPB cell; and (e) HTPB supercell.
3.2 Construction of the AP filler model
The literature indicates that there are two possible crystal forms of AP, PNMA, and PNA21, which can transform into each other under certain conditions. PNMA is the more stable crystal form (17,18). After experimental and theoretical research, the stability order of AP surface is (001) > (210) > (101) > (100) > (011) when no molecules adsorbed on the surface. When molecules are adsorbed, the stability order of the AP surface is (210) > (001) > (101) > (011) > (100) (19). Based on this, the AP crystal is cleaved in the direction of (001), one of the strongest crystal planes. To build a surface with a thickness of 30 Å and longer than non-bond cutoff distances, the AP matrix can be constructed by repeating the AP surface in u and v directions (10,13) times. Finally, a zero-thickness vacuum layer is applied in the w direction. As shown in Figure 5, the AP (001) surface supercell is constructed as a filler for interface model construction.

AP solid particle modeling process: (a) AP cell and (b) AP super cell.
3.3 Construction of the HTPB/AP interface model
The HTPB supercell and AP surface supercell are used to construct the HTPB/AP interface, which is named Model I. Then, a 15 nm vacuum layer is applied on the upper of HTPB to prevent computational interference caused by periodic boundaries. Since the basic pcff force field does not include AP potential function and based on the research of Zhu et al. and Yeh and Andzelm the AP parameter is added to the pcff force field (20,21). To form an interface between the HTPB matrix and AP filler and to better cross the barrier between local minima on the potential energy surface, the interface model is subjected to five cycles of annealing treatment. Which means that the model will be heated from 298 to 598 K and then cooled to 298 K at intervals of 100 K under the NPT ensemble, and cycled 5 times. This annealing process basically eliminated the local unreasonable structures generated in the construction of the model. Finally, the model was insulated at 298 K for 1 ns and subjected to an energy minimization treatment. As a result, the interface is in a stable configuration with the lowest energy, providing a reasonable structure for the next step. As shown in Figure 6, during the relaxation process, the matrix spontaneously adsorbs with AP. The relevant physicochemical information of Model I is shown in Tables 2 and 3.

HTPB/AP interface modeling process: (a) density curve and (b) interface layer division.
Physical parameters of the interface model
| Number | Model size (length × width × height) (nm × nm × nm) | Total number of atoms | Single-chain average relative molecular weight | Density of matrix (g·cm−3) |
|---|---|---|---|---|
| Ⅰ | 9.209 × 7.888 × 16.349 | 111,520 | 2,734 | 0.843 |
| Ⅱa | 9.200 × 7.880 × 17.848 | 114,940 | 2,734 | 0.866 |
| Ⅱb | 9.198 × 7.878 × 18.042 | 114,940 | 3,548 | 0.872 |
| Ⅱc | 9.195 × 7.875 × 17.797 | 114,940 | 4,800.6 | 0.873 |
| Ⅱd | 9.204 × 7.883 × 17.993 | 114,940 | 7,270 | 0.878 |
| Ⅱe | 9.174 × 7.857 × 18.276 | 114,940 | 9,602 | 0.877 |
| Ⅲa | 9.206 × 7.885 × 19.698 | 126,460 | 5,926.6 | 0.908 |
| Ⅲb | 9.208 × 7.886 × 21.138 | 137,980 | 6,212.6 | 0.924 |
| Ⅲc | 9.206 × 7.885 × 22.900 | 149,500 | 6,356.6 | 0.936 |
| Ⅲd | 9.204 × 7.883 × 24.604 | 161,020 | 6,571.6 | 0.941 |
| Ⅲe | 9.195 × 7.875 × 25.994 | 172,540 | 6,786.6 | 0.924 |
Chemical parameters of the interface model
| Number | Cross-link density/(10−6 mol·cm−3) | Content of HTPB (%) | Content of TDI (%) | Content of MAPO (%) |
|---|---|---|---|---|
| Ⅰ | 0 | 100 | 0 | 0 |
| Ⅱa | 0 | 93.90 | 6.10 | 0 |
| Ⅱb | 1.28 | 93.90 | 6.10 | 0 |
| Ⅱc | 2.54 | 93.90 | 6.10 | 0 |
| Ⅱd | 5.09 | 93.90 | 6.10 | 0 |
| Ⅱe | 8.83 | 93.90 | 6.10 | 0 |
| Ⅲa | 2.32 | 81.72 | 5.32 | 12.96 |
| Ⅲb | 2.16 | 72.42 | 4.71 | 22.87 |
| Ⅲc | 2.00 | 65.02 | 4.23 | 30.75 |
| Ⅲd | 1.86 | 58.99 | 3.84 | 37.17 |
| Ⅲe | 1.77 | 53.98 | 3.51 | 42.51 |
3.4 Analysis of HTPB/AP interface performance
To determine the interface stretching length, the density distribution of Model I along the w direction was calculated. In Figure 7, the density in the w direction of the model can be roughly divided into three sections, with the lower density section being the matrix and the higher density section being the AP filler. The density curve between the two has a cross-transition area, which is the interface. According to statistics, the interface thickness is about 7 Å, which is about 143 times smaller than the experimental value. The main reason for this significant deviation is:
The constructed AP cell and matrix cell do not have initial surface defects, making it difficult for them to penetrate and migrate to form a thicker interface area;
The constructed interface model has a volume difference of 1017 times compared to the experimental specimen, and the thickness of the interface may have a significant size effect.
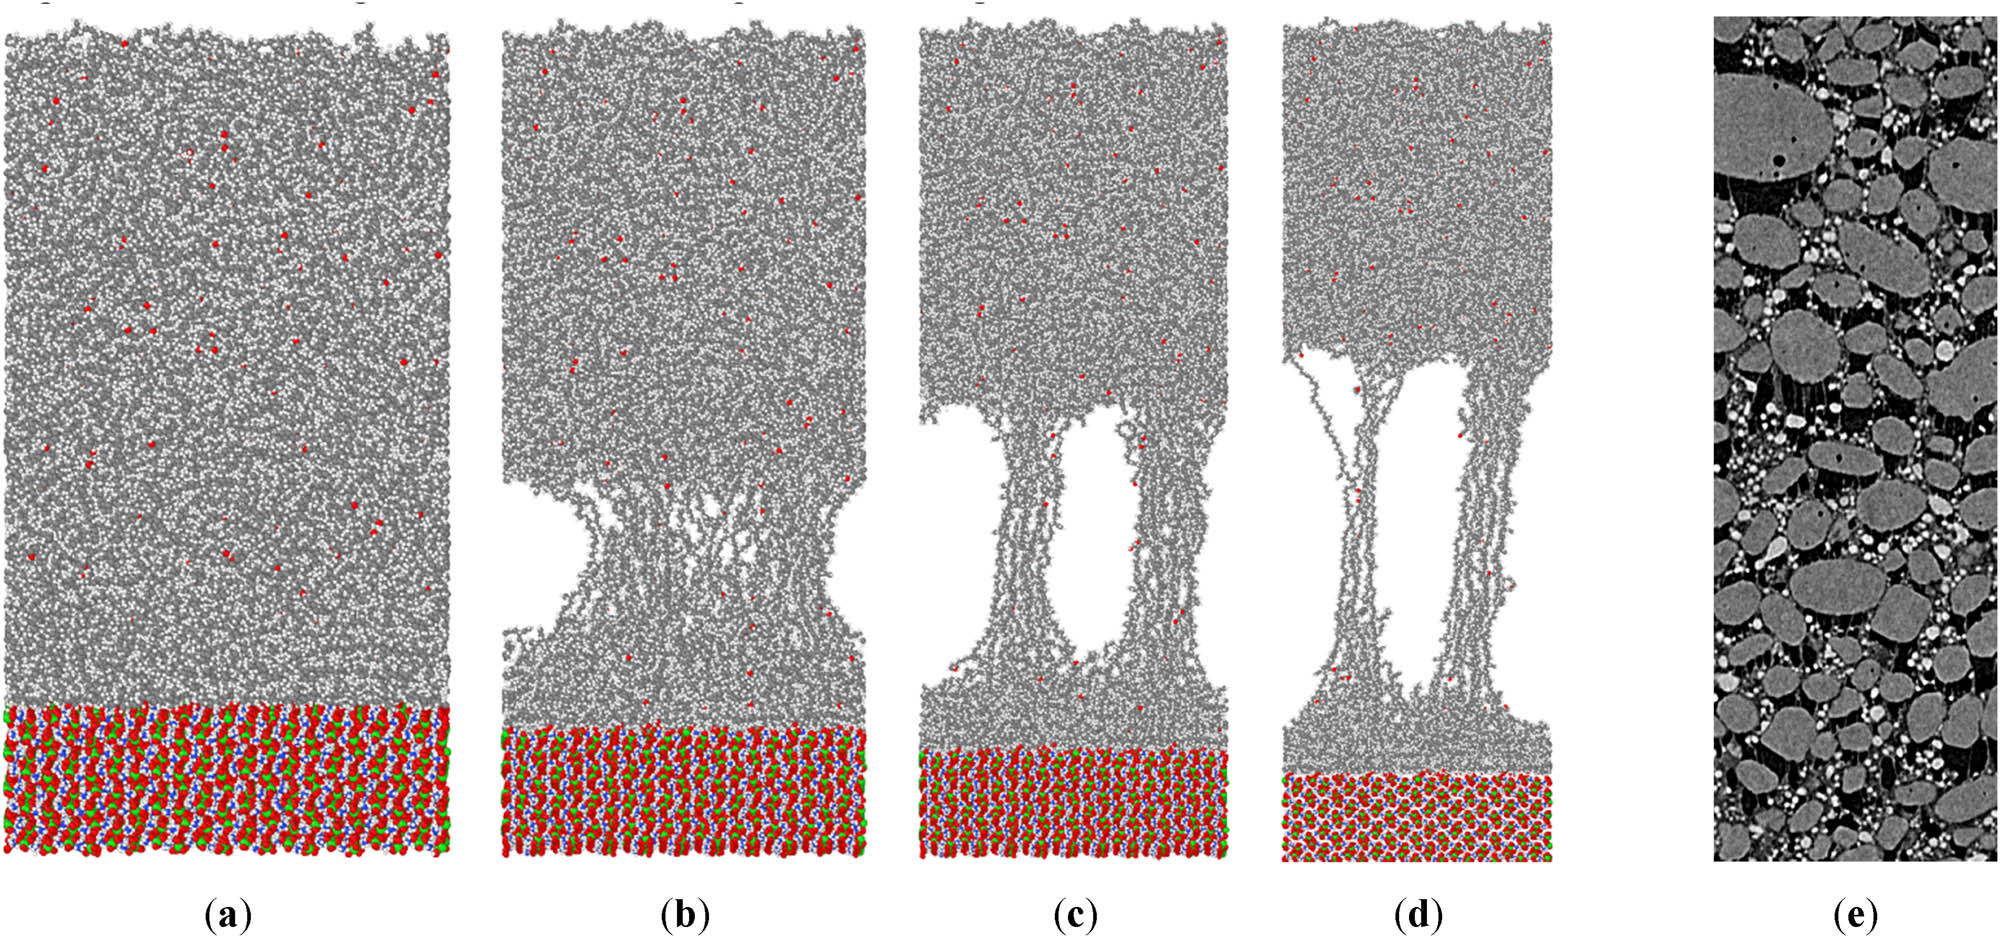
HTPB/AP interface stretching process: (a) Δ = 0, (b) Δ = 40, (c) Δ = 80, (d) Δ = 120, and (e) in situ CT experiment.
To simulate the uniaxial tensile stress state of the interface, the majority of the AP solid in the non-interface layer at the bottom of the model and a portion of the matrix in the non-interface layer at the top were fixed as the clamping section of the tensile specimen. The specimen with a thickness of about 40 Å composed of the matrix and interface layer near the interface layer of the model was appropriately retained as the tensile gauge section, and a negative Z-axis velocity was applied to the lower clamping section to achieve uniaxial tensile loading by Lammps. The basic working condition parameters for stretching are as follows: stretching rate 4 × 10⁻⁵ Å·fs−1 and temperature 298 K. The changes in the system structure, system energy, and tensile stress separation displacement curve during the entire stretching process are as follows.
For the structure changes, as shown in Figure 7, as the model continues to stretch, the matrix with the least stiffness first exhibits necking deformation. The long polymer chains that were originally curled and wound gradually become oriented and straightened under tension, resulting in an increasing number of small pores inside the matrix that gradually converge into large pores. Subsequently, the pores continued to develop at the surface between the matrix and the filler, resulting in the separation of the two substances. Many HTPB polymer chains slowly separated from the surface of AP. Ultimately, the matrix and the filler were completely separated. After complete destruction of the model, it was found that there was still some matrix on the surface of the filler. From the calculation of the tensile deformation process, the simulation result is very similar to the CT experiment, especially the necking phenomenon of the matrix. This finding is like the filamentous adhesion between particles observed in the in situ CT experiment, indicating that this model has representative significance.
It is worth noting that as the model continues to stretch, the appearance and growth of micropores are the main characteristics of interface microstructure changes. The volume ratio of pores directly reflects the degree of interface structural damage. Therefore, a program was written using MATLAB 2019 that can calculate the proportion of the internal pore volume in the model in real time. The main design idea of the program is as follows:
Divide the interface model box into countless small cubes with a side length of 1 nm.
Determine the small cube to which an atom belongs based on its central coordinates.
Calculate the number of atoms inside each cube and search for a cube with 0 atom to define as a pore.
Calculate the volume of all cubes with pores.
Calculate the porosity of the interface model at a certain moment during the stretching process as follows:
where

Porosity–separation displacement curve of the HTPB/AP surface.
From Figure 8, the interface porosity remains constant at 0 within a small displacement range during the initial stage of stretching, indicating that the atoms are tightly bonded and the pores have not yet begun to nucleate. When the separation displacement reaches about 1.6 Å, pores begin to nucleate inside the interface, and the porosity gradually increases with the increase in separation displacement (the point where the porosity initially increases is referred to as the damage initiation point p i in the text that follows). When the separation displacement reaches about 5 Å, the porosity suddenly increases rapidly. At this point, visible pores appear in the interface structure (the point where the porosity rapidly increases is referred to as the damage surge point p d). Subsequently, the porosity gradually increases with the increase in separation displacement, and the overall curve shows a slightly convex shape, indicating that the growth rate of porosity slightly slows down with the increase in separation displacement.
To express the adhesion state more intuitively between the matrix and the fillers, the w-axis coordinate values of all atoms in the model under each stretching step are counted and arranged in ascending order, as shown in Figure 9. It can be observed that the w-value curve can be roughly divided into three sections, corresponding to the lower clamping section, stretch section, and upper clamping section of the model. The w-value curves of the two clamping sections maintain a constant slope under different separation displacements, while the slope of the stretch section changes significantly. Furthermore, by calculating the average distance d between two adjacent atoms in the w-axis arrangement at each stretching step, as shown in Figure 9, it can be observed that the d increases linearly with stretch loading, indicating that the atoms contained in the matrix and the atoms contained in the filler are gradually separating under tensile loading. The larger the distance, the farther the separation between the matrix and the fillers is. When the distance between the two atoms reaches the cutoff radius, the mutual force between the two disappears, and the bonding effect of the interface is disrupted.

Adhesion state analysis of HTPB/AP interface: (a) adjacent atomic spacing and (b) average distance at each stretching step.
For the changes in system energy, as shown in Figure 10, due to the thermal motion of atoms, the curve of energy changing with separation displacement oscillates severely, making it difficult to analyze the trend of energy change. Therefore, the Loess method is used to smooth the curve, and the window ratio is set to 0.1. From Figure 10, the system energy of the HTPB/AP interface model exhibits a three-stage change process during the stretching process, which first rapidly increases to the peak, then slightly decreases, and finally fluctuates up and down. In the early stage of stretching, the energy of the system increases very rapidly, and the external load work is fully converted into the strain energy of the model. When the tensile separation displacement reaches about 10 Å, the system energy reaches its peak and then slightly decreases. At this point, the partial strain energy stored in the model is converted into damage dissipation energy. Finally, the system energy tends to flatten out. The formula for calculating the interfacial adhesion energy that characterizes the bonding performance of matrix fillers is expressed as follows:
where
where
The AP solid particle constructed in this article selects the most stable crystal form and crystal plane. However, there will be various types of AP crystal forms and crystal planes in contact with HTPB. Therefore, the interface energy obtained using the simulation calculation is relatively large compared to the actual situation.
The experiment measuring the adhesion work of AP/HTPB is influenced by the plastic deformation, surface roughness, and surface defects of the particles, which can make the measured contact angle different from the actual surface of the particles. However, the AP surface constructed in the simulation calculation is not affected by these factors.
The matrix system constructed in this section has not yet considered other component additives, so there are still some shortcomings compared to the actual formula and propellant preparation process.

Energy analysis of the HTPB/AP interface: (a) system energy at each stretching step and (b) energy curve after smoothing.
Regarding the changes in the stress–displacement curve, as shown in Figure 11, due to the thermal motion of molecules, it is still difficult to extract feature information from the original curve. Therefore, the Loess method is also used to smooth the curve, and the window ratio is set to 0.1. Compared with the matrix and solid particles under the same operating conditions, the modulus of the interface is slightly higher than matrix but much smaller than AP solid, which is consistent with the nano-indentation test. Comparing the interface mechanical performance curve with the porosity curve, it can be found that there is a good correspondence between the interface mechanical performance and porosity. Therefore, the stress–displacement curve of the model can be divided into four stages based on the common characteristics of the two curves:
In the linear strengthening section, the stress rapidly increases with the increase in separation displacement. Currently, the tangential stiffness of the interface remains unchanged and reaches the maximum positive direction (25.4 MPa·Å−1). Due to the high stretching rate, the time for the curve to be in the linear section is very short (0–1.68 Å). At this stage, the interface has not yet undergone damage, corresponding to a non-destructive zone with a porosity of 0 (0–p i).
In the nonlinear strengthening section, the stress increases with the increase in the separation displacement, but the tangent stiffness continuously decreases. The curve transitions from a linear straight section to a non-linear outward protruding curve and then reaches its peak (maximum separation displacement: 4.94 Å, tensile strength: 94.08 MPa). At this stage, the interface pores slowly nucleate and develop, corresponding to the damage germination zone (p i – p d) where the porosity slowly increases.
In the nonlinear damage weakening section, the stress gradually decreases with the increase in the separation displacement, and the tangent stiffness of the interface increases first and then decreases. The curve shows a nonlinear characteristic of an inward depression. At this stage, the interface pores develop rapidly, corresponding to the damage development zone where the porosity increases rapidly.
When the fracture section is damaged, the model has already stretched and fractured, and the stress does not change with the displacement. Due to atomic oscillations, there is stress within the model itself, and the stress–displacement curve does not start and end at the 0-stress point.

Mechanical properties analysis of HTPB/AP interface: (a) stress–separation displacement curve; (b) stress–separation displacement curve of the matrix, interface, and particles; and (c) stress–separation displacement curve after CZM fitting.
Observing the characteristics of the interface tensile stress–separation displacement curve after smooth processing, which is like the exponential cohesive zone model (CZM), the stress at each step of the curve is subtracted from the initial stress and subjected to zeroing treatment. The CZM is used to fit the smooth data points. The exponential CZM in the case of simple normal separation is as follows:
where
In the CZM, the initial stiffness
4 Interface that considers formulas
4.1 Construction of curing agent TDI and its effect
The curing agent is an essential component for forming the network structure of the matrix. The experimental results show that the curing parameter R increases, and the cross-linking density of matrix increases, leading to an increase in the strength and stiffness (22,23). Regarding the TDI curing agent, its main function is to enhance the curing reaction of HTPB chains, significantly increasing the chain length of polymer and forming a polymer cross-linking network. The enhanced curing mechanism is that the –NCO (isocyanate group) of TDI can undergo polyurethane reaction with the –OH (hydroxyl group) on the polymerization chain of HTPB, generating a –HNCOO– (carbamate). Due to the self-polymerization reaction of TDI to generate dimers and trimers, two or three functional groups were obtained. TDI with two functional groups played a role in chain extension, while TDI with three functional groups played a role in forming a cross-linked network, ultimately achieving the curing effect on HTPB (24). The basic reaction equation for HTPB and TDI curing cross-linking, as well as TDI self-polymerization, is shown in Figure 12.

Mechanism of the HTPB/TDI curing reaction: (a) HTPB/TDI curing reaction, (b) TDI, and (c) cross-linked HTPB polymer chain.
According to the experiment, the optimal range of the curing parameter R for HTPB propellant is 0.9–1.2, and the value of R has no significant impact on the calculation results of the numerical simulation (25). Therefore, preset R = 1. As shown in Figures 10 and 12, TDI molecules were added to the matrix of Model I to form an HTPB/TDI blend system. Subsequently, TDI was first allowed to undergo self-polymerization, followed by random curing and cross-linking reactions with HTPB, with cross-linking degrees set to 0%, 20%, 40%, 60%, and 80%. The cross-linked and cured layer under different cross-linking degrees are shown in Figure 13.

HTPB/TDI curing reaction process under different cross-linking degrees: (a) 20%, (b) 40%, (c) 60%, and (d) 80%.
It can be seen that as the cross-linking and curing reaction progresses, more and more TDI and HTPB polymer chains are cross-linked. Part of the monomers and dimers TDI connected two chains to form a chain extension effect, while the other part of the trimer TDI connected three chains to form a cross-linking network. The relative molecular weight and cross-linking density of the matrix were significantly increased compared to Model I, and with the increase of cross-linking degree, the relative molecular weight and cross-linking density showed a gradually increasing trend. But compared to the actual cross-linking density of the propellant matrix (10−4 mol·cm−3), it is one order of magnitude smaller, mainly because the simulated calculated cross-linking density only considers chemical cross-linking and does not consider physical cross-linking.
Obtain HTPB/TDI cross-linked and cured single cell, and expand (3, 3, 2) times in direction (u, v, w). Obtain five interface models IIa–e, considering the effect of TDI curing agent. The system consists of 180 HTPB50 polymer chains and 180 TDI molecules. The content of TDI in the matrix is 6.11%, which is slightly lower than the actual formula, but within a reasonable range.
Model IIa-e was sequentially subjected to uniaxial tensile loading. In order to make the calculation results more statistically significant, five parallel cross-linking reaction calculations were performed for each of the five cross-linking degree conditions. The average target parameters of the five cross-linking models obtained from parallel calculations under the same cross-linking degree were statistically analyzed for subsequent comparison. The changes in the system structure, interface bonding energy, and stress–displacement curve during the tensile process are shown in Figures 14 and 15.

Adhesive state during the tensile process of HTPB/TDI/AP interface under different degrees of matrix cross-linking.

Mechanical properties and bonding energy analysis of the interface under different cross-linking degrees of the matrix: (a) stress–separation displacement curve, (b) bonding energy, (c) tensile strength, (d) characteristic displacement, and (e) initial stiffness.
For the changes in interface microstructure, the overall trend of the four models is like that of Model I. Subsequently, polymer chains are stretched and detached from the surface of AP, resulting in interface destruction. When calculating the bonding condition between the matrix and AP, it was found that after adding TDI, the average distance between atoms decreases compared to that in Model I in both the initial state and stretching stages. However, the cross-linking degree had no significant effect on distance. For the changes in interface bonding energy, Model IIa with TDI added showed a significant improvement compared to Model I. The interface bonding energies of Model IIb–e are in the range of 0.5 to 0.6 J·m−2 under different cross-linking degrees, and there was no stable change trend, indicating that there was no significant correlation between the matrix cross-linking degree and the interface bonding energy. From this finding, the addition of the curing agent TDI can improve the bonding performance of the interface, but the process of forming a cross-linking network with the increase in matrix cross-linking degree does not significantly enhance the physical or chemical bonding between AP and the matrix, so there is no actual improvement effect on the bonding performance of the interface.
For the mechanical properties of the interface, the overall trend of the mechanical performance curves of the five models after adding TDI is similar, and all have the linear characteristics of exponential CZM. Compared with Model I, the mechanical properties of Model IIa did not show a significant improvement. However, with the increase of HTPB/TDI cross-linking degree, the initial stiffness of the five models showed a gradually increasing trend overall, while the variation pattern of characteristic displacement was the opposite and there is no obvious correlation between tensile strength and cross-linking degree. It is worth noting that the tensile strength increases significantly compared to other cross-linking conditions when the cross-linking degree is 40%. This may be that the cross-linking network formed under this cross-linking degree condition is the largest when simulating the curing reaction.
4.2 Construction of bonding agent MAPO and its effect
For HTPB propellant, research has found that adding a small amount of bonding agent in propellant can effectively suppress the dewetting damage and enhance the bonding performance of the particle–matrix interface (26). The commonly used bonding agent in HTPB propellant is MAPO (Tris (2-methyl-aziridine) phosphine oxide), which is a ternary nitrogen heterocyclic compound. As shown in Figure 16, the ≡P═O (phosphorus oxide group) in MAPO has strong polarity, which causes MAPO to preferentially move toward the surface of the AP, resulting in MAPO enrichment on the AP surface. In addition, MAPO can undergo ring opening and self-polymerization under acidic conditions, while AP is a strong acid and weak base salt. Its surface can precipitate hydrogen ions required to initiate the MAPO self-polymerization reaction. Therefore, when MAPO meets the surface of AP, MAPO will undergo ring opening and a self-polymerization reaction, forming a more stable six-membered ring MAPO. The –CH2 (methylene) formed after the ring opening of MAPO is also prone to a cross-linking reaction with the –OH on the HTPB polymer chain, causing MAPO to polymerize with HTPB (27,28).

Mechanism of the HTPB/MAPO cross-linking reaction: (a) MAPO self-polymerization reaction and MAPO/HTPB cross-linking reaction; (b) MAPO; and (c) HTPB polymer chain after cross-linking MAPO.
The principle of MAPO self-polymerization and the cross-linking reaction with HTPB is noted as follows:
Considering that MAPO is mainly enriched on the surface of AP and has a relatively low content in the overall system of HTPB propellant, to fully reflect the strong bonding effect of MAPO, (20, 40, 60, 80, 100) MAPO molecules were added to the Model IIc during modeling, forming a blended system of HTPB/TDI/MAPO molecules and causing MAPO to undergo a 50% self-polymerization reaction first, followed by 30% cross-linking reaction with HTPB. Finally, an interface Model IIIa–e composed of HTPB/TDI/MAPO blend matrix was formed. The content of MAPO in the matrix system is (12.96–42.51%), which is significantly higher than that in the actual formula, fully reflecting the enrichment phenomenon of MAPO on the surface of AP.
Uniaxial tensile loading is performed on Model IIIa-e in sequence. Similarly, five interface models with different MAPO contents were subjected to five parallel cross-linking reaction calculations, and the average target parameters of the five cross-linking models obtained from parallel calculations at the same cross-linking degree were statistically analyzed for subsequent comparison. The changes in the system structure, system energy, and stress–displacement curve during the tensile process are shown in Figures 17–19.

Adhesive state during the tensile process of HTPB/TDI/MAPO/AP interface under different MAPO content.

Interface state after fracture: (a) vertical direction and (b) horizontal direction.

Mechanical properties and bonding energy analysis of the interface under different MAPO contents: (a) stress–separation displacement curve, (b) bonding energy, (c) tensile strength, (d) characteristic displacement, and (e) initial stiffness.
Compared with Model IIc, although there is no significant difference in the matrix deformation process in Model III, it can be observed that after interface fracture, the AP surface will adhere many MAPO. These MAPO adheres to the surface of AP to form a thin layer, and the number of MAPO gradually increases with the increase of their content in the matrix. Analyzing the adhesion condition between the matrix and AP, it can be observed that the average spacing between atoms in the interface model significantly decreases in the initial state and various stages of stretching, and the slope of the curve also slightly decreases. This indicates that after adding MAPO, the adhesion between the matrix and fillers is significantly strengthened, and the two components are less likely to be detached, reflecting the strong bonding effect of MAPO. However, when the MAPO content reaches above 30.75%, this strengthening effect is less obvious. For the changes in interface bonding energy, Model IIIa shows a certain improvement in interfacial adhesion energy, and the energy can steadily increase with the increase in MAPO content. However, the growth rate is relatively slow. Therefore, the improvement in the interface bonding performance by MAPO is very stable and significant.
For the changes in the mechanical properties of the interface, the five interface models with different MAPO contents also have the four stages of interface mechanical curve as mentioned earlier. Comparing Model IIIa and Model IIc, it can be observed that the tensile strength and initial stiffness of the interface slightly increase after adding MAPO. As the proportion of MAPO in the matrix increases, the tensile strength and initial stiffness of the interface will steadily increase, and the increase is particularly significant when the content exceeds about 25%. However, the characteristic displacement shows a gradually decreasing trend. Overall, the mechanical properties of the particle matrix interface with MAPO added will be significantly improved, and its effect is equivalent to making the interface a high-strength and high stiffness reinforcement layer.
By analyzing the bonding types of the interface layer, it can be found that without the addition of MAPO, there are N–H–O and O–H–O hydrogen bonds formed within the matrix and between AP and HTPB. However, after the addition of MAPO, N–H–N and N–H–O hydrogen bonds formed between AP and MAPO appear in the system. The higher the content of MAPO, the more total hydrogen bonds there are in the system. In parallel computing, it was found that there were significant differences in the tensile calculation results of different cross-linked structures with the same MAPO content. The main influencing factors are the state and position of MAPO. Due to the fact that only HTPB polymer chains cross-linked with MAPO can achieve bonding, and the two –OH possessed by HTPB itself need to balance the reaction with the curing agent, there is a certain competitive relationship between the curing agent and the bonding agent when reacting with HTPB, resulting in significant differences in simulation results (Figure 20).

Number of hydrogen bonds in the interface under different MAPO contents.
In summary, the bonding and function of MAPO can be attributed to its polarity, which first accumulates on the surface of AP and forms strong hydrogen bonds with AP to form a highly rigid adhesive layer. Then, it forms chemical bonds with HTPB and ultimately enhances the bonding ability between the matrix and AP. With the increase of MAPO content, the interfacial mechanical properties show a trend of increasing tensile strength and initial stiffness, while the interfacial adhesion energy also shows a significant improvement. Therefore, MAPO can improve the interfacial mechanical properties and adhesive properties, and it has been confirmed from the mechanism of action that it can suppress the occurrence of dewetting damage in HTPB propellant.
By analyzing the structural deformation process, changes in adhesion energy and mechanical properties of Model I, Model II, and Model III, as well as the mechanisms of TDI strong curing and MAPO strong bonding cooperation, drawing on the research findings of reference (29), the following HTPB/AP/MAPO/TDI interface structure model can be established.
As shown in Figure 21, HTPB undergoes chain expansion under the action of TDI, forming a cross-linked network matrix system with higher initial stiffness and tensile strength. MAPO is enriched on the surface of AP, and AP supplies the hydrogen atoms required for ring opening. After ring opening, MAPO can achieve self-polymerization and cross-linking with HTPB. MAPO entering the cross-linking system forms strong hydrogen bond adsorption with AP, causing HTPB and AP to firmly bond together. MAPO forms a chemical binding with HTPB, inducing physical polar adsorption binding with AP. Regarding the effect of different contents of curing agents and bonding agents on interface performance, the following conclusions can be drawn:
TDI mainly inhibits the movement of molecular chains by generating chain extension and cross-linking networks in the matrix, which is mainly manifested as a reduction in the degree of deformation of the matrix during the stretching process. However, in terms of the impact of TDI on the interface, first, TDI itself will help improve the bonding performance of the interface and has a little effect on the mechanical properties of the interface. Second, the impact of the matrix cross-linking degree on interface performance is relatively small.
MAPO mainly enhances the comprehensive performance of the interface through chemical cross-linking with HTPB and strong hydrogen bond adsorption with AP, essentially enhancing the physical adsorption of two substances at the interface. The bonding condition of the HTPB/AP interface is relatively sensitive to the MAPO content. Within a certain concentration range, the higher the MAPO content, the greater the interface bonding energy, tensile strength, and initial stiffness. The overall performance of the interface is better, which is very helpful in preventing the dewetting damage. However, excessive addition of MAPO may deteriorate the interface performance and even affect other technical indicators of the propellant due to competition from various small molecule additives. Therefore, within a certain optimal range of MAPO content, attempting to increase the self-polymerization degree of MAPO and the cross-linking degree with HTPB is an effective way to enhance the interface performance.

Spherical model of the HTPB/AP/MAPO/TDI interface structure: (a) particle/interface/matrix three-layer model and (b) interface model.
5 Impact of working condition on the interface
5.1 Effect of temperature
To study the effect of temperature on interface performance, Model IIIb was used as the basic model. In addition, temperature control was achieved by setting NPT (three directional pressure of 0.1 MPa) relaxation before stretching. The relaxation conditions were set at five temperatures, 223, 248, 273, 298, and 323 K, to simulate three common temperature environments, low temperature, normal temperature, and high temperature. The stretching rate was fixed at 4 × 10⁻⁵ Å·fs−1. The changes in the model structure and stress–displacement curve at different temperatures are shown in Figures 22 and 23.

Porosity–separation displacement curve under different temperatures.

Mechanical property analysis of interface under different temperatures: (a) stress–separation displacement curve, (b) tensile strength, (c) characteristic displacement, and (d) initial stiffness.
For the changes in the microstructure of the interface, with the increase of temperature, the point
The changes in the mechanical properties of the interface show similar trends in the curve of interface IIIb at five different temperatures. As the temperature increases, the tensile strength and initial stiffness of the interface will steadily decrease, while the characteristic displacement does not show a stable trend of change. The characteristic displacement has different variation patterns under three conditions: low temperature, normal temperature, and high temperature. In the low temperature environment, the characteristic displacement increases with the increase of temperature, decreases with the increase of temperature when transitioning from low temperature to normal temperature, and increases with the increase of temperature when transitioning from normal temperature to high temperature. The tensile strength and initial stiffness of the interface have a significant temperature dependence, while the characteristic displacement is not significant.
In summary, the mechanical properties of the interface are highly sensitive to temperature and overall show a stable decrease in interfacial tensile strength and initial stiffness with increasing temperature. From the perspective of the stretching process, the main mechanism of temperature on the AP particle–matrix interface is that high temperature accelerates the thermal motion of atoms, reduces the steric hindrance between molecules, enhances the mobility of molecules, and promotes the development of pores by allowing HTPB molecular chains to move more freely. Therefore, under the same displacement, the higher the temperature, the faster the development of pores, resulting in a decrease in tensile strength and initial stiffness. However, due to the better activity of HTPB molecular chains in high temperature, they are more difficult to stretch and detach from the AP surface, thereby suppressing a significant amount of damage to the contact area between the matrix and the AP surface.
5.2 Effect of stretching rate
To study the effect of stretching rate on interface performance, the control of stretching rate is achieved by adjusting the displacement of the clamping section under the model per unit time. The stretching conditions are established based on five stretching rate gradients, namely, 5 × 10⁻⁶, 1 × 10⁻⁵, 2 × 10⁻⁵, 4 × 10⁻⁵, and 8 × 10⁻⁵ Å·fs−1, and the temperature is set to 298 K. The changes in the model system structure and stress–separation displacement curve under different stretching rates are shown in Figures 24 and 25.

Porosity–separation displacement curve under different stretching rates.

Analysis of the mechanical properties of the interface under different stretching rates: (a) stress–separation displacement curve, (b) tensile strength, (c) characteristic displacement, and (d) initial stiffness.
For the changes in the microstructure of the interface, with the increase of stretching rate, the damage initiation points
For the changes in the mechanical properties of the interface, the trend of the curve of interface IIIb under five different stretching rates is basically the same. As the stretching rate increases, the tensile strength and initial stiffness of the interface steadily increase, but there is no significant change in the characteristic displacement. There is a significant rate correlation between the tensile strength and initial stiffness of the interface, but this rate correlation is not particularly significant under intermediate rate conditions.
In summary, the mechanical properties of the interface are also sensitive to the tensile rate and overall show that as the tension increases, the tensile strength and initial stiffness gradually increase. From the stretching results, the main mechanism of strain rate on the particle–matrix interface is that the internal pores generated by the orientation of the molecular chains in the matrix are rapidly compressed before they can develop during the stretching process. Under high strain rates, the arrangement of high polymer chain molecules become tighter, and the molecular steric hindrance and adsorption are strengthened, resulting in higher strength and modulus of the model. However, due to the weakened mobility of HTPB chains and insufficient time to complete deformation, more adsorption sites are lost on the surface of AP due to stretching under the same displacement, resulting in a larger area of interface damage.
6 HTPB/AP interface that considers aging
6.1 Construction of aging and its effect
The literature has shown that with the extension of aging time, the macroscopic mechanical properties of the HTPB propellant will significantly change. Using SEM, it can also be found that the interface of the aged propellant is more prone to dewetting under load (30). Obviously, the bonding strength between HTPB and AP will gradually decrease with the prolongation of aging time. Aging can be divided into two types: physical and chemical. Physical aging refers to the changes in the physical properties of propellant, such as moisture absorption, solvent volatilization, migration and sweating of catalysts and plasticizers, crystal transformation and crystallization of crystalline components, and other changes in physical properties. Chemical aging refers to the chemical changes, such as thermal decomposition, hydrolysis, degradation, post-curing, decomposition of oxidants, oxidative cross-linking, and degradation of adhesives. Chemical aging is the most important type of aging that affects the interface performance of propellants. Therefore, the aging mentioned later specifically refers to chemical aging.
For the HTPB matrix, the direct effect of aging is to cause weak points in the molecular structure of the adhesive and chemical changes in the chain structure, molecular weight, molecular distribution, branching degree, etc. of the polymer. Experimental research has found that the chemical aging reaction of the HTPB matrix is very complex and can be roughly summarized as two processes, namely, oxidation cross-linking and degradation chain breaking, both of which compete and interact with each other throughout the entire life cycle of the propellant. The main action of oxidative cross-linking is to attack the weak C═C bond of HTPB with free oxygen, while degradation chain breakage is mainly caused by C–N and C–O bond breakage with lower bond energy in HTPB. In long-term thermal accelerated aging experiments, it was found that oxidative cross-linking is a more important aging mode (31), and the mechanical properties of the propellant show a trend of increasing tensile strength and gradually decreasing elongation throughout the entire lifecycle (32). From the aging process of the matrix, it can be roughly judged that the oxidation cross-linking aging of the matrix is like the action of a curing agent, as it mainly improves the cross-linking degree of the matrix components and forms a cross-linking network system. However, the impact of cross-linking degree on interface performance was analyzed in detail in Section 2, so this section will not study the impact of HTPB matrix aging on the interface.
For AP particles, the direct effect of aging is to cause the transformation of the AP crystal form and thermal decomposition. The aging process of filler AP is mainly due to its thermal decomposition reaction, and AP will release various strong oxidizing gases during thermal decomposition to promote the oxidative cross-linking reaction of HTPB. At the same time, it will adsorb a layer of gas molecules on the surface of AP, damaging the integrity of the interface structure of HTPB/AP and causing deterioration of the interface bonding performance.
In the experiment, it was found that AP undergoes multiple thermal decomposition reactions when heated or exposed to water, producing various gases. At present, the mechanism and pathway of thermal decomposition reaction for AP are still hot research issues (31). This article only considers the first-order thermal decomposition reaction of AP, and its reaction equation is expressed as follows:
When studying the effect of AP thermal decomposition aging on interface performance, Model IIIb is used as the basic model, considering that the first-order products of AP aging decomposition are NH3 and HClO4 gases. First, 10%, 20%, 30%, and 40% of AP molecules were randomly deleted from the filler system, and the vacancies left after deletion were filled with NH3 and HClO4 gas molecules in a 1:1 ratio to describe different degrees of AP thermal decomposition aging and gas adsorption, ultimately forming the interface aging Model IVa–d.
6.2 Effect of aging on interface performance
To study the effect of AP aging on interface performance, uniaxial tensile loading was applied to Model IVa–d, setting the stretching rate to 4 × 10⁻⁵ Å·fs−1 and the temperature to 298 K. The changes in the model system structure and stress–displacement curve under different aging degrees are shown in Figure 26.

Analysis of the mechanical properties of the interface under different aging degrees: (a) stress–separation displacement curve, (b) tensile strength, (c) characteristic displacement, and (d) initial stiffness.
Regarding the changes in interface microstructure, during the stretching process, gas molecules generated by the thermal decomposition of AP in Model IV will diffuse from the filler system through the matrix system to the outside of the entire interface model. Some of the vacancies left on the surface of the particles will be occupied by HTPB polymer chains, while the other parts will become the initial pore defects of the filler. Analyzing the porosity change curve of Model IV, it can be found that the point p i at the interface occurs earlier as the proportion of AP aging decomposition increases. In summary, the area of adsorption between the matrix and fillers gradually decreases with the increase in the thermal decomposition ratio of the fillers. Therefore, the more AP that is decomposed, the more initial defects at the interface, and the weaker the interface adsorption.
Regarding the changes in the mechanical properties of the interface, the overall trend of the interface stress–separation displacement curve under four different AP aging degrees is basically the same as that of Model IIIb. As aging progresses, the tensile strength and initial stiffness of the interface will gradually decrease, with the change in initial stiffness being particularly significant. However, the characteristic displacement does not show a stable change trend. The thermal decomposition of AP will significantly degrade the mechanical properties of the interface, and the interface stiffness is the most sensitive to aging. Therefore, it can be inferred that the performance of the interface will gradually deteriorate after aging, making it more likely to cause dewetting damage. This conclusion has also been confirmed in the in situ CT experiment of the propellant (33).
In summary, the thermal decomposition of AP will greatly degrade the mechanical properties of the interface. Overall, as the proportion of filler aging and decomposition increases, the tensile strength and initial stiffness of the interface will gradually decrease. Therefore, HTPB propellant is more likely to cause dewetting damage after aging. From the perspective of the stretching process, the main mechanism of the thermal decomposition aging of AP on the interface mechanical properties is to increase the initial pore volume of the interface structure. More pores bring more initial damage, disrupt the integrity of the interface structure, reduce the adsorption area between the matrix and fillers, and cause degradation of the interface performance.
7 Conclusions
In response to the microstructure structure–activity relationship of particle–matrix interface in HTPB propellant, this article conducted interface microstructure characterization experiments and interface MD numerical simulations. The physical and chemical properties of the interface were analyzed using nano-indentation, GCIB, and XPS experiments. Subsequently, an atomic micro-interface model considering component additives was constructed. The changes in interface microstructure, adhesive energy, and mechanical properties under uniaxial tensile loading were calculated and obtained. The influence mechanism of chemical composition and tensile conditions on interface properties was analyzed, and the following conclusions were drawn:
Through microscopic experiments, it was found that the interface is a region that has special mechanical properties, with a thickness of about 0.1 µm.
The mechanical performance curve of the interface has four distinct characteristic stages, and the overall trend of change basically conforms to the characteristics of the exponential CZM.
The curing agent TDI has a relatively small impact on the interface, while the bonding agent MAPO can significantly enhance the various properties of the interface. Its main mechanism of action is to enhance the physical adsorption between the matrix and fillers, which is very helpful in preventing propellant dewetting damage.
The mechanical properties of the interface are sensitive to changes in temperature and stretching rate and have a time–temperature effect. The main mechanism of their joint action is to affect the nucleation and development of internal micropores at the interface during the stretching process.
The thermal decomposition aging of AP will greatly degrade the mechanical properties of the interface, and its main mechanism is to increase initial defects and disrupt the adsorption between the matrix and fillers.
-
Funding information: This research was funded by National Natural Funds in China, Grant Number 11772352, and Science Project of Shaanxi Province, Grant Numbers 20190504, 2020JQ-486.
-
Author contributions: Zijie Zou: writing – original draft; Hongfu Qiang: methodology, funding acquisition, supervision; Junhong Zhou: methodology; Fengtao Zhang: methodology; Xueren Wang: writing – review and editing, project administration; Yiyi Li: software, data curation.
-
Conflict of interest: The authors declare no conflict of interest.
-
Data availability statement: Data are contained within the article.
References
(1) Alder BJ, Wainwright TE. Phase transition for a hard sphere system. J Chem Phys. 1957;27:1208–9.10.1063/1.1743957Search in Google Scholar
(2) Kendrick J, Robson E, Leeming W, Leiper GA, Cumming AS, Leach C. Molecular modelling of novel energetic materials. Waste Manag. 1998;17:187–9.10.1016/S0956-053X(97)10019-8Search in Google Scholar
(3) Dick WA, Fiedler R, Heath MT. Integrated simulation of solid propellant rockets. Proceedings of the 37th Joint Propulsion Conference and Exhibit. Vol. 3949, Salt Lake City, UT, USA; July 2001. p. 8–1110.2514/6.2001-3949Search in Google Scholar
(4) Dick WA, Heath MT, Fiedler R, Brandyberry M. Advanced simulation of solid propellant rockets from first principles. Proceedings of the 41 st AIAA/ASME/SAE/ASEE Joint Propulsion Conference & Exhibit. Tucson, AZ, USA: July 2005.10.2514/6.2005-3990Search in Google Scholar
(5) Edgar KJ, Buchanan CM, Debenham JS, Rundquist PA, Seiler BD, Shelton MC, et al. Advances in cellulose ester performance and application. Prog Polym Sci. 2001;26:1605–88.10.1016/S0079-6700(01)00027-2Search in Google Scholar
(6) Zhang LN, Li DH, Yao WS, Yang RJ. Molecular dynamics simulation of interaction between GAP grafted hydantoin and solid oxidizers in for GAP propellant. J Propuls Technol. 2010;31:587–92.Search in Google Scholar
(7) Lan YH, Liu YQ, Fu YZ, Xie JB. Molecular dynamics simulation on PEG and Al particle models of high energy NEPE propellent ingredient. Chem Propellants Polym Mater. 2009;7:49–54.Search in Google Scholar
(8) Fu YZ, Liu YQ, Mei YL, Lan YH. Molecular dynamics simulation on binding energies and mechanical properties of HTPB and different crystal faces of Al. Acta Phys Chim Sin. 2009;25:187–90.10.3866/PKU.WHXB20090134Search in Google Scholar
(9) Jiao DM, Yang YC, Qiang HF, Wu WM. Molecular simulation of effect of bonding agents on interface interaction for HTPB and Al/Al2O3. Chin J Explos Propellants. 2009;32:60–3.Search in Google Scholar
(10) Zhu W, Wang XJ, Xiao JJ, Zhu WH, Sun H, Xiao HM. Molecular dynamics simulations of AP/HMX composite with a modified forcefield. J Hazard Mater. 2009;167:810–6.Search in Google Scholar
(11) Dong G, Liu HZ, Deng L, Yu HY, Zhou X, Tang XQ, et al. Study on the interfacial interaction between ammonium perchlorate and hydroxyl-terminated polybutadiene in solid propellants by molecular dynamics simulation. e-Polymers. 2022;22:264–75.10.1515/epoly-2022-0016Search in Google Scholar
(12) Zhang J, Luo P. Molecular-level insights into the improvement mechanism of the bonding agent MAPO on the mechanical properties of the AP/HTPB-TDI cross-linked system. Ind Eng Chem Res. 2023;62:20689–701.10.1021/acs.iecr.3c02491Search in Google Scholar
(13) Segurado J, Llorca J. A numerical approximation to the elastic properties of sphere-reinforced composites. J Mech Phys Solids. 2002;50:2107–21.10.1016/S0022-5096(02)00021-2Search in Google Scholar
(14) Shoukry SN, Prucz JC, Shankaranarayana PG, William GW. Microstructure modeling of particulate reinforced metal matrix composites. Mech Adv Mater Struct. 2007;14:499–510.10.1080/15376490701410497Search in Google Scholar
(15) Yu ZF, Yao WS, Tan HM, Cun GL. Mesoscopic molecular simulation of phase separation of NPBA in energetic plasticizer/prepolymer. Chin J Energetic Mater. 2016;24:469–78.Search in Google Scholar
(16) Hou LF. Composite Solid Propellant. Beijing, China: China Space Navigation Press; 1994. p. 61.Search in Google Scholar
(17) Yedukondalu N, Vaitheeswaran G. Polymorphism, phase transition, and lattice dynamics of energetic oxidizer ammonium perchlorate under high pressure. J Phys Chem C. 2019;123:2114–26.10.1021/acs.jpcc.8b11386Search in Google Scholar
(18) Choi CS, Prask HJ, Prince E. Crystal structure of NH4ClO4 at 298, 78, and 10 °K by neutron diffraction. J Chem Phys. 1974;61:3523–9.10.1063/1.1682532Search in Google Scholar
(19) Khan MAS, Vijayalakshmi R, Singh A, Nandi AK, Talawar MB. Morphology of ammonium perchlorate in presence of ethylene glycol as an additive: A first principle study. CrystEngComm. 2019;21:7519–27.10.1039/C9CE01262ASearch in Google Scholar
(20) Zhu W, Wang X, Xiao J, Zhu WH, Sun H, Xiao HM. Molecular dynamics simulations of AP/HMX composite with a modified force field. J Hazard Mater. 2009;167(1–3):810–6.10.1016/j.jhazmat.2009.01.052Search in Google Scholar PubMed
(21) Yeh IC, Andzelm JW. Computational study of structural and energetic properties of ammonium perchlorate at interfaces. J Phys Chem C. 2021;125:12297–304.10.1021/acs.jpcc.1c01551Search in Google Scholar
(22) Mao KZ, Ma S, Luo YJ. Crosslinking network structure integrity of PET/N-100 binder system. Chin J Energ Mater. 2015;23(10):941–6.Search in Google Scholar
(23) Chen CY, Wang XF, Gao LL, Ni B. Effects of NCO/OH molar ratio on the cure reaction and mechanical property of HTPB. Chem Res Appl. 2013;25:1381–5.Search in Google Scholar
(24) Li HX, Qiang HF, Wu WM. Molecular simulation of curing process of HTPB and TDI. J Solid Rocket Technol. 2008;31:602–6.Search in Google Scholar
(25) Tow GM, Maginn EJ. Cross-linking methodology for fully atomistic models of hydroxyl-terminated polybutadiene and determination of mechanical properties. Macromolecules. 2021;54:4488–96.10.1021/acs.macromol.1c00228Search in Google Scholar
(26) Chen LL. Synthesis and application of aziridine bonding agents. Liming Chem. 1992;2:23–4.Search in Google Scholar
(27) Wei ZL, Hao X, Liu JQ, Duan HJ, Kang LY. Improving mechanical property of low-burning rate AP/AL/HTPB propellants. Ordnance Mater Sci Eng. 2012;35:60–2.Search in Google Scholar
(28) Hu W, Li SH, Tang G, Xu SL. Study on interaction between bonding agent MAPO and oxidizers AP, HMX and RDX. J Solid Rocket Technol. 2010;33:533–6.Search in Google Scholar
(29) Pang AM. Mechanical model of mesophase in composite solid propellants. J Propuls Technol. 1998;5:98–103.Search in Google Scholar
(30) Zhang XG, Zhang W, Lu W, Wang CH. Aging characteristics of interfacial adhesive filler/binder matrix for HTPB propellant. Chin J Energetic Mater. 2009;17:269–73.Search in Google Scholar
(31) Du SG, Qin H, Yan J, Li HG, Meng SH. Molecular simulation of aging mechanism for HTPB propellants. Chin J Energetic Mater. 2014;22:291–4.Search in Google Scholar
(32) Yang J, Lin L, Li YX, Lv L. Density functional theory study on thermal decomposition mechanisms of ammonium perchlorate. Acta Chim Sin. 2023;81:328–37.10.6023/A23020056Search in Google Scholar
(33) Liu XG, Wang ZJ, Han YH, Chen JX. Quantitative Characterization of damage evolution for aged composite solid propellant under tensile loading. Equip Environ Eng. 2024;21(4):1–8.Search in Google Scholar
© 2024 the author(s), published by De Gruyter
This work is licensed under the Creative Commons Attribution 4.0 International License.
Articles in the same Issue
- Research Articles
- Flame-retardant thermoelectric responsive coating based on poly(3,4-ethylenedioxythiphene) modified metal–organic frameworks
- Highly stretchable, durable, and reversibly thermochromic wrapped yarns induced by Joule heating: With an emphasis on parametric study of elastane drafts
- Molecular dynamics simulation and experimental study on the mechanical properties of PET nanocomposites filled with CaCO3, SiO2, and POE-g-GMA
- Multifunctional hydrogel based on silk fibroin/thermosensitive polymers supporting implant biomaterials in osteomyelitis
- Marine antifouling coating based on fluorescent-modified poly(ethylene-co-tetrafluoroethylene) resin
- Preparation and application of profiled luminescent polyester fiber with reversible photochromism materials
- Determination of pesticide residue in soil samples by molecularly imprinted solid-phase extraction method
- The die swell eliminating mechanism of hot air assisted 3D printing of GF/PP and its influence on the product performance
- Rheological behavior of particle-filled polymer suspensions and its influence on surface structure of the coated electrodes
- The effects of property variation on the dripping behaviour of polymers during UL94 test simulated by particle finite element method
- Experimental evaluation on compression-after-impact behavior of perforated sandwich panel comprised of foam core and glass fiber reinforced epoxy hybrid facesheets
- Synthesis, characterization and evaluation of a pH-responsive molecular imprinted polymer for Matrine as an intelligent drug delivery system
- Twist-related parametric optimization of Joule heating-triggered highly stretchable thermochromic wrapped yarns using technique for order preference by similarity to ideal solution
- Comparative analysis of flow factors and crystallinity in conventional extrusion and gas-assisted extrusion
- Simulation approach to study kinetic heterogeneity of gadolinium catalytic system in the 1,4-cis-polyisoprene production
- Properties of kenaf fiber-reinforced polyamide 6 composites
- Cellulose acetate filter rods tuned by surface engineering modification for typical smoke components adsorption
- A blue fluorescent waterborne polyurethane-based Zn(ii) complex with antibacterial activity
- Experimental investigation on damage mechanism of GFRP laminates embedded with/without steel wire mesh under low-velocity-impact and post-impact tensile loading
- Preparation and application research of composites with low vacuum outgassing and excellent electromagnetic sealing performance
- Assessing the recycling potential of thermosetting polymer waste in high-density polyethylene composites for safety helmet applications
- Mesoscale mechanics investigation of multi-component solid propellant systems
- Preparation of HTV silicone rubber with hydrophobic–uvioresistant composite coating and the aging research
- Experimental investigation on tensile behavior of CFRP bolted joints subjected to hydrothermal aging
- Structure and transition behavior of crosslinked poly(2-(2-methoxyethoxy) ethylmethacrylate-co-(ethyleneglycol) methacrylate) gel film on cellulosic-based flat substrate
- Mechanical properties and thermal stability of high-temperature (cooking temperature)-resistant PP/HDPE/POE composites
- Preparation of itaconic acid-modified epoxy resins and comparative study on the properties of it and epoxy acrylates
- Synthesis and properties of novel degradable polyglycolide-based polyurethanes
- Fatigue life prediction method of carbon fiber-reinforced composites
- Thermal, morphological, and structural characterization of starch-based bio-polymers for melt spinnability
- Robust biaxially stretchable polylactic acid films based on the highly oriented chain network and “nano-walls” containing zinc phenylphosphonate and calcium sulfate whisker: Superior mechanical, barrier, and optical properties
- ARGET ATRP of styrene with low catalyst usage in bio-based solvent γ-valerolactone
- New PMMA-InP/ZnS nanohybrid coatings for improving the performance of c-Si photovoltaic cells
- Impacts of the calcinated clay on structure and gamma-ray shielding capacity of epoxy-based composites
- Preparation of cardanol-based curing agent for underwater drainage pipeline repairs
- Preparation of lightweight PBS foams with high ductility and impact toughness by foam injection molding
- Gamma-ray shielding investigation of nano- and microstructures of SnO on polyester resin composites: Experimental and theoretical study
- Experimental study on impact and flexural behaviors of CFRP/aluminum-honeycomb sandwich panel
- Normal-hexane treatment on PET-based waste fiber depolymerization process
- Effect of tannic acid chelating treatment on thermo-oxidative aging property of natural rubber
- Design, synthesis, and characterization of novel copolymer gel particles for water-plugging applications
- Influence of 1,1′-Azobis(cyclohexanezonitrile) on the thermo-oxidative aging performance of diolefin elastomers
- Characteristics of cellulose nanofibril films prepared by liquid- and gas-phase esterification processes
- Investigation on the biaxial stretching deformation mechanism of PA6 film based on finite element method
- Simultaneous effects of temperature and backbone length on static and dynamic properties of high-density polyethylene-1-butene copolymer melt: Equilibrium molecular dynamics approach
- Research on microscopic structure–activity relationship of AP particle–matrix interface in HTPB propellant
- Three-layered films enable efficient passive radiation cooling of buildings
- Electrospun nanofibers membranes of La(OH)3/PAN as a versatile adsorbent for fluoride remediation: Performance and mechanisms
- Preparation and characterization of biodegradable polyester fibers enhanced with antibacterial and antiviral organic composites
- Preparation of hydrophobic silicone rubber composite insulators and the research of anti-aging performance
- Surface modification of sepiolite and its application in one-component silicone potting adhesive
- Study on hydrophobicity and aging characteristics of epoxy resin modified with nano-MgO
- Optimization of baffle’s height in an asymmetric twin-screw extruder using the response surface model
- Effect of surface treatment of nickel-coated graphite on conductive rubber
- Experimental investigation on low-velocity impact and compression after impact behaviors of GFRP laminates with steel mesh reinforced
- Development and characterization of acetylated and acetylated surface-modified tapioca starches as a carrier material for linalool
- Investigation of the compaction density of electromagnetic moulding of poly(ether-ketone-ketone) polymer powder
- Experimental investigation on low-velocity-impact and post-impact-tension behaviors of GFRP T-joints after hydrothermal aging
- The repeated low-velocity impact response and damage accumulation of shape memory alloy hybrid composite laminates
- Exploring a new method for high-performance TPSiV preparation through innovative Si–H/Pt curing system in VSR/TPU blends
- Large-scale production of highly responsive, stretchable, and conductive wrapped yarns for wearable strain sensors
- Preparation of natural raw rubber and silica/NR composites with low generation heat through aqueous silane flocculation
- Molecular dynamics simulation of the interaction between polybutylene terephthalate and A3 during thermal-oxidative aging
- Crashworthiness of GFRP/aluminum hybrid square tubes under quasi-static compression and single/repeated impact
- Review Articles
- Recent advancements in multinuclear early transition metal catalysts for olefin polymerization through cooperative effects
- Impact of ionic liquids on the thermal properties of polymer composites
- Recent progress in properties and application of antibacterial food packaging materials based on polyvinyl alcohol
- Additive manufacturing (3D printing) technologies for fiber-reinforced polymer composite materials: A review on fabrication methods and process parameters
- Rapid Communication
- Design, synthesis, characterization, and adsorption capacities of novel superabsorbent polymers derived from poly (potato starch xanthate-graft-acrylamide)
- Special Issue: Biodegradable and bio-based polymers: Green approaches (Guest Editors: Kumaran Subramanian, A. Wilson Santhosh Kumar, and Venkatajothi Ramarao)
- Development of smart core–shell nanoparticles-based sensors for diagnostics of salivary alpha-amylase in biomedical and forensics
- Thermoplastic-polymer matrix composite of banana/betel nut husk fiber reinforcement: Physico-mechanical properties evaluation
- Special Issue: Electrospun Functional Materials
- Electrospun polyacrylonitrile/regenerated cellulose/citral nanofibers as active food packagings