Effect of openings on simply supported reinforced concrete skew slabs using finite element method
-
Kaythar A. Ibrahim
 ,
Suhaib Y. Al-Darzi
,
Suhaib Y. Al-Darzi

Abstract
Reinforced concrete skew slabs are commonly used in bridges due to space constraints in motorways and in congested urban areas. Such slabs also often need to contain openings for architectural requirements or services, and this study seeks to determine the effect of these openings on the strength of the skew slabs. The finite element method was used to analyze 13 cases of slabs with skew angles of 45°. The first and second cases were used to validate the results with experimental work. Other cases studied the effect of the position and shape of openings on the strength of the skew slabs under both one-point and four-point loading conditions. The study also showed that the worst location for the opening was near the obtuse corners since this is where most of the load is transferred. With respect to the shape of openings, three different shapes with the same area were used: skew, circle, and square shapes. It was found that the effect of the opening shape depends on how many steel reinforcements are removed, as well as the appearance of negative cracking brought on as a result of the opening. Overall, the square shape introduces the smallest reduction in the skew slab strength compared with a slab with no opening. Accordingly, the study recommends that the strength of skew slabs can best be maintained if square openings are employed near the acute corners, alongside negative steel reinforcement to avoid cracking.
1 Introduction
Concrete slabs find widespread application in the construction of floors in residential and commercial settings and bridge decks. Due to the potential savings in labor and formwork expenses that can be achieved by omitting girders, reinforced concrete (RC) slab bridges are preferred for short spans [1].
A four-sided slab with equal opposite angles that are not at 90° is referred to as a skew slab. These skew slabs are commonly used in highway bridges [2] due to space restrictions, and demand for skew slabs or bridges have also risen in densely populated urban areas [3,4,5].
The skew angle (α) is typically calculated clockwise from the vertical line perpendicular to the skew slab’s support line. The ratio of the span to the width of the supports, meanwhile, is known as the aspect ratio (r). The right span is the distance between the two parallel lines of supports, while the skew span is the span of a skewed slab measured along an unsupported edge of the design [6]. Due to the structure’s skewness, the stress and deflection characteristics are very different from those seen in slabs at a right angle [7]. Indeed, the force flow in skew slabs is significantly more complicated than in straight slabs [8,9], and analysis of the RC nonlinear zone is especially challenging and, in some cases, impossible, due to the complicated behavior of RC [10]. In right-angle slabs, the load path travels directly in the direction of the support toward the span while in the skew slab, the load goes straight to the skew slab’s obtuse corners [11]. The moment field induced in the slab as a result of the applied load controls the design of any RC slab. This moment field in skew slabs changes a lot depending on the skew angle, slab aspect ratio, and boundary conditions [12].
Numerous techniques are used to analyze slabs, including grillage and finite element approaches. Grillage analysis is typically the approach utilized in bridge analysis, where an equivalent grillage of beams is substituted for the deck [13] while the finite element method depends on dividing the geometry of the structure into discrete finite elements and solving it together to find the solution.
Roll and Aneja [14] examined the performance of straight and skew bridge models and constructed using a simply supported box beam. The purpose of their testing was to investigate whether or not finite-element modeling was accurate.
A method for estimating moments in continuous normal and skew slab-and-girder bridges that are caused by live loads was provided by Khaleel and Itani [15]. Menassa et al. [5] evaluated the effect of a skew angle compared with a straight bridge. They found that bridges with skew angles of less than 20° could be designed as non-skew because the moments are practically the same for both types of bridges.
The grillage approach and the finite element method of analysis were compared and contrasted by Khatri et al. [16]. The authors concluded that the finite element method achieved a closer agreement with the exact solution.
Kar et al. conducted research showing that when the skew angle increases, the stresses in the slab change noticeably compared to those in a straight slab. Specifically, skewed slabs are prone to warping since the maximum stress planes are not parallel to the road’s centerline. This means that the reactions at the slab support’s acute end are greater than those at the other end. When the skew angle reaches around 60°, the reaction at the acute angle corner results in zero pressure. In contrast, the reaction at the obtuse angle corners is twice the level of the average reaction. This is important since it means that there are more opportunities for corner upliftment as the skew angle rises. Furthermore, according to Kar et al. [17], as the skew angle increases, the bending moment drops; compared to the right bridge in their study, it fell by almost 75%. On the other hand, while the transverse moment rises as the skew angle increases, once that angle reaches a certain level it begins to fall again.
In 2015, Kothari and Murnal found that the skew angles had a substantial impact on the seismic reactions of bridges since skewness means that the bridge responds in both the direction of the applied force and in the opposite direction. This behavior is mostly the result of a coupling effect, which causes rotation and an increase in the skew angle. In addition, it was determined that as the skew angle rose, the impact of torsion and other internal forces could not be ignored. Axial forces in the outer girders grew more quickly than those in the interior girders with increased skew angle. So, at higher skew angles, external girders were more vulnerable to earthquake forces than inside girders [18].
Anusreebai and Krishnachandran [19] found that when the skew angle increases, the ultimate load of a skew slab also increases but the slab’s maximum deflection decreases.
An analytical model for the design of skew slabs with arbitrary skew angles and aspect ratios was created by Sharma et al. [12]. The model shows that for the building of bridges with short diagonals bigger than the span, skew slabs simply supported along two opposite parallel sides and free along the other two sides are adequate. The created model experimentally and numerically supports the assumptions made regarding the collapse loads and crack patterns. The study makes it easier for engineers to construct skew slab bridges without deviating from the road’s alignment for any skew angle and aspect ratio.
Hussein et al. [20], meanwhile, tested four potential techniques to counteract the adverse effect of openings on the mechanical properties of slabs. Four of the six RC slabs in their study were strengthened using various carbon fiber-reinforced polymer (CFRP), steel plates, steel bars, and near-surface mounted Engineered Cementitious Composite (ECC) with steel mesh. The remaining two slabs were produced as controls. All the recommended strengthening methods, apart from ECC, were able to mitigate a sizable portion of the deterioration in mechanical properties.
In 2021, Oukaili and Merie examined how adding an opening near a column affected the punching shear resistance of RC bubbling slabs, and how well strengthening with CFRP sheets performed in mitigating those effects [21]. The experimental program was designed to investigate the impact of the opening’s size, location, and separation from the column, and the positioning of bubbles in relation to the two-way critical shear section. The test results showed that the bubbled slabs’ load-carrying capacity was lower than that of the reference solid and that the development of an opening close to the loaded area had a detrimental effect. The use of CFRP strengthening sheets improved the service and ultimate load capabilities, and they were also able to demonstrate that a model created by the finite element program, ANSYS, returned results that agreed well with their experimental test.
Al-Rousan [22] examined the flexural behavior of one-way RC slabs with various opening dimensions and the strengthening effect of CFRP ropes with various heating levels. It was discovered that the size of the produced opening and the exposure temperature influenced the extent to which CFRP ropes were able to mitigate the loss of mechanical properties arising from the presence of the opening. Furthermore, reinforcement with CFRP ropes was found to minimize the percentage capacity reduction in the slab. Additionally, increasing the temperature values by two times what was observed for the yielding stiffness has a greater impact on initial stiffness.
Although openings are regularly required in RC slabs for architectural requirements or for services, to the best of the author’s knowledge, no studies have been conducted to investigate the effect of openings in skew slabs. The main objective of this study, therefore, is to investigate the effect of openings on the mechanical properties of skewed RC slabs.
2 Description of structures
In this work, the modeling of RC skew slabs was based on experimental data obtained from the research conducted by Miah and Khasro [7]. The model has two opposites, which are simply supported, and has a 45° skew angle. The thickness of the slab was 75 mm, and the right span of the slab was 1,200 mm from one support center to the other, as shown in Figure 1. The actual diameter and yield strength of steel were 8.4 mm and 280 MPa, respectively.

Skew plate geometry.
The reinforcement steel arrangement of the skew slab is shown in Figure 2, and the clear bottom cover was 12 mm. Two cases of loading were considered in this experimental work [7]. The first was a single-point load (S1), and the second was a four-point load (S2), as shown in Figure 3. Steel plates with a width of 100 mm were used for the simple supports of the skew slab. The concrete strength of S1 and S2 was 26.5 and 28.5 MPa, respectively.
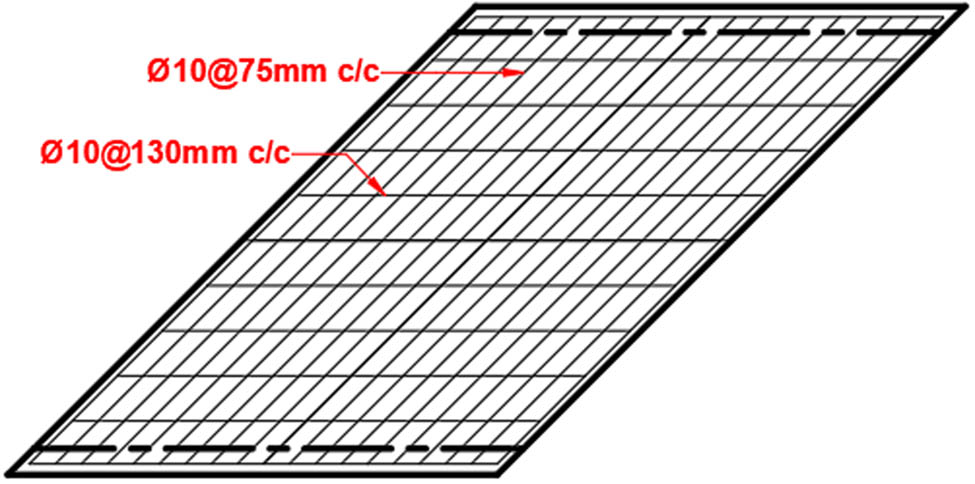
Skew plate steel reinforcement.
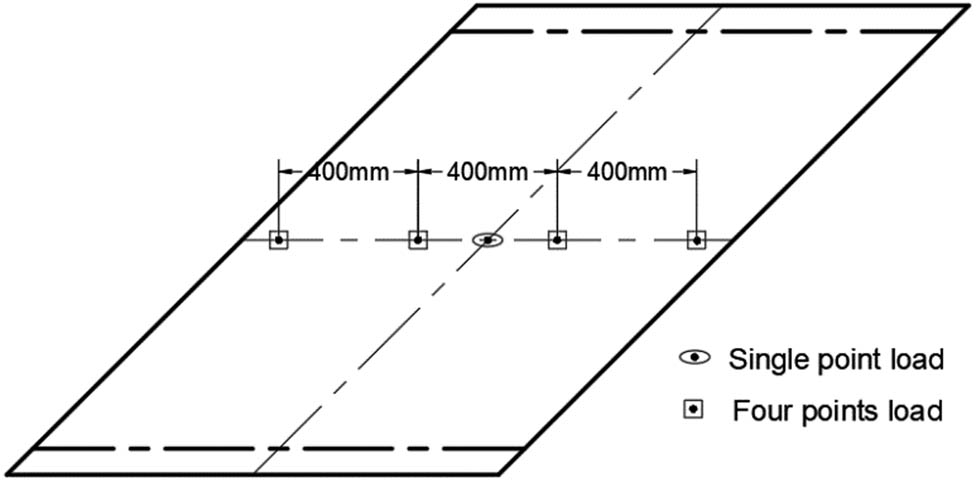
Loading position.
3 Modeling of skew slab
The finite element method was used to simulate the skew plate using ANSYS software. The Solid65 element in ANSYS was used to simulate the concrete. This element contains eight nodes, each with three degrees of freedom, referred to as the nodal x, y, and z translations. This component can undergo plastic deformation, crack in three orthogonal directions, and be crushed. The LINK180 element was used to symbolize the steel reinforcement. In the x, y, and z directions, the LINK180 element possesses three degrees of freedom: u, v, and w.
The modeling of the loading steel pad (100 mm × 100 mm) and steel support was accomplished with SOLID185. SOLID185 is a three-dimensional element for representing isotropic solids. Each node has three translational degrees of freedom in the x, y, and z nodal directions. Additionally, SOLID185 can represent prism, tetrahedral, and pyramid degeneration in irregular regions. There is a potential for distributed surface loads to act upon the element’s surfaces (pressures), and the element can be used to alleviate problems such as large deflections, large strains, plasticity, and creep. The open and closed shear transfer coefficients in the finite element analysis should be within zero and unity [23,24]. A smooth crack is represented by a value of 0 (no shear transfer). A rough crack has a value of 1.0 (no loss of shear transfer) [25]. In this study, these coefficients were, respectively, 0.095 and 0.95 for the single-point load case (S1), and 0.3 and 0.9 for the four-point loading case (S2). Table 1 illustrates input data for the finite element.
Finite element input data
| Value | Concrete | Steel |
|---|---|---|
| Modulus of elasticity | 4,700√
|
200,000 MPa [27] |
| Poisson’s ratio | 0.3 [27] | |
| Ultimate uniaxial tensile strength | 0.62√
|
F y = 280 MPa |
| Stiffness multiplier for cracked tensile condition | 0.7 | — |
The ANSYS software requires the concrete’s uniaxial stress–strain curve. Equations (1)–(3) were thus utilized to determine the adopted (Desayi and Krishnan) stress–strain curve [26]. Figure 4 depicts the uniaxial stress–strain curve for
![Figure 4
Uniaxial stress–strain curve for
F
c
′
{F}_{\text{c}}^{^{\prime} }
= 28.5 MPa [28].](/document/doi/10.1515/eng-2022-0464/asset/graphic/j_eng-2022-0464_fig_004.jpg)
Uniaxial stress–strain curve for
This study used the Newton-Raphson iterative approach for the nonlinear analysis, with convergence evaluation based on the displacement norm [29].
4 Verification of finite element results
Two cases of skew slab loading, S1 and S2, were compared with the experimental and numerical works done by Miah and Kabir [7] to verify the results of the finite element model. Figures 5 and 6 illustrate the load–deflection curves for S1 and S2 slabs. Table 2 shows the cracking load, ultimate load, and maximum mid-span deflection of S1 and S2 slabs. The results of the finite element method clearly showed good agreement with the other results, which gives confidence in the finite element model. The strength is typically overstated by finite elements. This is because the boundary conditions of the finite element model are stiffer than those of the actual structure, and the materials in the model are homogeneous, in contrast to those in the experimental test. The microcracks that drying shrinkage can cause are not taken into account by the models. Additionally, in the calculations using finite elements, a perfect link between the steel reinforcement and the concrete is assumed. For the experimental specimen, there is some slippage, though [30].
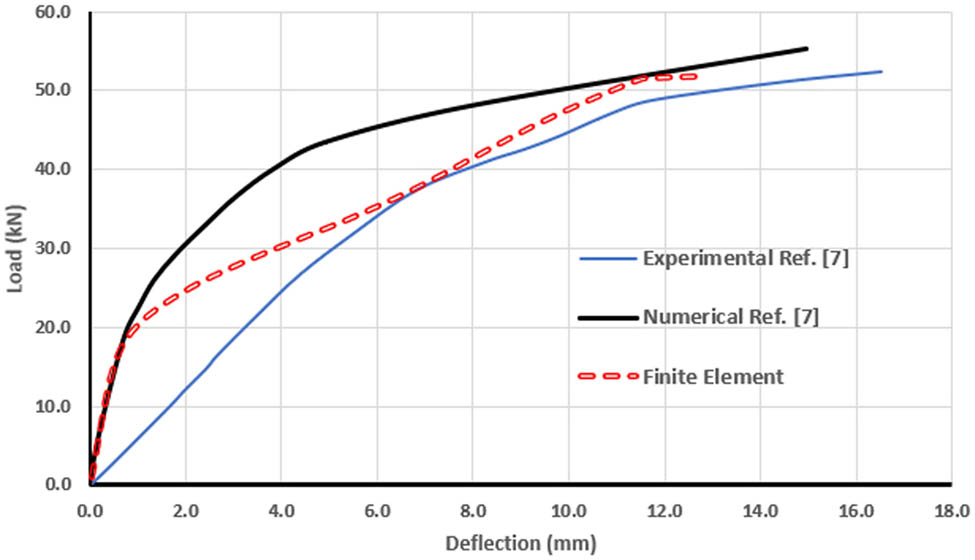
Verifying finite element results with other results for the case of one-point loading (S1).
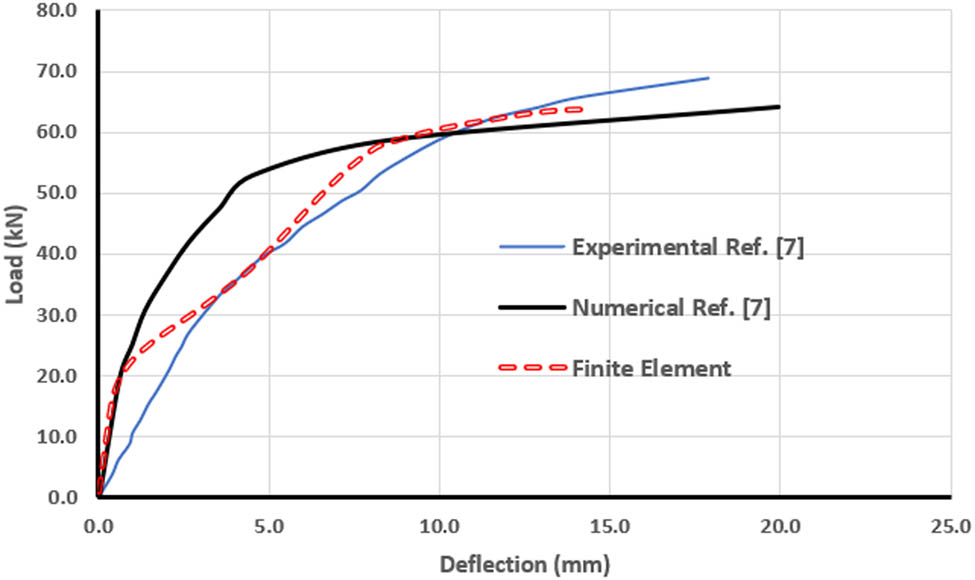
Verifying finite element results with other results for the case of four-point loading (S2).
Verifying finite element results with other results for the cases (S1) and (S2)
| Slab ID | S1 | S2 | ||||||
|---|---|---|---|---|---|---|---|---|
| Measured item | Finite element | Exp. (Ref. [7]) | Numerical (Ref. [7]) | % Difference with experimental | Finite element | Exp. (Ref. [7]) | Numerical (Ref. [7]) | % Difference with experimental |
| First crack load (kN) | 9.5 | 10.5 | 8.5 | 9.5 | 11.5 | 17.4 | 14.5 | 33.9 |
| Ultimate load (kN) | 51.8 | 52.5 | 50 | 1.3 | 63.9 | 69.0 | 67.0 | 7.4 |
| Mid-span deflection (mm) | 12.7 | 16.5 | 15 | 23.0 | 14.5 | 17.9 | 19.9 | 19.0 |
5 Studied cases
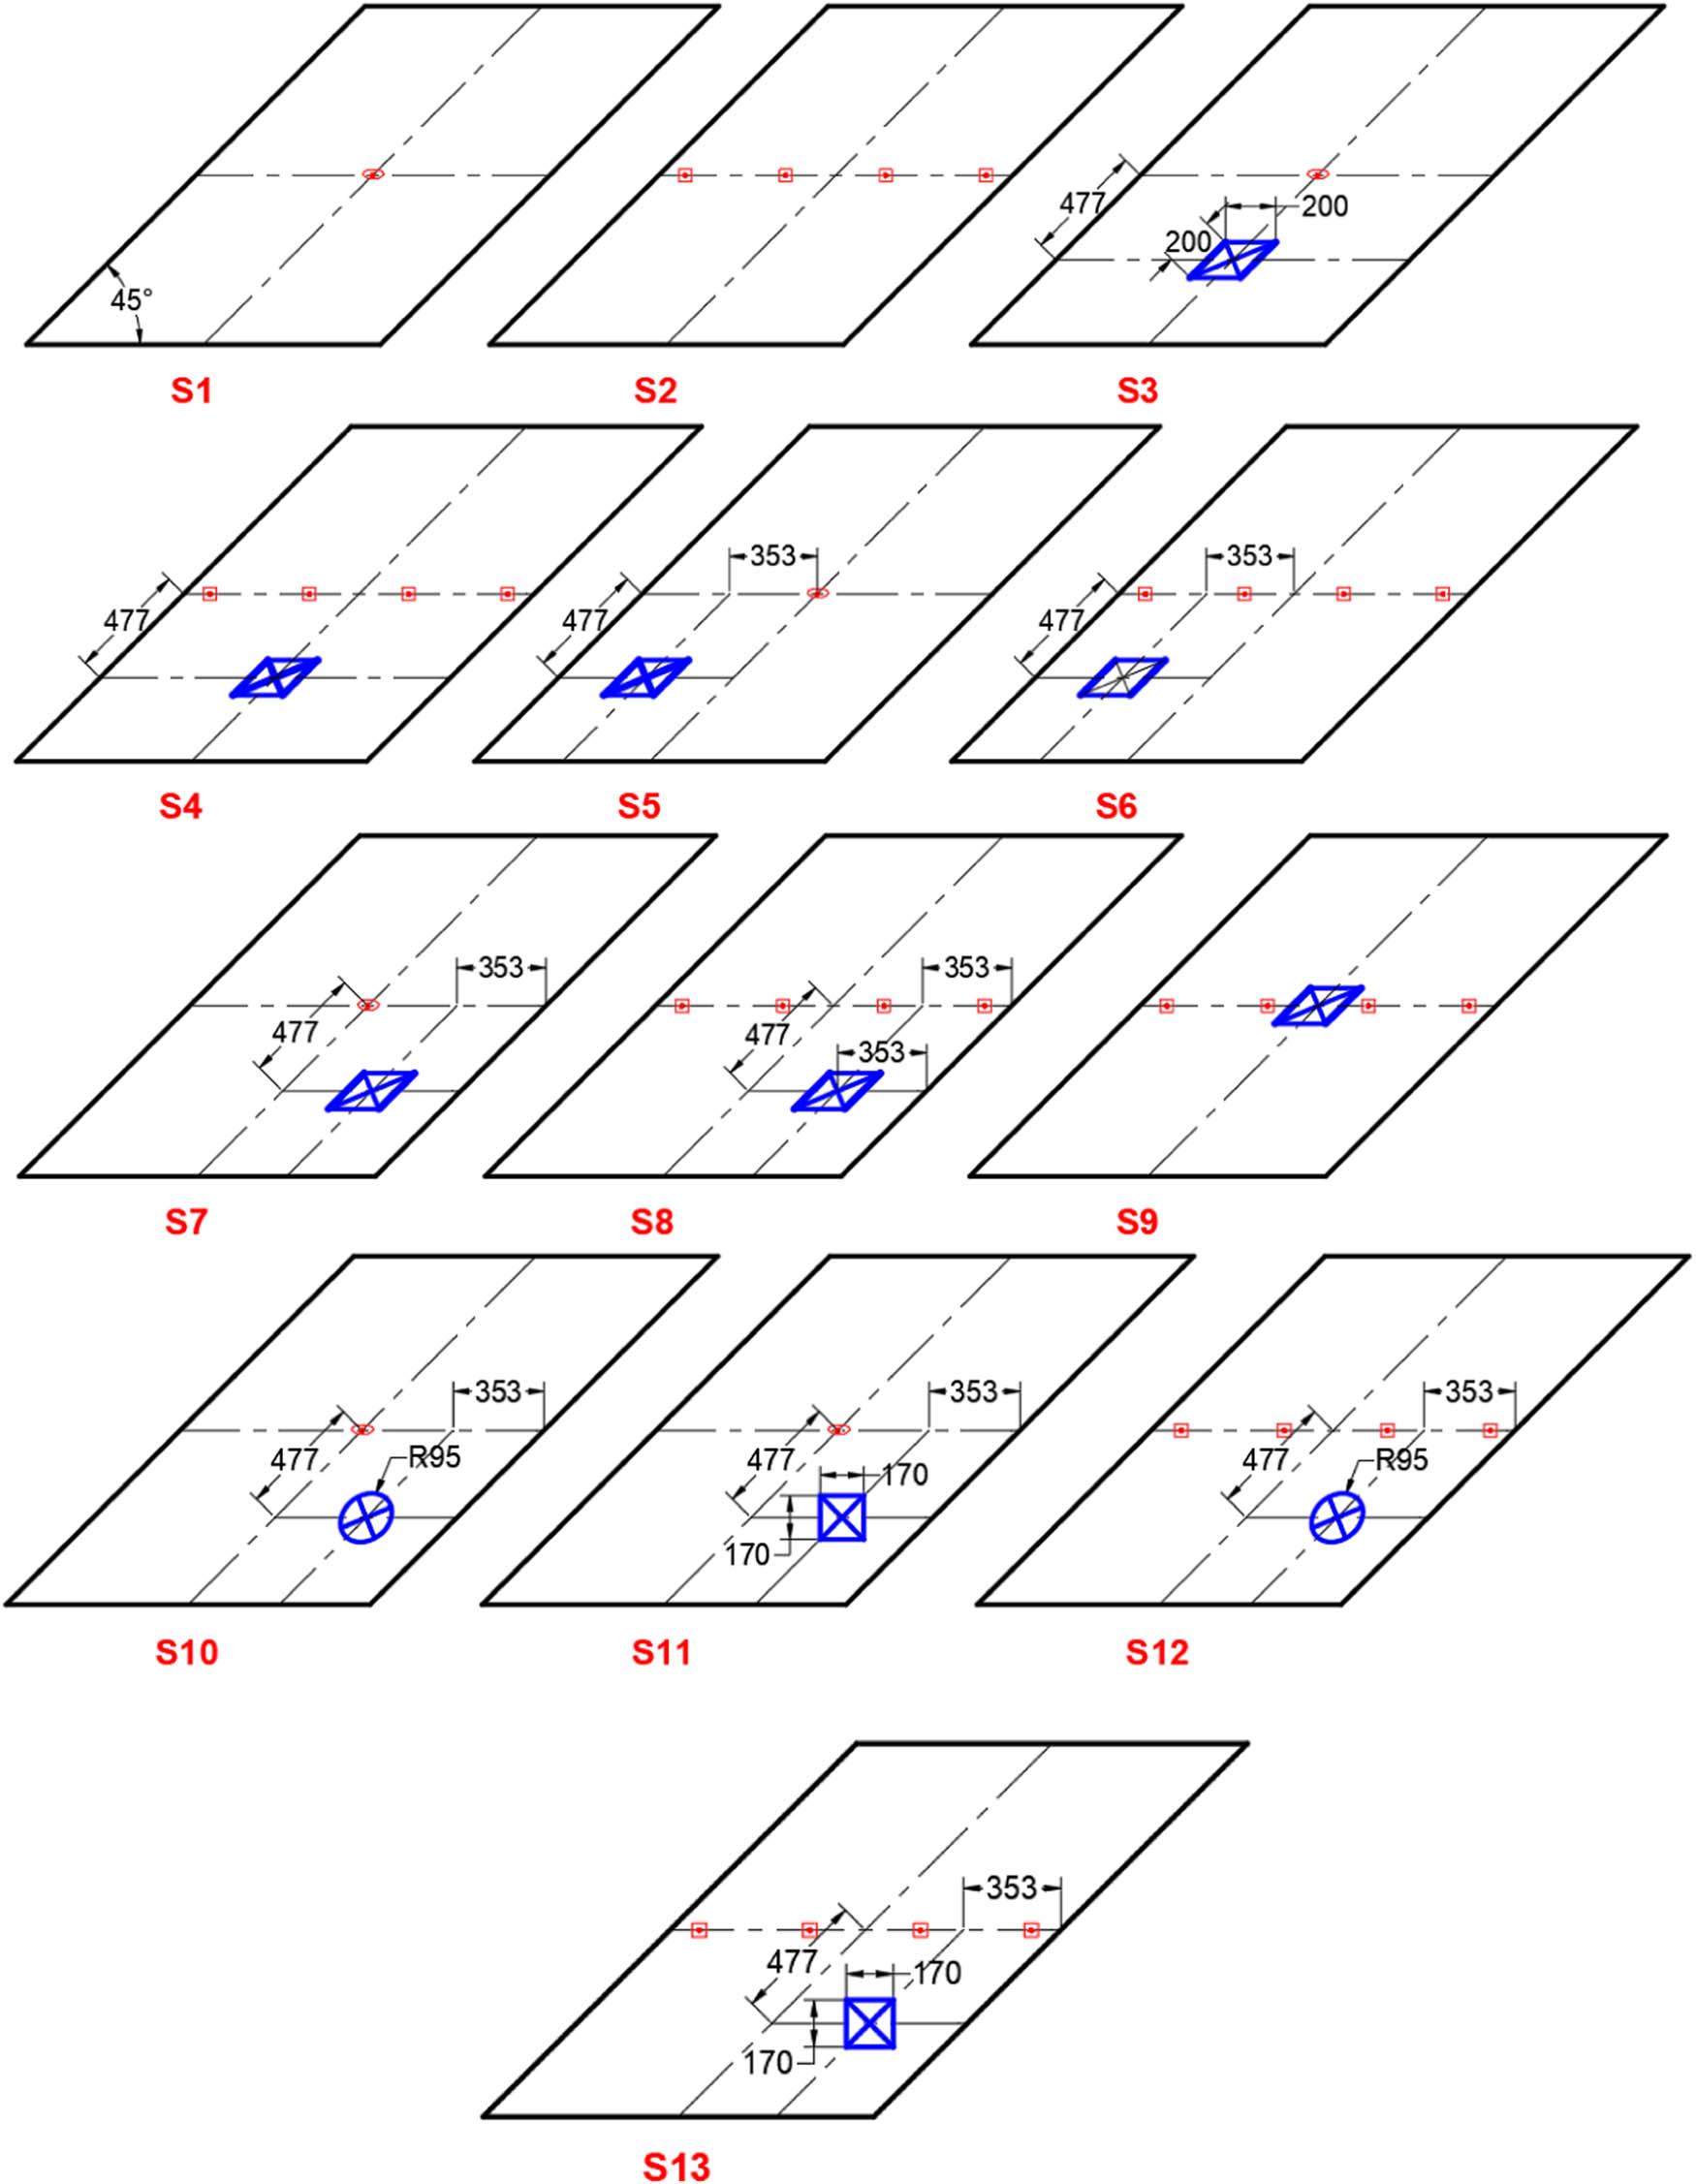
Thirteen cases of skew slabs were considered in this study, including two loading types (one-point loads and four-point loads), different opening positions, and different shapes of opening with an equivalent area. Figure 7 and Table 3 illustrate the details of these cases.
Studied cases of skew slabs.
Skew slab codes and details
| Slab code | Type of loading | Opening | Position |
|---|---|---|---|
| S1 | One-point load | No opening | See Figure 7 |
| S2 | Four-point load | No opening | See Figure 7 |
| S3 | One-point load | 200 mm × 200 mm skew opening | See Figure 7 |
| S4 | Four-point load | 200 mm × 200 mm skew opening | See Figure 7 |
| S5 | One-point load | 200 mm × 200 mm skew opening | See Figure 7 |
| S6 | Four-point load | 200 mm × 200 mm skew opening | See Figure 7 |
| S7 | One-point load | 200 mm × 200 mm skew opening | See Figure 7 |
| S8 | Four-point load | 200 mm × 200 mm skew opening | See Figure 7 |
| S9 | Four-point load | 200 mm × 200 mm skew opening | See Figure 7 |
| S10 | One-point load | 95 mm radius circle opening | See Figure 7 |
| S11 | One-point load | 170 mm × 170 mm square opening | See Figure 7 |
| S12 | Four-point load | 95 mm radius circle opening | See Figure 7 |
| S13 | Four-point load | 170 mm × 170 mm square opening | See Figure 7 |
6 Results and discussion
6.1 Effect of loading
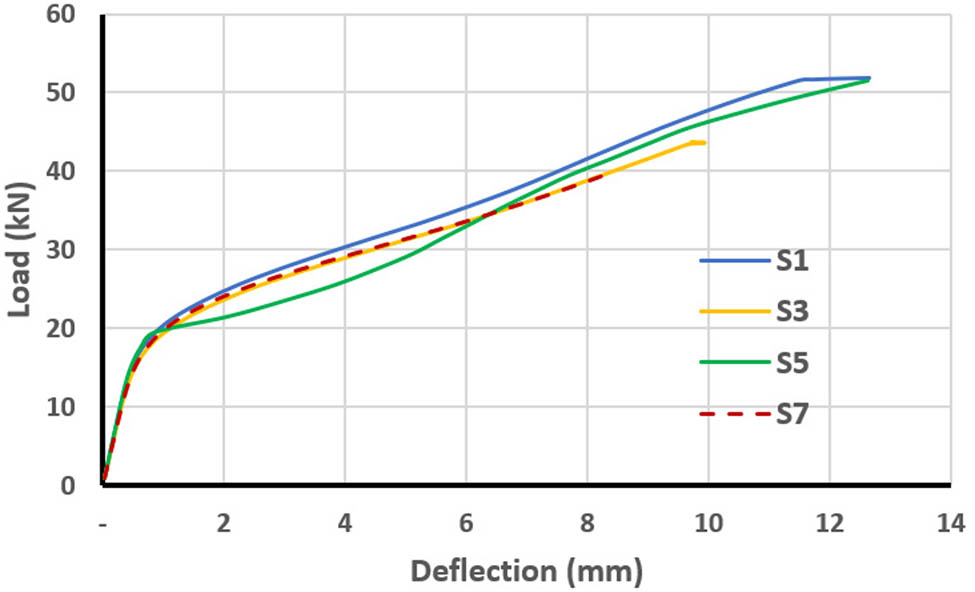
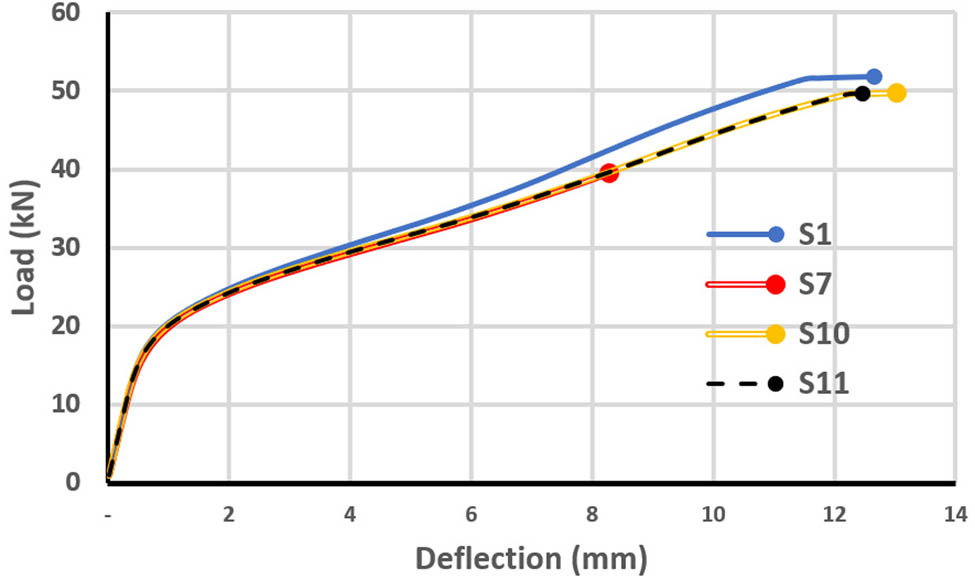
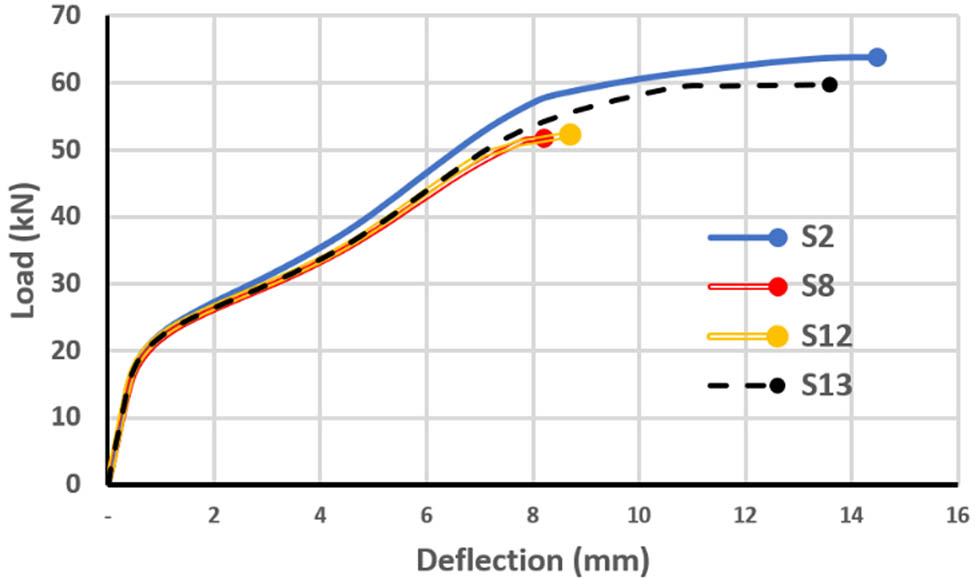
It is evident from Figures 8–13 that the four-point loading achieves a higher ultimate load and deflection than the one-point loading. The reason is that the four-point loading distributes the load more effectively over the skew slab. The load–deflection curves depicted in these figures generally behave in a manner that is approximately identical to the linear stage. After that, they display greater stiffness for the four-point loading. The maximum difference of the ultimate mid-span deflection between one-point and four-point loaded slabs with the same opening was recorded in the comparison of slabs S10 and S12 (Figure 12).
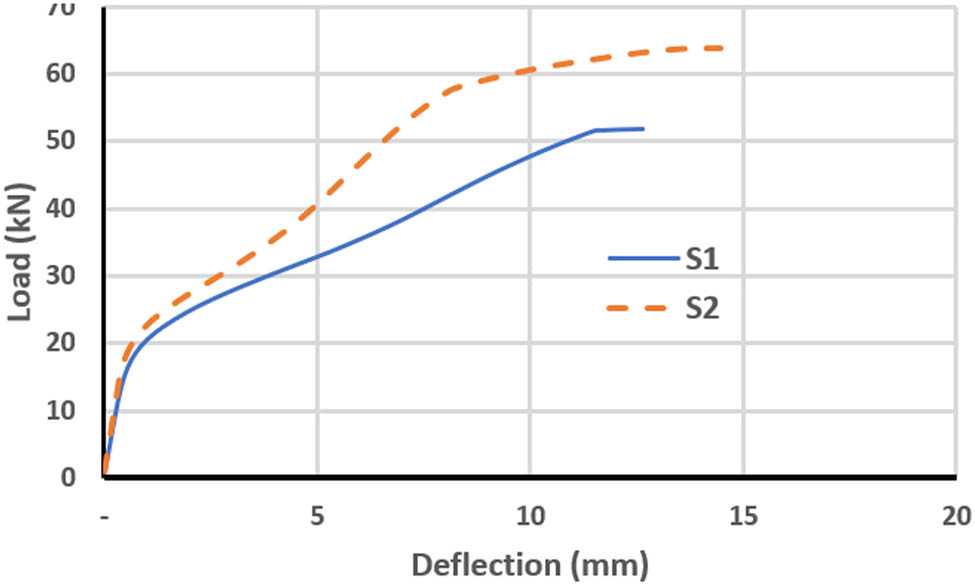
Load–deflection curve for S1 and S2.
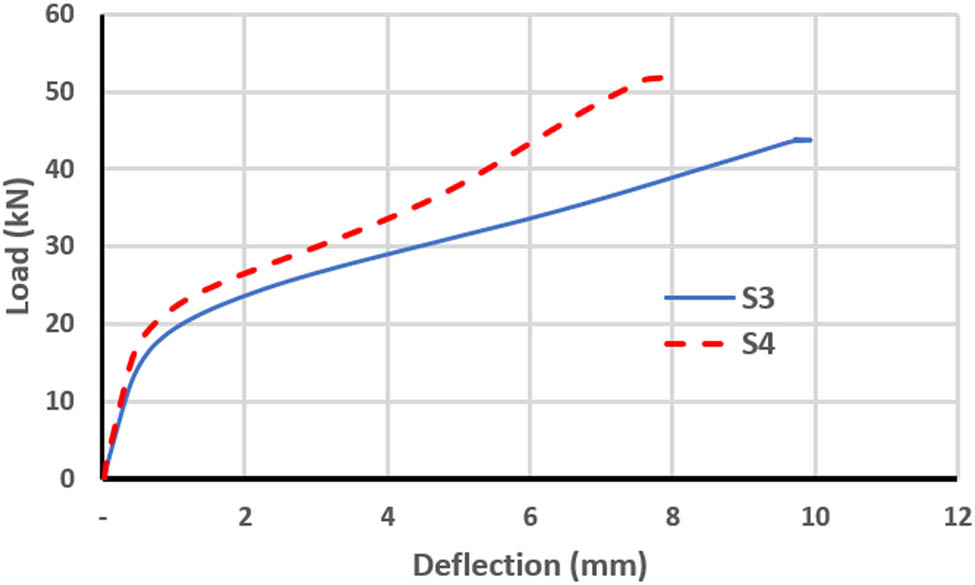
Load–deflection curve for S3 and S4.
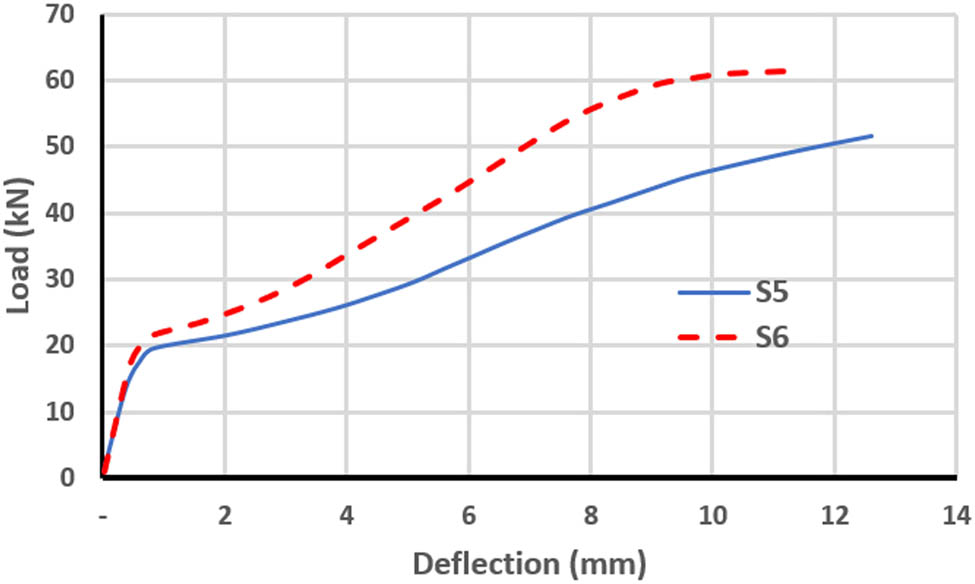
Load–deflection curve for S5 an S6.
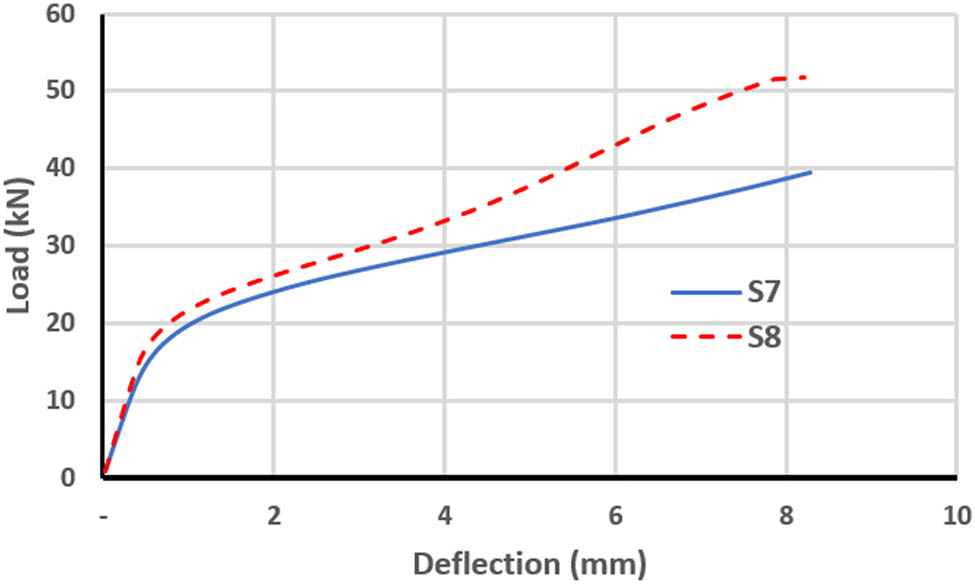
Load–deflection curve for S7 and S8.
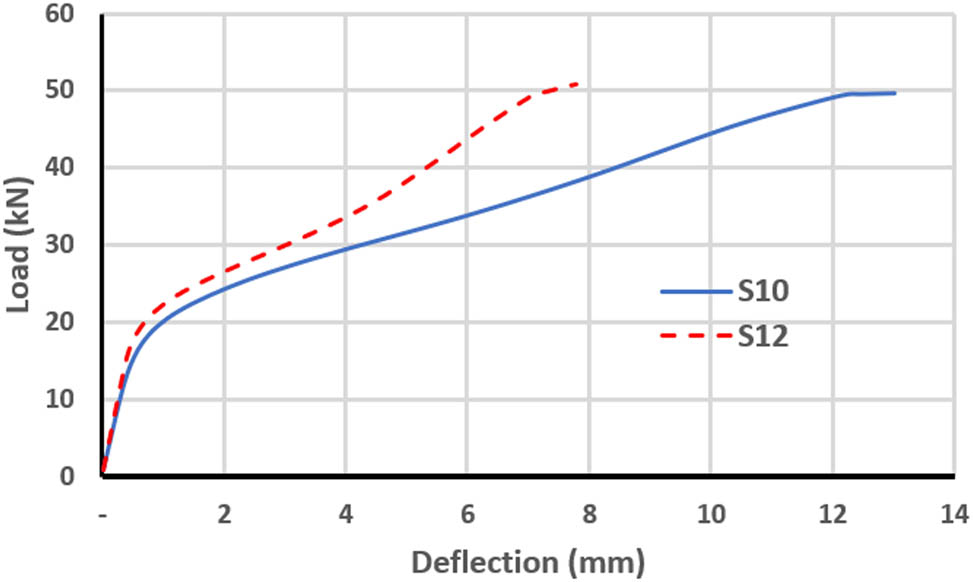
Load–deflection curve for S10 and S12.
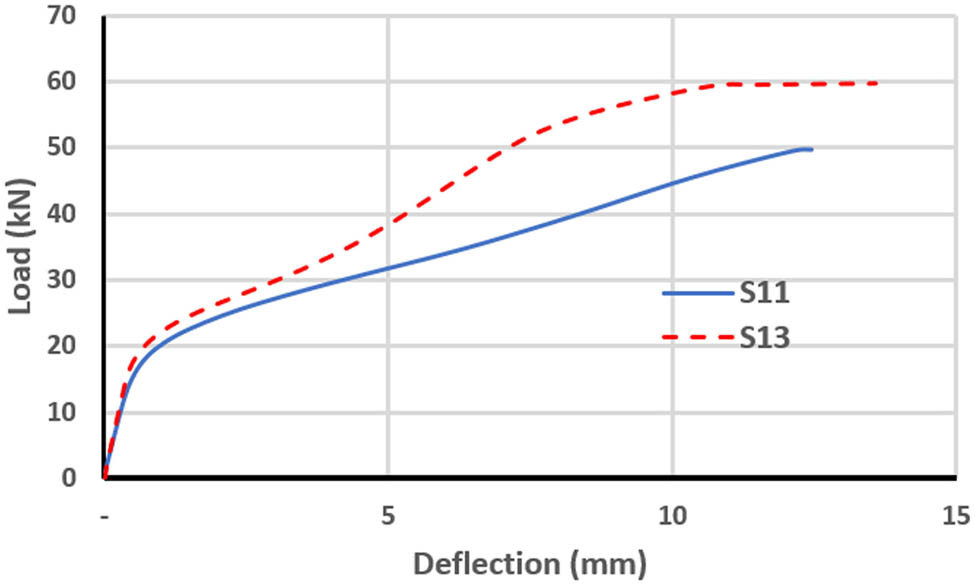
Load–deflection curve for S11 and S13.
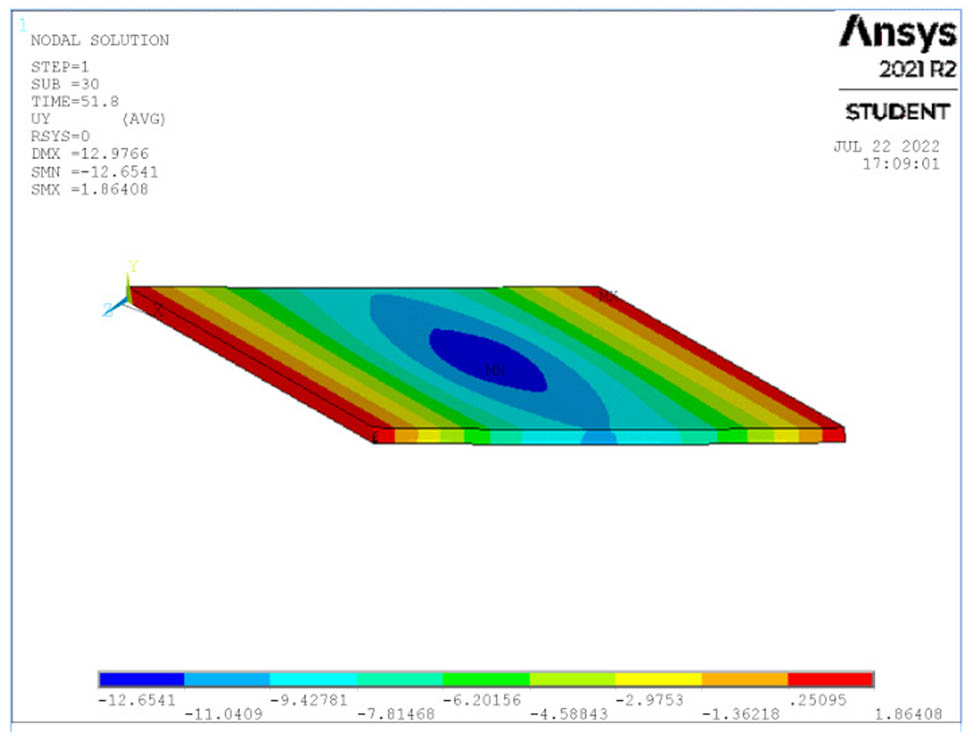
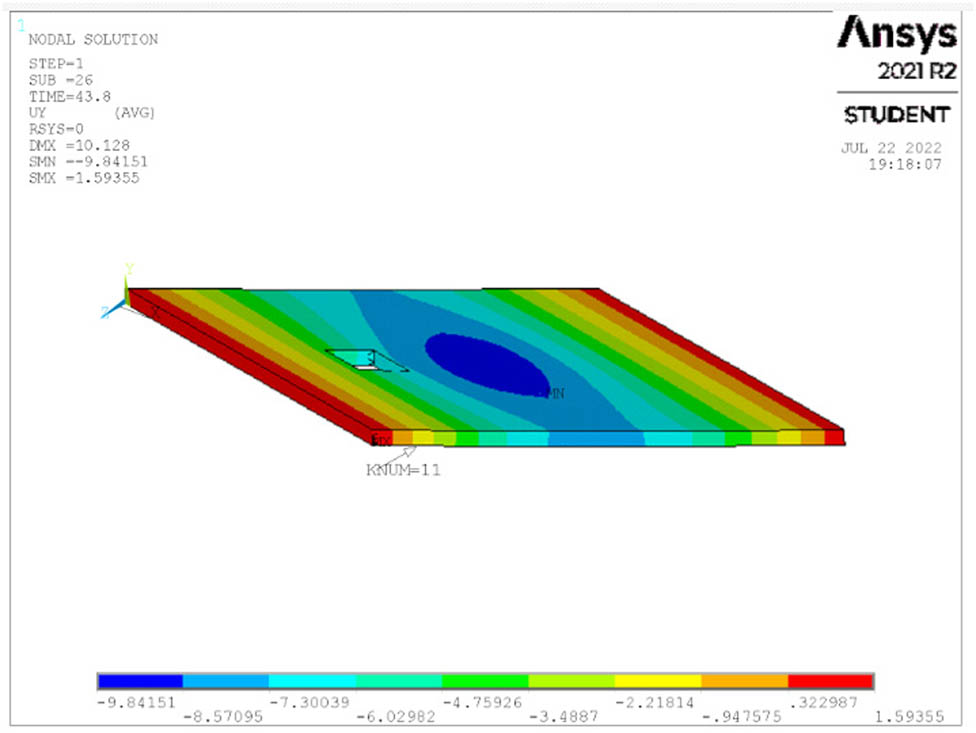
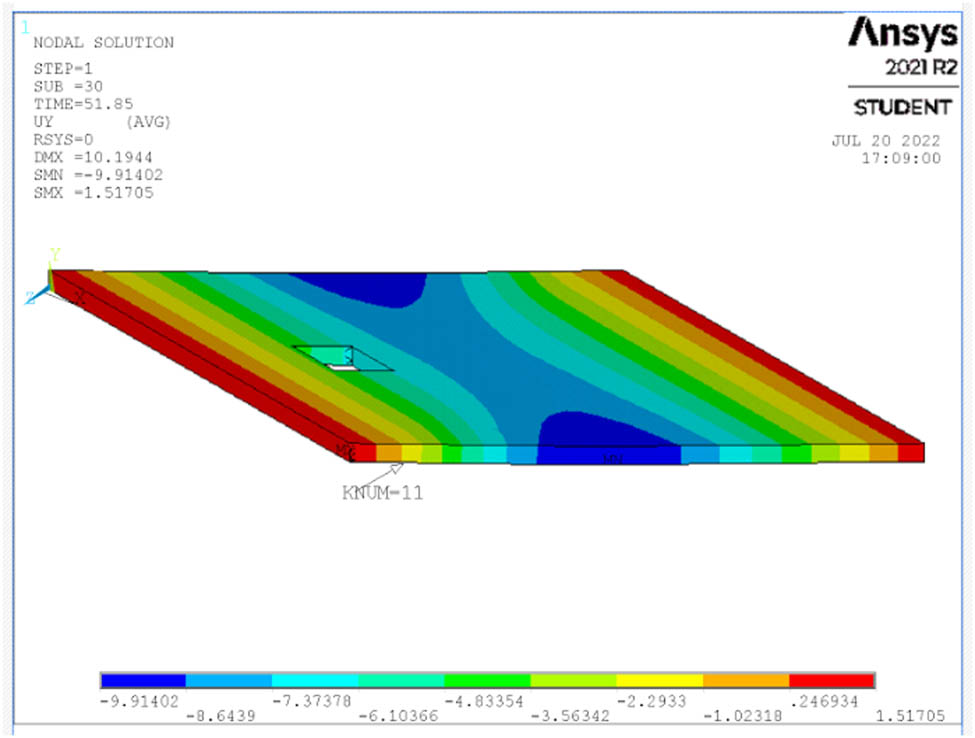
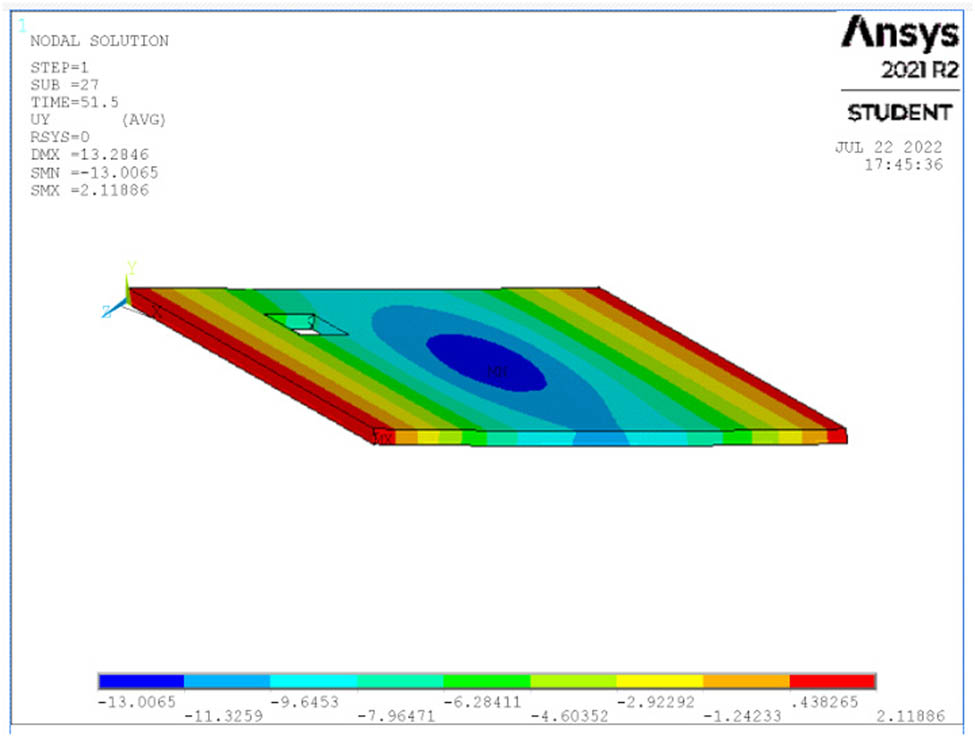
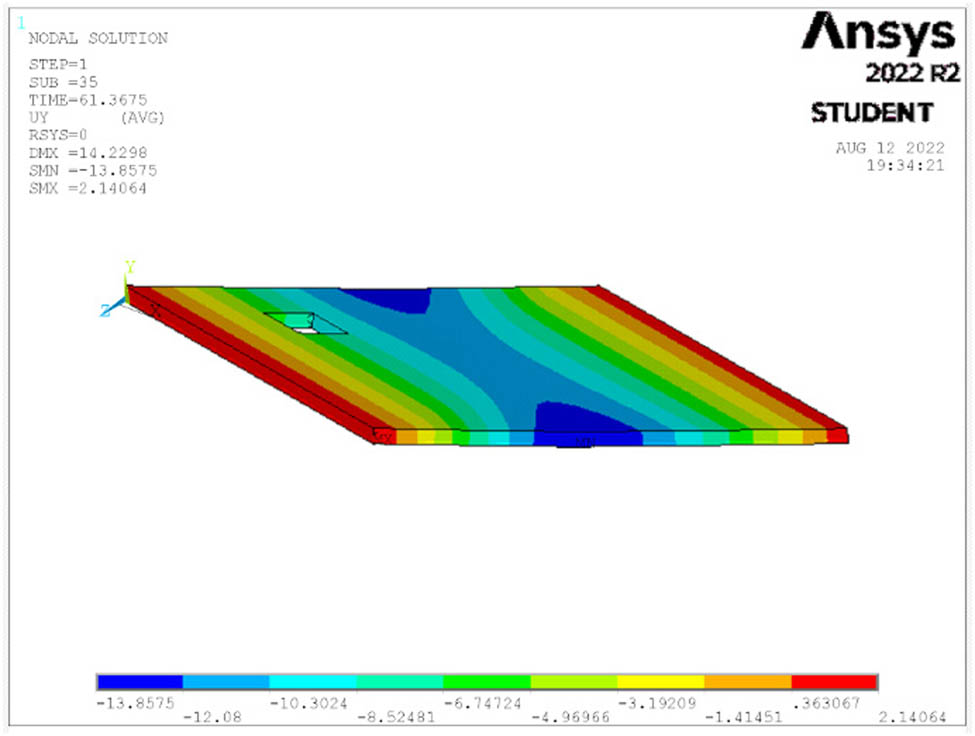
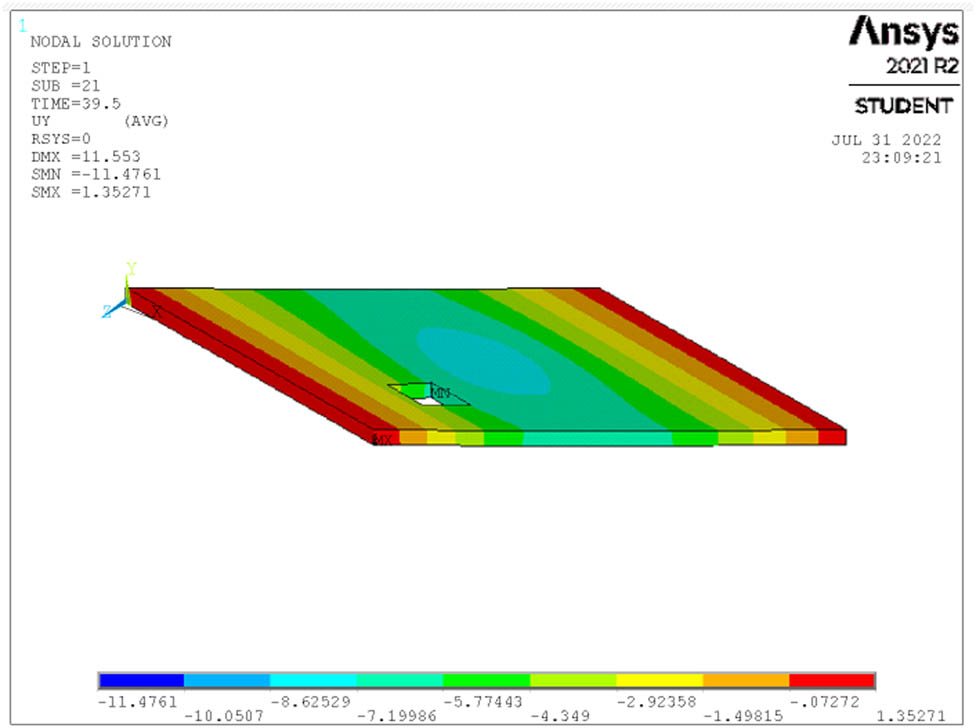
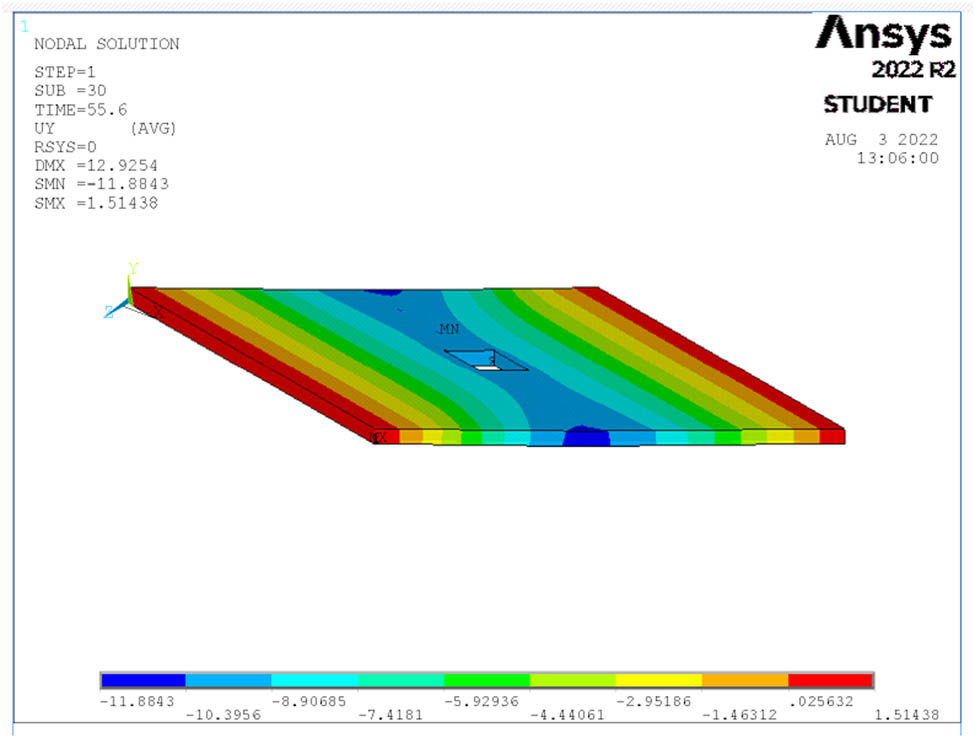
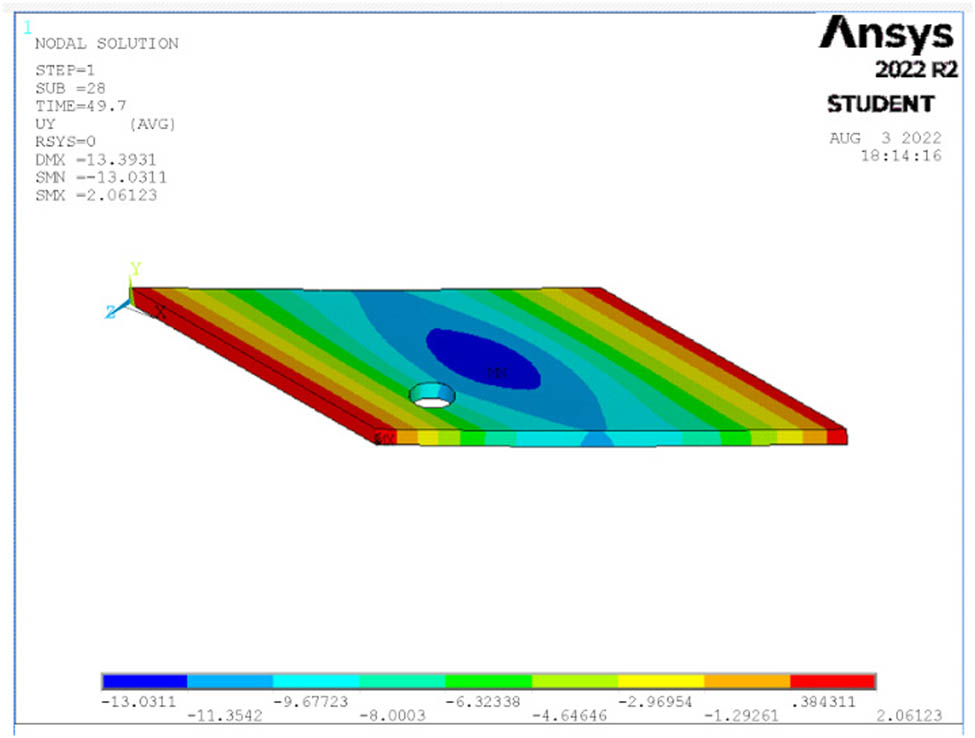
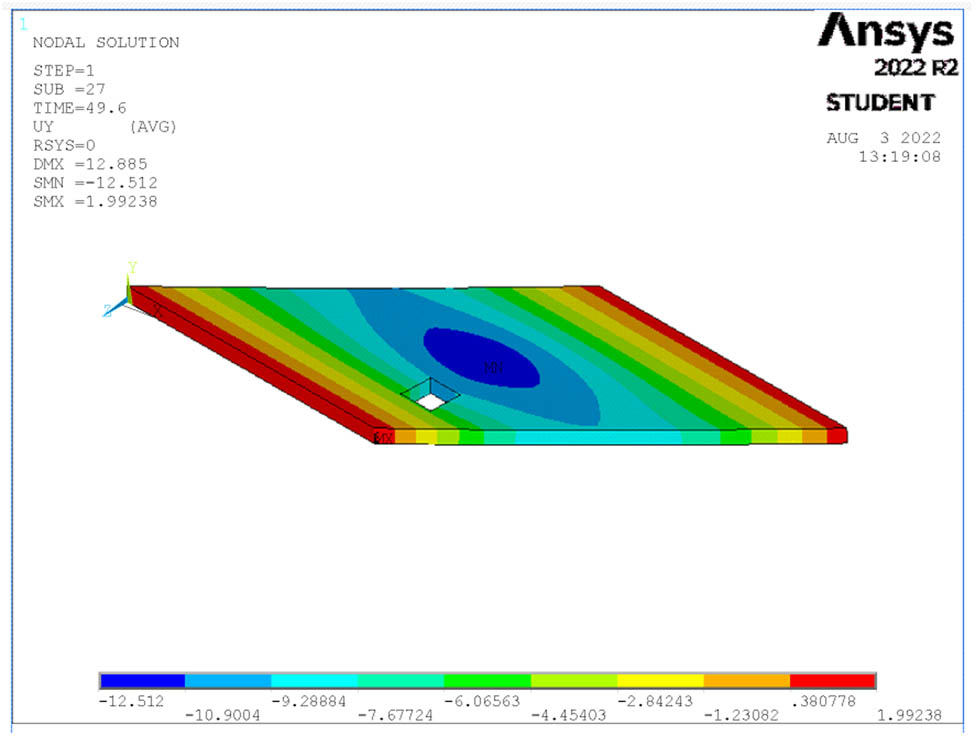
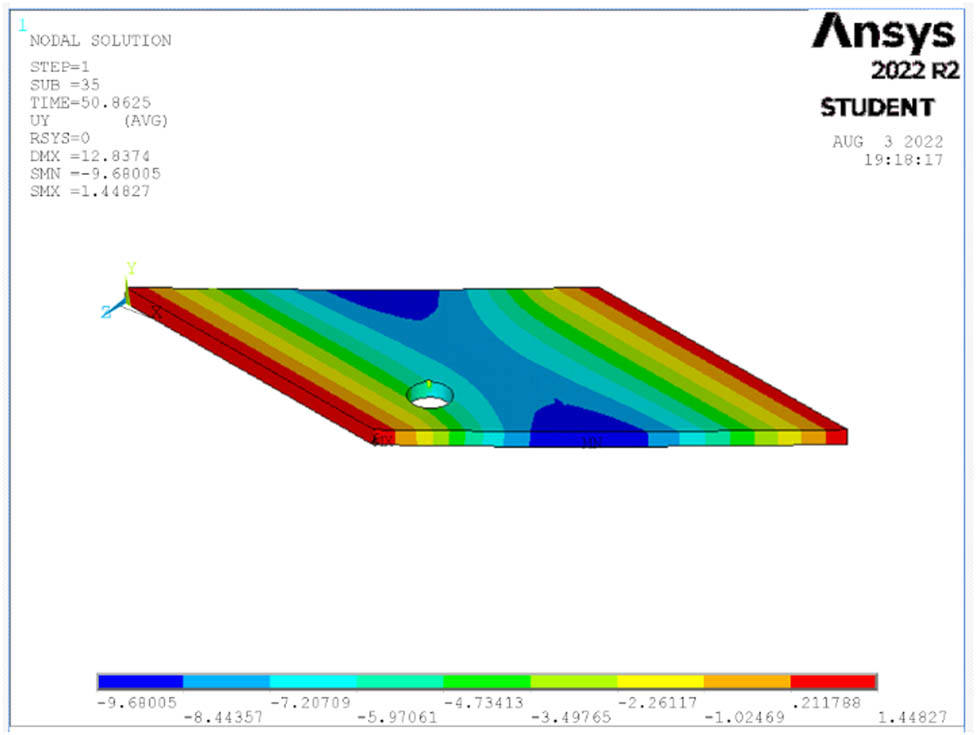
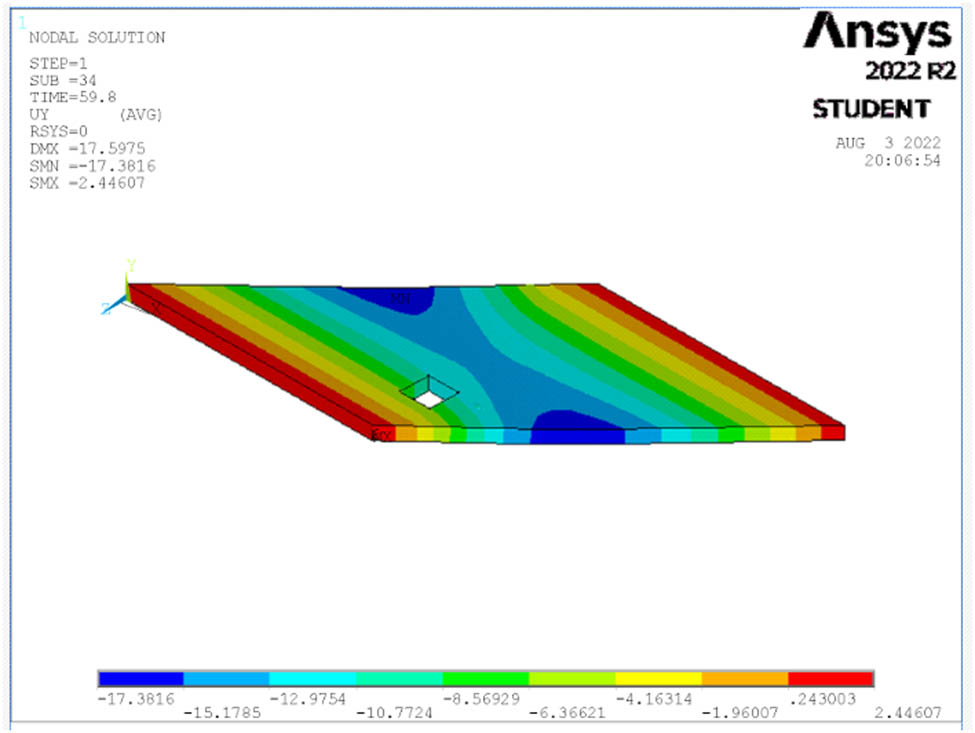
The deflection of all studied cases of the skew slabs is shown in Figures 14–26 for each case at the maximum load. When a single point is loaded, the maximum deflection is seen in the middle of the slab. When a four-point load is applied, however, the maximum deflection is visible at both edges of the slabs’ middle span.
Deflection at ultimate load for S1.
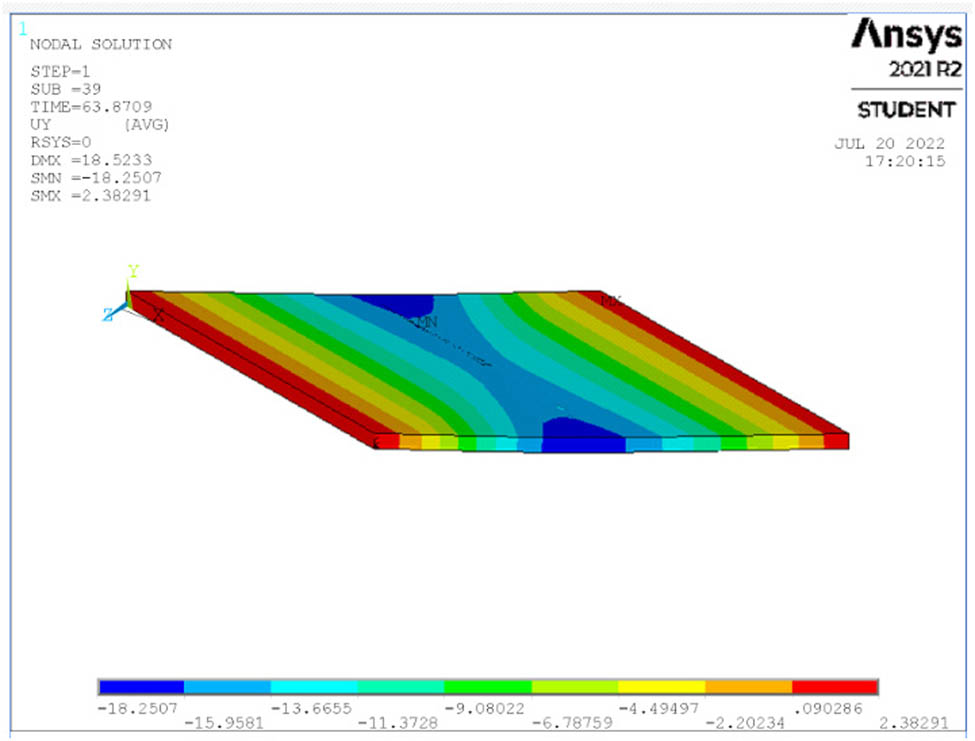
Deflection at ultimate load for S2.
Deflection at ultimate load for S3.
Deflection at ultimate load for S4.
Deflection at ultimate load for S5.
Deflection at ultimate load for S6.
Deflection at ultimate load for S7.

Deflection at ultimate load for S8.
Deflection at ultimate load for S9.
Deflection at ultimate load for S10.
Deflection at ultimate load for S11.
Deflection at ultimate load for S12.
Deflection at ultimate load for S13.
6.2 Effect of the position of the opening
The load–deflection curves for different positions of skew opening are shown in Figures 27 and 28. Table 4 illustrates that, for one-point loading, the opening has a negligible effect on ultimate load and deflection when it is located near the acute corner (S5), but has the maximum effect when located near the obtuse corner (S7), where it lowers the ultimate load by 23.7% and the deflection at ultimate load by 34.6% compared with a slab with no opening. When the opening is located at the position of (S3), the ultimate load and deflection decrease by 15.4 and 23.6%, respectively, compared with a slab with no opening. Meanwhile, slab S5 was able to withstand the largest load before the initial crack manifested (at 11.5 kN), whereas a crack developed in slab S7 with a loading of only 2 kN.
Load–deflection curves for slabs with one-point loading and openings located in different positions.
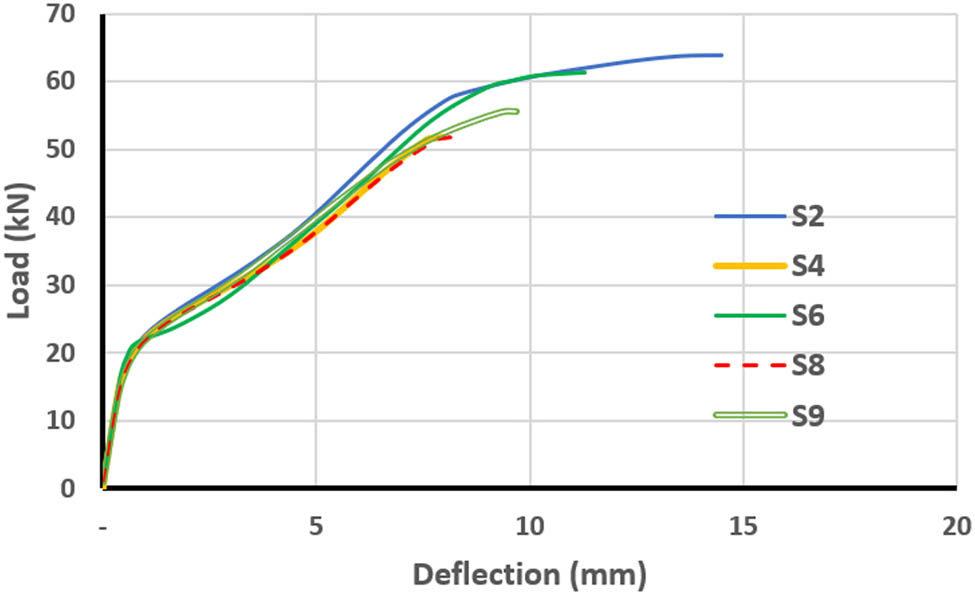
Load–deflection curves for slabs with four-point loading and openings located in different positions.
Results of slab cases for different opening positions under one-point loading
| Skew slab ID | First crack load (kN) | % Difference of first crack | Ultimate load (kN) | % Difference of ultimate load | Midspan deflection (mm) | % Difference of mid span deflection |
|---|---|---|---|---|---|---|
| S1 | 9.5 | 0 | 51.8 | 0 | 12.7 | 0 |
| S3 | 3.5 | −63.2 | 43.8 | −15.4 | 9.7 | −23.6 |
| S5 | 11.5 | 21.1 | 51.5 | −0.6 | 12.6 | −0.8 |
| S7 | 2 | −78.9 | 39.5 | −23.7 | 8.3 | −34.6 |
For four-point loading, the results in Table 5 show that there is only a slight effect on ultimate load and deflection when the opening is located near the acute corner (S6) the same as for one-point loading but has the maximum effect when the opening is located near the obtuse corner (S4 and S8). Specifically, when the opening is located near the obtuse corner (S8), ultimate load and deflection are reduced by 18.9 and 43.4%, respectively, compared with a slab with no opening. Meanwhile, when the opening is located at the position of S4, the ultimate load and deflection decrease by 18.9 and 44.8%, respectively, compared with a slab with no opening. The minimal effect on structural integrity associated with openings located near the acute corner (S6) could be because the applied load on the skew slab tries to transfer to the supports with the minimum energy. This means that the load path in such a structure tends to take the shortest path possible to the supports at the obtuse corners of the slab spans [31], as shown in Figure 29. It was also noticed that when the opening was located near the obtuse corner negative cracking was induced near the opening toward the supports, as shown in Figure 30, causing a reduction in skew slab strength.
Results of slab cases for different opening positions under four-point loading
| Skew slab ID | First crack (kN) | % Difference of first crack | Ultimate load (kN) | % Difference of ultimate load | Midspan deflection (mm) | % Difference of midspan deflection |
|---|---|---|---|---|---|---|
| S2 | 11.5 | 0 | 63.9 | 0 | 14.5 | 0 |
| S4 | 7.5 | −34.8 | 51.85 | −18.9 | 8 | −44.8 |
| S6 | 13.5 | 17.4 | 61.4 | −3.9 | 11.3 | −22.1 |
| S8 | 3.5 | −69.6 | 51.8 | −18.9 | 8.2 | −43.4 |
| S9 | 9.5 | −17.4 | 55.6 | −13.0 | 9.7 | −33.1 |
![Figure 29
Effective load transfer pathway [31].](/document/doi/10.1515/eng-2022-0464/asset/graphic/j_eng-2022-0464_fig_029.jpg)
Effective load transfer pathway [31].
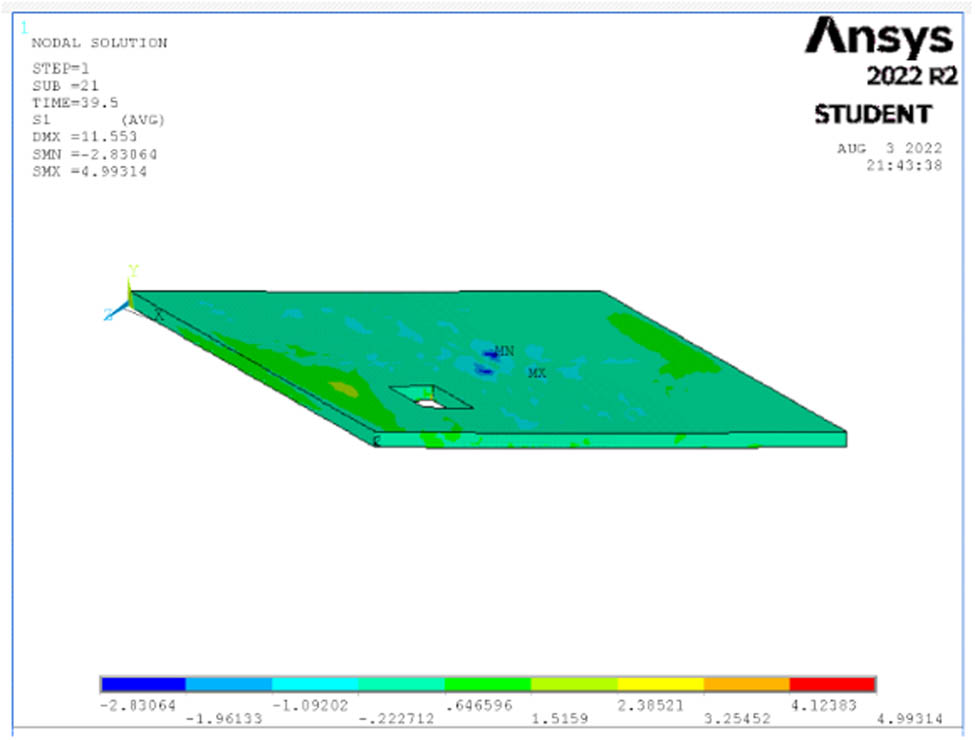
Stresses at ultimate load in first principal direction for S7.
6.3 Effect of opening shape
Three shapes of openings with the same area were selected in this study: skew, circle, and rectangular shapes. The skew opening had dimensions of 200 mm × 200 mm, the circle had a radius of 950 mm, and the rectangular had dimensions of 170 mm × 170 mm. The location of these openings was chosen to be near the obtuse corner because this location has more effect on the skew slab strength, as discussed in the previous section. Here, it was evident that the effect of the opening depends mainly on the steel removed, and the negative cracks appear due to the opening. Figures 31 and 32 show the load–deflection curves for different shapes of opening for one-point and four-point loading, respectively.
Load–deflection curves for slabs with one-point loading with different shapes of opening.
Load–deflection curves for slabs with four-point loading with different shapes of opening.
The skew shape opening depicts more reduction in slab strength than other shapes (by 78.9 and 69.6% for one-point and four-point loading, respectively, compared with a slab with no opening, as shown in Tables 6 and 7). In one-point loading, circular and rectangular openings introduce approximately the same amount of strength reduction, which was about 4%. In contrast, in the four-point loading, the rectangular opening recorded better performance than other opening shapes, as shown in Table 7.
Results of slab cases for different opening shapes under one-point loading
| Slab ID | First crack load (kN) | % Difference of first crack | Ultimate load (kN) | % Difference of ultimate load | Midspan deflection (mm) | % Difference of midspan deflection |
|---|---|---|---|---|---|---|
| S1 | 9.5 | 0 | 51.8 | 0 | 12.7 | 0 |
| S7 | 2 | −78.9 | 39.5 | −23.7 | 8.3 | −34.6 |
| S10 | 9.5 | 0.0 | 49.7 | −4.1 | 13 | 2.4 |
| S11 | 7.5 | −21.1 | 49.6 | −4.2 | 12.5 | −1.6 |
Results of slab cases for different opening shapes under four-point loading
| Slab ID | First crack (kN) | % Difference of first crack | Ultimate load (kN) | % Difference of ultimate load | Midspan deflection (mm) | % Difference of midspan deflection |
|---|---|---|---|---|---|---|
| S2 | 11.5 | 0 | 63.9 | 0 | 14.5 | 0 |
| S8 | 3.5 | −69.6 | 51.8 | −18.9 | 8.2 | −43.4 |
| S12 | 11.5 | 0.0 | 52.3 | −18.2 | 8.7 | −40.0 |
| S13 | 9.5 | −17.4 | 59.8 | −6.4 | 13.6 | −6.2 |
Figures 33–35 show the distribution of steel reinforcement stresses at ultimate load under the different types of openings (Figure 36).

Steel reinforcement stresses at ultimate load for S1.
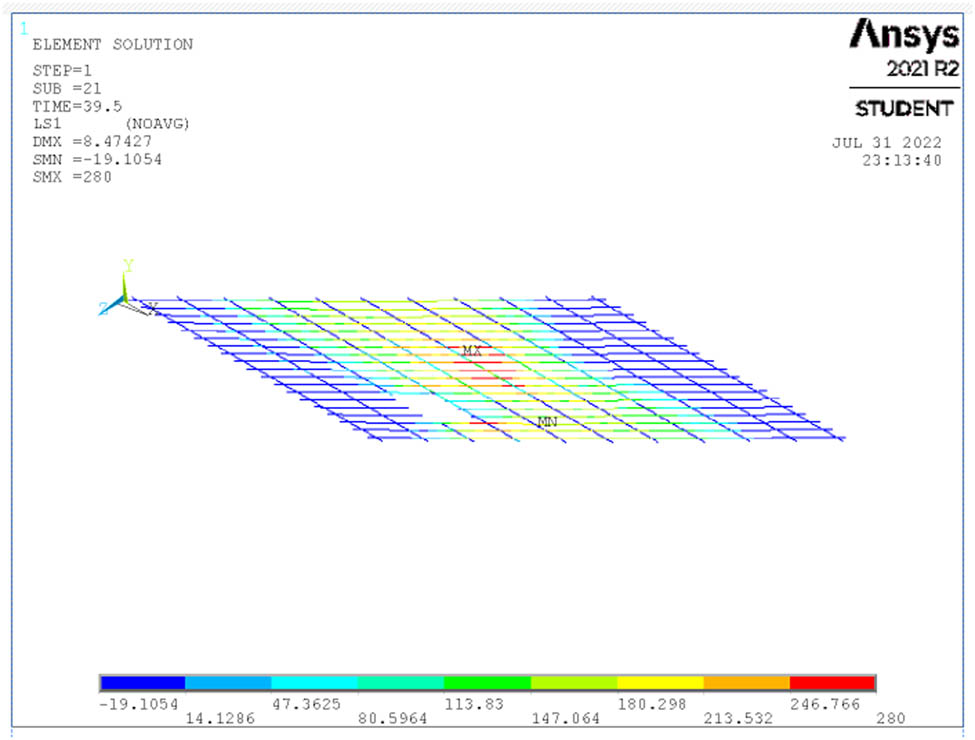
Steel reinforcement stresses at ultimate load for S7.
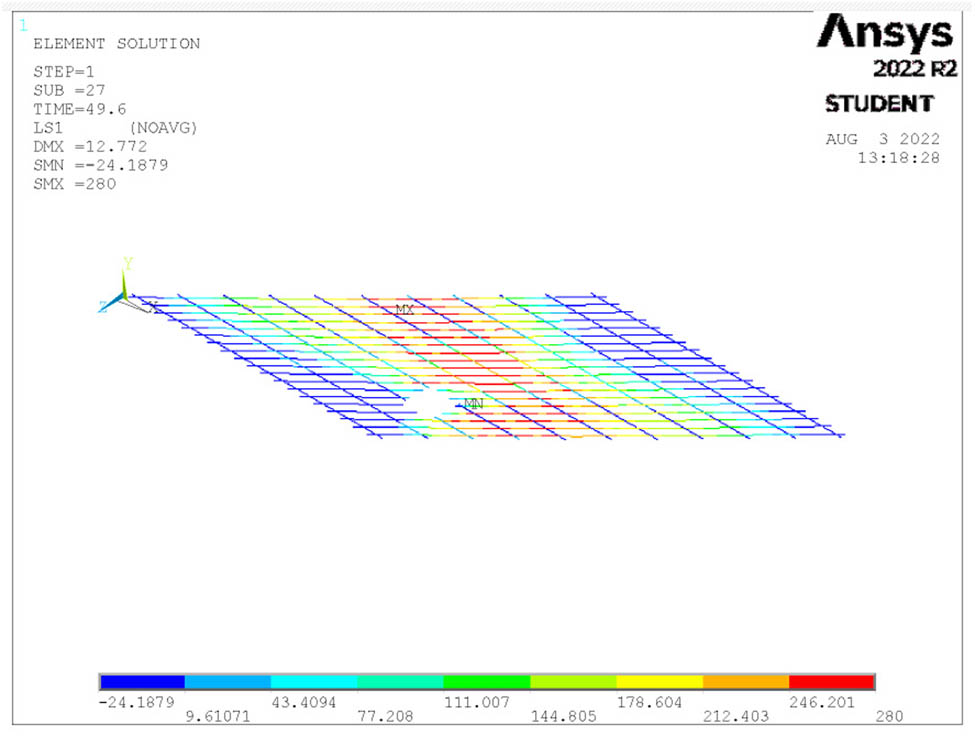
Steel reinforcement stresses at ultimate load for S11.
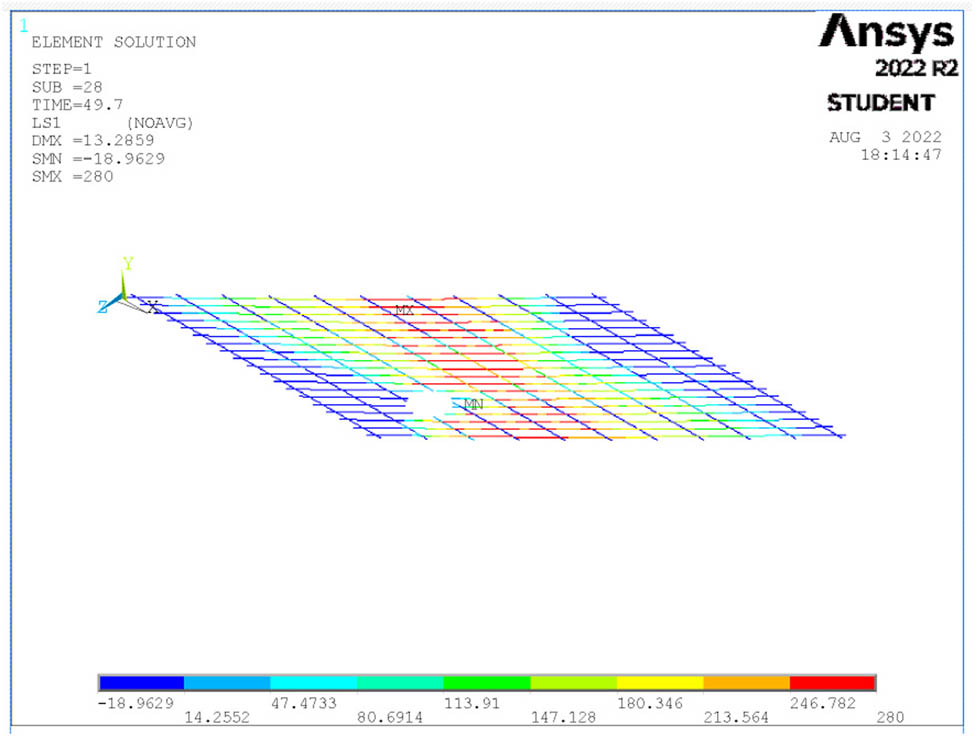
Steel reinforcement stresses at ultimate load for S10.
7 Conclusion
The main conclusions that can be drawn from the current study are as follows:
When four-point loading is applied, the skew slab behaves more stiffly and has higher ultimate strength than under one-point loading due to the more efficient distribution of the load.
The skew slab is sensitive to the location of the opening. While all opening positions cause a decrease in the strength of the skew slab, the biggest reduction in strength occurs when the opening is located in the region between the obtuse corners of the skew slab, which is the region in which most of the load is transferred. Engineers should therefore take care to determine the suitable location for the opening.
Given the same opening location, the skew slab’s strength is also affected by the shape of the opening, with the skew opening reducing the ultimate strength by more than the square and circle openings.
The impact of the opening shape also depends on how many steel reinforcements are removed and the appearance of negative cracking brought on as a result of the opening.
Negative steel reinforcement is highly recommended when an opening is needed in a skew slab to prevent cracking and maintain the slab’s strength.
-
Conflict of interest: Authors state no conflict of interest.
References
[1] Moya L, Lantsoght EO. Parametric study on the applicability of AASHTO LRFD for simply supported reinforced concrete skewed slab bridges. Infrastructures. 2021 Jun 16;6(6):88.10.3390/infrastructures6060088Search in Google Scholar
[2] Ismail E. Distribution of stresses and displacements in skewed concrete slabs. MSc thesis. Linnaeus University, Faculty of Technology; 2017.Search in Google Scholar
[3] Abozaid LA, Hassan A, Abouelezz AY, Abdel-Hafez LM. Nonlinear behaviour of a skew slab bridge under traffic loads. World Appl Sci J. 2014;30(11):1479–93.Search in Google Scholar
[4] Huang H, Shenton HW, Chajes MJ. Load distribution for a highly skewed bridge: Testing and analysis. J Bridge Eng. 2004 Nov;9(6):558–62.10.1061/(ASCE)1084-0702(2004)9:6(558)Search in Google Scholar
[5] Menassa C, Mabsout M, Tarhini K, Frederick G. Influence of skew angle on reinforced concrete slab bridges. J Bridge Eng. 2007 Mar;12(2):205–14.10.1061/(ASCE)1084-0702(2007)12:2(205)Search in Google Scholar
[6] Sindhu BV, Ashwin KN, Dattatreya JK. SV D. Effect of skew angle on static behaviour of reinforced concrete slab bridge decks. Int J Res Eng Technol. 2013 Nov;2(1):50–8.10.15623/ijret.2013.0213010Search in Google Scholar
[7] Miah MK, Kabir A. A study on reinforced concrete skew slab behavior. J Civ Eng (IEB). 2005 Dec;33(2):91–103.Search in Google Scholar
[8] Sharma M. Finite element modelling of reinforced concrete skew slab. ME (Structures) thesis. Punjab: Thapar University Patiala; 2011.Search in Google Scholar
[9] Minalu KK. Finite element modelling of skew slab-girder bridges. M. Sc. D. thesis. Faculty of Civil Engineering and Geosciences, Delft University of Technology; 2010.Search in Google Scholar
[10] Théoret P, Massicotte B, Conciatori D. Analysis and design of straight and skewed slab bridges. J Bridge Eng. 2012 Mar 1;17(2):289–301.10.1061/(ASCE)BE.1943-5592.0000249Search in Google Scholar
[11] Boobalan SC, Abirami P, Indhu K. Numerical examination of reinforced concrete skew slabs. Int J Innov Technol Explor Eng. 2020;9(5):512–6.10.35940/ijitee.E2435.039520Search in Google Scholar
[12] Sharma M, Kwatra N, Singh H. Modelling of flexural response of simply supported RC skew slab. Curr Sci. 2020 Jun 25;118(12):1911.10.18520/cs/v118/i12/1911-1921Search in Google Scholar
[13] Singh A, Kumar A, Khan MA. Effect of skew angle on static behavior of reinforced concrete slab bridge decks: A review. In Res J Eng Technolo. 2016;3:1537–9.Search in Google Scholar
[14] Roll F, Aneja I. Model tests of box-beam highway bridges with cantilevered deck slabs. ASCE Transportation Engineering Conference; 1966 Oct 17.Search in Google Scholar
[15] Khaleel MA, Itani RY. Live-load moments for continuous skew bridges. J Struct Eng. 1990 Sep;116(9):2361–73.10.1061/(ASCE)0733-9445(1990)116:9(2361)Search in Google Scholar
[16] Khatri V, Maiti PR, Singh PK, Kar A. Analysis of skew bridges using computational methods. Int J Comput Eng. 2012 May;2(3):628–36.Search in Google Scholar
[17] Kar A, Khatri V, Maiti PR, Singh PK. Study on effect of skew angle in skew bridges. Int J Eng Res Dev. 2012 Aug;2(12):13–8.Search in Google Scholar
[18] Kothari V, Murnal P. Seismic analysis of skew bridges. J Civ Eng Environ Technol. 2015;2(10):71–6.Search in Google Scholar
[19] Anusreebai SK, Krishnachandran VN. Effect of skew angle on the behaviour of skew slab under uniformly distributed load. Int J Res Appl Sci Eng Technol. 2016;3(8):1879–85.Search in Google Scholar
[20] Hussein MJ, Jabir HA, Al-Gasham TS. Retrofitting of reinforced concrete flat slabs with cut-out edge opening. Case Stud Constr Mater. 2021 Jun 1;14:e00537.10.1016/j.cscm.2021.e00537Search in Google Scholar
[21] Oukaili NK, Merie HD. CFRP strengthening efficiency on enhancement punching shear resistance of RC bubbled slabs with openings. Case Stud Constr Mater. 2021 Dec 1;15:e00641.10.1016/j.cscm.2021.e00641Search in Google Scholar
[22] Al-Rousan R. Influence of opening sizes on the flexural behavior of heat-damaged reinforced concrete slabs strengthened with CFRP ropes. Case Stud Constr Mater. 2022 Dec 1;17:e01464.10.1016/j.cscm.2022.e01464Search in Google Scholar
[23] Kohnke P. Ansys mechanical apdl and mechanical applications theory reference. Canonsburg, Pennsylvania, U.S.A.: Ansys. Inc.; 2010.Search in Google Scholar
[24] ANSYS. ANSYS Theory Reference. Southpointe: ANSYS, INC.: 2001.Search in Google Scholar
[25] ANSYS release version 11 A Finite element computer software theory and user manual for nonlinear structural analysis. Canonburg, PA: Ansys Inc.; 2007.Search in Google Scholar
[26] Desayi P, Krishnan S. Equation for the stress-strain curve of concrete. J Proc. 1964;61(3):345–50.10.14359/7785Search in Google Scholar
[27] Suhaib YKA-D. Effects of concrete nonlinear modeling on the analysis of push-out test by finite element method. J Appl Sci. 2007 May;7(5):743–7.10.3923/jas.2007.743.747Search in Google Scholar
[28] Ibrahim KA. Investigating the effect of the repeated loads on the behavior of joint in A bridge between steel and concrete sections. Ph.D. thesis. Civil Engineering Department, University of Mosul; 2022.Search in Google Scholar
[29] Bathe KJ. Finite element procedures. New Jersey: Prentice-Hall, Inc; 1982. p. 1052.Search in Google Scholar
[30] Chansawat K. Nonlinear finite element analysis of reinforced concrete structures strengthened with FRP laminates. Oregon State University; 2003.Search in Google Scholar
[31] Mohseni I, Cho YK, Kang J. Live load distribution factors for skew stringer bridges with high-performance-steel girders under truck loads. Appl Sci. 2018 Sep 21;8(10):1717.10.3390/app8101717Search in Google Scholar
© 2023 the author(s), published by De Gruyter
This work is licensed under the Creative Commons Attribution 4.0 International License.
Articles in the same Issue
- Regular Articles
- Design optimization of a 4-bar exoskeleton with natural trajectories using unique gait-based synthesis approach
- Technical review of supervised machine learning studies and potential implementation to identify herbal plant dataset
- Effect of ECAP die angle and route type on the experimental evolution, crystallographic texture, and mechanical properties of pure magnesium
- Design and characteristics of two-dimensional piezoelectric nanogenerators
- Hybrid and cognitive digital twins for the process industry
- Discharge predicted in compound channels using adaptive neuro-fuzzy inference system (ANFIS)
- Human factors in aviation: Fatigue management in ramp workers
- LLDPE matrix with LDPE and UV stabilizer additive to evaluate the interface adhesion impact on the thermal and mechanical degradation
- Dislocated time sequences – deep neural network for broken bearing diagnosis
- Estimation method of corrosion current density of RC elements
- A computational iterative design method for bend-twist deformation in composite ship propeller blades for thrusters
- Compressive forces influence on the vibrations of double beams
- Research on dynamical properties of a three-wheeled electric vehicle from the point of view of driving safety
- Risk management based on the best value approach and its application in conditions of the Czech Republic
- Effect of openings on simply supported reinforced concrete skew slabs using finite element method
- Experimental and simulation study on a rooftop vertical-axis wind turbine
- Rehabilitation of overload-damaged reinforced concrete columns using ultra-high-performance fiber-reinforced concrete
- Performance of a horizontal well in a bounded anisotropic reservoir: Part II: Performance analysis of well length and reservoir geometry
- Effect of chloride concentration on the corrosion resistance of pure Zn metal in a 0.0626 M H2SO4 solution
- Numerical and experimental analysis of the heat transfer process in a railway disc brake tested on a dynamometer stand
- Design parameters and mechanical efficiency of jet wind turbine under high wind speed conditions
- Architectural modeling of data warehouse and analytic business intelligence for Bedstead manufacturers
- Influence of nano chromium addition on the corrosion and erosion–corrosion behavior of cupronickel 70/30 alloy in seawater
- Evaluating hydraulic parameters in clays based on in situ tests
- Optimization of railway entry and exit transition curves
- Daily load curve prediction for Jordan based on statistical techniques
- Review Articles
- A review of rutting in asphalt concrete pavement
- Powered education based on Metaverse: Pre- and post-COVID comprehensive review
- A review of safety test methods for new car assessment program in Southeast Asian countries
- Communication
- StarCrete: A starch-based biocomposite for off-world construction
- Special Issue: Transport 2022 - Part I
- Analysis and assessment of the human factor as a cause of occurrence of selected railway accidents and incidents
- Testing the way of driving a vehicle in real road conditions
- Research of dynamic phenomena in a model engine stand
- Testing the relationship between the technical condition of motorcycle shock absorbers determined on the diagnostic line and their characteristics
- Retrospective analysis of the data concerning inspections of vehicles with adaptive devices
- Analysis of the operating parameters of electric, hybrid, and conventional vehicles on different types of roads
- Special Issue: 49th KKBN - Part II
- Influence of a thin dielectric layer on resonance frequencies of square SRR metasurface operating in THz band
- Influence of the presence of a nitrided layer on changes in the ultrasonic wave parameters
- Special Issue: ICRTEEC - 2021 - Part III
- Reverse droop control strategy with virtual resistance for low-voltage microgrid with multiple distributed generation sources
- Special Issue: AESMT-2 - Part II
- Waste ceramic as partial replacement for sand in integral waterproof concrete: The durability against sulfate attack of certain properties
- Assessment of Manning coefficient for Dujila Canal, Wasit/-Iraq
- Special Issue: AESMT-3 - Part I
- Modulation and performance of synchronous demodulation for speech signal detection and dialect intelligibility
- Seismic evaluation cylindrical concrete shells
- Investigating the role of different stabilizers of PVCs by using a torque rheometer
- Investigation of high-turbidity tap water problem in Najaf governorate/middle of Iraq
- Experimental and numerical evaluation of tire rubber powder effectiveness for reducing seepage rate in earth dams
- Enhancement of air conditioning system using direct evaporative cooling: Experimental and theoretical investigation
- Assessment for behavior of axially loaded reinforced concrete columns strengthened by different patterns of steel-framed jacket
- Novel graph for an appropriate cross section and length for cantilever RC beams
- Discharge coefficient and energy dissipation on stepped weir
- Numerical study of the fluid flow and heat transfer in a finned heat sink using Ansys Icepak
- Integration of numerical models to simulate 2D hydrodynamic/water quality model of contaminant concentration in Shatt Al-Arab River with WRDB calibration tools
- Study of the behavior of reactive powder concrete RC deep beams by strengthening shear using near-surface mounted CFRP bars
- The nonlinear analysis of reactive powder concrete effectiveness in shear for reinforced concrete deep beams
- Activated carbon from sugarcane as an efficient adsorbent for phenol from petroleum refinery wastewater: Equilibrium, kinetic, and thermodynamic study
- Structural behavior of concrete filled double-skin PVC tubular columns confined by plain PVC sockets
- Probabilistic derivation of droplet velocity using quadrature method of moments
- A study of characteristics of man-made lightweight aggregate and lightweight concrete made from expanded polystyrene (eps) and cement mortar
- Effect of waste materials on soil properties
- Experimental investigation of electrode wear assessment in the EDM process using image processing technique
- Punching shear of reinforced concrete slabs bonded with reactive powder after exposure to fire
- Deep learning model for intrusion detection system utilizing convolution neural network
- Improvement of CBR of gypsum subgrade soil by cement kiln dust and granulated blast-furnace slag
- Investigation of effect lengths and angles of the control devices below the hydraulic structure
- Finite element analysis for built-up steel beam with extended plate connected by bolts
- Finite element analysis and retrofit of the existing reinforced concrete columns in Iraqi schools by using CFRP as confining technique
- Performing laboratory study of the behavior of reactive powder concrete on the shear of RC deep beams by the drilling core test
- Special Issue: AESMT-4 - Part I
- Depletion zones of groundwater resources in the Southwest Desert of Iraq
- A case study of T-beams with hybrid section shear characteristics of reactive powder concrete
- Feasibility studies and their effects on the success or failure of investment projects. “Najaf governorate as a model”
- Optimizing and coordinating the location of raw material suitable for cement manufacturing in Wasit Governorate, Iraq
- Effect of the 40-PPI copper foam layer height on the solar cooker performance
- Identification and investigation of corrosion behavior of electroless composite coating on steel substrate
- Improvement in the California bearing ratio of subbase soil by recycled asphalt pavement and cement
- Some properties of thermal insulating cement mortar using Ponza aggregate
- Assessment of the impacts of land use/land cover change on water resources in the Diyala River, Iraq
- Effect of varied waste concrete ratios on the mechanical properties of polymer concrete
- Effect of adverse slope on performance of USBR II stilling basin
- Shear capacity of reinforced concrete beams with recycled steel fibers
- Extracting oil from oil shale using internal distillation (in situ retorting)
- Influence of recycling waste hardened mortar and ceramic rubbish on the properties of flowable fill material
- Rehabilitation of reinforced concrete deep beams by near-surface-mounted steel reinforcement
- Impact of waste materials (glass powder and silica fume) on features of high-strength concrete
- Studying pandemic effects and mitigation measures on management of construction projects: Najaf City as a case study
- Design and implementation of a frequency reconfigurable antenna using PIN switch for sub-6 GHz applications
- Average monthly recharge, surface runoff, and actual evapotranspiration estimation using WetSpass-M model in Low Folded Zone, Iraq
- Simple function to find base pressure under triangular and trapezoidal footing with two eccentric loads
- Assessment of ALINEA method performance at different loop detector locations using field data and micro-simulation modeling via AIMSUN
- Special Issue: AESMT-5 - Part I
- Experimental and theoretical investigation of the structural behavior of reinforced glulam wooden members by NSM steel bars and shear reinforcement CFRP sheet
- Improving the fatigue life of composite by using multiwall carbon nanotubes
- A comparative study to solve fractional initial value problems in discrete domain
- Assessing strength properties of stabilized soils using dynamic cone penetrometer test
- Investigating traffic characteristics for merging sections in Iraq
- Enhancement of flexural behavior of hybrid flat slab by using SIFCON
- The main impacts of a managed aquifer recharge using AHP-weighted overlay analysis based on GIS in the eastern Wasit province, Iraq