
An artificial intelligence-enabled consumables tracking system for medical laboratories
-
Hiranya Sritart
 ,
Prasong Tosranon
,
Prasong Tosranon

Abstract
The medical laboratory plays a crucial role within a hospital setting and is responsible for the examination and analysis of patient specimens to accurately diagnose various ailments. The burden on medical laboratory personnel has significantly increased, particularly in the context of the ongoing global COVID-19 pandemic. Worldwide, the implementation of comprehensive and extended COVID-19 screening programs has placed a significant strain on healthcare professionals. This burden has led to exhaustion among medical employees, limiting their ability to effectively track laboratory resources, such as medical equipment and consumables. Therefore, this study proposed an artificial intelligence (AI)-based solution that contributes to a more efficient and less labor-intensive workflow for medical workers in laboratory settings. With the ultimate goal to reduce the burden on healthcare providers by streamlining the process of monitoring and managing these resources, the objective of this study is to design and develop an AI-based system for consumables tracking in medical laboratories. In this work, the effectiveness of two object detection models, namely, YOLOv5x6 and YOLOv8l, for the administration of consumables in medical laboratories was evaluated and analyzed. A total of 570 photographs were used to create the dataset, capturing the objects in a variety of settings. The findings indicate that both detection models demonstrate a notable capability to achieve a high mean average precision. This underscores the effectiveness of computer vision in the context of consumable goods detection scenarios and provides a reference for the application of real-time detection models in tracking systems within medical laboratories.
1 Introduction
The effective management of consumable items is particularly crucial within the context of a medical laboratory as it ensures the efficient utilization of resources by preventing unnecessary waste and expenditures [1,2]. Additionally, the accuracy and timeliness of testing are heavily reliant on the availability and adequacy of consumables, including reagents and test kits [3]. Insufficient management of these resources can result in disruptions to medical laboratory operations, consequently reducing the quality of patient care and diagnostic precision [4]. These challenges lead to inefficiencies in the medical laboratory, such as excessive inventory, shortages, and unnecessary material waste. Moreover, the administration of consumable goods encounters a fundamental obstacle due to the complex difficulties involved in inventory management. To facilitate the efficient operation of a medical laboratory, the implementation of a laboratory information system is important; its purpose is to effectively manage the extensive inventory of consumable goods and materials inside the laboratory setting. However, the significant financial costs involved with these systems have been a crucial limitation and barrier to the implementation of such systems in many laboratories, especially those located in nations with fewer resources [5,6]. This significance is heightened when considering the budgetary limitations frequently faced by medical laboratories [7]. Due to the high cost of commercial software and the lack of available resources, a significant amount of administrative work is performed manually and frequently relies on paper-based management [8]. As a result, these operational tasks require a significant amount of time. The lack of information for decision-making and laboratory management can be attributed to several significant factors, namely unorganized information, data redundancy, and inconvenient access to information [9].
At the core of medical laboratories, the consumable tracking system emerges as a critical component within the main information system, playing a specialized role in the thorough monitoring and control of consumable resources essential for laboratory procedures. This focused subsystem operates within the broader laboratory information system, which itself is pivotal in managing data, coordinating workflow processes, and facilitating communication within sophisticated environments [10]. However, the consumable tracking system currently faces several notable gaps that hinder its optimal functionality. Primarily, challenges arise from the reliance on manual data entry, introducing potential errors and delays in tracking consumable resources [11]. Building on prior research, it is noteworthy that a significant number of health practitioners still rely on handwritten prescriptions. Additionally, existing patient records exhibit numerous shortcomings, including incomplete data entries, instances of missing information due to accessibility issues, and a general lack of efficiency in terms of combining and operating data seamlessly [12]. Moreover, the system’s limited predictive capabilities hinder its ability to accurately forecast future needs, lacking the sophistication to analyze historical data for proactive decision-making [13]. Integration challenges with other laboratory systems and supply chain management result in fragmented communication and inefficient procurement processes. In terms of resource optimization, the absence of sophisticated algorithms leads to suboptimal inventory levels, contributing to increased costs and potential shortages. Scalability issues may also arise as the system struggles to adapt to the growing volume and complexity of consumable data in larger laboratories, limiting its ability to evolve with changing needs [14].
Establishing a consumables tracking system in medical laboratories is of great importance for the alleviation of the workload of staff dealing with complex situations that require effective tracking to maintain public health, especially during the COVID-19 outbreak [15,16,17]. When there is a sudden need to conduct numerous tests in a limited time, a consumables tracking system can reduce staff workload by automating test result management and reporting [18]. This allows staff to dedicate more time to patient care and treatment support while also minimizing errors in the testing and recording process. Additionally, the consumables tracking system can support the efficient management of the inventory of medical supplies and equipment by providing data that reflect actual usage. Laboratories can systematically plan material orders and storage, saving both resources and capital, thus enabling the consumables tracking system to operate at its full potential. However, the initial accreditation report for laboratories with limited facilities must be considered. As was discussed in a previous study, the most common cause of the failure to meet certification requirements is the handling of laboratory equipment, reagents, and consumables [19]. Insufficient capacity to maintain a quality laboratory system arises from the absence of a comprehensive monitoring system for medical equipment and consumables [9,20]. Therefore, there continues to be a notable discrepancy in the adoption of computerized laboratory information systems compared to traditional paper-based systems in diverse medical laboratories across multiple countries [21,22].
Currently, artificial intelligence (AI) is a significant concept in the modern world. This comprehensive idea involves machine learning (ML), modeling, statistics, simulations, and algorithms. It significantly contributes to the progress of both clinical and academic studies. The integration of AI has witnessed in healthcare significant advancements, particularly in enhancing diagnostic capabilities and resource management. Recent studies have underscored AI’s capacity to address gaps in healthcare, emphasizing the need for an early diabetes prediction system to assist medical professionals in swiftly and reliably identifying patients [23,24]. ML techniques, applied to extensive health datasets, prove instrumental in predicting chronic diseases, not only reducing diagnostic costs with limited resources but also enhancing diagnostic accuracy [23]. In addition to diabetes prediction, AI has also played a crucial role in the clinical and laboratory diagnosis of infectious diseases, with a notable example being the application of ML in the diagnosis of COVID-19. Additionally, previous research has shown that the utilization of ML frameworks for COVID-19 detection through blood tests presents a promising avenue for creating an accessible, cost-effective, user-friendly, and expedited alternative to conventional, time-consuming, and expensive diagnostic tests [25]. Recent research has emphasized the effectiveness of ML frameworks for COVID-19 detection through blood tests, providing a promising and expedited alternative to conventional diagnostic methods. Previous study has highlighted the effectiveness of ML frameworks for COVID-19 detection through blood tests, offering a promising and expedited alternative to conventional diagnostic methods [26]. The positive results indicate the prospective utility of this approach in enhancing diagnostic sensitivity during emergencies, such as pandemic outbreaks, and aiding clinicians in swift and accurate patient screening.
Expanding the scope of AI applications, there is a growing trend towards its utilization in medical laboratories. This integration provides an efficient solution contributing to efficient laboratory processes. Xue et al. introduced an AI-based approach for extracting textual information from medical laboratory report images, achieving a 98.6% in precision rate in text detection, and improving multi-lingual text recognition accuracy. The proposed methodology holds the potential for integrating historical health records and fostering patient engagement in healthcare management [27]. Regarding the reduction of the workload of medical workers, Tan et al. explored AI-based object detection models for efficient pill recognition in laboratory processes. Highlighting the model’s significant detection speed advantage, even with a slightly lower mean average precision (mAP) at 80.69%, the findings underscore the potential of incorporating AI in laboratory settings to modernize and enhance the efficiency of medical workers [28]. However, only limited research has applied AI in consumable tracking systems for medical laboratories. This study aims to address this gap by examining the feasibility and efficacy of incorporating AI-based models for enhanced consumable management in medical laboratories. The article’s key contributions include:
A comprehensive review of various technologies, including ML and AI that are implemented in consumable tracking system in medical setting.
Design and implementation of a complex deep learning (DL) framework within an infrastructure of tracking systems for consumable product tracking in medical laboratories.
Evaluates the performance of the model in identifying consumables, providing valuable insights into the field of computer vision,
Conducts a comparative analysis of system integration between YOLOv5 and YOLOv8, offering a thorough examination of different DL models and implementing the integration of these models in a management system.
This article is organized as follows. Section 2 presents a comprehensive review of the relevant literature and technology and the previous research conducted on the medical laboratory tracking system. In Section 3, the proposed system of this research is described; this section comprises the system design, materials used, dataset collection, and the development of the proposed approach. Section 4 presents the experimental results, while Section 5 provides the discussion. Lastly, a concluding summary of the methods and results, as well as suggestions for future work, is presented in Section 6.
2 Background in medical laboratory tracking system
2.1 Barcode technology
In the period before the implementation of the laboratory management and tracking system, the handling of consumables primarily relied on manual processes. Handwritten annotations on paper played an important role in the original process. This approach required the personnel to manually transcribe inventory details [29]. However, this conventional methodology was susceptible to errors due to the potential illegibility of handwriting, resulting in misinterpretation or the incorrect placement of crucial information [30]. Moreover, this manual process frequently gave rise to challenges such as unforeseen product stockouts or excessive inventory, leading to inaccurate quantity calculations.
Over the past two decades, with the rapid advancements in computer technology during the digital age, a paradigm shift has occurred in the manual handling of consumables in the medical laboratory system. This transformation has effectively addressed the previous challenges and is now extensively employed in database management [31]. The integration of various technologies has significantly streamlined the management of diverse materials, with barcode technology standing out as a notable example. This technology has now become an essential element within contemporary modern information management systems in numerous industries and has revolutionized monitoring, identification, and data collection processes [32,33]. The fundamental concept that underlies barcode technology is the encoding of information through a visually scannable pattern consisting of parallel lines and gaps. This pattern can be quickly interpreted by specialized scanners or readers [34]. The technology requires only a few supplementary tools but has revolutionized supply management by reshaping how inventory is monitored and regulated. The roots of barcode technology can be traced back to the 1970s with the introduction of the Universal Product Code barcode [35]. Subsequently, barcode technology has undergone a substantial evolution, marked by the incorporation of advanced symbology like QR codes and the enhancement of barcode scanning capabilities. In contrast, QR codes, which were developed during the late 1990s, are matrix codes that include a two-dimensional structure, allowing for the storage of data in both horizontal and vertical orientations within a grid composed of black and white squares and thereby offering greater data capacity and versatility [36]. This technological progression has profoundly impacted consumables management by providing a distinct identifier for each item, facilitating efficient data collection and precise stock level tracking [37].
2.2 Radio frequency identification (RFID)
Barcodes have had widespread usage across diverse applications due to their cost-effectiveness, convenience of use, and efficacy for data encoding and identification. However, this technique still has a few restrictions. These restrictions result from the two-dimensional, static nature of barcodes, which limits the amount of information they can store and necessitates scanning in a direct line of sight [38]. Previous studies also reported that barcode scanning fails to achieve the intended error prevention results; therefore, some hospital staff have perceived barcode scanning to be ineffective for healthcare or job performance [39,40,41]. To address these limitations, the emergence of RFID technology has led to simpler and more efficient methods with which to accomplish comparable objectives. Barcodes effectively fulfill the role of product identification and inventory tracking; however, they necessitate line-of-sight scanning and lack the capability to scan multiple items simultaneously [38]. Conversely, RFID technology offers a multitude of advantages, notably the ability to encompass wireless data transmission and non-line-of-sight scanning and the capacity to read multiple tags simultaneously. Enabled by radio waves, RFID tags are effortlessly readable, facilitating swift and precise data recording [42]. In addition, the implementation of RFID technology eliminates the necessity for manual scanning, resulting in a reduction in human error and an enhancement of operational efficiency [43]. This characteristic contributes to improved supply chain visibility, greater inventory management, and increased overall efficiency. RFID technology represents a significant breakthrough in the streamlining and improving procedures that previously depended on barcodes. Despite the numerous benefits of RFID systems in consumables management, limitations remain. The difficulty involved in accurately tracing products under specific temperature conditions, especially extreme heat or cold, is a significant disadvantage [44,45]. These conditions can compromise the performance of RFID devices, leading to inaccurate readings, unreliability, or even complete failure [44,45,46]. In industries such as those dealing with pharmaceuticals and perishable products, where temperature control is essential, this limitation has significant repercussions. Inventory tracking based solely on RFID technology may not provide the required level of precision and confidence. To guarantee the accurate management of consumables, the incorporation of alternative solutions or additional monitoring techniques becomes essential.
2.3 ML and AI
In recent years, there has been a significant advancement in AI technology, particularly in the field of DL. DL has demonstrated the ability to effectively store and acquire certain traits by utilizing neural networks with diverse topologies that are adapted to their unique qualities. This technology emerged as a dominant field in the early 2000s subsequent to the rise in popularity of support vector machines, the multilayer perceptron, artificial neural networks, and other neural networks with fewer layers. Numerous researchers have classified DL as a subset of ML, which is itself a subset of AI [30,47,48]. Since 2006, this algorithm has seen a significant transformation and has gained considerable popularity in comparison to other ML algorithms of its time [49]. This has been attributed to two primary factors: the substantial volume of data for processing and the ready availability of advanced computational resources.
The field of object detection has recently seen significant advancements in DL, culminating in the emergence of the you only look once (YOLO) framework. In its earlier stages, object detection was heavily reliant on traditional computer vision methodology. The development of DL and, more specifically, convolutional neural networks (CNNs) made a significant contribution to the progress made in the field of image classification. The advancements in object detection, particularly R-CNN, Fast R-CNN, and Faster R-CNN, have played a crucial role in improving the efficiency and precision of this procedure [50]. These advancements were made possible by the integration of regional proposal networks. The YOLO algorithm, which was first introduced in 2016, brought about a significant transformation in the field by presenting a comprehensive approach that enabled the simultaneous prediction of object bounding boxes and class probabilities in a single iteration through the network [51]. Subsequent modifications, including YOLOv2, YOLOv3, and YOLOv8, have subsequently improved upon this groundbreaking foundation [51,52,53]. Several approaches had been employed to extract information from the images of the medical laboratory report, such as table and textual information [27,54]. In addition to addressing the support workload for diagnosis in medical laboratories, previous studies have employed this approach for the automated detection and counting of blood cells from smear images, achieving a processing time of less than one second [55]. However, the existing literature has not considered this method to improve the management system for consumable products in medical laboratories. To alleviate the staff’s workload by streamlining various operational processes and to improve the efficiency of medical laboratory management, an accurate and reliable tracking system for consumable products is urgently required.
Generally, DL-based object detection can be broadly classified into two distinct categories: anchor-based detectors and anchor-free detectors [56]. To improve the prediction of bounding box locations with additional offset regression, anchor-based detectors are constructed based on the concepts from traditional sliding window detection procedures. These anchor boxes are then classified as positive or negative patches and subsequently utilized to enhance the accuracy of bounding box predictions through the application of additional offset regression techniques [57]. These detectors, such as Faster R-CNN, Single Shot MultiBox Detector (SSD), and RetinaNet, exhibit a shared fundamental basis. Faster R-CNN achieves accuracy via the region proposal network (RPN); however, it demands significant computational resources and is designed to achieve real-time performance by utilizing a dense set of default boxes [58]. However, it may have limitations in accurately detecting small items. Meanwhile, RetinaNet addresses the issue of class imbalance with its focusing loss technique, but it encounters difficulties with densely overlapping objects [59]. On the other hand, anchor-free detectors signify a significant departure from traditional object identification methods by eliminating the need for predetermined anchor boxes. This approach provides simplified yet effective solutions for object detection tasks [57]. Among the various inventive ideas, YOLO emerges as a prominent example. One notable feature of the YOLO algorithm is its single-stage architecture, which facilitates real-time object recognition without the requirement of elaborate post-processing procedures [59]. Furthermore, the YOLO algorithm has strong adaptability to objects of different scales, and it exhibits reduced susceptibility to the anchor configuration difficulties encountered by anchor-based detectors [57,58,59].
In terms of application in the medical laboratory, when comparing YOLO to other object detection models, such as Faster R-CNN, SSD, and RetinaNet, several key advantages become apparent. First, YOLO excels in speed and is capable of processing images at an impressive rate of up to 30 frames per second or more while maintaining high accuracy [60,61]. Previous studies have shown that, in the application of object detection for real-time pill identification in a hospital pharmacy, YOLOv3 had better detection performance in terms of speed compared to the RetinaNet and SSD [28]. Its real-time capabilities make it suitable for tasks like real-time object detection in videos or cameras, which is particularly valuable for medical laboratory inventory management [62], enabling rapid sample analysis for timely disease diagnosis [63,64]. Additionally, the ability of YOLO to detect multiple objects within a single image is significant, particularly in scenarios with overlapping objects, such as in the simultaneous identification of medical waste materials in a laboratory setting. Furthermore, YOLO demonstrates precision in detecting small-sized objects, a crucial feature for research involving small-scale materials and details, such as text and numbers on medication labels. Another advantage is that YOLO eliminates the need for an RPN, which is required by other models like Faster R-CNN, resulting in a more accurate and faster detection process [53,61]. Lastly, the adaptability of YOLO with regard to variable image sizes enhances its utility in situations where objects and images come in diverse sizes [65].
In 2020, YOLOv5 emerged as the latest iteration of the YOLO object detection model; YOLOv5 was the most effective of all the YOLO iterations [66]. Other versions, such as YOLOv6, YOLOvx, PP-YOLO, and YOLOv7, which were variations and modifications of the YOLOv5 model, emerged around the globe [51,67,68]. In medical laboratory studies, it has been shown that YOLOv5 achieves the highest accuracy compared to the other models [65,69]. A recent study compared the performance of YOLOv5 and YOLOv7 in detecting gloves, masks, goggles, and lab coats in the laboratory monitoring system [65]. Although the study findings revealed that both YOLOv5 and YOLOv7 demonstrated strong performances, the study still discussed the fact that YOLOv5 performed better in the detection of small-scale objects [65]. Another study has highlighted the fact that the YOLOv5x model outperforms other sub-models within YOLOv5 in terms of average classification precision for object detection in pharmaceutical packaging [69]. The research compared the performances of sub-models within YOLOv5 in pharmaceutical packaging object detection and found that the YOLOv5x model achieved the highest average classification precision among its counterparts, including YOLOv5n, YOLOv5s, YOLOv5m, YOLOv5l, and YOLOv5x [69]. In January 2023, YOLOv8, the most recent addition to the YOLO series, was released by Ultralytics; the same team released YOLOv5 in 2020 [70]. At the time of writing, it is the most sophisticated model and has improved feature aggregation and a mish activation function that enhances detection accuracy and processing speed [71]. However, only limited studies have investigated YOLOv8 in the medical laboratory. While YOLOv8 shows promise with its improved features, including enhanced feature aggregation and a new mish activation function, it is important to note that few studies have examined its performance in the context of medical laboratory applications, suggesting a potential area for future research and exploration [72].
Therefore, the objectives of the study are as follows: first, a complex DL framework within an infrastructure of tracking systems for consumable product tracking within a medical laboratory is designed and implemented. The goal of this objective is to modernize the laboratory systems for consumables management. Second, the performance of the model in identifying consumables is examined and validated by our research. We aimed to demonstrate the model’s proficiency with its fundamental tasks. It offers insightful information on the rapidly developing field of computer vision. Finally, our study conducts a comparative analysis of appropriate models for system integration between YOLOv5 and YOLOv8. It includes a thorough analysis of different DL models. In the end, the management system implements the integration of these models. The foundation of our research consists of these three interconnected goals. Through the lens of cutting-edge technology and thorough evaluation, it seeks to advance the field of consumables management within the context of medical laboratories.
3 Proposed system
3.1 Functional design of system
Our designed system belongs to the category of Laboratory Information and Management System, with a specific design for tracking consumables in medical laboratories. Utilizing AI, the proposed system aims to elevate the efficiency and accuracy in monitoring and managing consumable resources within the context of medical laboratory settings. In this study, we utilized the programming language C# in combination with the computer vision library OpenCV to develop a novel AI-based system for the purpose of monitoring inventory in medical laboratories. We developed our software by utilizing the C# programming language within the.NET Framework and employed this framework to integrate with the object detection model. The present system successfully integrates the programming capabilities inherent in C# with the image processing functionalities offered by OpenCV, thereby establishing a sophisticated platform. The designed system that was developed is illustrated in Figure 1, which provides an overview of the steps that are involved.
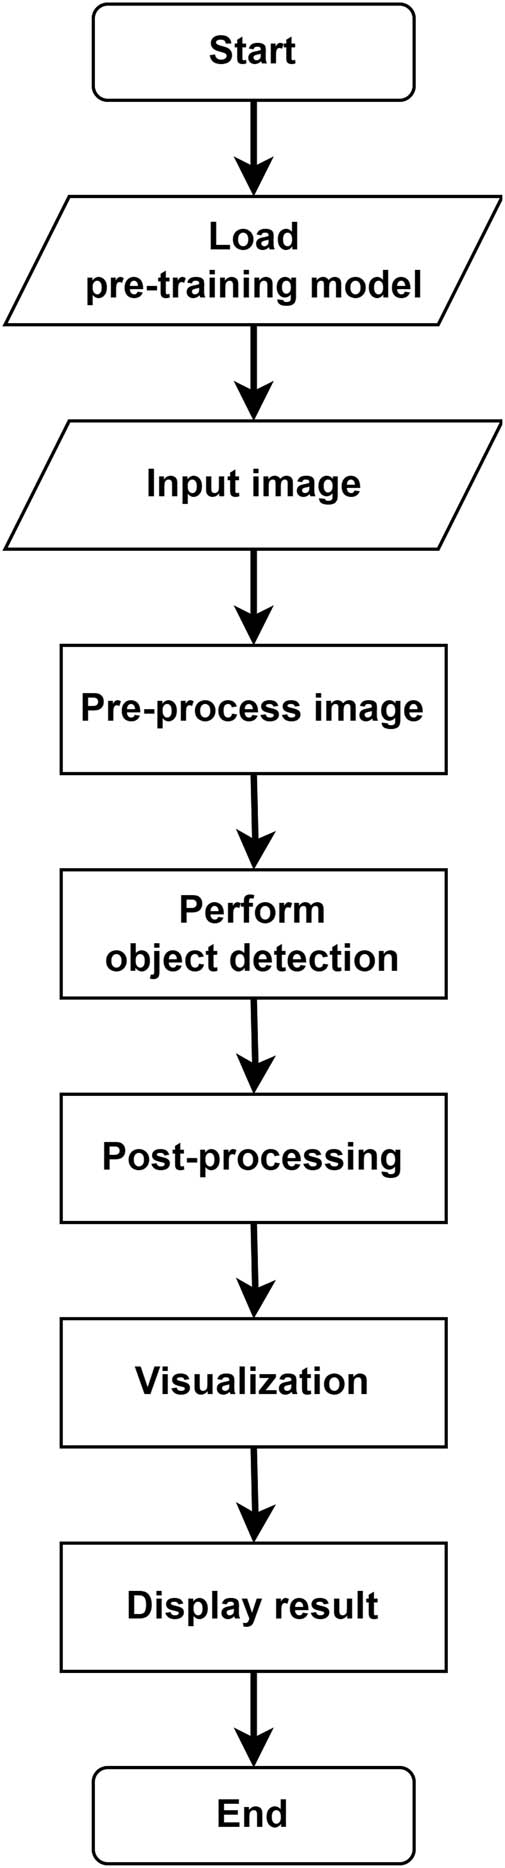
The architecture of the proposed system.
To begin, select a pre-trained object detection model that aligns with DL models. Following that, set up the C# environment by installing OpenCV libraries and the tools for image processing, thereby enabling effective collaboration with the DL frameworks. Once the environment is set, load the pre-trained object detection model within C# using the relevant framework’s C# API. Prior to inputting them into the model, ensure that the input images are preprocessed by performing tasks such as image resizing, pixel value normalization, and conversion to the model’s expected format. As the preprocessing stage concludes, execute the pre-trained model on the preprocessed images and effectively conduct object detection to yield valuable results, including bounding boxes and class probabilities for each detected object. Moving forward, implement post-processing techniques, such as non-maximum suppression, to meticulously eliminate duplicated or overlapping detections, while also filtering out low-confidence predictions. This organized post-processing aims to significantly enhance the overall accuracy of the detection results. To complete the process, craft compelling visualizations by adeptly adding bounding boxes and class labels to the original images, thus providing viewers with a clear and intuitive representation of the identified objects.
3.2 Material
The present study encompassed the utilization of a total of 30 consumable items in the course of conducting medical laboratory procedures. The inventory consisted of a total of 15 reagent bottles, 10 reagent boxes, and 5 distinct item boxes. The items discovered in medical laboratories were inherently unique, exhibiting variations in terms of style, size, color, brand, and other pertinent details. The study utilized the Omron FZ-SC Vision Camera for the purpose of capturing test data images. The camera under consideration possesses a pixel resolution of 640 (H) × 480 (V) and exhibits the ability to capture images encompassing a range of 12–480 lines. The camera employs a 1/3-inch image sensor.
The object detection models utilized for the identification of the consumable items mentioned in the study were YOLOv5 and YOLOv8. To optimize data processing capabilities, a Lenovo Think Centre computer equipped with an Intel Core i7-8700 processor, 32 GB of RAM, and a 256 GB SSD was employed. The aforementioned computer possessed the requisite computational capabilities and storage capacity to facilitate uninterrupted data processing.
3.3 Dataset collection and preparation
The images of the consumable items were obtained by capturing a total of 570 photographs using a vision camera; examples of these images are shown in Figure 2. These photographs were taken for a set of 30 items, with an equal number of images captured for each item on average. Every object was captured through the lens of a camera from various perspectives, under different lighting conditions, and with variations in the item itself. A stationary shooting position was established at a predetermined distance. The dataset was subsequently divided into three distinct sections, namely the training subset, the validation subset, and the testing subset. The training set comprised 15 images per item; the validation set comprised 2 images per item; and the test set comprised 2 images per item. This division ensured that the sets were characterized by a representative distribution of consumable items.
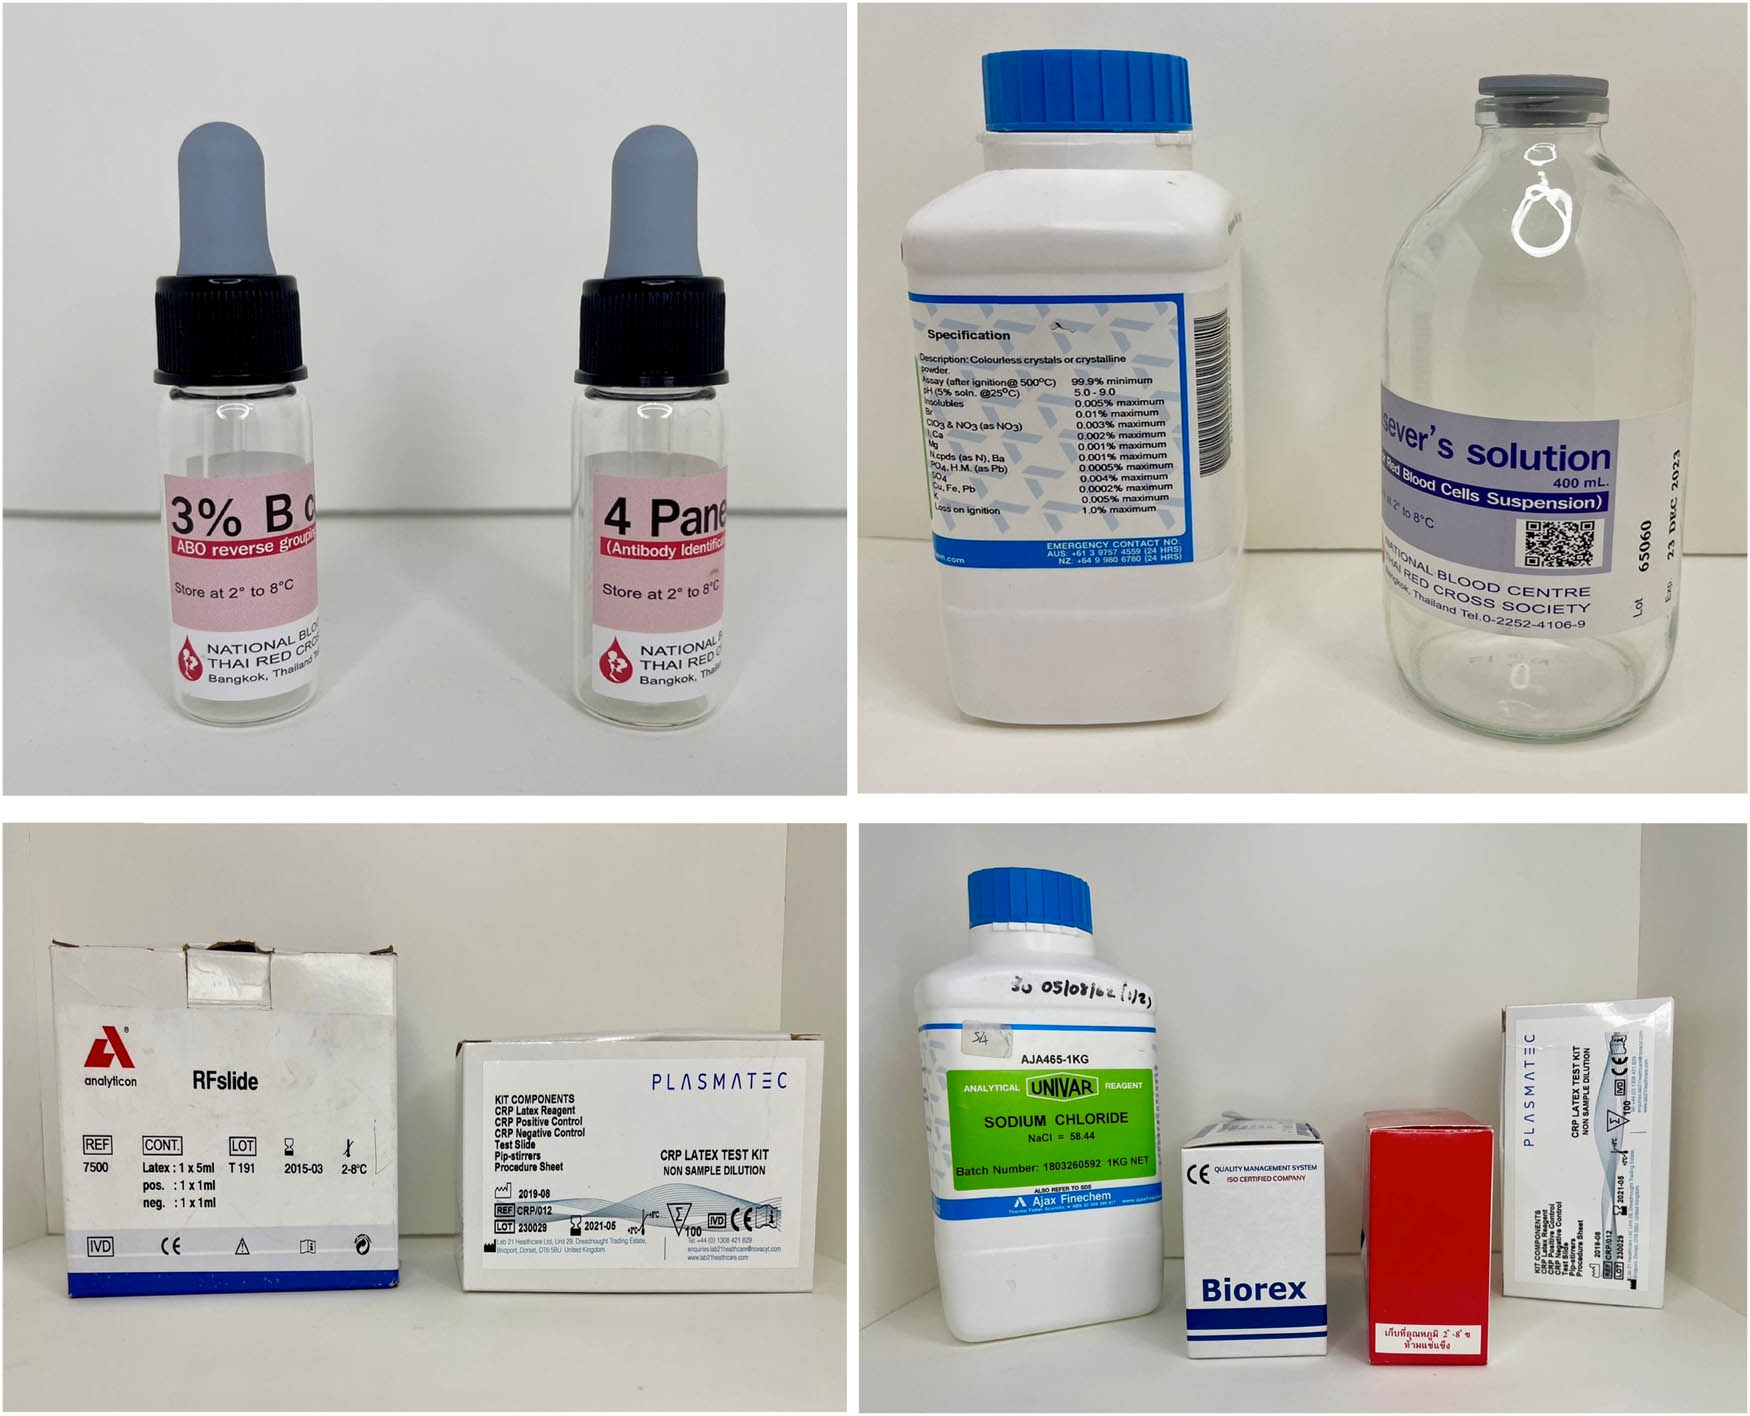
Representative dataset images.
The methodology for labeling these items with bounding boxes involves a systematic approach to ensure accuracy and consistency. Each dataset image containing multiple items undergoes careful annotation where every individual object is outlined with a bounding box. This process includes identifying and annotating each object separately to prevent oversight or inaccuracies, placing bounding boxes tightly around each object to accurately delineate their boundaries, and maintaining consistency across all images to uphold dataset uniformity and reliability.
3.4 Detection model design and training
The configuration process for detecting consumable items involved the utilization of YOLO models, specifically YOLOv5x6 and YOLOv8l. The annotated dataset was initially partitioned into two subsets, namely the training subset and the testing subset. Following this, a configuration file for the YOLO model was created; it outlined the network architecture and hyperparameters, such as the learning rate, batch size, and optimizer. This configuration file is crucial to the enhancement of the performance of the model. The model was trained using a dataset that had been annotated, and during this training process, the weights of the model were adjusted to minimize the discrepancy between the predicted bounding boxes and the ground truth bounding boxes. The hyperparameters were adjusted to optimize the performance of the model. In this study, we also implemented the early stopping mechanism with the models. This is a technique used to prevent overfitting to optimize the model’s performance [73]. It involves monitoring the model’s performance on a separate validation dataset during training. During training, it involves the monitoring of the model’s performance on a validation dataset. If the model’s performance on the validation dataset does not improve, or if it degrades after a predetermined number of training epochs, the training process is terminated early. This prevents the model from becoming excessively specialized to the training data and improves generalization to unseen data. This technique ensures that the model achieves its optimum performance while avoiding overfitting.
In the initial phase, predictions were made using visual representations of the consumable items employed in the training process. The results are presented in the form of graphs, specifically metrics/precision and metrics/recall graphs. These graphs depict percentage values ranging from 0 to 1 on the y-axis, while the x-axis represents the number of training iterations. The second phase entailed the assessment of the DL model through the utilization of a test subset comprising randomly chosen images, which served as a representative sample of the untrained objects. The purpose of this evaluation was to analyze the model’s capacity to effectively manage unfamiliar objects. This evaluation served as a supplementary metric for assessing the model’s performance, as depicted in Figure 3.
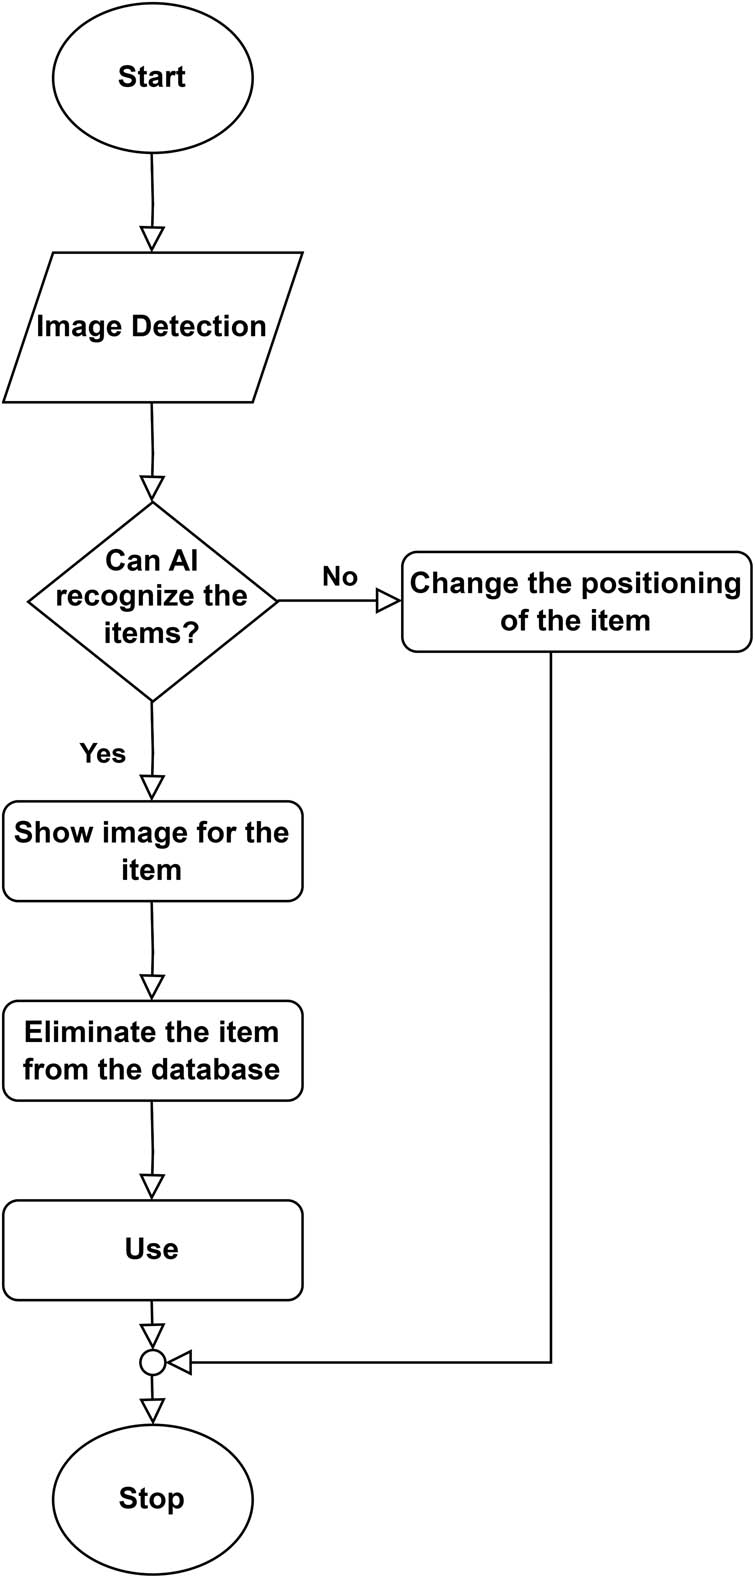
Training flow of the proposed system.
3.5 Assessment metrics
During the assessment phase, the efficacy of the DL model, denoted by equations (1)–(4), was measured using several metrics, including precision, recall, and mAP. In the realm of object detection, the intersection over union (IoU) serves as a fundamental metric, representing the intersection ratio between the model’s predicted bounding box and the actual data. These diverse metrics collectively offer comprehensive insights into evaluating our model’s accuracy across both object localization and classification tasks. By examining precision and recall alongside the extensively employed IoU and mAP, our assessment provides a refined insight into the model’s performance, going beyond the confines of traditional accuracy measurement.
In particular, IoU performs a crucial role in object detection by quantifying the overlap between the predicted and actual bounding boxes. This metric, defined as the intersection ratio between the two, serves as a quantitative measure of the model’s spatial alignment with ground truth data, adding granularity to our evaluation; this is defined as
In this context, A and B represent the areas of the bounding box and the predicted ground truth, respectively. When the IoU exceeds a given threshold, the detection is considered to be accurate.
Here, TP denotes accurately identified objects, FP represents objects the model incorrectly identified as positive detections, and FN refers to the entities that were not identified by the model, despite being present in the ground truth annotations.
The area under the precision–recall curve is denoted by AP. The mean average precision (mAP) is computed by determining the AP for each class and then calculating the class-wide mean.
To select the best model, the validation evaluation metric is mAP@(0.50:0.95), and we provided both mAP@(0.50) and mAP@(0.95) results on the test set. The mAP@(0.50:0.95) indicates the average mAP across various IoU thresholds (from 0.5 to 0.95 in increments of 0.05), whereas the mAP@(0.50) represents the average mAP over 0.5. To gain a more comprehensive understanding of the model’s performance across various categories of consumable items, statistical analysis and visualization techniques were employed.
4 Results
4.1 Performance metrics of the proposed system
The first stage of the evaluation consisted of the utilization of images of consumable items from the training subset to generate predictions and assess the accuracy of the two models, namely YOLOv5x6 and YOLOv8l. To address the issue of overfitting, both models were trained for a total of 1,000 epochs, with the implementation of early stopping. Early stopping is a regularization technique employed in ML to terminate the training process when the model’s performance on a validation set ceases to improve beyond a predetermined number of epochs. Following the completion of the training procedure, an assessment was conducted to evaluate the efficacy of the model. This evaluation encompassed various metrics, such as precision, recall, and mAP at IoU thresholds of 0.5 (50%) and 0.95 (95%).
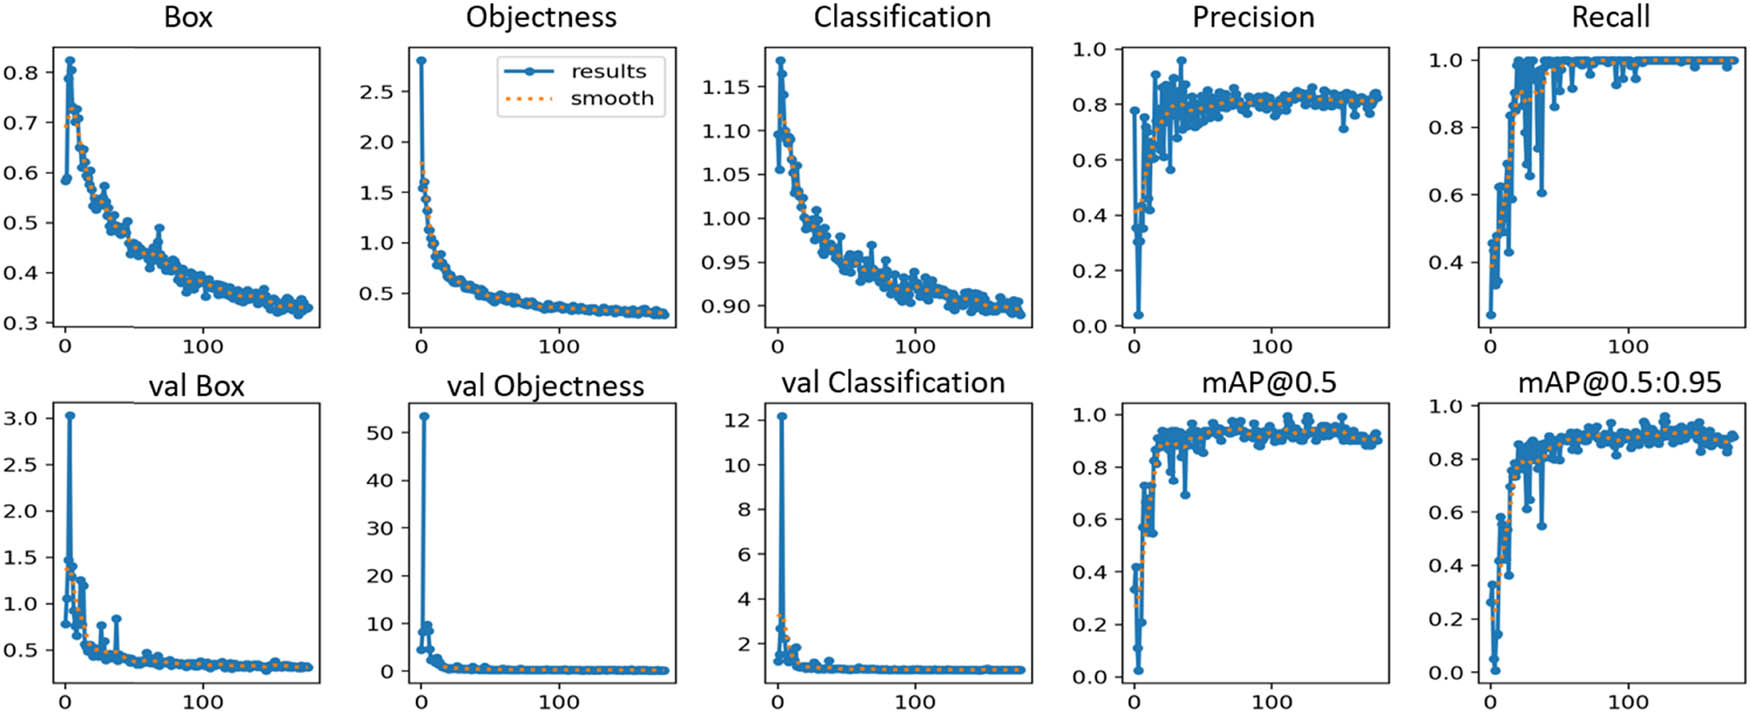
Figures 4 and 5 illustrate graphical representations of the metric curves, demonstrating the training progression of the YOLOv5x6 and YOLOv8l models, respectively. The box loss plot displays the loss associated with the accuracy of bounding box coordinates predicted by the model. The objectness loss plot visualizes the change in loss over the training epochs, indicating how effectively the model is learning to distinguish between bounding boxes containing objects and those containing background regions. Both models showing a decreasing objectness loss signify an improvement in their ability to identify objects within the bounding boxes, essential for accurate object detection. The classification loss plot shows the average classification loss value of consumable items. A lower box, objectness, and classification loss signify a higher level of accuracy in the training dataset for consumable items, emphasizing the effectiveness of the model in recognizing and categorizing these items accurately. On the contrary, the validation (val) box loss plot, val objectness loss plot, and val classification loss plot are visual representations of how well models perform on validation data. The precision plot illustrates the accuracy of the model’s positive predictions by showing the ratio of true positive predictions to all positive predictions. In contrast, the recall plot demonstrates the model’s ability to identify all relevant instances by revealing the ratio of true positive predictions to all actual positive instances. Higher precision and recall values signify fewer false positives and the model’s capability to detect a larger proportion of actual positive objects, respectively. The mAP@0.5 plot evaluates performance at a single IoU threshold (0.5) and provides an overall assessment of the model’s performance and how well the predicted bounding boxes overlap with the ground truth boxes. While mAP@0.5:0.95 plot assesses performance across a range of IoU thresholds (0.5–0.95), offering a comprehensive evaluation of the model’s object detection accuracy across various IoU thresholds. In terms of the YOLOv5x6 model, the validation precision score stood at 0.878, with a recall score of 0.973. Additionally, the mAP scores for @0.5IoU and @0.95IoU were 0.935 and 0.905, respectively, as presented in Table 1. On the other hand, the YOLOv8l model exhibited a validation precision score of 0.816, a recall score of 0.971, and mAP scores of 0.925 and 0.915 for @0.5IoU and @0.95IoU, respectively. These outcomes from both models affirm the effectiveness of our approach in accurately monitoring consumables across diverse environments.
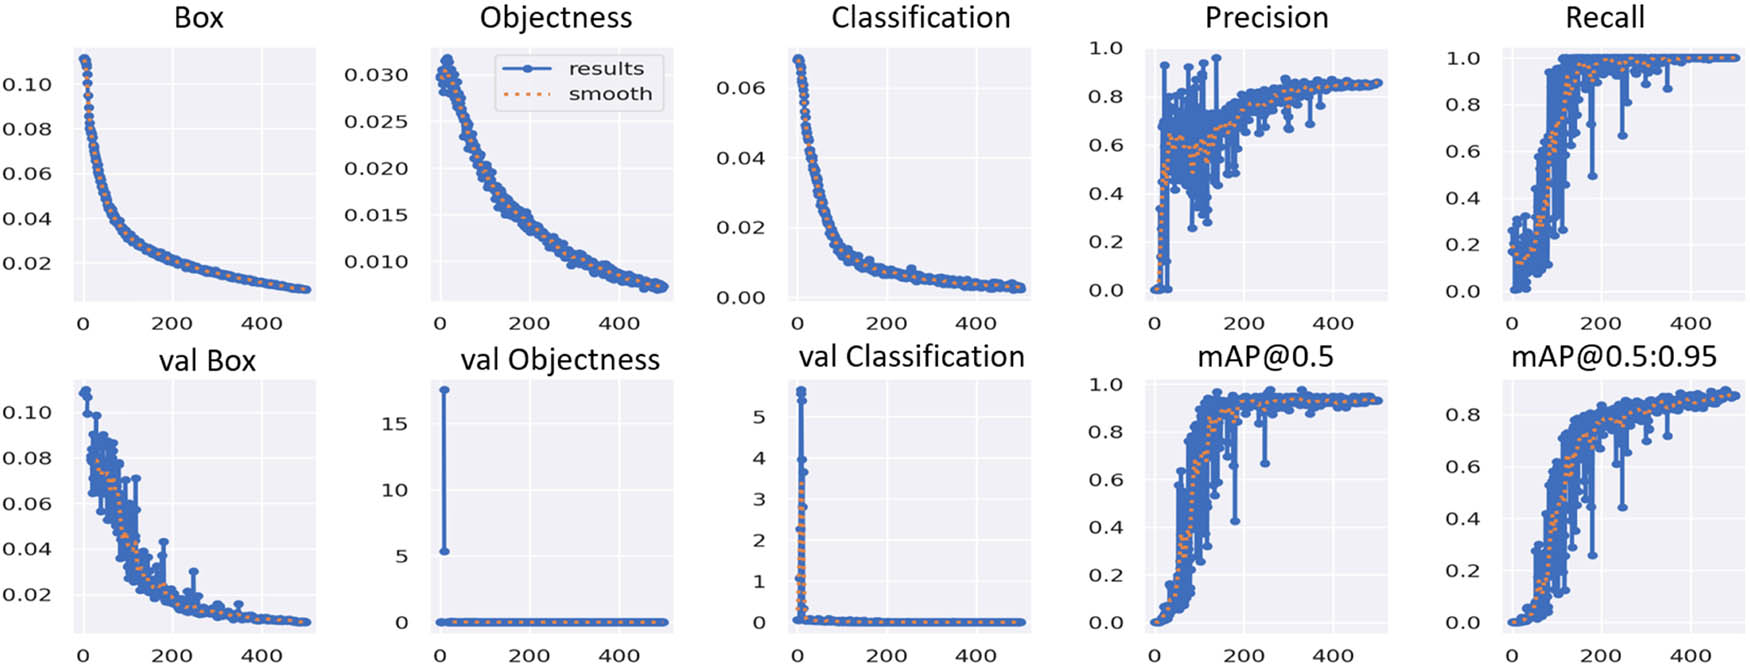
Performance metric of YOLOv5x6 feature.
Performance metric of YOLOv8l feature.
Detection results of YOLOv5x6 and YOLOv8l
| Precision | Recall | mAP@0.5 | mAP@0.5:0.95 | Training time (h) | |
|---|---|---|---|---|---|
| YOLOv5x6 | 0.878 | 0.973 | 0.935 | 0.905 | 4.580 |
| YOLOv8l | 0.816 | 0.971 | 0.925 | 0.915 | 2.010 |
Additionally, it is important to note that the YOLOv5x6 model underwent early stopping in its training process at epoch 500, while the YOLOv8l model continued training until epoch 232. In fact, YOLOv5x6 was trained for a longer duration, 500 epochs, before an early stop was initiated. This implies that it continued to make improvements to the validation metric for a more extended period, indicating that it might have been gradually fine-tuning its weights and learning more intricate patterns in the data. In contrast, YOLOv8l ended training significantly earlier at epoch 232, indicating that the model had reached a solution more rapidly. This implies that it reached a point where further training did not significantly improve performance, or it might have encountered challenges like overfitting in the training process that were not encountered by YOLOv5x6.
The model performances not only shed light on the strengths and potential limitations of each model but also underscore the significance of adopting a customized approach to object detection, ensuring accurate monitoring of consumables across diverse environments. This comprehensive evaluation contributes to refining and optimizing object detection models for real-world applications.
4.2 Comparative analysis of system
Furthermore, we investigated the detection capabilities of models with varying sizes. Table 1 displays the detection results of YOLOv5x6 and YOLOv8l on the test set.
When comparing the two models, YOLOv5x6 outperformed YOLOv8l in terms of precision and mAP@0.5, as indicated in Table 1. The precision score of the YOLOv5x6 model was 0.878, while the YOLOv8l model achieved a precision score of 0.816. This suggests that the improved YOLOv5x6 model exhibited superior accuracy in identifying true positives. Both models demonstrated high recall values, signifying their ability to correctly identify the majority of consumables in the images. YOLOv5x6 achieved a recall of 0.973, whereas YOLOv8l achieved a recall of 0.971, indicating that both models successfully detected the majority of consumables in the images.
The mAP is a metric that measures the model’s performance at various IoU thresholds. In this study, both models displayed good mAP@0.5, indicating their high accuracy in object detection. Notably, YOLOv5x6 outperformed YOLOv8l with an mAP@0.5 of 0.935, compared to the YOLOv8l’s score of 0.925. However, when considering the mAP@0.5:0.95 score, YOLOv8l achieved a higher score of 0.915, surpassing YOLOv5x6’s score of 0.905. This implies that YOLOv8l exhibited greater accuracy in detection, particularly at higher IoU thresholds, compared to the improved YOLOv5x6. Moreover, we addressed the substantial difference in training time observed between the two models in our evaluation. Specifically, YOLOv5x6 required 4.580 h for the complete training process, showcasing a significant training time investment. In contrast, the efficiency of YOLOv8l is remarkable, as it completed the entire training process in just 2.010 h. This disparity in training times between the models is a critical consideration in assessing their practicality and resource requirements.
To evaluate the integration of the models in our system, the outcomes of the evaluation of the image training using the YOLOv5x6 and YOLOv8l models are illustrated in Figure 6(a) and (b), respectively. Evidently, the results demonstrate that training with the YOLOv5x6 model produced noticeably superior precision metrics, with values of 0.97 and 0.98. In contrast, the use of the YOLOv8l model for training yielded slightly less precise results, with values between 0.92 and 0.96.
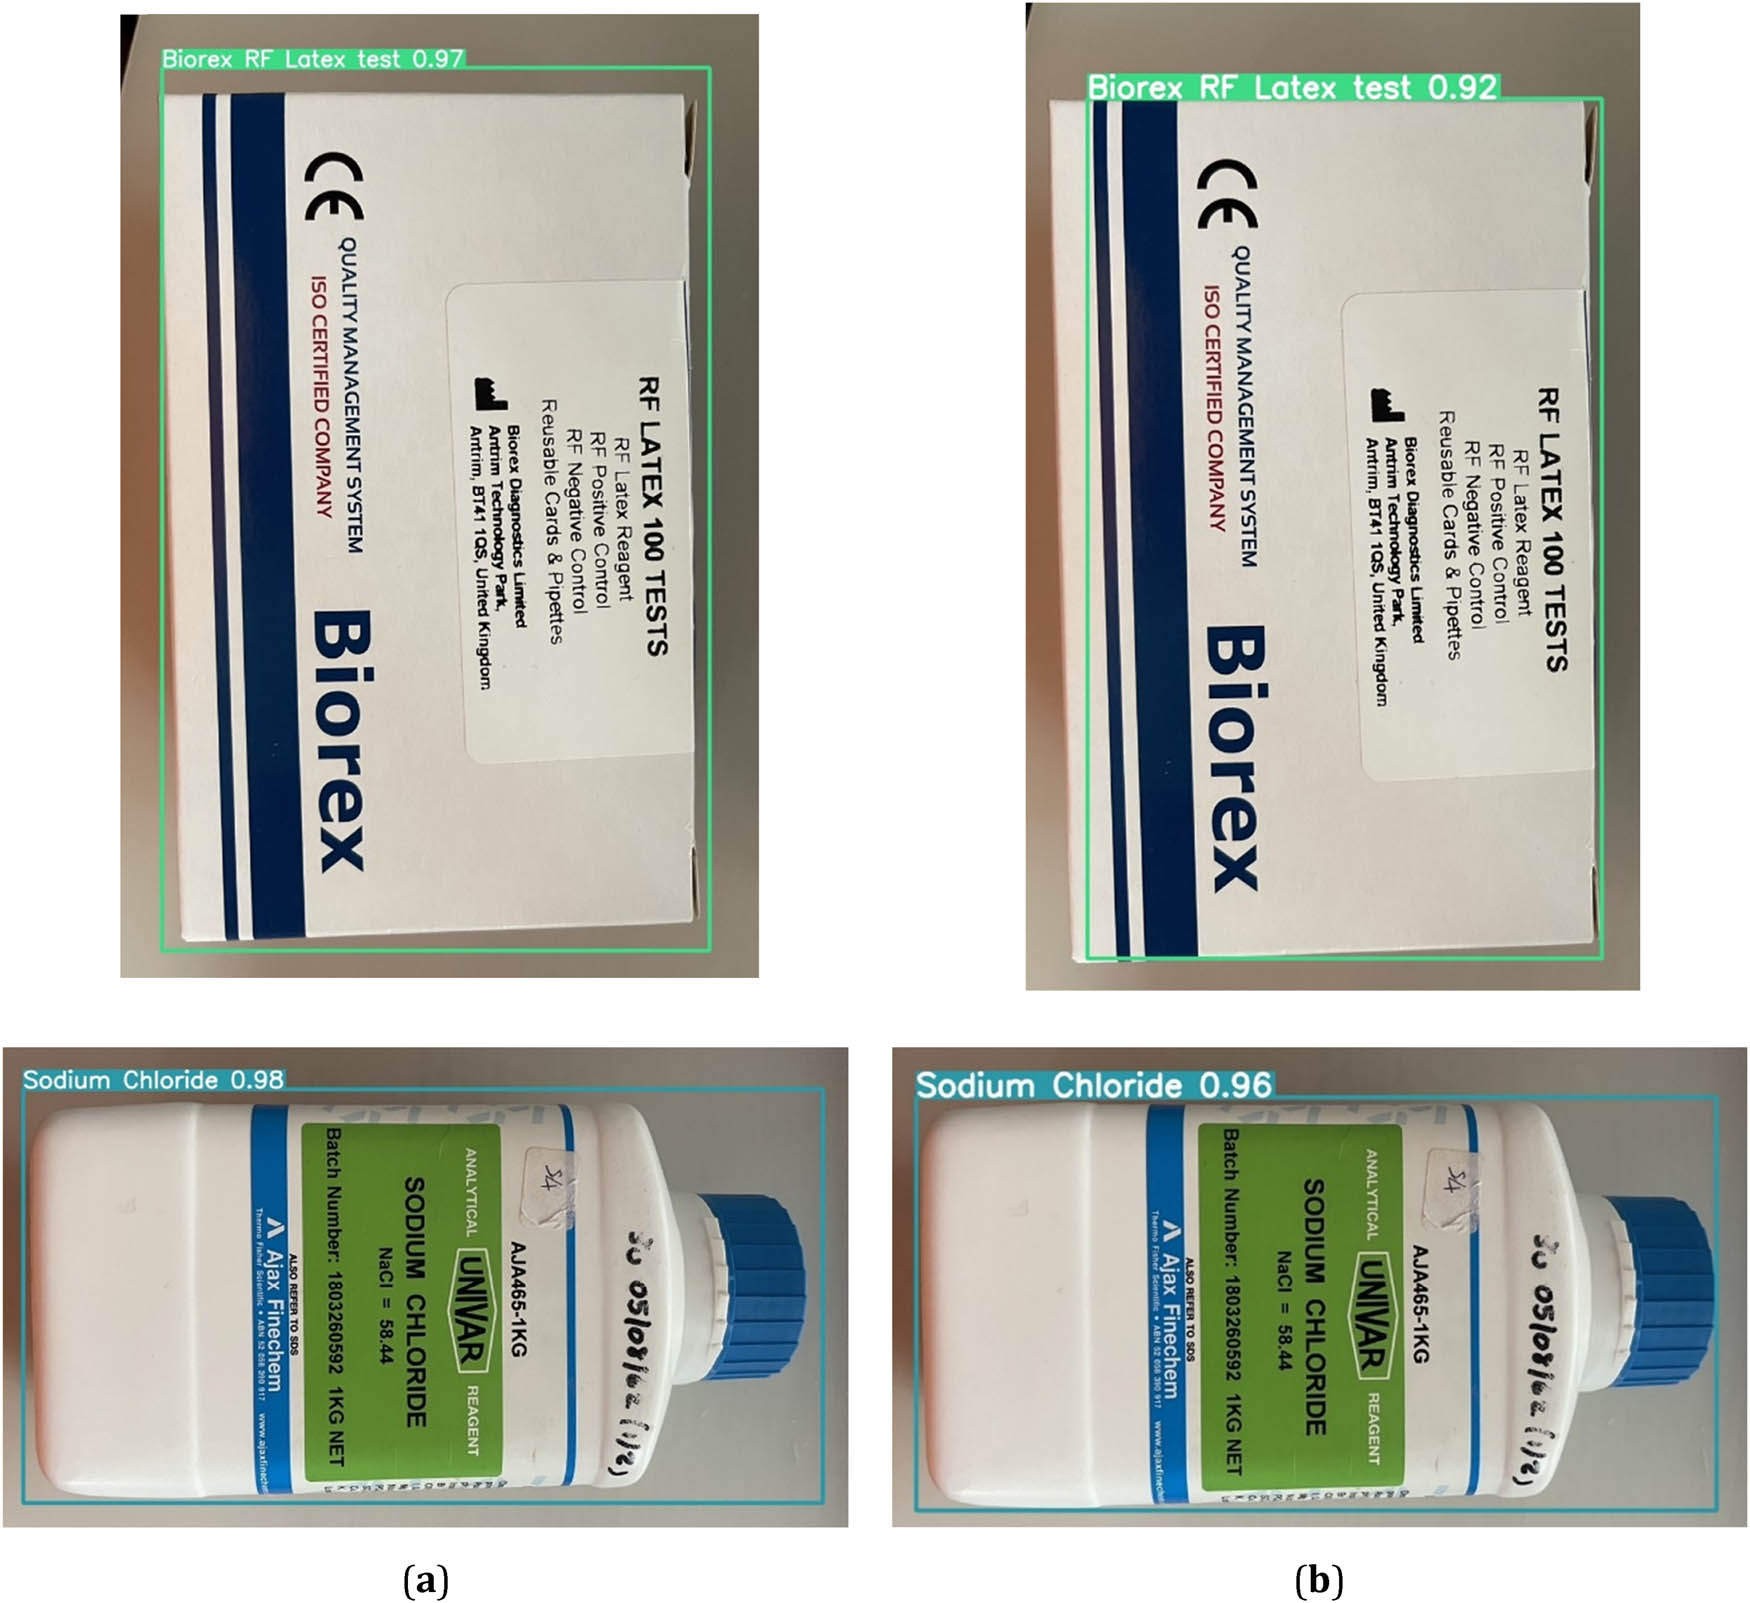
Performance of detection results of the models (a) YOLOv5x6 and (b) YOLOv8l.
Analyzing the YOLOv5x6 and YOLOv8l models reveals distinct performance differences, with YOLOv5x6 demonstrating superior precision and mAP@0.5 despite a longer training duration. These insights offer crucial guidance for selecting models aligned with precision requirements and resource constraints, emphasizing the need for tailored approaches in model selection for effective object detection in diverse environments. The findings contribute to informed decision-making in real-world applications, where achieving the right balance between precision and resource efficiency is pivotal.
5 Discussion and future directions
The study delves into the advancements in the YOLO object detection model, particularly focusing on the recent YOLOv8 iteration, representing the latest improvement. The incremental refinements in sub-models or variants aim to enhance object detection, with exhaustive evaluations concentrating on frequently encountered objects. The comparison between YOLOv5x6 and YOLOv8l reveals significant differences, highlighting the latter’s superior precision in object detection, particularly in the context of item detection in medical laboratory settings. The study underscores the proficiency of YOLOv5x6 in achieving higher precision and real-time detection capabilities for laboratory objects. YOLOv5x6 stands out with a higher precision score of 0.878, showcasing its proficiency in accurately identifying positive detections. However, YOLOv8l demonstrates a commendable balance between precision and recall, reflected in its competitive mAP@0.5 (0.925) and mAP@0.5:0.95 (0.915) scores. Notably, YOLOv8l achieves these performance metrics while requiring significantly less training time, only 2.010 h compared to YOLOv5x6’s 4.580 h. This emphasizes the efficiency of YOLOv8l in model training, making it a compelling choice for scenarios where a balance between accuracy and training time is crucial.
When comparing YOLOv5x6 and YOLOv8l, some factors must be taken into account to determine the most appropriate choice. YOLOv5x6 is the chosen alternative due to its high precision score of 0.878, making precision a crucial factor. On the other hand, if the focus is on achieving a careful balance between precision and recall, together with a preference for faster training times, YOLOv8l is the preferred selection. This choice is supported by its competitive mAP scores of 0.925 and 0.915, as well as a much-shortened training time of 2.010 h. The optimal best depends on the specific trade-offs and requirements within the context of the object detection application.
Regarding the design and employment of a sophisticated DL framework for tracking consumable goods in a medical laboratory, this research introduces real-time material tracking through the utilization of AI techniques. These techniques offer unique characteristics that set them apart from other methods of material tracking. Notably, the use of AI in this research demonstrates that it is a more affordable substitute for RFID technology, making it particularly useful for organizations or large laboratories. The application of this technology yields distinct efficiency benefits while optimizing resource utilization.
Despite the promising results, the research acknowledges certain limitations in implementing AI for consumable tracking in a medical laboratory. First, like any object detection system, when it comes to usability in actual applications, particularly when utilizing new goods or objects, this DL-based AI model has certain constraints and considerations. Each time a new type of product is added to the laboratories or when a product undergoes changes in properties, such as color, model details, or packaging shape to ensure accurate results, the data must be entered for the system to undergo new learning and training. This typically occurs when the organization introduces new products into the procurement cycle, and it may take some time for the system to complete its training before it can be integrated into the operating room system for further use.
Second, the collection and annotation of sufficient data for that specific class must be performed. This can be a time-consuming process. In real-world practice, misunderstandings during the labeling and annotation process or staff error can result in poorly annotated data. These mistakes could result in inaccurate or inconsistent annotations, which may then lead to poorer model performance. For example, in a medical laboratory tracking system, the precise annotation of medical samples is essential; therefore, offering clear and comprehensive annotation guidelines and training and supervising annotators can contribute to the system’s usefulness.
5.1 Future directions
To address the identified limitations, future research could focus on developing more adaptive and efficient training processes for object detection models. One important emphasis is on improving training procedures to be more flexible and effective, with a focus on applying the technology in real-world applications. This involves investigating automated techniques for gathering and labeling data, with the goal of optimizing the training process and enhancing the system’s overall reliability. Improving rules and supervision during these processes is essential for ensuring high-quality annotations and enhancing the system’s effectiveness in real-world situations.
In the future, our future scope will be dedicated to the practical application of AI technology in real-world settings, particularly in medical laboratories. Implementing AI systems in real operational settings requires comprehensive training for the medical staff in addition to technological advancements. Therefore, training medical workers is the key importance for optimizing the utilization of AI technologies, enhancing efficiency, and minimizing potential challenges during their implementation. For example, a well-structured training program could include hands-on sessions where medical staff learn to interpret AI-generated understandings, ensuring an integration of AI systems into their daily tasks. This training is crucial for healthcare workers to acquire the required skills and knowledge of AI systems, enabling them to fully connect these technologies and, consequently, enhance the efficiency and workload management in medical laboratories.
6 Conclusions
Deep CNN, which is considered to be a cutting-edge technology in the domain of ML, has achieved notable advancements in various computer vision tasks. In this study, we created a dataset of various consumables, tested different models, and deployed those models for real-time consumables detection in the medical laboratory. Within the scope of this study, we employed the YOLOv5x6 algorithm and YOLOv8l to detect consumable products as part of the tracking system. The application of AI-based technology to improve consumables tracking in medical laboratories is the primary emphasis of this research project. Its main objectives include strengthening inventory control and improving operational efficiency. When the performance of two object detection models, YOLOv5x6 and YOLOv8l, was evaluated, YOLOv5x6 was shown to achieve higher precision for laboratory objects, and it was able to achieve high detection accuracy in real time. YOLOv5x6 achieved 7.61% higher precision and 1.08% higher mAP@0.5 compared to YOLOv8l, indicating its superior accuracy and object localization capabilities at a lower IoU threshold. The findings of this research will have a significant impact on the development of object detection in the future, particularly in the tracking systems used in medical laboratories. In addition, the functional design features can be used to detect objects and can be expanded to cover a wider variety of object detection applications in medical laboratories. We are confident that the system can be improved even further by adding more data to the training set, as well as by putting it into practice in actual applications. The results of this research significantly influence the future of object detection technologies, particularly within tracking systems employed in medical laboratories. The proposed functional design elements provide scalability for wider applications in this industry. Through collaboration with several community hospitals, the system has undergone pilot testing, strengthening relationships with possible industry stakeholders and providing vital real-world feedback to further development. These steps not only enhance the technology but also ensure it meets the practical needs of healthcare, smoothing the path for its transfer into real-world applications and wider adoption in the market.
Acknowledgments
The authors gratefully acknowledge the valuable comments, and the contribution of all the anonymous reviewers that improved the quality of the article.
-
Funding information: Thai Science Research and Innovation Fundamental Fund, Contact No. TUFF 36/2565, and Thammasat University Research Fund, Contact No. TUFT-FF33/2565.
-
Author contributions: HS, PT and ST – Conceptualization, Methodology, Software. PT and ST – Validation. HS and ST – Formal analysis, Investigation. HS – writing original draft preparation. HS, PT and ST – writing—review and editing. All authors have read and agreed to the published version of the manuscript.
-
Conflict of interest: The authors declare no conflicts of interest.
-
Data availability statement: The data presented in this study are available on request from the corresponding author.
References
[1] Harrison JP, McDowell GM. The role of laboratory information systems in healthcare quality improvement. Int J Health Care Qual Assur. 2008;21(7):679–91.10.1108/09526860810910159Search in Google Scholar PubMed
[2] Kubono K. [Quality management system in the medical laboratory--ISO15189 and laboratory accreditation], (in jpn). Rinsho Byori. 2004 Mar;52(3):274–8, http://europepmc.org/abstract/MED/15137330.Search in Google Scholar
[3] Lippi G, Da Rin G. Advantages and limitations of total laboratory automation: a personal overview. Clin Chem Lab Med (CCLM). 2019;57(6):802–11.10.1515/cclm-2018-1323Search in Google Scholar PubMed
[4] Kaul KL, Sabatini LM, Tsongalis GJ, Caliendo AM, Olsen RJ, Ashwood ER, et al. The case for laboratory developed procedures: Quality and positive impact on patient care. Acad Pathol. 2017;4:2374289517708309. 10.1177/2374289517708309.Search in Google Scholar PubMed PubMed Central
[5] Nkengasong JN, Yao K, Onyebujoh P. Laboratory medicine in low-income and middle-income countries: progress and challenges. Lancet. 2018;391(10133):1873–5.10.1016/S0140-6736(18)30308-8Search in Google Scholar PubMed PubMed Central
[6] Olmsted SS, Moore M, Meili RC, Duber HC, Wasserman J, Sama P, et al. Strengthening laboratory systems in resource-limited settings. Am J Clin Pathol. 2010;134(3):374–80.10.1309/AJCPDQOSB7QR5GLRSearch in Google Scholar PubMed
[7] Knowles S, Barnes I. Lean laboratories: laboratory medicine needs to learn from other industries how to deliver more for less. J Clin Pathol. 2013;66(8):635–7.10.1136/jclinpath-2013-201624Search in Google Scholar PubMed
[8] Hirota Y, Suzuki S, Ohira Y, Shikino K, Ikusaka M. The effectiveness of cost reduction with charge displays on test ordering under the health insurance system in japan: a study using paper-based simulated cases for residents and clinical fellows. Intern Med. Jan 2019;58(2):187–93. 10.2169/internalmedicine.0738-17.Search in Google Scholar PubMed PubMed Central
[9] Sritart H, Phudin T, Tosranon P, Taertulakarn S. Design and evaluation of web-based information systems for the medical laboratory. Int J Online Biomed Eng (iJOE). 2023;19(3):48–60. 10.3991/ijoe.v19i03.36505.Search in Google Scholar
[10] Grange ES, Neil EJ, Stoffel M, Singh AP, Tseng E, Resco-Summers K, et al. Responding to COVID-19: the UW medicine information technology services experience. Appl Clin Inform. 2020;11(2):265–75.10.1055/s-0040-1709715Search in Google Scholar PubMed PubMed Central
[11] Durant TJS, Peaper DR, Ferguson D, Schulz WL. Impact of COVID-19 Pandemic on laboratory utilization. J Appl Lab Med. 2020;5(6):1194–205. 10.1093/jalm/jfaa121.Search in Google Scholar PubMed PubMed Central
[12] Chakraborty C, Gupta B, Ghosh SK. Mobile metadata assisted community database of chronic wound images. Wound Med. 2014;6:34–42.10.1016/j.wndm.2014.09.002Search in Google Scholar
[13] Beriault DR, Gilmour JA, Hicks LK. Overutilization in laboratory medicine: tackling the problem with quality improvement science. Crit Rev ClLaboratory Sci. 2021 Sep;58(6):430–46. 10.1080/10408363.2021.1893642.Search in Google Scholar PubMed
[14] Nguyen TN, Nielsen P. The dynamics of information system development in developing countries: From mutual exclusion to hybrid vigor. Electron J Inf Syst Develop Ctries. 2023;89(4):e12266. 10.1002/isd2.12266.Search in Google Scholar
[15] Nowrouzi-Kia B, Dong J, Gohar B, Hoad M. Factors associated with burnout among medical laboratory professionals in Ontario, Canada: An exploratory study during the second wave of the COVID-19 pandemic. Int J Health Plan Manag. 2022;37(4):2183–97. 10.1002/hpm.3460.Search in Google Scholar PubMed PubMed Central
[16] Cheong HS, Kwon KT, Hwang S, Kim SW, Chang HH, Park SY, et al. Workload of healthcare workers during the COVID-19 outbreak in Korea: A Nationwide Survey. jkms. 2022;37(6):e49. 10.3346/jkms.2022.37.e49.Search in Google Scholar PubMed PubMed Central
[17] Nuñez-Argote L, Baker DP, Jones AP. Initial clinical laboratory response to COVID-19: A survey of medical laboratory professionals. Lab Med. 2021;52(4):e115–24. 10.1093/labmed/lmab021.Search in Google Scholar PubMed PubMed Central
[18] Somboonviboon D, Wittayawisawasakul Y, Wacharasint P. Prevalence and risk factors of burnout syndrome during COVID-19 pandemic among healthcare providers in Thailand. J Environ Public Health. 2023;2023:5719241. 10.1155/2023/5719241.Search in Google Scholar PubMed PubMed Central
[19] Tatsanakit A, Udomsri S, Thongdee W, Chalernjit C. Medical laboratory quality system at the crown prince hospitals, Thailand. Bull Dep Med Sci. 2018;60(4):205–17.Search in Google Scholar
[20] Iadanza E, Gonnelli V, Satta F, Gherardelli M. Evidence-based medical equipment management: a convenient implementation. Med Biol Eng Comput. 2019;57(10):2215–30. 10.1007/s11517-019-02021-x.Search in Google Scholar PubMed PubMed Central
[21] Schweikardt C, Verheij RA, Donker GA, Coppieters Y. The historical development of the Dutch Sentinel General Practice Network from a paper-based into a digital primary care monitoring system. J Public Health. 2016;24(6):545–62. 10.1007/s10389-016-0753-4.Search in Google Scholar
[22] Bertnum AB, Semini M, Strandhagen JO. Planning environments of hospital laboratories: An exploratory study. In Advances in Production Management Systems. The Path to Digital Transformation and Innovation of Production Management Systems: IFIP WG 5.7 International Conference, APMS 2020, Novi Sad, Serbia, August 30–September 3, 2020, Proceedings, Part I.: Springer; 2020. p. 538–45.10.1007/978-3-030-57993-7_61Search in Google Scholar
[23] Kishor A, Chakraborty C. Early and accurate prediction of diabetics based on FCBF feature selection and SMOTE. Int J Syst Assur Eng Manag. 2021;1–9. 10.1007/s13198-021-01174-z Search in Google Scholar
[24] Kaur H, Kumari V. Predictive modelling and analytics for diabetes using a machine learning approach. Appl Comput Inform. 2022;18(1/2):90–100. 10.1016/j.aci.2018.12.004.Search in Google Scholar
[25] Schwab P, DuMont Schütte A, Dietz B, Bauer S. Clinical predictive models for COVID-19: systematic study. J Med Internet Res. 2020;22(10):e21439.10.2196/21439Search in Google Scholar PubMed PubMed Central
[26] Chadaga K, Chakraborty C, Prabhu S, Umakanth S, Bhat V, Sampathila N. Clinical and laboratory approach to diagnose COVID-19 using machine learning. Interdiscip Sci: Comput Life Sci. 2022;14(2):452–70.10.1007/s12539-021-00499-4Search in Google Scholar PubMed PubMed Central
[27] Xue W, Li Q, Xue Q. Text detection and recognition for images of medical laboratory reports with a deep learning approach. IEEE Access. 2019;8:407–16.10.1109/ACCESS.2019.2961964Search in Google Scholar
[28] Tan L, Huangfu T, Wu L, Chen W. Comparison of RetinaNet, SSD, and YOLO v3 for real-time pill identification. BMC Med Inform Decis Making. 2021;21(1):324. 10.1186/s12911-021-01691-8.Search in Google Scholar PubMed PubMed Central
[29] Alajmi A, Adlan N, Lahyani R. Assessment of supply chain management resilience within saudi medical laboratories during Covid-19 pandemic. Procedia Cirp. 2021;103:32–6.10.1016/j.procir.2021.10.004Search in Google Scholar PubMed PubMed Central
[30] Aqajari S, Cao R, Kasaeyan Naeini E, Calderon MD, Zheng K, Dutt N, et al. Machine learning (ML) in medicine: review, applications, and challenges. Mathematics. 2021;9:2970, https://www.mdpi.com/2227-7390/9/22/2970.10.3390/math9222970Search in Google Scholar
[31] Ali O, Shrestha A, Soar J, Wamba SF. Cloud computing-enabled healthcare opportunities, issues, and applications: A systematic review. Int J Inf Manag. 2018;43:146–58.10.1016/j.ijinfomgt.2018.07.009Search in Google Scholar
[32] Pereira JA, Quach S, Hamid JS, Quan SD, Diniz AJ, Van Exan R, et al. The integration of barcode scanning technology into Canadian public health immunization settings. Vaccine. 2014;32(23):2748–55. 10.1016/j.vaccine.2013.11.015.Search in Google Scholar PubMed
[33] Pereira JA, Quach S, Hamid JS, Heidebrecht CL, Quan SD, Nassif J, et al. Exploring the feasibility of integrating barcode scanning technology into vaccine inventory recording in seasonal influenza vaccination clinics. Vaccine. 2012;30(4):794–802. 10.1016/j.vaccine.2011.11.043.Search in Google Scholar PubMed
[34] Chen WC, Chang P, Chen LF. Developing a camera-phone-based drug barcode reader and support system(in eng). AMIA Annu Symp Proc. 2006;2006:882.Search in Google Scholar
[35] Morton AQ. Packaging history: The emergence of the uniform product code (UPC) in the United States, 1970–75. History Technol, an Int J. 1994;11(1):101–11.10.1080/07341519408581856Search in Google Scholar
[36] Jain V, Jain Y, Dhingra H, Saini D, Taplamacioglu M, Saka M. A systematic literature review on qr code detection and pre-processing. Int J Tech Phys Probl Eng. 2021;13(1):111–9.Search in Google Scholar
[37] Shukran MAM, Ishak MS, Abdullah MN. Enhancing Chemical inventory management in laboratory through a mobile-based QR code tag. Mater Sci Eng Conf Ser. 2017;226:012093. 10.1088/1757-899x/226/1/012093.Search in Google Scholar
[38] Groom T, Barrios D, George K. An in-depth analysis of RFID versus barcode scanning for tactile learning. In 2021 IEEE International Conference on Electronics, Computing and Communication Technologies (CONECCT); 2021. p. 1–5. 10.1109/CONECCT52877.2021.9622640.Search in Google Scholar
[39] Maviglia SM, Yoo JY, Franz C, Featherstone E, Churchill W, Bates DW, et al. Cost-benefit analysis of a hospital pharmacy bar code solution. Arch Intern Med. Apr 2007;167(8):788–94. 10.1001/archinte.167.8.788.Search in Google Scholar PubMed
[40] Holden RJ, Brown RL, Scanlon MC, Karsh BT. Pharmacy workers’ perceptions and acceptance of bar-coded medication technology in a pediatric hospital. Res Soc Adm Pharm. 2012;8(6):509–22. 10.1016/j.sapharm.2012.01.004.Search in Google Scholar PubMed PubMed Central
[41] Weir NM, Preston K, Newham R, Bennie M. A mixed-method study of community pharmacy staff’s use, perceptions and acceptance of barcode scanning technology: Pharmacy’s experience of scanning technology. Health Policy Technol. 2021;10(1):60–8. 10.1016/j.hlpt.2020.11.005.Search in Google Scholar
[42] Zhou W, Piramuthu S. Framework, strategy and evaluation of health care processes with RFID. Decis Support Syst. 2010;50(1):222–33. 10.1016/j.dss.2010.08.003.Search in Google Scholar
[43] Rosenbaum BP. Radio frequency identification (RFID) in health care: privacy and security concerns limiting adoption. J Med Syst. 2014;38:1–6.10.1007/s10916-014-0019-zSearch in Google Scholar PubMed
[44] Camacho-Cogollo JE, Bonet I, Iadanza E. Chapter 4 - RFID technology in health care. In: Iadanza E, editor. In Clinical engineering handbook. 2nd edn. Academic Press; 2020. p. 33–41.10.1016/B978-0-12-813467-2.00004-3Search in Google Scholar
[45] Abugabah A, Nizamuddin N, Abuqabbeh A. A review of challenges and barriers implementing RFID technology in the healthcare sector. Procedia Comput Sci. 2020;170:1003–10.10.1016/j.procs.2020.03.094Search in Google Scholar
[46] Gulcharan NFBI, Daud H, Nor NM, Ibrahim T, Nyamasvisva ET. Limitation and solution for healthcare network using RFID technology: A review. Procedia Technol. 2013;11:565–71. 10.1016/j.protcy.2013.12.229.Search in Google Scholar
[47] Dhall D, Kaur R, Juneja M. Machine learning: a review of the algorithms and its applications. In Proceedings of ICRIC. Cham: Springer International Publishing; 2020. p. 47–63.10.1007/978-3-030-29407-6_5Search in Google Scholar
[48] Ghazal TM, Hasan MK, Alshurideh MT, Alzoubi HM, Ahmad M, Akbar SS, et al. IoT for smart cities: machine learning approaches in smart healthcare – a review. Future Internet. 2021;13(8):218, https://www.mdpi.com/1999-5903/13/8/218.10.3390/fi13080218Search in Google Scholar
[49] Zhao R, Yan R, Chen Z, Mao K, Wang P, Gao RX. Deep learning and its applications to machine health monitoring. Mech Syst Signal Process. 2019;115:213–37.10.1016/j.ymssp.2018.05.050Search in Google Scholar
[50] De Bruyne S, Speeckaert MM, Van Biesen W, Delanghe JR. Recent evolutions of machine learning applications in clinical laboratory medicine. Crit Rev Cllaboratory Sci. 2021;58(2):131–52.10.1080/10408363.2020.1828811Search in Google Scholar PubMed
[51] Terven J, Cordova-Esparza D. A comprehensive review of YOLO: From YOLOv1 to YOLOv8 and beyond, Ithaca, New York, USA: Cornell University Library. preprint arXiv:2304.00501; 2023.Search in Google Scholar
[52] Jiang P, Ergu D, Liu F, Cai Y, Ma B. A review of Yolo algorithm developments. Procedia Comput Sci. 2022;199:1066–73.10.1016/j.procs.2022.01.135Search in Google Scholar
[53] Diwan T, Anirudh G, Tembhurne JV. Object detection using YOLO: Challenges, architectural successors, datasets and applications. Multimed Tools Appl. 2023;82(6):9243–75.10.1007/s11042-022-13644-ySearch in Google Scholar PubMed PubMed Central
[54] Xue W, Li Q, Zhang Z, Zhao Y, Wang H. Table analysis and information extraction for medical laboratory reports. In 2018 IEEE 16th Intl Conf on Dependable, Autonomic and Secure Computing, 16th Intl Conf on Pervasive Intelligence and Computing, 4th Intl Conf on Big Data Intelligence and Computing and Cyber Science and Technology Congress (DASC/PiCom/DataCom/CyberSciTech). IEEE; 2018. p. 193–9.10.1109/DASC/PiCom/DataCom/CyberSciTec.2018.00043Search in Google Scholar
[55] Alam MM, Islam MT. Machine learning approach of automatic identification and counting of blood cells. Healthc Technol Lett. 2019;6(4):103–8. 10.1049/htl.2018.5098.Search in Google Scholar PubMed PubMed Central
[56] Liu S, Zhou H, Li C, Wang S. Analysis of anchor-based and anchor-free object detection methods based on deep learning. In 2020 IEEE International Conference on Mechatronics and Automation (ICMA); 2020. p. 1058–65. 10.1109/ICMA49215.2020.9233610.Search in Google Scholar
[57] Xiao Y, Tian Z, Yu J, Zhang Y, Liu S, Du S, et al. A review of object detection based on deep learning. Multimed Tools Appl. 2020;79(33):23729–91. 10.1007/s11042-020-08976-6.Search in Google Scholar
[58] Zhao Z-Q, Zheng P, Xu S-T, Wu X. Object detection with deep learning: A review. IEEE Trans Neural Netw Learn Syst. 2019 Nov;30(11):3212–32.10.1109/TNNLS.2018.2876865Search in Google Scholar PubMed
[59] Oksuz K, Cam BC, Kalkan S, Akbas E. Imbalance problems in object detection: A review. IEEE Trans Pattern Anal Mach Intell. 2020;43(10):3388–415.10.1109/TPAMI.2020.2981890Search in Google Scholar PubMed
[60] Pestana D, Miranda PR, Lopes JD, Duarte RP, Vestias MP, Neto HC, et al. A full featured configurable accelerator for object detection with YOLO. IEEE Access. 2021;9:75864–77. 10.1109/ACCESS.2021.3081818.Search in Google Scholar
[61] Poon YS, Lin CC, Liu YH, Fan CP. YOLO-based deep learning design for in-cabin monitoring system with fisheye-lens camera. In 2022 IEEE International Conference on Consumer Electronics (ICCE); 2022. p. 1–4. 10.1109/ICCE53296.2022.9730235.Search in Google Scholar
[62] Wu B, Pang C, Zeng X, Hu X. ME-YOLO: Improved YOLOv5 for detecting medical personal protective equipment. Appl Sci. 2022;12(23):11978, https://www.mdpi.com/2076-3417/12/23/11978.10.3390/app122311978Search in Google Scholar
[63] Bal A, Das M, Satapathy SM, Jena M, Das SK. Automated diagnosis of breast cancer with RoI detection using YOLO and heuristics. In: Cham D, Goswami, Hoang TA, editors Distributed computing and internet technology. Switzerland: Springer, Cham; 2021. p. 253–67.10.1007/978-3-030-65621-8_16Search in Google Scholar
[64] Amin J, Anjum MA, Sharif M, Kadry S, Nadeem A, Ahmad SF. Liver tumor localization based on YOLOv3 and 3D-semantic segmentation using deep neural networks. Diagnostics. 2022;12(4):823, https://www.mdpi.com/2075-4418/12/4/823.10.3390/diagnostics12040823Search in Google Scholar PubMed PubMed Central
[65] Ali L, Alnajjar F, Parambil MMA, Younes MI, Abdelhalim ZI, Aljassmi H. Development of YOLOv5-based real-time smart monitoring system for increasing lab safety awareness in educational institutions. Sens (Basel). Nov 2022;22(22):8820. 10.3390/s22228820.Search in Google Scholar PubMed PubMed Central
[66] Durve M, Orsini S, Tiribocchi A, Montessori A, Tucny JM, Lauricella M, et al. Benchmarking YOLOv5 and YOLOv7 models with DeepSORT for droplet tracking applications. Eur Phys J E. 2023;46(5):32. 10.1140/epje/s10189-023-00290-x.Search in Google Scholar PubMed PubMed Central
[67] Liu Y, Lu B, Peng J, Zhang Z. Research on the use of YOLOv5 object detection algorithm in mask wearing recognition. World Sci Res J. 2020;6(11):276–84.Search in Google Scholar
[68] Li C, Li L, Jiang H, Weng K, Geng Y, Li L, et al. YOLOv6: A single-stage object detection framework for industrial applications. arXiv:220902976. 2022.Search in Google Scholar
[69] Meng M, Li H, Wang Y. A novel method for reducing dispensing error in hospital pharmacy. Durham, North Carolina, USA: Research Square Company; 2022.10.21203/rs.3.rs-1808445/v1Search in Google Scholar
[70] Jocher ACG, Qiu J. Ultralytics yolov8. Frederick, Maryland, USA: Ultralytics Inc. accessed 20 September 2023, 2023. https://github.com/ultralytics/ultralytics.Search in Google Scholar
[71] Qureshi R, Ragab MG, Abdulkader SJ, Alqushaib A, Sumiea EH, Alhussian H. A comprehensive systematic review of YOLO for medical object detection (2018 to 2023). Piscataway, New Jersey, USA: IEEE; 2023.10.36227/techrxiv.23681679.v1Search in Google Scholar
[72] Akhtar S, Hanif M, Malih H. Automatic urine sediment detection and classification based on YoloV8. In Computational Science and Its Applications – ICCSA 2023 Workshops. Cham: Springer Nature Switzerland; 2023. p. 269–79.10.1007/978-3-031-37129-5_22Search in Google Scholar
[73] Muhammad AR, Utomo HP, Hidayatullah P, Syakrani N. Early stopping effectiveness for YOLOv4. J Inf Syst Eng Bus Intell. 2022;8(1):11–20.10.20473/jisebi.8.1.11-20Search in Google Scholar
© 2024 the author(s), published by De Gruyter
This work is licensed under the Creative Commons Attribution 4.0 International License.
Articles in the same Issue
- Research Articles
- A study on intelligent translation of English sentences by a semantic feature extractor
- Detecting surface defects of heritage buildings based on deep learning
- Combining bag of visual words-based features with CNN in image classification
- Online addiction analysis and identification of students by applying gd-LSTM algorithm to educational behaviour data
- Improving multilayer perceptron neural network using two enhanced moth-flame optimizers to forecast iron ore prices
- Sentiment analysis model for cryptocurrency tweets using different deep learning techniques
- Periodic analysis of scenic spot passenger flow based on combination neural network prediction model
- Analysis of short-term wind speed variation, trends and prediction: A case study of Tamil Nadu, India
- Cloud computing-based framework for heart disease classification using quantum machine learning approach
- Research on teaching quality evaluation of higher vocational architecture majors based on enterprise platform with spherical fuzzy MAGDM
- Detection of sickle cell disease using deep neural networks and explainable artificial intelligence
- Interval-valued T-spherical fuzzy extended power aggregation operators and their application in multi-criteria decision-making
- Characterization of neighborhood operators based on neighborhood relationships
- Real-time pose estimation and motion tracking for motion performance using deep learning models
- QoS prediction using EMD-BiLSTM for II-IoT-secure communication systems
- A novel framework for single-valued neutrosophic MADM and applications to English-blended teaching quality evaluation
- An intelligent error correction model for English grammar with hybrid attention mechanism and RNN algorithm
- Prediction mechanism of depression tendency among college students under computer intelligent systems
- Research on grammatical error correction algorithm in English translation via deep learning
- Microblog sentiment analysis method using BTCBMA model in Spark big data environment
- Application and research of English composition tangent model based on unsupervised semantic space
- 1D-CNN: Classification of normal delivery and cesarean section types using cardiotocography time-series signals
- Real-time segmentation of short videos under VR technology in dynamic scenes
- Application of emotion recognition technology in psychological counseling for college students
- Classical music recommendation algorithm on art market audience expansion under deep learning
- A robust segmentation method combined with classification algorithms for field-based diagnosis of maize plant phytosanitary state
- Integration effect of artificial intelligence and traditional animation creation technology
- Artificial intelligence-driven education evaluation and scoring: Comparative exploration of machine learning algorithms
- Intelligent multiple-attributes decision support for classroom teaching quality evaluation in dance aesthetic education based on the GRA and information entropy
- A study on the application of multidimensional feature fusion attention mechanism based on sight detection and emotion recognition in online teaching
- Blockchain-enabled intelligent toll management system
- A multi-weapon detection using ensembled learning
- Deep and hand-crafted features based on Weierstrass elliptic function for MRI brain tumor classification
- Design of geometric flower pattern for clothing based on deep learning and interactive genetic algorithm
- Mathematical media art protection and paper-cut animation design under blockchain technology
- Deep reinforcement learning enhances artistic creativity: The case study of program art students integrating computer deep learning
- Transition from machine intelligence to knowledge intelligence: A multi-agent simulation approach to technology transfer
- Research on the TF–IDF algorithm combined with semantics for automatic extraction of keywords from network news texts
- Enhanced Jaya optimization for improving multilayer perceptron neural network in urban air quality prediction
- Design of visual symbol-aided system based on wireless network sensor and embedded system
- Construction of a mental health risk model for college students with long and short-term memory networks and early warning indicators
- Personalized resource recommendation method of student online learning platform based on LSTM and collaborative filtering
- Employment management system for universities based on improved decision tree
- English grammar intelligent error correction technology based on the n-gram language model
- Speech recognition and intelligent translation under multimodal human–computer interaction system
- Enhancing data security using Laplacian of Gaussian and Chacha20 encryption algorithm
- Construction of GCNN-based intelligent recommendation model for answering teachers in online learning system
- Neural network big data fusion in remote sensing image processing technology
- Research on the construction and reform path of online and offline mixed English teaching model in the internet era
- Real-time semantic segmentation based on BiSeNetV2 for wild road
- Online English writing teaching method that enhances teacher–student interaction
- Construction of a painting image classification model based on AI stroke feature extraction
- Big data analysis technology in regional economic market planning and enterprise market value prediction
- Location strategy for logistics distribution centers utilizing improved whale optimization algorithm
- Research on agricultural environmental monitoring Internet of Things based on edge computing and deep learning
- The application of curriculum recommendation algorithm in the driving mechanism of industry–teaching integration in colleges and universities under the background of education reform
- Application of online teaching-based classroom behavior capture and analysis system in student management
- Evaluation of online teaching quality in colleges and universities based on digital monitoring technology
- Face detection method based on improved YOLO-v4 network and attention mechanism
- Study on the current situation and influencing factors of corn import trade in China – based on the trade gravity model
- Research on business English grammar detection system based on LSTM model
- Multi-source auxiliary information tourist attraction and route recommendation algorithm based on graph attention network
- Multi-attribute perceptual fuzzy information decision-making technology in investment risk assessment of green finance Projects
- Research on image compression technology based on improved SPIHT compression algorithm for power grid data
- Optimal design of linear and nonlinear PID controllers for speed control of an electric vehicle
- Traditional landscape painting and art image restoration methods based on structural information guidance
- Traceability and analysis method for measurement laboratory testing data based on intelligent Internet of Things and deep belief network
- A speech-based convolutional neural network for human body posture classification
- The role of the O2O blended teaching model in improving the teaching effectiveness of physical education classes
- Genetic algorithm-assisted fuzzy clustering framework to solve resource-constrained project problems
- Behavior recognition algorithm based on a dual-stream residual convolutional neural network
- Ensemble learning and deep learning-based defect detection in power generation plants
- Optimal design of neural network-based fuzzy predictive control model for recommending educational resources in the context of information technology
- An artificial intelligence-enabled consumables tracking system for medical laboratories
- Utilization of deep learning in ideological and political education
- Detection of abnormal tourist behavior in scenic spots based on optimized Gaussian model for background modeling
- RGB-to-hyperspectral conversion for accessible melanoma detection: A CNN-based approach
- Optimization of the road bump and pothole detection technology using convolutional neural network
- Comparative analysis of impact of classification algorithms on security and performance bug reports
- Cross-dataset micro-expression identification based on facial ROIs contribution quantification
- Demystifying multiple sclerosis diagnosis using interpretable and understandable artificial intelligence
- Unifying optimization forces: Harnessing the fine-structure constant in an electromagnetic-gravity optimization framework
- E-commerce big data processing based on an improved RBF model
- Analysis of youth sports physical health data based on cloud computing and gait awareness
- CCLCap-AE-AVSS: Cycle consistency loss based capsule autoencoders for audio–visual speech synthesis
- An efficient node selection algorithm in the context of IoT-based vehicular ad hoc network for emergency service
- Computer aided diagnoses for detecting the severity of Keratoconus
- Improved rapidly exploring random tree using salp swarm algorithm
- Network security framework for Internet of medical things applications: A survey
- Predicting DoS and DDoS attacks in network security scenarios using a hybrid deep learning model
- Enhancing 5G communication in business networks with an innovative secured narrowband IoT framework
- Quokka swarm optimization: A new nature-inspired metaheuristic optimization algorithm
- Digital forensics architecture for real-time automated evidence collection and centralization: Leveraging security lake and modern data architecture
- Image modeling algorithm for environment design based on augmented and virtual reality technologies
- Enhancing IoT device security: CNN-SVM hybrid approach for real-time detection of DoS and DDoS attacks
- High-resolution image processing and entity recognition algorithm based on artificial intelligence
- Review Articles
- Transformative insights: Image-based breast cancer detection and severity assessment through advanced AI techniques
- Network and cybersecurity applications of defense in adversarial attacks: A state-of-the-art using machine learning and deep learning methods
- Applications of integrating artificial intelligence and big data: A comprehensive analysis
- A systematic review of symbiotic organisms search algorithm for data clustering and predictive analysis
- Modelling Bitcoin networks in terms of anonymity and privacy in the metaverse application within Industry 5.0: Comprehensive taxonomy, unsolved issues and suggested solution
- Systematic literature review on intrusion detection systems: Research trends, algorithms, methods, datasets, and limitations