A comprehensive scheme for lithological mapping using Sentinel-2A and ASTER GDEM in weathered and vegetated coastal zone, Southern China
-
Jingyu Lin
 ,
Bo Zhao
,
Bo Zhao

Abstract
Lithological mapping in weathered and vegetated coastal zone is always a crucial but challenging issue for geological remote sensing. This study tested the applicability of Sentinel-2A and ASTER GDEM data for lithological mapping in the coastal zone of Shanwei district, southern China. Here, a comprehensive scheme for tuff and granite outcrops extraction and lithological classification was employed to process the remote sensing data: 1) Using the matched filtering with image-derived spectra as references, the weathered but representative outcrop-related patches were preliminarily extracted based on the fractal “DN-A” (digital number-area) algorithm; 2) The image masks of NDXI (NDVI, NDSI and MNDWI) in conjunction with spatial intersection, were conducted to minimize the influence of vegetation coverage; 3) Considering terrain features caused by differential weathering, slope analysis have allowed us to discriminate from tuff to granite outcrops; 4) A set of empirical verification criteria were established to assess the classification accuracy, which are exactly 82.4~83.2% of tuff and 91.3~92.3% of granite. The peak values of tuff and granite patch areas are 0–0.1 km2 (51%) and 0–0.5 km2 (60%), and 90% of patches are < 0.6 km2 of tuff and < 3.5 km2 of granite, respectively. The protolith of extracted weathered outcrops were further identified by several excavated trenches. This research has contributed a useful case study for remote-sensing lithological mapping in weathered and vegetated coastal zone, and the proposed approach should have a great possibility to be extrapolated for other similar cases.
1 Introduction
A rocky outcrop is a visible exposure of bedrock on the Earth’s surface [1], which occurs most frequently in areas where have a faster soil erosion speed than weathering rate such as on steep hillsides, mountain ridges as well as tops and river banks naturally, or creates by man-made facilities and resultant removal of soil and rock in some regions. It can provide a window into the underground geological information, allow direct field investigations and sampling of the bedrocks in situ for analyzing crust materials, create geological maps and understand the Earth’s evolution ultimately. Specifically, studying bedrock outcrops will play a crucial part in the following three aspects actually: 1) resource exploration: for example, ore-induced alteration occurred in or near the outcrops is a direct and vital indicated sign for ore prospecting [2]; 2) environmental protection: in Australia, rocky outcrops, as a landscape feature with disproportionately high biodiversity values comparing to their own size, can provide a shelter for plants and animals from predators, fire, extreme weather conditions, etc. [3]. Whereas in turn, karst rocky desertification (KRD) in Southwestern China is one type of the serious soil erosion and extensive bedrock exposures related environmental issues [4]; 3) disaster prevention: earthquake, volcanic eruption, landslide, debris flow, etc., are all involved with rocky exposures investigation more or less. Additionally, vectorized shapefile (polygons or points) derived from digitizing bedrock outcrops is a form of end-product, i.e., GIS-based bedrock dataset [5]. Inasmuch, rocky outcrops study, or in other words, lithological mapping and structural analysis for bedrock outcrops are thought to be a fundamental and indispensable work supporting subsequent Earth science researches.
However, since the outcrop generally appear as the random and discontinuous distribution between different coverages such as loess, regolith, vegetation, etc. (i.e. sparsely outcropping terrain [6]) the relevant information from outcrops that geologists are interested in could be hardly obtained completely through field investigations. Moreover, the access to the site could become more difficult and even dangerous. Lithological mapping in these types of environment can be ineffective, time-consuming, expensive, and when possible, not accurate [7]. All these factors constitute a major problem for the accurate and overall RS geological mapping.
Fortunately, since July 1972 for the launch of the first Landsat 1, remote sensing (RS) has been broadly used in geoscientific fields especially in some of the mature domains such as mineral alteration mapping [8, 9], due to their special advantages in the cyclical, macro- and systematic aspects [10]. The spectral patterns of rocky outcrops relying mainly on rock-mineral components, are always the foundation of RS-based outcrops recognition, which may provide a breakthrough point into the lithological mapping. Nonetheless, current studies mainly focus on (semi-) arid environments with few loess, snow, vegetation, regolith coverage, and only several studies can be found in the literatures falling into four categories:
In the snow-covered areas: comparing to the existing ADD rock outcrop dataset [11], a new rock outcrops map for the Antarctic continent [12] has been developed using an automated RS methodology in differentiating areas of snow and exposed rocks, to correct the georeferencing, overestimation and generalization issues of original ADD dataset;
In the loess-covered areas: Han et al. [14] was some of the few studies that executed the RS-oriented red sandstone interpretation in the Chinese loess plateau region using fractal algorithm as well as spatial point-pattern analysis, and the final interpretation accuracy is acceptable—74% or slightly less;
In the heavily vegetated areas: Grebby et al. [15] evaluated the potential use of an object-based approach to lithological mapping in vegetated terrain incorporating with multispectral and LiDAR data. Wang et al. [16] utilized matched filtering (MF) and topographic analysis to obtained a few well-exposed, typical, or interpretable outcrops and further lithological classification results recently. In a heavily forested region, Mahmood et al. [17] combined vegetation and drainage pattern as an indicator of underlying rock types to map lithology using the Landsat 5 TM image.
Although these studies have successfully characterized geological outcrops in different climate environments, the accuracy and completeness of RS-oriented outcrops extraction from satellite images remain to be explored. Challenges such as undersized or remotely “unseen” outcrops with less diagnostic spectral expression [16] (weaker absorption features than hydrothermal alteration) and the complex mixture of geological objects, still hamper the application of RS technology in different environments with sparse outcrops. Beyond this, according to Zhao et al. [18] and references therein, in covered terrains the bedrock outcrop exposed by local soil erosion is usually a sub-vertically dipping slope and exhibits no planar expression on the imagery, and how to capture the spectral reflectance pattern of the pixel values in the limited outcropping areas becomes critical.
Based on Sentinel-2A MSI and ASTER GDEM data, our study aims to place more focus on the issue of RS-oriented outcrops extraction and lithological classification (tuff and granite) in a weathered and vegetated coastal zone, Southern China. A comprehensive scheme, involving MF, NDXI including normalized difference vegetation/soil index (NDVI, NDSI) and modified normalized difference water index (MNDWI), spatial multifractal algorithm and slope analysis would be utilized to process the remote sensing data. In order to balance against the accuracy required, field observation points or Google Earth™images having a finer resolution were also introduced to conduct the visual interpretation and accuracy assessment.
2 Geological Background
The study area is situated, as depicted in Figure 1, within the western part of Shanwei city near the Honghai bay between 22∘46′Nto 23∘2′N and 114∘55′E to 115∘20′E in Guangdong province, Southern China (Figure 1a). It covers about 40×30 km2 and has a complex assortment of various coverings (vegetation, farmland, building, roads and water bodies, etc.) as well as various subclasses (lake, river and shallow sea to half deep sea) in Figure 1b. which is exactly a heavily vegetated region. The western mountain area is covered with evergreen forest in a higher coverage, while the southeastern plain is characterized by crop agriculture [19].
![Figure 1 (a) Location map of the study area in China; (b) The natural true color Sentinel-2A image of this region. Note that: 1) lithostratigraphic regions (100m-buffered) and fault zone were digitalized from the 1:200,000 geological map sheets [23, 24]; 2) these photographs show the locations of granite series (G1-G4) and tuff series (T1-T4)](/document/doi/10.1515/geo-2019-0076/asset/graphic/j_geo-2019-0076_fig_001.jpg)
(a) Location map of the study area in China; (b) The natural true color Sentinel-2A image of this region. Note that: 1) lithostratigraphic regions (100m-buffered) and fault zone were digitalized from the 1:200,000 geological map sheets [23, 24]; 2) these photographs show the locations of granite series (G1-G4) and tuff series (T1-T4)
The major strike of its fault systems is NE-SW oriented Lianhuashan fault zone [20], following by the NW-SE trending lineaments. The lithological units [21] in this region mainly include Quaternary loose deposits and Mesozoic rocks such as tuff, multistage and oversized intrusive plutons (acidic to medium-acidic granite) in Figure 1b. A large magma activity in Mesozoic leads to the similar composition of these rocks, which makes it more difficult to lithological classification. Besides, warm and humid climatic conditions result in the chemical weathering to rock surface and change the component, thus increasing the difficulty of lithological mapping.Weathering is a common process for all rocks so that weathered outcrops turn out be representative for the following MF analysis rather than fresh ones. In addition, different lithological units show the characteristic of differential weathering along with different topographic features. In this area, granite plutons are characterized in relatively gentle landforms comparing with tuff strata.
Findings indicate that the bedrock exposures appear mainly in the walls of large gullies and along the roadside, river/lake bank and reservoir shore, etc. (T1-T4 and G1-G4 in Figure 1). Many, if not most, of the known outcrops have an average “diameter” of ~20m; whereas for granite, human engineering activities such as the mining of Cu-Pb-Zn deposits [22] that occur in granite plutons could form a few spectacular and centrally distributed outcrops near the Ebu and Hongcao town. Overall, in addition to the previous project research foundation, the selection of this region was also determined by the fact that it meets the definition of a weathered and vegetated terrain.
3 Materials and Methods
Due to the influence of complicated geological process, similarities in the reflectance spectra of geological objects and so on, there is no single ‘perfect’ technique or method to detect and visualize the whole and satisfying rocky outcrops. As display in Figure 2, four different methods including MF, NDXI (NDVI, NDSI and MNDWI), terrain analysis and fractal algorithm, were combined and utilized for more effective outcrops extraction.
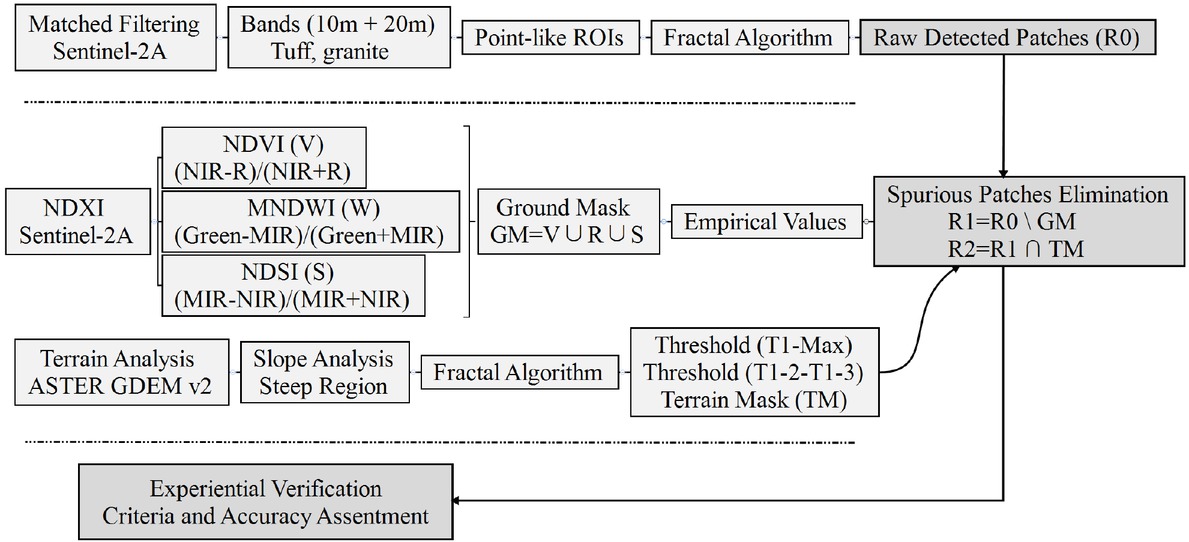
Flow chart of the study procedure.
3.1 Remote Sensing Dataset and Image Pre-processing
In this contribution, both the Copernicus Sentinel-2A (S2-A) level-1C image on 11 February 2017 and ASTER GDEM v2 data (30-m resolution) were selected for use in Table 1. As a new mission, the sentinel satellites can provide routine observations and data continuity of ERS, SPOT, ASTER, etc. [25]. The S2-A was launched on 23 June 2015 for the operational needs of the Copernicus programme, carrying a single Multi-Spectral Instrument (MSI) in 13 spectral bands from the Visible and the Near Infrared (VNIR) to the Shortwave Infrared (SWIR) at three spatial resolutions (10, 20, 60 m) [26]. S2-A and another Sentinel-2B launched on 7 March 2017 comprise a system of twin-polar orbiting satellites, phased at 180∘ to each other, and the cooperation of the twin satellites provides a temporal resolution of 5 days. Results provided by Reference [27] also show that Sentinel-2 products are of high quality and consistency with the good radiometric calibration.
Satellite images and other complementary references used in this study.
| Data | Acquisition Date | Cloud (%) | Spatial Resolution (m) |
|---|---|---|---|
| Sentinel-2A | 2017/02/11 | < 0.06 | 10, 20 |
| ASTER GDEM v2 | 2011/10/17 | 0 | 30 |
| Google Earth™images | Multi-temporal | Varying | Multi-resolution |
| 1:20,000 Geological map | 2000/12 | 0 | 200 |
| Camera photos | 2016/12 | ~0 | 24,160,000 px |
| Field observation points | 2016/12 | 0 | Varying |
Here, we used S2-A Level-1C image because it currently provides freely available multispectral bands at relatively high spatial resolution comparing to other free data, which can satisfy the fundamental demands of outcrops extraction. Besides, previous study [28] has demonstrated that S2-A data turn out to be adequate for lithological discrimination, which yielded higher classification accuracy than Landsat 8 OLI and ASTER imagery. Therefore, two adjacent scenes were freely downloaded from the Sentinels Scientific Data Hub (https://scihub.copernicus.eu/) in the JPEG 2000 format based on several criteria including acquisition date, cloud (~2%) and vegetation cover. The images were orthorectified in the UTM/WGS84 projection and geometrically corrected.
Comparing to ASTER GDEM v1, ASTER GDEM v2 data are characterized by increased horizontal and vertical accuracy, larger coverage and less artifacts. The image was obtained from Geospatial Data Cloud site, Computer Network Information Center, Chinese Academy of Sciences (http://www.gscloud.cn). Apart from the spectral information of S2-A, topographic features derived from DEM contribute to exclude pseudo extracted outcrops further. In addition, as depicted in Table 1, the complementary references such as the high-resolution Google EarthTM images, camera photos (~2000) and coordinates (~3 accuracy) of field observation points (tuff: 783; granite: 59) were also utilized for accuracy assessment.
In this study, those data-sets were (pre-) processed using the Sentinel Application Platform (SNAP) v6.0 and ENVI v5.3 software packages. We conducted the atmospheric correction to S2-A images using sen2cor plugin v2.5.5 [29] on SNAP, transforming the reflectance from Top-Of-Atmosphere (TOA) Level 1C to Bottom-Of-Atmosphere (BOA) Level 2A. This plugin is developed based on the Atmospheric and Topographic Correction for Satellite Imagery (ATCOR) [30] and it can reduce atmospheric and topographic effects in satellite imagery and extract physical surface properties based on the libRadtran radiative transfer model [31]. After atmospheric correction, only the 10m spatial resolution VNIR bands and the 20m spatial resolution Vegetation red edge and SWIR bands of Sentinel-2 data were considered. All these ten image bands were cubically resampled to 10 m spatial resolution and layer stacked to one file. Then, the two scenes were mosaicked based on the seamless mosaic workflow built in ENVI 5.3; for another, ASTER GDEM v2 image was also cubically resampled from 30m to 10m spatial resolution in order to match with the S2-A image. At last, the sentinel-2 data and ASTER GDEM v2 image were clipped over to the spatial extent of the study area.
3.2 Spectral Features of Rocky Outcrops
As mentioned, tuff strata and granite plutons dominate the area. In order to reveal the spectral features of different outcrops, several representative image-derived observation points were selected (T1-T4 and G1-G4 in Figure 1). Regarding to Figure 3a, reflectance curves of tuff and granite outcrops appear to be similar which exhibit a profound reflection peak at Band 11 (SWIR, central wavelength: 1610nm), while higher reflection values of granite outcrops might be attribute to the enrichment of quartz mineral in high reflectivity during weathering [32]. All the reflection valleys appear at Band 2 (Blue, central wavelength: 490nm).
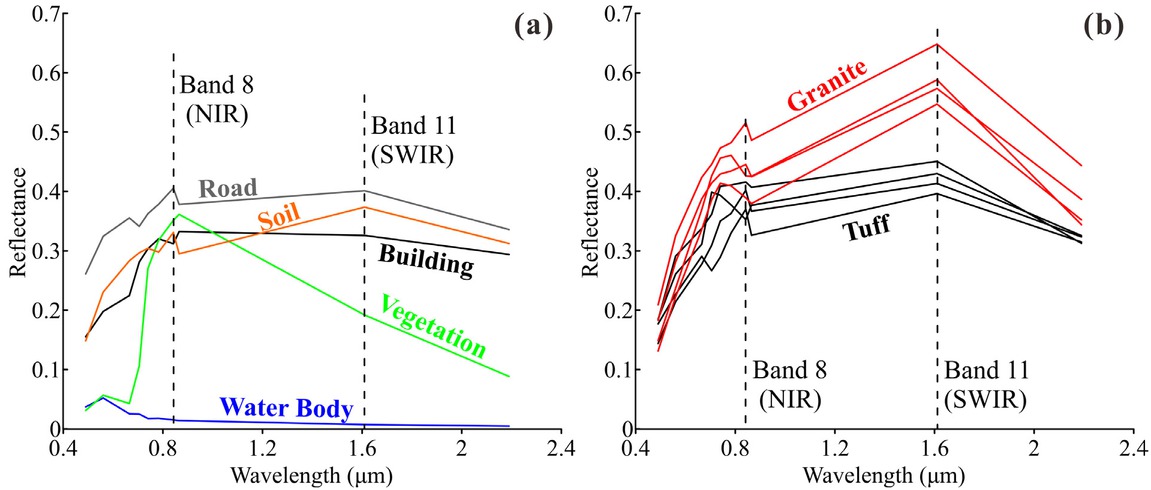
(a) Spectral Z-profile of representative bedrock outcrops (T1-T4 and G1-G4 in Figure 1) derived from the S2-A image mentioned later, using the Z-profile (spectrum) module built in ENVI 5.3. (b) Spectral Z-profile of background features in the S2-A image.
Figure 3b illustrates the spectral characteristics of different objects derived from the study area. It further reveals that the vegetation and water bodies exhibit distinct spectral responses from rocky outcrops. However, there are only subtle differences in the reflectivity level between two lithologies and soil, building as well as road. These similarities will hinder spectrum-based outcrops recognition and introduce a lot of false detected results. Herein, tuff outcrops show the more similar spectral characteristics to the background features than granite outcrops, thus probably resulting in more pseudo detected outcrop patches.
3.3 Matched Filtering
As a powerful and widely used tool in the communication and signal processing domain, MF has been further developed to the application of remote-sensing target detection [33] recently. It is a partial unmixing approach with a normal distribution of the target and background classes, which can maximize the response of the endmembers derived from the image, field measurement or laboratory, and minimize the response of the composite unknown background [34]. Finally, a single-band image with matching degree of each pixel value ranging from 0 to 1 (where 1 represents a perfect match), can be obtained
In this project, we used the image-derived reference spectra, that is, eight typical points (or ROIs - regions of interest) in the image corresponding to the known rocky exposures (T1-T4 and G1-G4 in Figure 1), as the matching templates for the MF-based preliminary extraction of bedrock outcrops. Those carefully selected outcrops are all well-exposed and have a planar expression on the image, or in other words, can be seen remotely. Chemical weathering process is the key reason for the selection of the image-derived reference spectra instead of laboratory measured spectra. Another reason to choose as many as eight outcrop points is that one type of rock may have several different spectra. These preparations are prerequisite for forming a more effective template.
For the purpose, running the MF technique, using reference spectra of the representative points, can enhance the outcrop-related information with bright pixels. However, as expected in the spectral analysis section, soil, building and road pixels in the image were also highlighted in Figure 4a and 4b. Herein, the MF-based image of granite obviously outperforms the results of tuff, i.e., the background in granite enhanced image (Figure 4b) were well suppressed. And despite using the fractal method mentioned later (Figure 7a and 7b), pixel patches related to the rocky outcrops as well as soil, building and road were obtained after MF. In Figure 4c, abundant building, linear rural highway and patches in granite plutons were extracted due to similar spectral features. In Figure 4d, upon the visual interpretation, most resulting patches fell into the granite plutons, some patches were identified into tuff outcrops and some patches also fell into the background features. Hence, in order to obtain accuracy lithological mapping in the sparsely outcropping areas, more processings independent of spectral nature must be considered further.
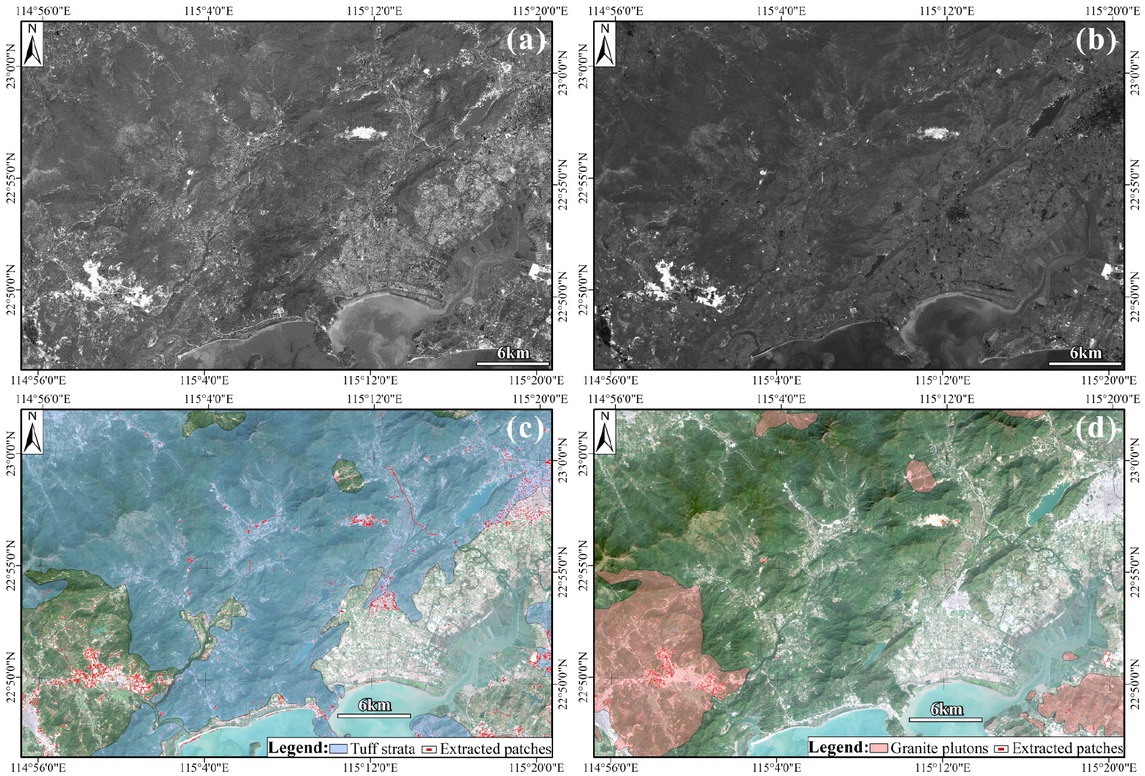
(a) and (b) Matched filter result of tuff and granite outcrops using the image-derived spectra. (c) and (d) Resulting patches of tuff and granite following MF analysis based on the fractal algorithm mentioned later.
3.4 Spectral Indices and Terrain Analysis
Spectral indices are a wide and common approach with orthogonal or mathematical transformations of multispectral data, which can suppress unnecessary effects and produce more sensitive spectral reflectance [35]. Additionally, NDXI (X: vegetation, soil and water) also helps compensate for differences both in illumination within an image due to slope and aspect in the rugged terrains. Here, the spectral indices used contain NDVI, NDSI and MNDWI representing the existence of vegetation, soil and water, respectively. The equation of the three indices are calculated as:
Where ρGreen, ρRed, ρNIR and ρMIR are the reflectance of S2-A data bands 3, 4, 8 and 11, respectively. Note: NDVI is the world’s well-known normalized difference vegetation index; MNDWI is the modified NDWI proposed by Xu [36] to reveal subtler features of water body; and NDSI is the normalized difference soil index [37].
The false color composite image of NDXI is shown in Figure 5a. In theory, NDXI values range from −1.0 to +1.0. Higher values of NDXI they are, more likely the area is to be covered by the corresponding enhanced objects. In this regard, geological exposures with removal of vegetation and soil and non-water coverage, resulted in decreased values of NDXI. Based on this principle, the objective of these indices was to mask or filter out the pseudo detected “outcrops” caused by the complex mixture of ground objects during MF processing. It is worth noting that there is no order of priority between these two steps, and if performing the spectral indices firstly, the entire study area will be restricted to a limited interpreted region mainly focusing on exposed rocks for the subsequent outcrop detection.
In this case, the relevant cutting thresholds for the difference spectral indices were over 0.322 for NDVI, over 0.302 for NDSI, and over 0.202 for MNDWI, and they were determined according to both empirical values and the internal characteristics of the study area. Next, the extracted three vector shapefiles were combined via spatial union analysis into a mask (Figure 5b) to eliminate the pseudo detected “outcrops”.
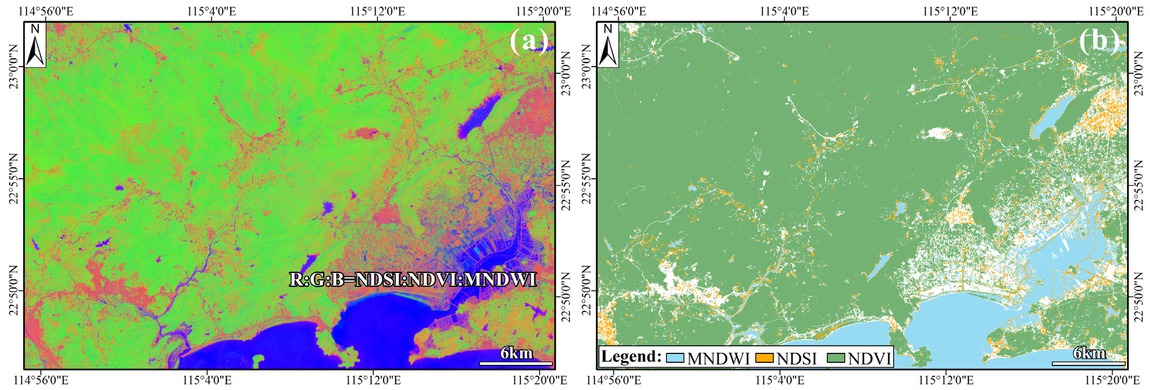
(a) False color composite image made with the spectral index products. (b) Mask consisting of NDXI vector shapefiles including NDVI (green), MNDWI (blue) and NDSI (brown).
Except the spectral information, terrain features are proved to be another important indicator of geology [38, 39] such as the identification of outcrop occurrence [14, 16]. On the one hand, most common geological exposures in the field tend to occur in the rugged or steep terrain. In this region, the occurrence of outcrops is also the case. Obviously, the spectral reflectance patterns of bedrock will help us to identify the outcrops with similar spectral characteristics and exclude the different ones. On the other hand, crushed stones could be removed away from bedrock exposures to other flat areas by transporting action of running water, weathering, human excavations, etc. Inasmuch, the terrain or micro-geomorphology also has the potential to distinguish in situ from ex situ outcrops pertinent to spectral similarities.
Furthermore, there are subtle difference in topographic features between the tuff strata and granite plutons, that is, granite plutons are characterized in relatively gentle landforms comparing with tuff strata, because the latter is prone to suffer from weathering, particularly spheroidal weathering [40]. Notably, here only the overall topographic features of tuff and granite were considered, and inevitably, some granite outcrops can occur in steep region and some tuff outcrops are found in flat area. In order to remove most of false detected patches, this analysis will come at the price of the loss of true patches.
Summarily, slope attribute was selected as the interpreted sign to limit the outcropping areas of tuff strata and granite plutons. Slope product extracted from ASTER GDEM (30m) was incorporated for improving the outcrops extraction results. In Figure 6, the slope layer (T1−2-T1−3, granite plutons) in red color with 50% transparency where granite outcrops are most likely to occur, was overlaid on the hillshade map consistently. Detected granite outcrop patches that fall into the red layer were further remained. Then, according to the different topographic features, threshold of (T1-max) was utilized to limit the potential outcropping areas of tuff outcrops. The following results or accuracy also prove the feasibility of terrain analysis. Note that: the thresholds were determined by fractal algorithm mentioned later (Figure 7c).
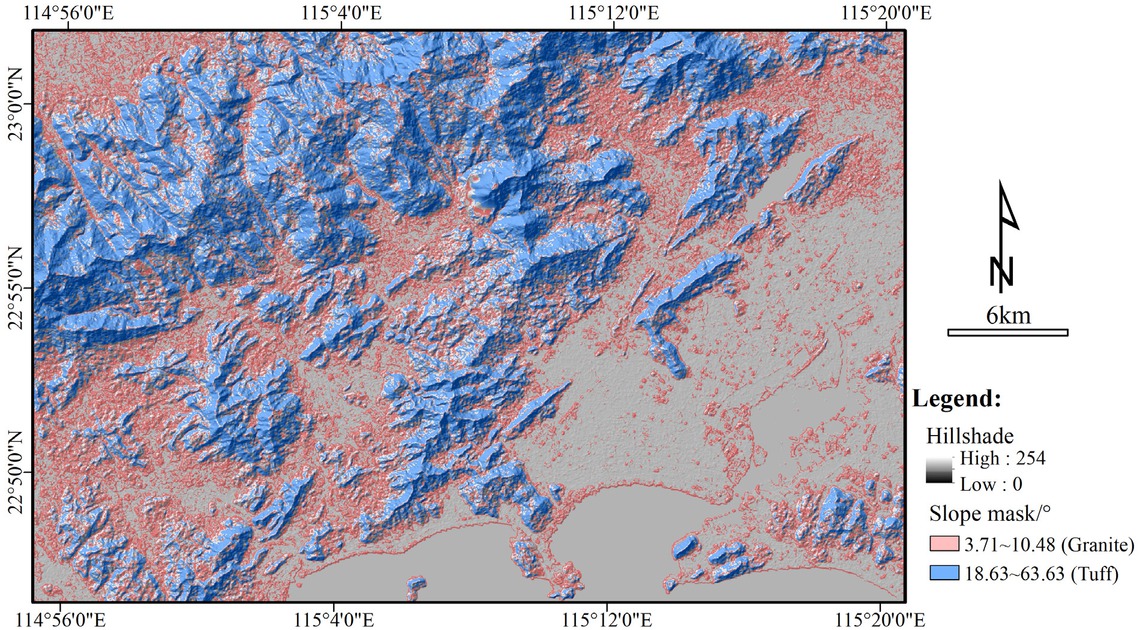
The matching slope layers (red: granite; blue: tuff) overlying on the hillshade map, derived from ASTER GDEM.
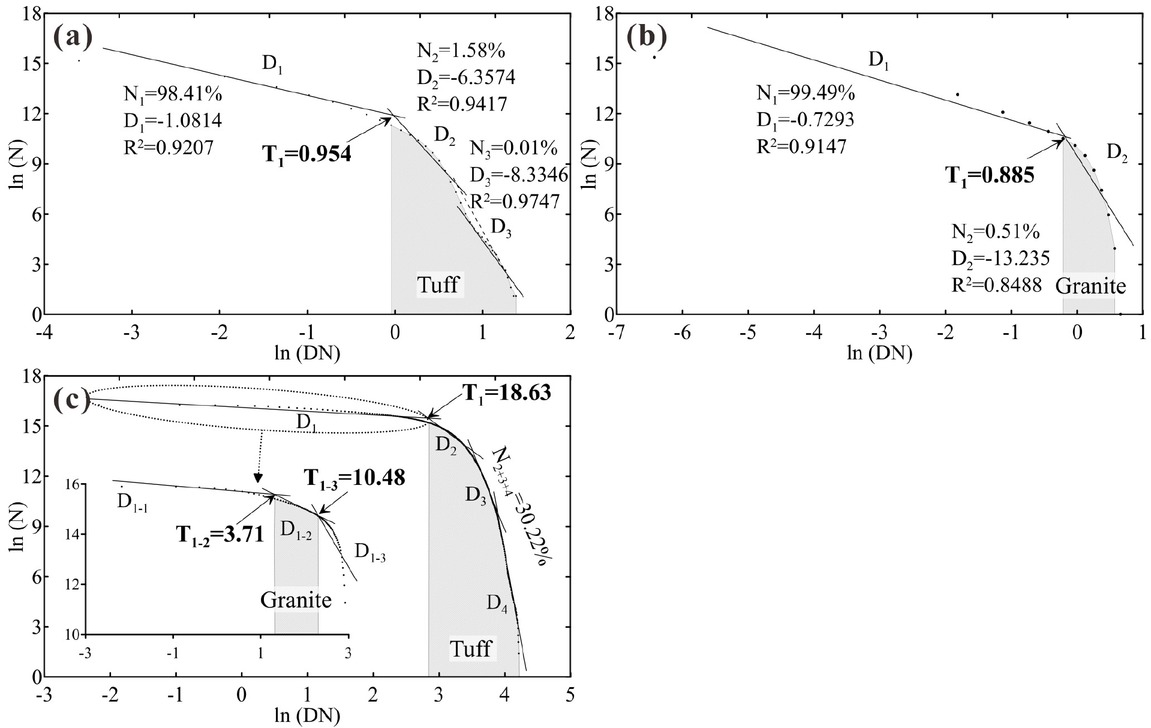
Fractal ln (N) versus ln (DN) schema of MF: (a) tuff; (b) granite, and (c) Terrain analysis. Note that: the wireframe represents the range of selected threshold.
3.5 DN-A Fractal Scheme
Setting appropriate thresholds is essential to yield accurate detection results or reduce the interpretation target area in the enhanced image. Here, the fractal C-A (concentration-area) algorithm, which is one of the most advanced unsupervised classification methods [41], was introduced to determine the cutting thresholds of MF and terrain analysis, respectively. With respect to the fractal method, Shen [42] suggested that it can be used to constitute the power-law relationship magnitude and frequency on a log–log paper, and a number of straight-line segments (scale-less intervals), which usually correspond to the real-world features (classes) on the ground, can also be manually or automatically obtained to yield a group of cut-off values for image segmentation or target detection. Inasmuch, for pixel values and pixel value frequency distribution as well as spatial and geometrical properties of image, the DN-A (equivalent to C-A) method [43] can be expressed as follows:
where A (DN) denotes the area occupied by pixels with DN values equal to and greater than a certain threshold (s), and the exponent D is fractal dimension.
Figure 7 shows the fractal schema for the MF and terrain analysis in this case. Note that: 1) The scaleless line segments reflecting the features of interest (real pixel patches) are determined by visual interpretation and marked by black wireframes; 2) R2 indicates the goodness of fit, and R2 of each linear segment is kept ≥ 0.9 (except the segment D2 of Figure 7b); 3) N1, N2... are the proportion that pixels falling within the segment D1, D2..., respectively, take up of the total pixels involved in fractal calculation; 4) Tn−1 (n=2, 3, 4...) is the threshold value between two adjacent segments; 5) The parameters for barren D1 and D2 are also displayed in this diagram; 6) The “oscillation” of D3 segments might be attributed to the mixture pixels or random noise (Figure 7a); 7) The computer programme in MATLAB language is available from Zhao et al. [44] on request.
According to these criteria, T1-max was selected as the MF thresholds of tuff and granite. With respect to terrain analysis, thresholds of T1−2-T1−3 and T1-max were used to limit the outcropping areas of granite and tuff, respectively.
3.6 Accuracy Assessment
In generally, the Kappa coefficient is often adopted as a standard measure of classification accuracy [45], which measures the agreement between a classification image and its ground truth. However, actually there is no standard or reference basemap to validate the accuracy of the outcrops detection results, so the Kappa coefficient was inapplicable for accuracy assessment in this study. In addition, it should be admitted that in these cases, it is impossible to validate the whole detected results using a single criterion, just like the way using multiple methods to extract geological outcrops. Thus, the semi-automatic multilevel validation method is expressed as follows:

(a) Obtained tuff patches on the S2-A true color image; the number annotations (1~4) and transparent wireframes in the image are consistent with the subplots number of 1~4. Frequency (b) and cumulative frequency (c) distribution histogram of the patch areas. I-III are the verification photos and Google earth image of tuff.
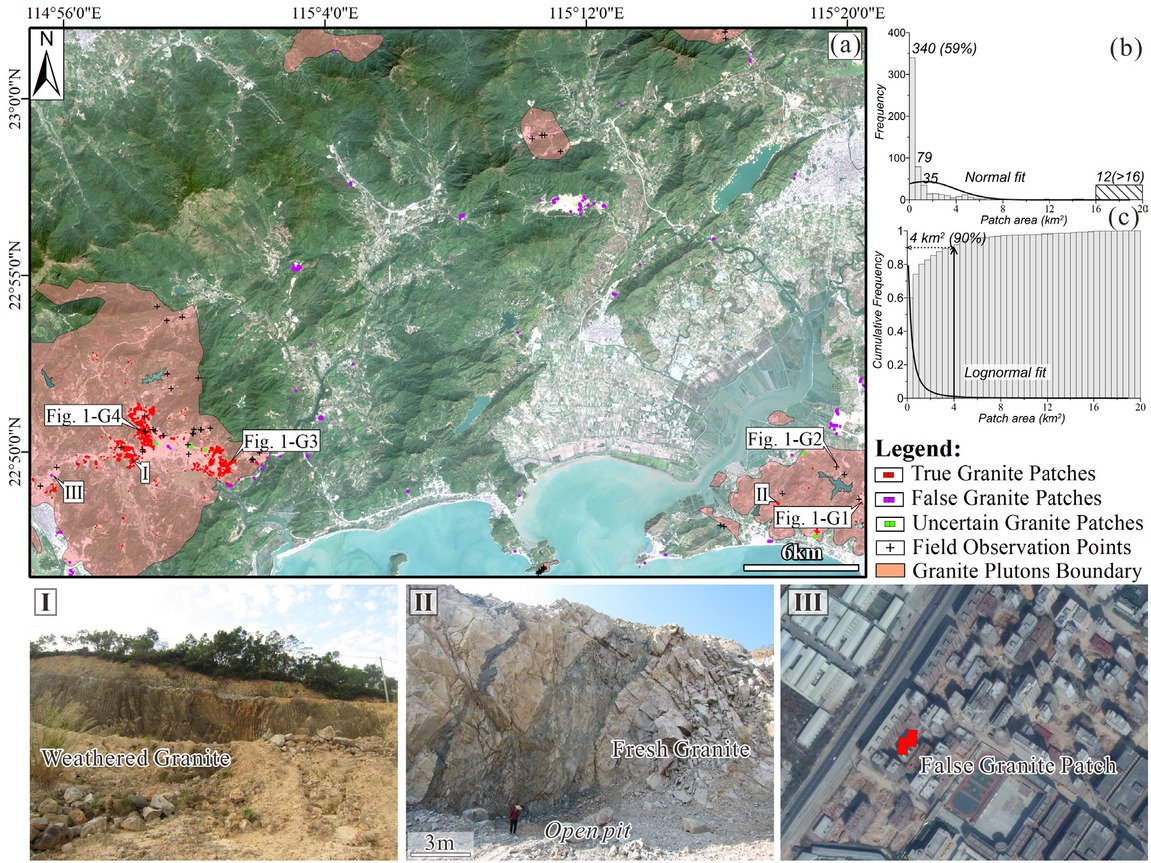
(a) Obtained granite patches on the S2-A true color image. Frequency (b) and cumulative frequency (c) distribution histogram of the patch areas from the minimum to an area of 20 km2 with a bin size of 0.5 km2. I-III are the verification photos and Google earth image of granite.
A detected pixel patch that is near to a field validation point (< 0.1km) may be real (Figure 8, 9), especially when it appears in the same gully/valley. The procedure was to create a 100m buffer for each of the validation points (842 point-vectors) firstly, and overlay the vector shapefiles of the validation points and the obtained pixel patches;
A detected patch corresponding to a non-vegetated “outcrop” in the Google Earth™image may correspond to real-world outcrops;
Other visual cues. For example, rocky outcrops exposed by water erosion or human engineering.
Here, we assumed that any detected pixel patch satisfying case (2), or simultaneously satisfying case (1), (3) and (4) can be classified as “real outcrop”, and the interpretation ratio is simply “% of the correctly classified patches over the total number of obtained patches”.
4 Results
4.1 Tuff Outcrops
After the previous series of operations, the resulting patches of tuff outcrops are displayed in Figure 8, therein lies 3 insert maps zoomed in detailedly. A total of 916 patches (3139 pixels) were extracted to represent the real-world rocky exposures in this image. At first glance, most pixel patches fell within the known stratigraphic terrane (with a 100m buffer). To be specific, the tuff patches are generally small and tend to occur in cluster comparing to granite outcrops (Figure 8-1~3). Those pseudo patches in purple color were recognized falling onto the granite plutons and buildings. Those uncertain patches in green color mainly occurred in the bare land, which cannot be well constrained by the four validation criteria. Figure 8b and 8c illustrate the frequency distribution and cumulative frequency of the tuff patch areas from the minimum to an area of 4 km2 with a bin size of 0.1 km2, respectively. The peak value appears in the range 0–0.1 km2 containing ~51% of patches, which is equal to the area of a pixel in this S2-A image. 69% of patches are < 0.2 km2 and approximately 90% of patches are < 0.6 km2.
Subsequently, based on verification criteria, Table 2 shows the two correct interpretation ratios (interpretation accuracy) of preliminary extraction (MF), elimination of false patches (NDXI + Terrain) of tuff and granite, respectively. Firstly, the accuracy after MF was 41~43.1% (4589~4827/11200) and it is the foundation of following NDXI + terrain analysis. The truth is that despite without diagnostic spectral features, it is also characterized in topographical and spatial aspect on the DEM image. Secondly, the accuracy after NDXI and terrain reached 82.4~83.2% (755~762/916), which had improved by ~40%, and correspondingly, 91.8% of the raw pixel patches in Figure 8 were removed in this process. The improvement of accuracy also demonstrates that elimination of the false patches can be sometimes more important than extraction of the real ones [16].
Interpretation accuracy of tuff and granite outcrops.
| Lithology | Format | Interpretation Accuracy | |
|---|---|---|---|
| MF (%) | NDXI + Terrain (%) | ||
| Tuff | Percent | 41~43.11 | 82.4~83.2 |
| Ratio | 4589~4827/11200 | 755~762/916 | |
| Granite | Percent | 62.6~67.9 | 91.3~92.3 |
| Ratio | 431~467/688 | 525~531/575 | |
1 As there are some indiscernible patches, the accuracy values are given as a range.
4.2 Granite Outcrops
In Figure 9, a total of 575 patches (12122 pixels) were extracted from the S2-A image. Comparatively, most tuff patches were consisted of one or two pixels (~70%), however in addition to showing the same small-scale feature with tuff patches, the granite patches also contained few large pixel patches with over 160 or even 300 pixels (16-30 km2). As presented in Figure 9b and c, the peak value appears in the range 0–0.5 km2 containing 60% of patches. 74.1% of patches are < 1 km2 and approximately 90% of patches are < 3.5 km2. Those large-scale patches, for example 12 patches over 16 km2, mainly resulted from human excavations to ore occurring in granite bodies, such as quarrying and open-pits.
As presented in Table 2, the accuracy after MF was 62.6~67.9% (431~467/688), and after NDXI and terrain analysis, the accuracy reached 91.3~92.3% (525~531/575) which had improved by ~15%. Meanwhile, 16.42% of the raw pixel patches in Figure 9 were removed in this process. Notably, the interpretation accuracy of granite is higher than the tuff from MF to NDXI + terrain scenario. Among the reasons for the higher interpretation accuracy of granite outcrops was that they show more diagnostic spectral features comparing to tuff outcrops in Figure 2.
5 Discussion
5.1 Spatial and Spectral Resolution
The goal of this project was to extract the pixel patches of geological outcrops from the S2-A data. In the heavily vegetated area, the originally bedrocks are generally covered by vegetation or loess, leaving sparse and limited outcropping areas. Meanwhile, outcrops of various lithologies may have completely different spectral patterns due to different rock compositions (note that the spectral patterns of tuff and granite appear to be similar). Consequent physical or chemical weathering will further alter the structure and chemical component of outcrops, which exacerbates the complexity of lithological mapping. On the contrary, Human excavations to ore such as quarrying and open-pits are among the reasons for making it have greater chances of being detected with remote sensing. But it can be seen from the results that artificial constructions could not always produce large-scale outcrops, i.e. in both sides of the highway, and the corresponding numbers are notably beyond our expectation. Hence, although natural outcrops are a scarce resource in the sparsely outcropping areas in which exactly hinder the development of geological mapping, ecological investigation and so on, abundant human-made outcrops may contribute to reveal more geological information as well as the interactions of humans and nature on the Earth’s surface.
Inasmuch, free Sentinel-2A image with relatively high resolution was used to balance against the accuracy required in this research. However, this data’s spatial or spectral resolution still limit its application in such areas resulting in the cases of few false pixel patches and many undetected outcrops. Besides, despite with a high accuracy of over 90% using multiple methods, there is still room for improvement. Upon visual inspection of the entire pixel patches, the remaining false patches were usually caused by footpath (Figure 8a) and cement-related grave with the similar spectral pattern and topographic characteristics to real outcrops. There are also many outcrops remaining to be undetected. So the availability of finer spatial or spectral resolution sensors such as Worldview-3 [46, 47] may offer a possible partial resolution to the extraction of geological outcrops in such a challenging terrain.
5.2 More Interpreted Signs
Spectral patterns and topographic features serve as the two major RS-oriented interpretation signs in the text, playing a vital role in limiting and locating the outcropping areas. Here, some non-outcrop pixel patches were identified because of similar spectral and topographic characteristics to those real outcrops. So, more interpretation signs are demanded to perform more accurate bedrock outcrops interpretation. As a future development of this work, the proposed approach will be integrated with more interpreted signs including vegetation, thermal inertial property and so on:
Vegetation has generally been a noise or a hindrance of masking geological information, and most of the world’s mineral production are obtained from low to moderately vegetated land surface instead of heavily vegetated areas. Whereas in geobotanical remote sensing [48], the spectral behavior of vegetation that can be responsive to differences in soil-lithology characteristics, is thought to have potential in deciphering geological information. For instance, Wang et al. [16] suggested that the chestnut trees in Hebei province of China can be regarded as an empirical discriminant sign indicating the presence of gneiss strata; Grebby et al. [49] have explicitly tested the impact of vegetation on remote lithological mapping capability and highlighted that useful lithological information can be obtained even with the limited spectral resolution and ubiquitous vegetation cover.
Thermal inertial can act as a universal interpreted sign for distinguishing rocks from other ground objects, because it is an inherent physical property of the rocks [6]. Specifically, rocks (higher thermal inertia), particularly denser and non-porous, tend to retain the heat obtained during the sunlight exposure more effectively than unconsolidated regolith such as soils (lower thermal inertia). In this regard, thermal inertial property may offer more important reference values for outcrops extraction than vegetation.
In summary, the formation of RS-oriented geological interpreted signs is the process of transforming subjective experiences from geologists to executable technical operations in computer. In order to perform accurate RS interpretation, more interpreted signs should be introduced, despite coming at the price of the decreasing number of detected pixel patches, but the proportion of true outcrops in the whole detected patches will increase gradually.
5.3 Accuracy Assessment Criteria
Since the complexity of bedrock outcrops mentioned above, it is not possible to use either single interpreted sign or single method to provide a satisfactory interpretation result. Similarly, a single criterion is also insufficient to validate the whole detected pixel patches in the study area. For this purpose, the authors mainly started from the three aspects containing lithostratigraphic regions, field observation points and finer spatial resolution images, utilizing three corresponding data including geological maps, field surveys and finer resolution RS images to assist verification, respectively. As a direct verification standard, field observation points obviously outperform the other two indirect standards because of their higher survey precision, while the latter are also necessary in areas without access to field validation, but should be used with more consideration.
5.4 Pros and Cons of Weathering Process and the Identification of Protoliths
In coastal zone, chemical weathering is a common process for all rocks, which can change the rock component and produce regolith on the surface. The spectral features of weathered outcrops changed and became unpredictable without field measurement. However, the same kind of lithology produces similar weathering products, while different lithologies shows different weathering characteristics, i.e., differential weathering. The process can form different topographic features of tuff and granite for terrain analysis. Therefore, differential weathering is regarded as a necessary condition for coastal lithological mapping. In addition, when the weathered outcrops were extracted, their protoliths must be defined by the corresponding fresh exposures. In this study, several prospecting trenches were excavated to reveal the protoliths of weathered outcrops. Trenches distributed in the gentle landforms show that the extracted patches characterize a kind of weathering products from fresh granites (Figure 9-II), and those distributed in the steep landforms demonstrate the extracted patches describe weathering products derived from fresh tuffs (Figure 8-I).
6 Conclusions
Using the S2-A and ASTER GDEM v2 image as data sources, this study tested the feasibility and advantages of the combined use of MF, NDXI (NDVI, NDSI and MNDWI), topographical analysis and multifractal algorithm in lithological mapping within a weathered and vegetated terrains of Guangdong province, southern China. Findings of this work are threefold:
The similarity of weathering products from the same kind of lithological unit are essential for the use of spectral mapping, and differential weathering is a necessary condition to distinguish tuff from granite outcrops.
The combination of spectral patterns and topographic features play a crucial role in locating and constraining the outcropping areas. Without considering one of the two elements, the final detected results would be insufficient to represent the scale and distribution of real-world bedrock exposures.
Regarding to accuracy assessment, generally there is no standard or reference basemap to validate the accuracy of outcrops detection results. Inasmuch, multiple verification criteria rather than a single criterion, should be used semi-automatically based on various support materials, in order to provide the more accurately interpreted ratios. And the ultimate accuracy reached 82.4~83.2% of tuff and 91.3~92.3% of granite.
This study may have contributed a useful case study for remote-sensing lithological mapping in weathered and vegetated coastal zone, and might have a great possibility to be extrapolated for similar areas.
Acknowledgement
This study was supported by the Scientific Innovation Practice Project of Postgraduates of Chang’an University (grant number 300103002087). The authors would like to acknowledge Mengxi Wang and Jinbao Li for their kind help in field investigation.
References
[1] Howell J.V. Glossary of Geology and Related Sciences: A Cooperative Project, 2 ed: American Geological Institute: American, 1960; pp. 207-208.Suche in Google Scholar
[2] Crosta A.P., Sabine C., Taranik J.V., Hydrothermal alteration mapping at Bodie, California, using AVIRIS hyperspectral data. Remote Sens. Environ. 1998. 65 (3), 309-319, doi: https://doi.org/10.1016/S0034-4257(98)00040-6.10.1016/S0034-4257(98)00040-6Suche in Google Scholar
[3] Michael D.R., Lindenmayer D.B., Cunningham R.B., Managing rock outcrops to improve biodiversity conservation in Australian agricultural landscapes. Ecol Manag Restor. 2010. 11 (1), 43-50, doi: https://doi.org/10.1111/j.1442-8903.2010.00512.x.10.1111/j.1442-8903.2010.00512.xSuche in Google Scholar
[4] Wang S.J., Liu Q.M., Zhang D.F., Karst rocky desertification in southwestern China: geomorphology, land use, impact and rehabilitation. Land Degrad Dev. 2004. 15 (2), 115-121, http://dx.doi.org/10.1002/ldr.59210.1002/ldr.592Suche in Google Scholar
[5] NZ (New Zealand) Auckland Island Rock Outcrop Points (Topo, 1:50k). 2014, https://data.linz.govt.nz/layer/50963-nzauckland-island-rock-outcrop-points-topo-150k/Suche in Google Scholar
[6] Hewson R., Robson D., Carlton A., Gilmore P., Geological application of ASTER remote sensingwithin sparsely outcropping terrain, Central New South Wales, Australia. Cogent Geo. 2017. 3 (1), 1-22, doi: 10.1080/23312041.2017.1319259.10.1080/23312041.2017.1319259Suche in Google Scholar
[7] Victor M., Charles N., Jacqueline T.N., Daniel N., Application of remote sensing for the mapping of geological structures in rainforest area: a case study at the Matomb-Makak area, Center-South Cameroon. J. Geosci. 2014. 2 (5), 196-207, doi: 10.12691/jgg-2-5-3.10.12691/jgg-2-5-3Suche in Google Scholar
[8] Carranza E., Hale M., Mineral imaging with Landsat Thematic Mapper data for hydrothermal alteration mapping in heavily vegetated terrane. Int. J. Remote Sens. 2002. 23 (22), 4827-4852, https://doi.org/10.1080/0143116011011501410.1080/01431160110115014Suche in Google Scholar
[9] Ranjbar H., Honarmand M., Moezifar Z., Application of the Crosta technique for porphyry copper alteration mapping, using ETM+ data in the southern part of the Iranian volcanic sedimentary belt. J. Asian Earth Sci. 2004. 24 (2), 237-243, https://doi.org/10.1016/j.jseaes.2003.11.00110.1016/j.jseaes.2003.11.001Suche in Google Scholar
[10] Sabins F.F., Remote sensing for mineral exploration. Ore Geol. Rev. 1999. 14 (3-4), 157-183, https://doi.org/10.1016/S0169-1368(99)00007-410.1016/S0169-1368(99)00007-4Suche in Google Scholar
[11] Thomson J.W., Cooper A., The SCAR Antarctic digital topographic database. Antarct Sci. 1993. 5 (3), 239-244.10.1017/S095410209300032XSuche in Google Scholar
[12] Burton-Johnson A., Black M., Fretwell P., Kaluza-Gilbert J., An automated methodology for differentiating rock from snow, clouds and sea in Antarctica from Landsat 8 imagery: a new rock outcrop map and area estimation for the entire Antarctic continent. Cryosphere. 2016. 1016651677https://doi.org/10.5194/tc-10-1665-201610.5194/tc-10-1665-2016Suche in Google Scholar
[13] Pei J., Wang L., Huang N., Geng J., Cao J.H., Niu Z., Analysis of Landsat-8 OLI Imagery for Estimating Exposed Bedrock Fractions in Typical Karst Regions of Southwest China Using a Karst Bare-Rock Index. Remote Sens. 2018. 10 (9), 1-19, https://doi.org/10.3390/rs1009132110.3390/rs10091321Suche in Google Scholar
[14] Han L., Zhao B., Wu J.J., Zhang S.Y., Pilz J., Yang F., An integrated approach for extraction of lithology information using the SPOT 6 imagery in a heavily Quaternary-covered region—North Baoji District of China. Geol J. 2018. 53 (S1), 352-363, doi: 10.1002/gj.3061.10.1002/gj.3061Suche in Google Scholar
[15] Grebby S., Field E., Tansey K., Evaluating the Use of an Object-Based Approach to Lithological Mapping in Vegetated Terrain. Remote Sens. 2016. 8 (10), 1-20, doi: 10.3390/rs8100843.10.3390/rs8100843Suche in Google Scholar
[16] Wang R., Lin J.Y., Zhao B., Li L., Xiao Z.X., Pilz J., Integrated Approach for Lithological Classification Using ASTER Imagery in a Shallowly Covered Region—The Eastern Yanshan Mountain of China. IEEE J. Sel. Top. Appl. Earth Obs. Remote Sens. 2018. 11 (12), 4791-4807, doi: 10.1109/JSTARS.2018.2879493.10.1109/JSTARS.2018.2879493Suche in Google Scholar
[17] Mahmood, T.H., Hasan K., Akhter S.H., Lithologic mapping of a forested montane terrain from Landsat 5 TM image. Geocarto Int., 2019. 34(7), 750-768, https://doi.org/10.1080/10106049.2018.143468810.1080/10106049.2018.1434688Suche in Google Scholar
[18] Zhao B., Wu J.J., Yang F., Pilz J., Zhang D.H., A novel approach for extraction of Gaoshanhe-Group outcrops using Landsat Operational Land Imager (OLI) data in the heavily loess-covered Baoji District, Western China. Ore Geol. Rev. 2019, 108880100https://doi.org/10.1016/j.oregeorev.2018.01.03410.1016/j.oregeorev.2018.01.034Suche in Google Scholar
[19] Zeng Z.X., Huang W.F. Physical geography of Guangdong: Guangdong People’s Publishing House: Guangdong, China, 2001; pp. 136-178.Suche in Google Scholar
[20] Qiu Y.X., Qiu J.S., Li J.C., Zhong H.P., Deformational and metamorphic features of Lianhuashan fault zone during Meso-Cenozoic time and mechanism of their formation. Journal of Geomechanics. 1991. 1991 (0), 1-7. (in Chinese with English abstract)Suche in Google Scholar
[21] MINERAL RESOURCES OF GUANGDONG PROVINCE B.O.G.A. Regional geology of Guangdong Province Geological Memoirs: Geological Publishing House: Beijing, 1988.Suche in Google Scholar
[22] Wang L.M., Bu A., Wang H., Li S.S., Chen S.Q., Guo L.R., Exploration of the entire southern exploration section of the Lianhuashan fault zone in Guangdong: New prospects for prospecting. Miner Depos. 2014. 33 (S1), 965-966. (in Chinese with English abstract)Suche in Google Scholar
[23] Bureau of Geology and Mineral Resources of Guangdong Province, Geological Map of Huizhou (1:200 000), F-50-(07). 2000.Suche in Google Scholar
[24] Bureau of Geology and Mineral Resources of Guangdong Province, Geological Map of Haifeng (1:200 000), F-50-(08). 2000.Suche in Google Scholar
[25] van der Meer F.D., van der Werff H.M.A., van Ruitenbeek F.J.A., Potential of ESA’s Sentinel-2 for geological applications. Remote Sens. Environ. 2014. 148124133https://doi.org/10.1016/j.rse.2014.03.02210.1016/j.rse.2014.03.022Suche in Google Scholar
[26] Drusch M., Del Bello U., Carlier S., Colin O., Fernandez V., Gascon F., Hoersch B., Isola C., Laberinti P., Martimort P., Meygret A., Spoto F., Sy O., Marchese F., Bargellini P., Sentinel-2: ESA’s Optical High-Resolution Mission for GMES Operational Services. Remote Sens. Environ. 2012. 1202536https://doi.org/10.1016/j.rse.2011.11.02610.1016/j.rse.2011.11.026Suche in Google Scholar
[27] Lamquin, N., Woolliams, E., Bruniquel, V., Gascon, F., Gorroño, J., Govaerts, Y., Leroy, V., Lonjou, V., Alhammoud, B., Barsi, J. A., Czapla-Myers, J. S., McCorkel, J., Helder, D., Lafrance, B., Clerc, S., and Holben, B. N., An inter-comparison exercise of Sentinel-2 radiometric validations assessed by independent expert groups. Remote Sens. Environ., 2019. 233113https://doi.org/10.1016/j.rse.2019.11136910.1016/j.rse.2019.111369Suche in Google Scholar
[28] Ge W.Y., Cheng Q.M., Tang Y.W., Jing L.H., Gao C.S., Lithological Classification Using Sentinel-2A Data in the Shibanjing Ophiolite Complex in Inner Mongolia, China. Remote Sens. 2018. 10 (4), 1-22, doi: 10.3390/rs10040638.10.3390/rs10040638Suche in Google Scholar
[29] Muller-Wilm U., Louis J., Richter R., Gascon F., Niezette M. Sentinel-2 level 2A prototype processor: Architecture, algorithms and first results. in Proceedings of the ESA Living Planet Symposium, Edinburgh, UK. 2013.Suche in Google Scholar
[30] Richter R., Schlaepfer D., Atmospheric/topographic correction for satellite imagery: ATCOR-2/3 User Guide Vers. 8.0. 2. 2011.Suche in Google Scholar
[31] Mayer B., Kylling A., Technical note: The libRadtran software package for radiative transfer calculations - description and examples of use. Atmos. Chem. Phys. 2005. 5 (7), 1855-1877, doi: 10.5194/acp-5-1855-2005.10.5194/acp-5-1855-2005Suche in Google Scholar
[32] Ollier C.D., Causes of spheroidal weathering. Earth-Sci Rev. 1971. 7 (3), 127-141, https://doi.org/10.1016/0012-8252(71)90005-510.1016/0012-8252(71)90005-5Suche in Google Scholar
[33] Boardman J.W., Kruse F.A., Analysis of Imaging Spectrometer Data Using N-Dimensional Geometry and a Mixture-Tuned Matched Filtering Approach. IEEE Trans. Geosci. Remote Sens. 2011. 49 (11), 4138-4152, doi: 10.1109/TGRS.2011.2161585.10.1109/TGRS.2011.2161585Suche in Google Scholar
[34] Harsanyi J.C., Chang C., Hyperspectral image classification and dimensionality reduction: an orthogonal subspace projection approach. IEEE Trans. Geosci. Remote Sens. 1994. 32 (4), 779-785, doi: 10.1109/36.298007.10.1109/36.298007Suche in Google Scholar
[35] Kauth R.J., Thomas G.S. The tasselled cap - a graphic description of the spectral-temporal development of agricultural crops as seen by Landsat. in Proceedings of the Symposium on Machine Processing of Remotely Sensed Data. 1976. West Lafayette, Indiana, Purdue University.Suche in Google Scholar
[36] Xu H.Q., Modification of normalised difference water index (NDWI) to enhance open water features in remotely sensed imagery. Int. J. Remote Sens. 2006. 27 (14), 3025-3033, doi: 10.1080/01431160600589179.10.1080/01431160600589179Suche in Google Scholar
[37] Dehni A., Lounis M., Remote Sensing Techniques for Salt Affected SoilMapping: Application to the Oran Region of Algeria. Procedia Eng. 2012. 33188198https://doi.org/10.1016/j.proeng.2012.01.119310.1016/j.proeng.2012.01.1193Suche in Google Scholar
[38] Jakob S., Gloaguen R., Laukamp C., Remote Sensing-Based Exploration of Structurally-Related Mineralizations around Mount Isa, Queensland, Australia. Remote Sens. 2016. 8 (5), 1-18, doi: 10.3390/rs8050358.10.3390/rs8050358Suche in Google Scholar
[39] Zimmermann R., Brandmeier M., Andreani L., Mhopjeni K., Gloaguen R., Remote Sensing Exploration of Nb-Ta-LREE-Enriched Carbonatite (Epembe/Namibia). Remote Sens. 2016. 8 (8), 1-20, doi: 10.3390/rs8080620.10.3390/rs8080620Suche in Google Scholar
[40] Hirata Y., Chigira M., Chen Y.Q., Spheroidal weathering of granite porphyry with well-developed columnar joints by oxidation, iron precipitation, and rindlet exfoliation. Eartf Surf Proc Land. 2017. 42 (4), 657-669, doi: 10.1002/esp.4008.10.1002/esp.4008Suche in Google Scholar
[41] Cheng Q.M., Li Q.M., A fractal concentration–area method for assigning a color palette for image representation. Comput. Geosci. 2002. 28 (4), 567-575, https://doi.org/10.1016/S0098-3004(01)00060-710.1016/S0098-3004(01)00060-7Suche in Google Scholar
[42] Shen G.Q., Fractal dimension and fractal growth of urbanized areas. Int. J. Geog. Inf. Sci. 2002. 16 (5), 419-437, doi: 10.1080/13658810210137013.10.1080/13658810210137013Suche in Google Scholar
[43] Shahriari H., Ranjbar H., Honarmand M., Image Segmentation for Hydrothermal Alteration Mapping Using PCA and Concentration–Area Fractal Model. Nat. Resour. Res. 2013. 22 (3), 191-206, doi: 10.1007/s11053-013-9211-y.10.1007/s11053-013-9211-ySuche in Google Scholar
[44] Zhao B., Yu L., Qiu J.T., Shi C.L., Zhang D.H., Internal structural analysis of geochemical anomaly based on the content arrangement method: A case study of copper stream sediment survey in northwestern Zhejiang Province. Geophysical & Geochemical Exploration. 2015. 39 (2), 297-305. (in Chinese with English abstract)Suche in Google Scholar
[45] Rwanga S.S., Ndambuki J.M., Accuracy Assessment of Land Use/Land Cover Classification Using Remote Sensing and GIS. Int. J. Geo. 2017. 08, 611-612, doi: 10.4236/ijg.2017.84033.10.4236/ijg.2017.84033Suche in Google Scholar
[46] Kruse F.A., Baugh W.M., Perry S.L., Validation of DigitalGlobe WorldView-3 Earth imaging satellite shortwave infrared bands for mineral mapping. J. Appl. Rem. Sens. 2015. 9 (1), 1-17, https://doi.org/10.1117/1.JRS.9.09604410.1117/1.JRS.9.096044Suche in Google Scholar
[47] Ye B., Tian S.F., Ge J., Sun Y.Q., Assessment of WorldView-3 Data for Lithological Mapping. Remote Sens. 2017. 9 (11), 1-19, doi: 10.3390/rs9111132.10.3390/rs9111132Suche in Google Scholar
[48] Gupta R.P. Remote sensing geology, 2 ed: Springer-Verlag Berlin Heidelberg: Berlin, Germany, 2003; pp. 510-518.10.1007/978-3-662-05283-9Suche in Google Scholar
[49] Grebby S., Cunningham D., Tansey K., Naden J., The Impact of Vegetation on Lithological Mapping Using Airborne Multispectral Data: A Case Study for the North Troodos Region, Cyprus. Remote Sens. 2014. 6 (11), 10860-10887, doi: 10.3390/rs61110860.10.3390/rs61110860Suche in Google Scholar
© 2019 J. Lin et al., published by De Gruyter
This work is licensed under the Creative Commons Attribution 4.0 Public License.
Artikel in diesem Heft
- Regular Articles
- 2D Seismic Interpretation of the Meyal Area, Northern Potwar Deform Zone, Potwar Basin, Pakistan
- A new method of lithologic identification and distribution characteristics of fine - grained sediments: A case study in southwest of Ordos Basin, China
- Modified Gompertz sigmoidal model removing fine-ending of grain-size distribution
- Diagenesis and its influence on reservoir quality and oil-water relative permeability: A case study in the Yanchang Formation Chang 8 tight sandstone oil reservoir, Ordos Basin, China
- Evaluation of AHRS algorithms for Foot-Mounted Inertial-based Indoor Navigation Systems
- Identification and evaluation of land use vulnerability in a coal mining area under the coupled human-environment
- Hydrocarbon Generation Potential of Chia Gara Formation in Three Selected Wells, Northern Iraq
- Source Analysis of Silicon and Uranium in uranium-rich shale in the Xiuwu Basin, Southern China
- Lithologic heterogeneity of lacustrine shale and its geological significance for shale hydrocarbon-a case study of Zhangjiatan Shale
- Characterization of soil permeability in the former Lake Texcoco, Mexico
- Detrital zircon trace elements from the Mesozoic Jiyuan Basin, central China and its implication on tectonic transition of the Qinling Orogenic Belt
- Turkey OpenStreetMap Dataset - Spatial Analysis of Development and Growth Proxies
- Morphological Changes of the Lower Ping and Chao Phraya Rivers, North and Central Thailand: Flood and Coastal Equilibrium Analyses
- Landscape Transformations in Rapidly Developing Peri-urban Areas of Accra, Ghana: Results of 30 years
- Division of shale sequences and prediction of the favorable shale gas intervals: an example of the Lower Cambrian of Yangtze Region in Xiuwu Basin
- Fractal characteristics of nanopores in lacustrine shales of the Triassic Yanchang Formation, Ordos Basin, NW China
- Selected components of geological structures and numerical modelling of slope stability
- Spatial data quality and uncertainty publication patterns and trends by bibliometric analysis
- Application of microstructure classification for the assessment of the variability of geological-engineering and pore space properties in clay soils
- Shear failure modes and AE characteristics of sandstone and marble fractures
- Ice Age theory: a correspondence between Milutin Milanković and Vojislav Mišković
- Are Serbian tourists worried? The effect of psychological factors on tourists’ behavior based on the perceived risk
- Real-Time Map Matching: A New Algorithm Integrating Spatio-Temporal Proximity and Improved Weighted Circle
- Characteristics and hysteresis of saturated-unsaturated seepage of soil landslides in the Three Gorges Reservoir Area, China
- Petrographical and geophysical investigation of the Ecca Group between Fort Beaufort and Grahamstown, in the Eastern Cape Province, South Africa
- Ecological risk assessment of geohazards in Natural World Heritage Sites: an empirical analysis of Bogda, Tianshan
- Integrated Subsurface Temperature Modeling beneath Mt. Lawu and Mt. Muriah in The Northeast Java Basin, Indonesia
- Go social for your own safety! Review of social networks use on natural disasters – case studies from worldwide
- Forestry Aridity Index in Vojvodina, North Serbia
- Natural Disasters vs Hotel Industry Resilience: An Exploratory Study among Hotel Managers from Europe
- Using Monarch Butterfly Optimization to Solve the Emergency Vehicle Routing Problem with Relief Materials in Sudden Disasters
- Potential influence of meteorological variables on forest fire risk in Serbia during the period 2000-2017
- Controlling factors on the geochemistry of Al-Shuaiba and Al-Mejarma coastal lagoons, Red Sea, Saudi Arabia
- The Influence of Kaolinite - Illite toward mechanical properties of Claystone
- Two critical books in the history of loess investigation: ‘Charakteristik der Felsarten’ by Karl Caesar von Leonhard and ‘Principles of Geology’ by Charles Lyell
- The Mechanism and Control Technology of Strong Strata Behavior in Extra-Thick Coal Seam Mining Influenced by Overlying Coal Pillar
- Shared Aerial Drone Videos — Prospects and Problems for Volunteered Geographic Information Research
- Stable isotopes of C and H in methane fermentation of agriculture substrates at different temperature conditions
- Prediction of Compression and Swelling Index Parameters of Quaternary Sediments from Index Tests at Mersin District
- Detection of old scattered windthrow using low cost resources. The case of Storm Xynthia in the Vosges Mountains, 28 February 2010
- Remediation of Copper and Zinc from wastewater by modified clay in Asir region southwest of Saudi Arabia
- Sedimentary facies of Paleogene lacustrine dolomicrite and implications for petroleum reservoirs in the southern Qianjiang Depression, China
- Correlation between ore particle flow pattern and velocity field through multiple drawpoints under the influence of a flexible barrier
- Atmospheric refractivity estimation from AIS signal power using the quantum-behaved particle swarm optimization algorithm
- A geophysical and hydro physico-chemical study of the contaminant impact of a solid waste landfill (swl) in King Williams’ Town, Eastern Cape, South Africa
- Landscape characterization using photographs from crowdsourced platforms: content analysis of social media photographs
- A Study on Transient Electromagnetic Interpretation Method Based on the Seismic Wave Impedance Inversion Model
- Stratigraphy of Architectural Elements of a Buried Monogenetic Volcanic System
- Variable secondary porosity modeling of carbonate rocks based on μ-CT images
- Traditional versus modern settlement on torrential alluvial fans considering the danger of debris flows: a case study of the Upper Sava Valley (NW Slovenia)
- The Influence of Gangue Particle size and Gangue Feeding Rate on Safety and Service Life of the Suspended Buffer’s Spring
- Research on the Transition Section Length of the Mixed Workface Using Gangue Backfilling Method and Caving Method
- Rainfall erosivity and extreme precipitation in the Pannonian basin
- Structure of the Sediment and Crust in the Northeast North China Craton from Improved Sequential H-k Stacking Method
- Planning Activities Improvements Responding Local Interests Change through Participatory Approach
- GIS-based landslide susceptibility mapping using bivariate statistical methods in North-western Tunisia
- Uncertainty based multi-step seismic analysis for near-surface imaging
- Deformation monitoring and prediction for residential areas in the Panji mining area based on an InSAR time series analysis and the GM-SVR model
- Statistical and expert-based landslide susceptibility modeling on a national scale applied to North Macedonia
- Natural hazards and their impact on rural settlements in NE Romania – A cartographical approach
- Rock fracture initiation and propagation by mechanical and hydraulic impact
- Influence of Rapid Transit on Accessibility Pattern and Economic Linkage at Urban Agglomeration Scale in China
- Near Infrared Spectroscopic Study of Trioctahedral Chlorites and Its Remote Sensing Application
- Problems with collapsible soils: Particle types and inter-particle bonding
- Unification of data from various seismic catalogues to study seismic activity in the Carpathians Mountain arc
- Quality assessment of DEM derived from topographic maps for geomorphometric purposes
- Remote Sensing Monitoring of Soil Moisture in the Daliuta Coal Mine Based on SPOT 5/6 and Worldview-2
- Utilizing Maximum Entropy Spectral Analysis (MESA) to identify Milankovitch cycles in Lower Member of Miocene Zhujiang Formation in north slope of Baiyun Sag, Pearl River Mouth Basin, South China Sea
- Stability Analysis of a Slurry Trench in Cohesive-Frictional Soils
- Integrating Landsat 7 and 8 data to improve basalt formation classification: A case study at Buon Ma Thuot region, Central Highland, Vietnam
- Assessment of the hydrocarbon potentiality of the Late Jurassic formations of NW Iraq: A case study based on TOC and Rock-Eval pyrolysis in selected oil-wells
- Rare earth element geochemistry of sediments from the southern Okinawa Trough since 3 ka: Implications for river-sea processes and sediment source
- Effect of gas adsorption-induced pore radius and effective stress on shale gas permeability in slip flow: New Insights
- Development of the Narva-Jõesuu beach, mineral composition of beach deposits and destruction of the pier, southeastern coast of the Gulf of Finland
- Selecting fracturing interval for the exploitation of tight oil reservoirs from logs: a case study
- A comprehensive scheme for lithological mapping using Sentinel-2A and ASTER GDEM in weathered and vegetated coastal zone, Southern China
- Sedimentary model of K-Successions Sandstones in H21 Area of Huizhou Depression, Pearl River Mouth Basin, South China Sea
- A non-uniform dip slip formula to calculate the coseismic deformation: Case study of Tohoku Mw9.0 Earthquake
- Decision trees in environmental justice research — a case study on the floods of 2001 and 2010 in Hungary
- The Impacts of Climate Change on Maximum Daily Discharge in the Payab Jamash Watershed, Iran
- Mass tourism in protected areas – underestimated threat? Polish National Parks case study
- Decadal variations of total organic carbon production in the inner-shelf of the South China Sea and East China Sea
- Hydrogeothermal potentials of Rogozna mountain and possibility of their valorization
- Postglacial talus slope development imaged by the ERT method: comparison of slopes from SW Spitsbergen, Norway and Tatra Mountains, Poland
- Seismotectonics of Malatya Fault, Eastern Turkey
- Investigating of soil features and landslide risk in Western-Atakent (İstanbul) using resistivity, MASW, Microtremor and boreholes methods
- Assessment of Aquifer Vulnerability Using Integrated Geophysical Approach in Weathered Terrains of South China
- An integrated analysis of mineralogical and microstructural characteristics and petrophysical properties of carbonate rocks in the lower Indus Basin, Pakistan
- Applicability of Hydrological Models for Flash Flood Simulation in Small Catchments of Hilly Area in China
- Heterogeneity analysis of shale reservoir based on multi-stage pumping data