Atmospheric refractivity estimation from AIS signal power using the quantum-behaved particle swarm optimization algorithm
-
Wenlong Tang
 and
Xichuang Ren
and
Xichuang Ren

Abstract
This paper proposes a new refractivity profile estimation method based on the use of AIS signal power and quantum-behaved particle swarm optimization (QPSO) algorithm to solve the inverse problem. Automatic identification system (AIS) is a maritime navigation safety communication system that operates in the very high frequency mobile band and was developed primarily for collision avoidance. Since AIS is a one-way communication system which does not need to consider the target echo signal, it can estimate the atmospheric refractivity profile more accurately. Estimating atmospheric refractivity profiles from AIS signal power is a complex nonlinear optimization problem, the QPSO algorithm is adopted to search for the optimal solution from various refractivity parameters, and the inversion results are compared with those of the particle swarm optimization algorithm to validate the superiority of the QPSO algorithm. In order to test the anti-noise ability of the QPSO algorithm, the synthetic AIS signal power with different Gaussian noise levels is utilized to invert the surface-based duct. Simulation results indicate that the QPSO algorithm can invert the surface-based duct using AIS signal power accurately, which verify the feasibility of the new atmospheric refractivity estimation method based on the automatic identification system.
1 Introduction
Atmospheric ducting is an abnormal propagation phenomenon resulting from the varying refractivity of air, which can cause anomalous propagation of electromagnetic waves. In the marine environment, there is a high probability of ducts occurring at any time and in any sea area, which has a significant impact on the performance of radar and communication systems [1]. Therefore, it is important to estimate the atmospheric refractivity profile for the performance evaluation and prediction of maritime radar and communication systems.
Currently, the method of remote sensing detection is mainly used to estimate atmospheric refractivity profile, and refractivity from clutter (RFC) technique has been an active field of research. RFC estimate refractivity profile of the atmosphere from the sea surface reflected radar clutter signal [2, 3, 4, 5, 6]. This method holds the characteristics of remote, indirect, real-time, cheap and convenient. Real-time detection can be achieved without increasing any additional equipment by RFC, because it depends on radar measurements only. In recent years, RFC has become a hot research method of estimating atmospheric refractivity profile. Although RFC has certain advantages, it actually has the following limitations [7]: In order to estimate the atmospheric refractivity profile, radar need to transmit high-power signals for active detection, which easily interferes with the normal operation of electronic equipment in the relevant area. In addition, the uncertainty of the currently utilized normalized radar cross section model of the sea surface will severely limit the accuracy of the inversion. When sea surface and weather (volume) clutter is hard to separate such as in precipitation, the shortcoming of the current RFC approaches is evident.
However, if we use the automatic identification system (AIS) for refractivity profile inversion, these problems do not occur. AIS system is a one-way communication system that depends on radio wave propagation for the transmission of AIS signals and the propagation path of AIS signals will be influenced by the atmospheric conditions [8, 9, 10]. Referring to the idea of RFC, this paper proposes a new refractivity profile estimation method based on the AIS signal power to improve the accuracy of estimating the refractivity profile. Using existing shipboard and shore-based AIS equipment and AIS networks, no additional equipment is required, the cost is lower, and it is convenient to operate. It can be accurately and efficiently invert the distribution of atmospheric ducts over the entire sea surface.
Obviously, atmospheric refractivity profile estimation is an inverse problem, and the powerful and efficient quantum-behaved particle swarm optimization (QPSO) algorithm is presented to estimate the surface-based duct. QPSO algorithm [11, 12, 13] is a type of particle swarm optimization (PSO) algorithm with quantum behaviour that proposed on the basis of classical particle swarm optimization algorithm, which is simple, effective and converges rapidly. Because particles in quantum space satisfy unique properties of aggregation state, there is no definite trajectory when particles move, which enables particles to search for global optimal solutions to the entire feasible solution space. Therefore, the global search performance of the QPSO algorithm is much better than that of classical PSO algorithm.
The remainder of this article is organized as follows. In Section 2, the automatic identification system is introduced. In Section 3, the forward propagation model used to calculate the AIS signal power under maritime atmospheric duct conditions is provided. In Section 4, a new method to invert the atmospheric refractivity profile using the AIS signal power is proposed. Numerical results are analyzed and discussed in Section 5, while the paper is concluded in Section 6.
2 Automatic identification system
In 2000, as a part of the Safety Of Life At Sea (SOLAS) regulations [14], the International Maritime Organization (IMO) require AIS to be fitted aboard all ships of 300 gross tonnage and upwards engaged on international voyages, cargo ships of 500 gross tonnage and upwards not engaged on international voyages and all passenger ships irrespective of size. It came into full force on December 31, 2004, and this system is known as Class A AIS, which can automatically provides vessel information, including the vessel’s identity, type, position, course, speed, navigation status and other safety-related to other ships and to shore stations in its surroundings. It also receives such information from similarly fitted ships and exchanges data with shore-based facilities automatically. In 2007, Class B AIS was introduced for small vessels, including pleasure boats. Class B messages generally contain less information than Class A messages. However, they all provide essential safety information.
Two international channels are allocated for AIS and both frequencies are in the very high frequency band. They are 161.975 MHz and 162.025 MHz. As Class A AIS system is mandatory for all ships specified by the IMO, we only consider this system in this paper.
3 Forward propagation modelling
3.1 Atmospheric ducts
Since meteorological elements such as temperature, humidity and pressure in the atmospheric environment have vertical stratification unevenness characteristics, the atmospheric refractivity also has vertical stratification uneven characteristics. Therefore, electromagnetic waves propagating in the atmosphere are affected by atmospheric refraction. Atmospheric refractivity is defined by [15]
where n is the refractive index.
In order to take the influence of the curvature of the earth into consideration, the modified refractivity M is introduced and defined as
where R0 = 6370 km is the radius of the earth, and z is the height above sea level in m.
The propagation characteristics of electromagnetic waves in the clear-air troposphere mainly depend on the modified refractivity gradient dM/dz. When the modified refractivity gradient dM/dz is less than zero, the curvature of the electromagnetic wave propagation path will exceed the curvature of the surface of the earth, that is, there is an atmospheric duct phenomenon. Since evaporation ducts have little effect on AIS transmission, this paper only considers the surface-based duct, which is illustrated in Figure 1.
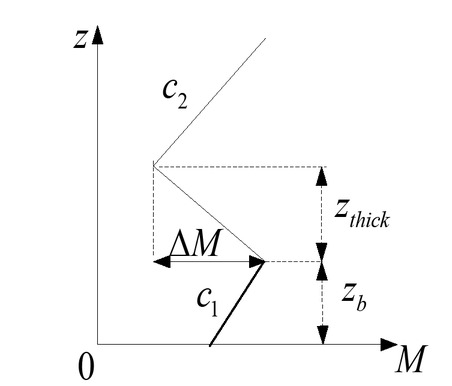
Atmospheric modified refractivity profile of surface-based ducts
As in Figure 1, the atmospheric modified refractivity profile of the surface-based duct can be modelled with a tri-linear curve:
where M (z) is the modified refractivity, M0 is the value of modified refractivity at the sea level surface, z is the vertical height, zb is the base height, zthick is the duct layer thickness, and ᐃM is the duct strength, c1 is the slope of the duct bottom layer and c2 = 0.118 is the slope of the duct top layer. Obviously, the refractivity profile of the surface-based duct can be described by the four-parameter vector m = (c1, zb, zthick , ᐃM).
3.2 Parabolic equation method
The propagation of electromagnetic waves under atmospheric ducting conditions depends on many factors: antenna height, duct height, duct strength, carrier frequency, polarization and sea surface conditions, and the parabolic equation method can take all of these factors into considerations [16]. The parabolic equation method is a forward full wave analysis method with the ability to handle complex boundary conditions and horizontal inhomogeneous atmospheric environment, and it also has excellent stability and accuracy. The solutions of the parabolic equation method can be achieved by the split-step Fourier transform (SSFT) technique and implemented on a personal computer in seconds for propagation over a sea surface, so it is widely applied to the wave propagation problems under atmospheric ducting conditions [17]. For the purpose of analyzing the propagation of AIS signals under atmospheric ducting conditions, the parabolic equation method may be the best choice. Therefore, we utilize the parabolic equation method to calculate the propagation loss of AIS signals in ducting channel.
In the troposphere electromagnetic wave propagation, forward narrow angle parabolic equations are usually used. Ignoring backscattering effect of electromagnetic waves, the standard parabolic equation (SPE) is defined as [18]
where u (x, z) is the reduced function, x is the horizontal range and z is the height, k0 = 2π/λ is the free-space wave number, λ is the wavelength, m (x, z) = 1 + M × 10−6 is the range and height dependent modified atmospheric refractive index.
3.3 AIS propagation model
Since AIS is a one-way communication system, it does not need to consider the target echo signal, thus the AIS radar range equation is [19]
where Pt is the transmitted power, Gt is the gain of the transmitter antenna, Gr is the gain of the receiver antenna, λ is the wavelength, R is the path length. The propagation factor F is the field relative to free space expressed in dB, which is defined as
Therefore, the one-way propagation loss of AIS signals is defined as
where x is the range from the transmitter to the receiver, m is the unknown refractivity profile parameter vector, λ is the wavelength of AIS signals, u (x, z) is the reduced function that can be solved by the parabolic equation split-step Fourier method.
The received AIS signal power can be modelled as
where C is the constant terms in (5).
4 A new inversion method based on the AIS signal power
4.1 The inversion step
Although RFC techniques have certain advantages, some problems exist. For example, currently used normalized sea surface radar cross section is not accurate and in some cases it is difficult to separate the sea surface and weather (volume) clutter, which will severely limit the accuracy of the inversion. AIS system is a one-way technique that does not need to consider the reflection of the signal on a target, and thus it is more appropriate for inverting the atmospheric refractivity profile. To improve the accuracy of the estimation of the refractivity profile, a new inversion method based on the AIS signal power is proposed. The inversion step is as follows.
Step 1. Obtain the observed AIS signal power Pobsr (x, m).
Step 2. Select the appropriate atmospheric refractivity profile model.
Step 3. Use the forward propagation model to calculate the AIS signal power Pr(x, m).
Step 4. Construct the objective function f = min
Step 5. Optimize the objective function f determined in step 4 using a global optimization algorithm to get the unknown refractivity profile parameter vector m.
4.2 Quantum-behaved particle swarm optimization algorithm
The quantum-behaved particle swarm optimization algorithm [20] is used to optimize the objective function for obtaining the best atmospheric modified refractivity profile. The classical particle swarm optimization algorithm [21] is a random search algorithm based on swarm intelligence, which has the ability of global approximation, but due to its limited search space, it is easy to fall into the local extreme value. From the perspective of quantum mechanics, a new particle swarm optimization algorithm, quantum-behaved particle swarm optimization algorithm is proposed. Quantum computing is a new computing technology, and its fusion with swarm intelligence algorithm has a broad application prospect. QPSO algorithm combine quantum computing method and PSO algorithm and become a more efficient algorithm.
In the PSO algorithm, each particle represents a feasible solution to the optimization problem. The pros and cons of the solution is determined by the fitness function, which depends on the actual optimization problem. For the ith particle (1 ≤ i ≤ M, M is the number of particles in the population), the current position of the particle in the search space is denoted by Xi = (xi1 (t) , xi2 (t) , · · ·, xid (t) , · · ·, xiD (t)), t is the current number of iterations of the algorithm and D is the dimension of the particle. According to the analysis of the particle trajectory in the PSO algorithm, to ensure the convergence of the PSO algorithm, each particle must converge to its local attractor pi = (pi1 (t) , pi2 (t) , · · ·, pid (t) , · · · , piD (t)), which is defined as [22]
where φd (t) = c1r1d (t) / (c1r1d (t) + c2r2d (t)), r1d (t) and r2d (t) are two random number uniformly distributed within (0, 1). c1 and c2 are the learning factors. During each iteration of the PSO algorithm, Pi = (Pi1 (t) , Pi2 (t) , · · ·, Pid (t) , · · · · , PiD (t)) is the current optimal position of the ith particle, and Pg = ( Pg1 (t) , Pg2 (t) , · · ·, Pgd (t) , · · ·, PgD (t)) is the global optimal position of the population.
Assuming that the PSO system is a quantum system, the velocity and position of the particles in the quantum space cannot be determined simultaneously. The state of each particle is determined by the wave function , and ||2 is the probability density function of the particle position. By establishing a Delta potential well model in each dimension of pi to prevent particle divergence, the corresponding Schrödinger equation can be solved to obtain the probability density function of the position of each dimension of the particle in the search space, which is defined as
where Lid (t) is the characteristic length of the Delta well, which determines the search range of the particle.
Monte Carlo simulation method is used to obtain the position of the dth dimension of the ith particle at the
(t + 1)th iteration:
where u is a random number uniformly distributed over (0, 1).
where α is the contraction-expansion coefficient. md (t) is the average optimal position, which is the centre point of the optimal position of all particles themselves and is defined as
Therefore, the position update equation of the particle is
The PSO algorithm using the Equation (14) as the particle position update equation is called the quantum-behaved particle swarm optimization (QPSO) algorithm [23].
The flowchart of the QPSO algorithm is shown in Figure 2.
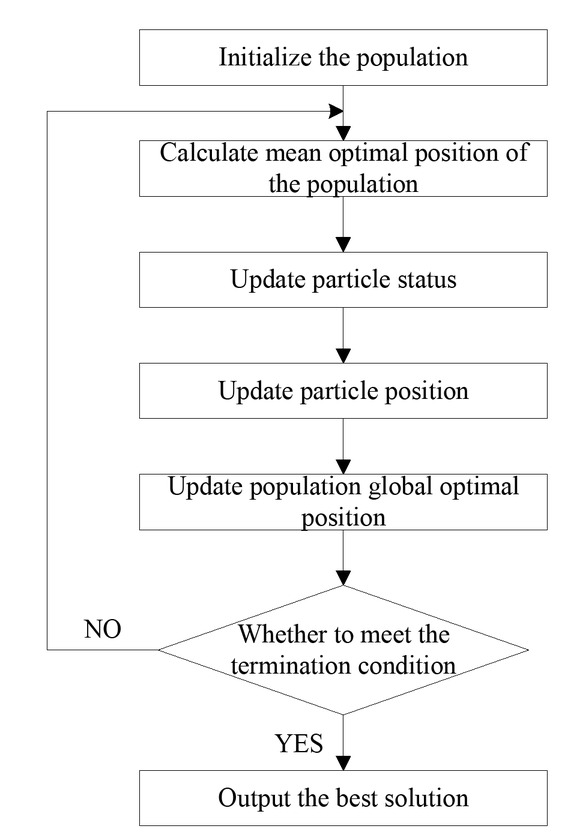
The flowchart of the QPSO algorithm
5 Results and discussion
5.1 Inversion of surface-based ducts
In this section, inversion of surface-based ducts using the AIS signal power is investigated by the QPSO algorithm via the simulation study. For the surface-based duct, there is four-parameter m = (c1, zb, zthick , ᐃM) that need to be estimated. The AIS system parameters are chosen as: the frequency is 162 MHz, the antenna is an omnidirectional antenna with a height of 20 m, and the vertical polarization is employed. The AIS signal power simulated by the profile parameter vector m = (0.13, 40, 20, 50) using the AIS propagation model in Section 3.3 is treated as the observed AIS signal power.
The control parameters of the QPSO algorithm for the surface-based duct inversion are given as follows: the number of maximum iteration is 100, the population size is 60, the learning factor is 2, and the inertial weight is reduced from the initial 1 to the final 0.5. Figure 3 gives the comparison of the simulated atmospheric modified refractivity profile and the inverted profile of the surface-based duct obtained by the proposed method in the case of without noise. In order to reveal the superiority of the QPSO algorithm, the inversion results of the QPSO algorithm are compared with that of the PSO algorithm.
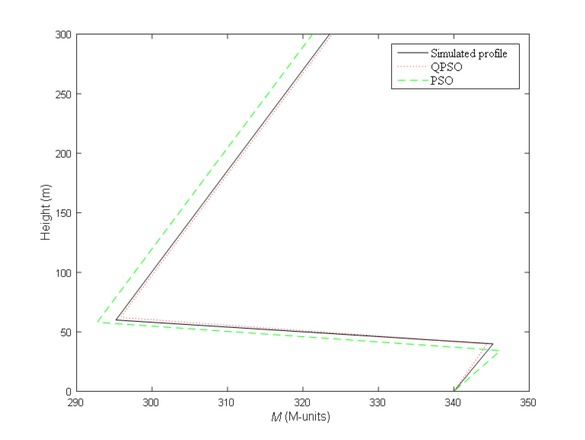
The simulated and inverted atmospheric refractivity profile without noise
From Figure 3, we can see that the refractivity profile inverted by the QPSO algorithm is in excellent agreement with the simulated one, which indicates that the inversion method based on the AIS signal power can be utilized to invert the surface-based duct in a maritime environment. It can also be seen from Figure 3 that the refractivity profile inverted by the PSO algorithm is obviously less accurate than those inverted by the QPSO algorithm. The inversion results show that the QPSO algorithm is more suitable for inverting atmospheric ducts.
Error analysis of the AIS based atmospheric refractivity inversion method in term of the Root Mean Square Error (RMSE) is performed to quantitatively analyze the optimization performance of the QPSO and the PSO algorithm and is illustrated in Table 1.
The error analyse of the QPSO and the PSO algorithm
| Parameter | True | QPSO | PSO |
|---|---|---|---|
| c1 | 0.13 | 0.11 | 0.18 |
| zb | 40 | 39.97 | 34.43 |
| zthick | 20 | 22.15 | 23.63 |
| ᐃM | 50 | 48.59 | 53.48 |
| RMSE | 0 | 1.29 | 3.75 |
As showed in Table 1, the RMSE of the PSO algorithm is larger than those of the QPSO algorithm, which illustrates the QPSO algorithm is better than that of the PSO algorithm for the surface-based duct inversion.
5.2 Inversion with Gaussian noise
To further analyze the anti-noise capability of the QPSO algorithm for estimating refractivity profile, the Gaussian noise with zero mean and different noise level is added to the synthetic AIS signal power. Simulated AIS signal power with 5 dB and 10 dB noise levels is taken as the observed AIS signal power to analyze the performance of the QPSO algorithm. Inversion results for different Gaussian noise levels are shown in Figure 4.
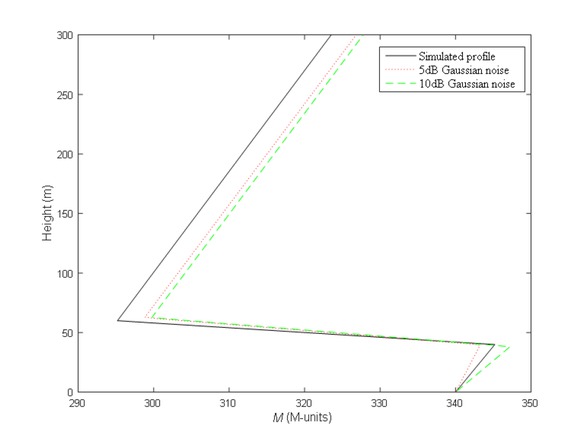
The simulated and inverted atmospheric refractivity profile with different Gaussian noise levels
As can be seen from Figure 4, the QPSO algorithm with the noise level of 5 dB and 10 dB can still make a good estimation of atmospheric refractivity profile. Although the inversion error is slightly larger than that of the noiseless case, the overall inversion accuracy is acceptable. Therefore, the QPSO algorithm has certain anti-noise capability and good robustness for the surface-based duct estimation.
The above analysis is based on receiving a single ship AIS signals, when multi-ship AIS signals are received (in the same direction or in different directions), the atmospheric refractivity profile over the sea in the entire region can be inverted simultaneously by the method proposed in this paper. Not only can shipboard AIS equipment be used, but also existing AIS equipment installed on other ships and shore-based equipment can be used for inversion, enabling ships to obtain current atmospheric refractivity distribution in near-real-time.
6 Conclusion
In this work, a new inversion method based on the AIS signal power has been proposed to invert the surface-based duct and the QPSO algorithm is used to search for the optimal solution from various refractivity parameters. Simulation results show that this new inversion method is feasible for the atmospheric refractivity profile estimation and the QPSO algorithm has good robustness. And it also has near-real-time performance, which provides strong support for the performance prediction of AIS system and other radio systems. It is of great value to use AIS system for realizing near-real-time, large-scale and continuous detection of atmospheric duct distribution in the maritime environment. However, an important topic that needs to be addressed more extensively is the validation of results obtained with this study for refractivity profile estimation, which will be investigated in the near future.
Acknowledgement
This work was supported by the National Natural Science Foundation of China (41405009).
Abbreviations
- AIS
Automatic identification system
- IMO
International Maritime Organization
- PSO
Particle swarm optimization
- QPSO
Quantum-behaved particle swarm optimization
- RFC
Refractivity from clutter
- SOLAS
Safety Of Life At Sea
- SPE
Standard parabolic equation
- SSFT
Split-step Fourier transform
References
[1] Sirkova I., Propagation factor and path loss simulation results for two rough surface reflection coefficients applied to the microwave ducting propagation over the sea. Prog. Electromagn. Res. M., 2011, 17, 151–16610.2528/PIERM11020602Search in Google Scholar
[2] Gerstoft P., Rogers L.T., Krolik J.K., Inversion for refractivity parameters from radar sea clutter. Radio Sci., 2003, 38, 1–2210.1029/2002RS002640Search in Google Scholar
[3] Yardim C., Gerstoft P., Hodgkiss W.S., Sensitivity analysis and performance estimation of refractivity from clutter techniques. Radio Sci., 2009, 44, 1–1610.1029/2008RS003897Search in Google Scholar
[4] Fountoulakis V., Earls C., Duct heights inferred from radar sea clutter using proper orthogonal bases. Radio Sci., 2016, 51, 1614–162610.1002/2016RS005998Search in Google Scholar
[5] Yang C., Zhang J.K., Guo L.X., Investigation on the inversion of the atmospheric duct using the artificial bee colony algorithm based on opposition-based learning. Int. J. Antenn. Propag., 2016, 2016, 1–1010.1155/2016/2749035Search in Google Scholar
[6] Yang C., Guo L.X., Inferring the atmospheric duct from radar sea clutter using the improved artificial bee colony algorithm. Int. J. Microw. Wirel. T., 2018, 2018, 1–910.1017/S1759078718000247Search in Google Scholar
[7] Karimian A., Yardim C., Gerstoft P., Hodgkiss W.S., Barrios A.E., Refractivity estimation from sea clutter: An invited review. Radio Sci., 2011, 46, 1–1610.1029/2011RS004818Search in Google Scholar
[8] Creech J.A., Ryan J.F., AIS: The cornerstone of national security? J. Navigation, 2003, 56, 31–4410.1017/S0373463302002072Search in Google Scholar
[9] Rep. ITU–R M.2123, Long range detection of automatic identification system (AIS) messages under various tropospheric propagation conditions. International Telecommunications Union (ITU), 2007Search in Google Scholar
[10] Green D., Fowler C., Power D., Tunaley J.K.E., VHF propagation study. DRDC Atlantic CR 2011–152, Defence Research & Development Canada – Atlantic, 2011Search in Google Scholar
[11] Sun J., Feng B., Xu W.B., Particle swarm optimization with particles having quantum behavior. Proceedings of the 2004 Congress on Evolutionary Computation, Portland, OR, USA, 19–23 June 2004, 325–33110.1109/CEC.2004.1330875Search in Google Scholar
[12] Fang W., Sun J., Ding Y.R., Wu X.J., Xu W.B., A review of quantum behaved particle swarm optimization. IETE Tech. Rev., 2010, 27(4), 336–34810.4103/0256-4602.64601Search in Google Scholar
[13] Sun J., Fang W.,Wu X.J., Palade V., Xu W.B., Quantum-behaved particle swarm optimization: Analysis of individual particle behavior and parameter selection. Evol. Comput., 2012, 20(3), 349–39310.1162/EVCO_a_00049Search in Google Scholar PubMed
[14] Safety of Life At Sea (SOLAS) Convention Chapter V, Regulation 19, 2000Search in Google Scholar
[15] Yang C., Estimation of the atmospheric duct from radar sea clutter using artificial bee colony optimization algorithm. Prog. Electromagn. Res., 2013, 135, 183–19910.2528/PIER12110104Search in Google Scholar
[16] Levy M.F., Parabolic Equation Methods for Electromagnetic Wave Propagation. The Institution of Electrical Engineers Press, London, 200010.1049/PBEW045ESearch in Google Scholar
[17] Cadette P.E., Modeling tropospheric radiowave propagation over rough sea surfaces using the parabolic equation Fourier split-step method. Master thesis, The George Washington University, Washington, D.C., 2012Search in Google Scholar
[18] Sirkova I., Brief review on PE method application to propagation channel modeling in sea environment. Cent. Eur. J. Eng., 2012, 2(1), 19–3810.2478/s13531-011-0049-ySearch in Google Scholar
[19] Bruin E.R., On propagation effects in maritime situation awareness: Modelling the impact of North Sea weather conditions on the performance of AIS and coastal radar systems. Master thesis, Utrecht University, Utrecht, 2016Search in Google Scholar
[20] Rehman O.U., Yang J.Q., Zhou Q., Yang S.Y., Khan S., A modified QPSO algorithm applied to engineering inverse problems in electromagnetic. Int. J. Appl. Electrom., 2017, 54, 107–12110.3233/JAE-160114Search in Google Scholar
[21] Kennedy J., Eberhart R., Particle swarm optimization. Proceedings of the IEEE International Conference on Neural Networks, Perth, WA, Australia, 27 Nov. –1 Dec. 1995, 1942–194810.1109/ICNN.1995.488968Search in Google Scholar
[22] Clerc M., Kennedy J., The particle swarm: Explosion, stability and convergence in a multidimentional complex space. IEEE T. Evolut. Comput., 2002, 6(1), 58–7310.1109/4235.985692Search in Google Scholar
[23] Liu T.Y., Jiao L.C.,Ma W.P., Shang R.H., Quantum-behaved particle swarm optimization with collaborative attractors for nonlinear numerical problems. Commun. Nonlinear Sci., 2017, 44, 167–18310.1016/j.cnsns.2016.08.001Search in Google Scholar
© 2019 B. Tian et al., published by De Gruyter
This work is licensed under the Creative Commons Attribution 4.0 Public License.
Articles in the same Issue
- Regular Articles
- 2D Seismic Interpretation of the Meyal Area, Northern Potwar Deform Zone, Potwar Basin, Pakistan
- A new method of lithologic identification and distribution characteristics of fine - grained sediments: A case study in southwest of Ordos Basin, China
- Modified Gompertz sigmoidal model removing fine-ending of grain-size distribution
- Diagenesis and its influence on reservoir quality and oil-water relative permeability: A case study in the Yanchang Formation Chang 8 tight sandstone oil reservoir, Ordos Basin, China
- Evaluation of AHRS algorithms for Foot-Mounted Inertial-based Indoor Navigation Systems
- Identification and evaluation of land use vulnerability in a coal mining area under the coupled human-environment
- Hydrocarbon Generation Potential of Chia Gara Formation in Three Selected Wells, Northern Iraq
- Source Analysis of Silicon and Uranium in uranium-rich shale in the Xiuwu Basin, Southern China
- Lithologic heterogeneity of lacustrine shale and its geological significance for shale hydrocarbon-a case study of Zhangjiatan Shale
- Characterization of soil permeability in the former Lake Texcoco, Mexico
- Detrital zircon trace elements from the Mesozoic Jiyuan Basin, central China and its implication on tectonic transition of the Qinling Orogenic Belt
- Turkey OpenStreetMap Dataset - Spatial Analysis of Development and Growth Proxies
- Morphological Changes of the Lower Ping and Chao Phraya Rivers, North and Central Thailand: Flood and Coastal Equilibrium Analyses
- Landscape Transformations in Rapidly Developing Peri-urban Areas of Accra, Ghana: Results of 30 years
- Division of shale sequences and prediction of the favorable shale gas intervals: an example of the Lower Cambrian of Yangtze Region in Xiuwu Basin
- Fractal characteristics of nanopores in lacustrine shales of the Triassic Yanchang Formation, Ordos Basin, NW China
- Selected components of geological structures and numerical modelling of slope stability
- Spatial data quality and uncertainty publication patterns and trends by bibliometric analysis
- Application of microstructure classification for the assessment of the variability of geological-engineering and pore space properties in clay soils
- Shear failure modes and AE characteristics of sandstone and marble fractures
- Ice Age theory: a correspondence between Milutin Milanković and Vojislav Mišković
- Are Serbian tourists worried? The effect of psychological factors on tourists’ behavior based on the perceived risk
- Real-Time Map Matching: A New Algorithm Integrating Spatio-Temporal Proximity and Improved Weighted Circle
- Characteristics and hysteresis of saturated-unsaturated seepage of soil landslides in the Three Gorges Reservoir Area, China
- Petrographical and geophysical investigation of the Ecca Group between Fort Beaufort and Grahamstown, in the Eastern Cape Province, South Africa
- Ecological risk assessment of geohazards in Natural World Heritage Sites: an empirical analysis of Bogda, Tianshan
- Integrated Subsurface Temperature Modeling beneath Mt. Lawu and Mt. Muriah in The Northeast Java Basin, Indonesia
- Go social for your own safety! Review of social networks use on natural disasters – case studies from worldwide
- Forestry Aridity Index in Vojvodina, North Serbia
- Natural Disasters vs Hotel Industry Resilience: An Exploratory Study among Hotel Managers from Europe
- Using Monarch Butterfly Optimization to Solve the Emergency Vehicle Routing Problem with Relief Materials in Sudden Disasters
- Potential influence of meteorological variables on forest fire risk in Serbia during the period 2000-2017
- Controlling factors on the geochemistry of Al-Shuaiba and Al-Mejarma coastal lagoons, Red Sea, Saudi Arabia
- The Influence of Kaolinite - Illite toward mechanical properties of Claystone
- Two critical books in the history of loess investigation: ‘Charakteristik der Felsarten’ by Karl Caesar von Leonhard and ‘Principles of Geology’ by Charles Lyell
- The Mechanism and Control Technology of Strong Strata Behavior in Extra-Thick Coal Seam Mining Influenced by Overlying Coal Pillar
- Shared Aerial Drone Videos — Prospects and Problems for Volunteered Geographic Information Research
- Stable isotopes of C and H in methane fermentation of agriculture substrates at different temperature conditions
- Prediction of Compression and Swelling Index Parameters of Quaternary Sediments from Index Tests at Mersin District
- Detection of old scattered windthrow using low cost resources. The case of Storm Xynthia in the Vosges Mountains, 28 February 2010
- Remediation of Copper and Zinc from wastewater by modified clay in Asir region southwest of Saudi Arabia
- Sedimentary facies of Paleogene lacustrine dolomicrite and implications for petroleum reservoirs in the southern Qianjiang Depression, China
- Correlation between ore particle flow pattern and velocity field through multiple drawpoints under the influence of a flexible barrier
- Atmospheric refractivity estimation from AIS signal power using the quantum-behaved particle swarm optimization algorithm
- A geophysical and hydro physico-chemical study of the contaminant impact of a solid waste landfill (swl) in King Williams’ Town, Eastern Cape, South Africa
- Landscape characterization using photographs from crowdsourced platforms: content analysis of social media photographs
- A Study on Transient Electromagnetic Interpretation Method Based on the Seismic Wave Impedance Inversion Model
- Stratigraphy of Architectural Elements of a Buried Monogenetic Volcanic System
- Variable secondary porosity modeling of carbonate rocks based on μ-CT images
- Traditional versus modern settlement on torrential alluvial fans considering the danger of debris flows: a case study of the Upper Sava Valley (NW Slovenia)
- The Influence of Gangue Particle size and Gangue Feeding Rate on Safety and Service Life of the Suspended Buffer’s Spring
- Research on the Transition Section Length of the Mixed Workface Using Gangue Backfilling Method and Caving Method
- Rainfall erosivity and extreme precipitation in the Pannonian basin
- Structure of the Sediment and Crust in the Northeast North China Craton from Improved Sequential H-k Stacking Method
- Planning Activities Improvements Responding Local Interests Change through Participatory Approach
- GIS-based landslide susceptibility mapping using bivariate statistical methods in North-western Tunisia
- Uncertainty based multi-step seismic analysis for near-surface imaging
- Deformation monitoring and prediction for residential areas in the Panji mining area based on an InSAR time series analysis and the GM-SVR model
- Statistical and expert-based landslide susceptibility modeling on a national scale applied to North Macedonia
- Natural hazards and their impact on rural settlements in NE Romania – A cartographical approach
- Rock fracture initiation and propagation by mechanical and hydraulic impact
- Influence of Rapid Transit on Accessibility Pattern and Economic Linkage at Urban Agglomeration Scale in China
- Near Infrared Spectroscopic Study of Trioctahedral Chlorites and Its Remote Sensing Application
- Problems with collapsible soils: Particle types and inter-particle bonding
- Unification of data from various seismic catalogues to study seismic activity in the Carpathians Mountain arc
- Quality assessment of DEM derived from topographic maps for geomorphometric purposes
- Remote Sensing Monitoring of Soil Moisture in the Daliuta Coal Mine Based on SPOT 5/6 and Worldview-2
- Utilizing Maximum Entropy Spectral Analysis (MESA) to identify Milankovitch cycles in Lower Member of Miocene Zhujiang Formation in north slope of Baiyun Sag, Pearl River Mouth Basin, South China Sea
- Stability Analysis of a Slurry Trench in Cohesive-Frictional Soils
- Integrating Landsat 7 and 8 data to improve basalt formation classification: A case study at Buon Ma Thuot region, Central Highland, Vietnam
- Assessment of the hydrocarbon potentiality of the Late Jurassic formations of NW Iraq: A case study based on TOC and Rock-Eval pyrolysis in selected oil-wells
- Rare earth element geochemistry of sediments from the southern Okinawa Trough since 3 ka: Implications for river-sea processes and sediment source
- Effect of gas adsorption-induced pore radius and effective stress on shale gas permeability in slip flow: New Insights
- Development of the Narva-Jõesuu beach, mineral composition of beach deposits and destruction of the pier, southeastern coast of the Gulf of Finland
- Selecting fracturing interval for the exploitation of tight oil reservoirs from logs: a case study
- A comprehensive scheme for lithological mapping using Sentinel-2A and ASTER GDEM in weathered and vegetated coastal zone, Southern China
- Sedimentary model of K-Successions Sandstones in H21 Area of Huizhou Depression, Pearl River Mouth Basin, South China Sea
- A non-uniform dip slip formula to calculate the coseismic deformation: Case study of Tohoku Mw9.0 Earthquake
- Decision trees in environmental justice research — a case study on the floods of 2001 and 2010 in Hungary
- The Impacts of Climate Change on Maximum Daily Discharge in the Payab Jamash Watershed, Iran
- Mass tourism in protected areas – underestimated threat? Polish National Parks case study
- Decadal variations of total organic carbon production in the inner-shelf of the South China Sea and East China Sea
- Hydrogeothermal potentials of Rogozna mountain and possibility of their valorization
- Postglacial talus slope development imaged by the ERT method: comparison of slopes from SW Spitsbergen, Norway and Tatra Mountains, Poland
- Seismotectonics of Malatya Fault, Eastern Turkey
- Investigating of soil features and landslide risk in Western-Atakent (İstanbul) using resistivity, MASW, Microtremor and boreholes methods
- Assessment of Aquifer Vulnerability Using Integrated Geophysical Approach in Weathered Terrains of South China
- An integrated analysis of mineralogical and microstructural characteristics and petrophysical properties of carbonate rocks in the lower Indus Basin, Pakistan
- Applicability of Hydrological Models for Flash Flood Simulation in Small Catchments of Hilly Area in China
- Heterogeneity analysis of shale reservoir based on multi-stage pumping data