Uncertainty based multi-step seismic analysis for near-surface imaging
-
Artur Marciniak
 ,
Iwona Stan-Kłeczek
,
Iwona Stan-Kłeczek

Abstract
Near-surface seismic surveys are often designed for surface wave and seismic tomographic analysis. In recent years, seismic imaging methods have been more frequently used at this scale. Recognition of near-surface structures using a single method is insufficient because of the ambiguity of the inversion problem. As a solution, the authors propose a multi-step approach, where several different seismic methods are used in a particular order, to achieve an optimal model. A multi-method approach allows utilisation of a whole spectrum of recorded data, even the elements that are treated as background noise in other techniques. In classical processing approach, information about data uncertainty is often omitted or used in the simplest way for the single method only. This work presents an updated approach to uncertainty analysis by transferring estimated uncertainty between processing steps. By assuming that every consecutively applied method is more certain, the authors were able to obtain accurate velocity fields for seismic imaging, as the main information received from the previous steps. Based on information from multiple methods, a seismic stack in the depth domain was created as a final result, with an estimate of uncertainty.
1 Introduction
Imaging of near-surface structures is often performed rapidly using a single method. In most commercial applications, this comprises the analysis of surface wave dispersion curves (MASW) [1], or first breaks travel time tomography alone. The inversion of seismic data in the near-surface is a problem and is a non-unique procedure, without other geophysical measurements [2, 3, 4, 5, 6, 7, 8, 9]. To limit this shortcoming, it is possible to use more data or to use interpretation techniques that utilise the whole of the recorded data [10, 11, 12, 13, 14, 15, 16, 17, 18, 19]. These techniques have different resolution capabilities. One interpretation method is to focus on the most precise technique for a given problem. We are convinced that a combination of several techniques will result in better recovery of data for a studied structure, but it is necessary to understand the limitations of the techniques used, especially its uncertainty [20, 21]. Here, using simple field data, we present a complex approach to combine three seismic methods in a strict uncertainty guided procedure, in order to interpret near-surface structure. The results obtained are optimally fitted to the given data and are presented with the uncertainty analysis at each processing step.
2 Motivation
Near-surface geophysical studies have to be simple and cost-effective. In most cases, studied geological structures are rather simple. Our motivation for this work is to develop a simple but effective method that will use shallow seismic data more completely (Figure 1). The application of similar procedures to those used for deep experiments [22, 23] but in a simplified form, would allow us to overcome multiple processing problems and obtain a final result with an estimated uncertainty. The use of additional analyses which are effective in near-surface studies (e.g. MASW), will provide additional information for the correct interpretation of the subsurface.
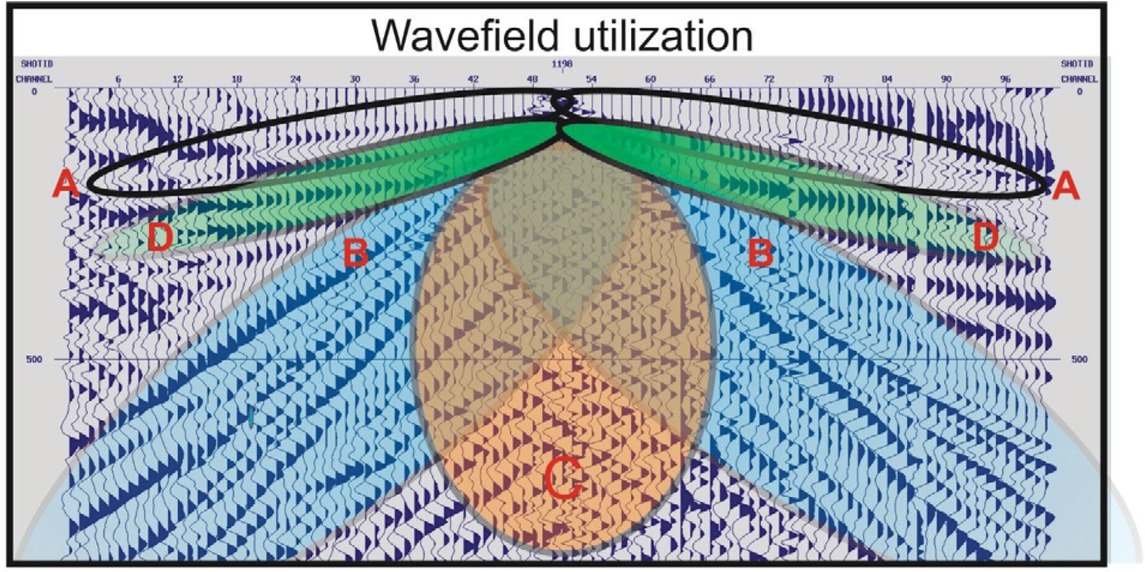
Example of real data with specified different types of seismic waves. The utilisation of Refracted Waves (A), Surface Waves (B), Reflected Waves (C) and wide-angle Reflected Waves (D) increases the certainty of the final result.
3 Geology
Data acquisition in this case study was conducted at the test site of the Central Geophysical Observatory in Poland. The geology of the region consists of thick Quaternary sediments (definitely thicker than 100 m), which are post-glacial and were created in the Pleistocene. According to the Central Geological Database (http://bazagis.pgi.gov.pl) in the vicinity of the test site, three shallow boreholes were drilled. All of them show quaternary deposits (Mała Wieś borehole 97.8m depth, Belsk 1/6 borehole 15m depth, Pgr Stara Wieś borehole 53m depth). Under the Cainozoic deposits, the Maastrichtian deposits are present [24]. However simple, the geology of the research area is difficult for the near-surface seismic methods because of the high wave attenuation. The well-mixed post-glacial sediments, with small velocity differences, are characterised by the small reflection coefficient differences between the layers. For that reason, the proposed research area is well suited as a test site for the proposed approach to data processing, that will be mainly applied in similar geological conditions. The most interesting geological boundary between Cainozoic and Mesozoic is lying on the depth that exceeds the penetration range of the author’s seismic equipment.
4 Fieldwork
During fieldwork, a 400 m seismic line (Figure 2) covered by 100 stations (60 Data-Cube type (light-blue pointer) and 40 Reftek 130 (orange pointer) 4.5 Hz type receivers (Table 1) was set. The spacing between geophones was 4 m (Figure 2). As a seismic source, the authors used a car-mounted PEG 40 accelerated weight drop in the shooting scheme, assuming signal excitation between geophones (Figure 2 blue stars). Terrain coverage in the fieldwork area changed with distance from the east side of the profile to the forest zone in the west. Because of this, the application of a car-mounted PEG 40 accelerated hammer provided the best possible signal to noise (S/N) ratio for the first 332 m of the profile, while the rest of the shots were executed with a sledgehammer (Figure 2 white stars). At every shot point, a total of six signal excitations was conducted for further vertical stacking. This was an unconventional data acquisition system for a geoengineering purpose (with a single channel, stand-alone stations) and required very careful time measurement for the duration of the experiment. The timing device used was based on a GPS and allowed us to measure each source with a precision better than 2 ms. Because of negligible elevation changes of less than 1m, geodesy measurements were not needed.

The geometry of acquisition profile from project GPB Belsk. The total range of 400 m long line was regularly covered with 100 seismic stations. Sources were regularly spaced at 4 m intervals. After 300m along the profile, the application of a car-mounted, accelerated weight drop was impossible due to rough terrain. The last 72 m of the acquisition line was shot by sledgehammer.
Acquisition parameters for the GPB seismic line.
| Parameter | Value |
|---|---|
| Vertical Stack | 6 |
| Sampling interval | 2.5 ms |
| Record length | 2 s |
| Receivers | 4.5 Hz |
| Station interval | 4 m |
| Shot interval | 4 m |
| Active channels | 100 |
| Fold | 100 |
| Offset | 0-398 m |
5 MASW data analysis
The application of multi-method, seismic data analysis requires a careful approach to the data quality and an estimation of the uncertainty of the results. Careful quality control was conducted to eliminate errors in the data due to possible timing problems. During that process, some outlier records with time deviations greater than 2 ms, were deleted. The verified data was vertically stacked, with the application of the seismic line geometry. To recover information about the layers nearest to the ground surface, classical MASW analysis was conducted [1, 25, 26, 28]. Dispersion curves for 100 regularly spaced shots were obtained and inverted by applying the genetic algorithm [29] (Eiben et al. 1994). During the MASW processing procedure, the raw data was filtered using the band-pass filter in the range 3 to 60 Hz. Moreover, automated gain control correction and the manual muting of refraction was applied to improve the S/N ratio. For correct tracing of surface waves, 50 channels for every shot point were selected, as an optimal range where energy was visible. 1D VS models were merged by kriging interpolation and with the assumption that each location in the 2D profile is determined to be in the centre of the spread of the single shot modelling (Figure 3A). Uncertainty estimation (Figure 3B) for the results obtained was based on a statistical comparison between inversion results. However 1D and 2D uncertainties are not the same [30, 31]. In simple cases, a proposed approximation is sufficient. To achieve 2D VS uncertainty decay in the subsurface model, a similar kriging interpolation method was applied to the results. In the final model (Figure 3A), the authors were able to recognise a dipping layer, with a high VS velocity contrast. The results obtained by the MASW method were recalculated to VP by the genetic algorithm (with corresponding uncertainty information) and used in the seismic tomography stage of processing for further analysis [32]. The MASW modelling results provide useful information about low-velocity zones despite their significant uncertainty. Because classical First Arrival Seismic Tomography is blind to the presence of such structures [33], solving the methodological problem is essential to near-surface research. Moreover, the best possible recognition of the shallowest layers is essential for proper static and residual corrections in seismic reflection imaging. In the presented case study, however, MASW analysis proved that there was no low-velocity zone in the research area.
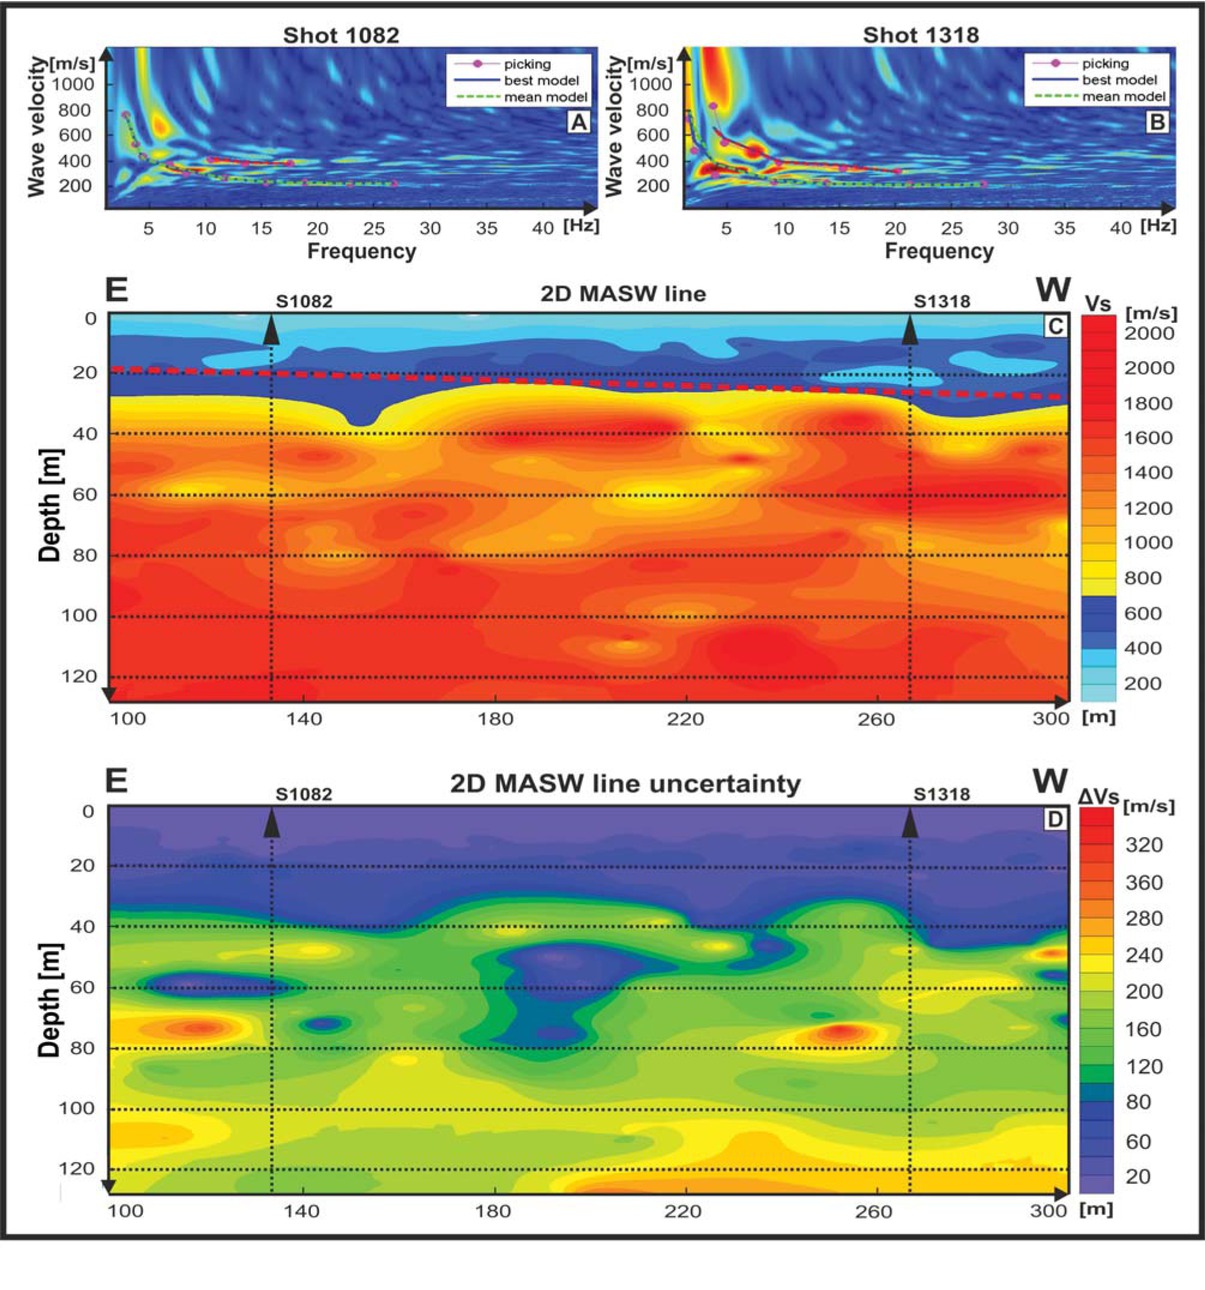
Results of the multichannel analysis of surface waves. To achieve the best possible data utilisation, 101 1D models were created and then interpolated to produce a 2D model (C). For the dataset under consideration: at each shot point, the fundamental and first higher-mode of Rayleigh wave dispersion was visible (A, B). To obtain a 2D model, single 1D models were interpolated. The final 2D model (C) revealed a high-velocity change, visible with a slight dip at 30 m under the surface. Panel (D) presents uncertainty analysis based on the misfit of curves during the inversion process, which revealed a fast degradation of the model precision with depth.
6 Seismic travel-time tomography analysis
Application of the MASW method as the first processing procedure, allowed the authors to receive information about the nearest subsurface. However, because of the high levels of uncertainty in the method, particularly the fast degradation of results with depth, the modelling of layers deeper than 20 to 30 m is ineffective in the presented case. Information about uncertainty in the deeper parts of the subsurface can be treated as boundary conditions in a more accurate method. Such approximations are very useful as a priori information to seismic travel time tomography. The results obtained by this method strongly depend on the starting model. This study presents a novel approach to utilising this information. By assuming that deviations in the results received from MASW limit the intervals of possible velocities, the authors created multiple (40 in total) starting models restricted by the results of the surface analysis method. For seismic tomography modelling, the authors used JIVE3D code [34], based on ray approximation. The starting model, based on MASW results, was further smoothed by including additional information about near-surface velocities from shallow refractions. As a result of seismic tomography modelling, the authors received a smooth velocity image, with the ray coverage shown in Figure 4, and statistically estimated the uncertainty (Figure 5) of the results to be similar to the method used by [35] Melendez et al. in Tomo3D code.
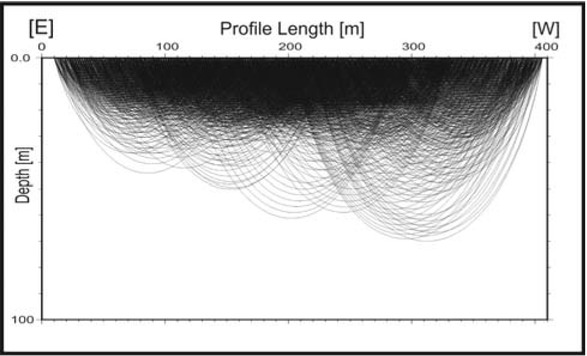
Ray coverage for the last iteration of tomographic inversion. Model is well resolved down to 30 m, and the maximum penetration depth is about 70 m.
![Figure 5 (A), Travel time tomography result, obtained with JIVE3D code, with uncertainty analysis (B) based on a modification of initial model introduced in Tomo3D [35]. Obtained results reveal a smooth gradient of velocity with depth and decrease of velocity towards the west. Uncertainty analysis displays high reliability of received model down to 50 m.](/document/doi/10.1515/geo-2019-0057/asset/graphic/j_geo-2019-0057_fig_005.jpg)
(A), Travel time tomography result, obtained with JIVE3D code, with uncertainty analysis (B) based on a modification of initial model introduced in Tomo3D [35]. Obtained results reveal a smooth gradient of velocity with depth and decrease of velocity towards the west. Uncertainty analysis displays high reliability of received model down to 50 m.
In the method proposed by [35] Melendez et al., multiple initial models are created and analysed using basic statistics. In this study, the best initial tomography model (obtained from inversion) was randomly modified in the range of uncertainty from previous MASW analysis. As mentioned above, 40 models were created with different velocities and gradients. For every obtained model, the same inversion path was applied. For all of the results obtained, a mean value (Figure 5A) and standard deviation (Figure 5B) was calculated. The travel-time tomography results obtained show higher accuracy down to a depth of 40 m (Figure 5B) when compared to the MASW method (Figure 3D). Moreover, possible dipping of the layers is also visible in the image (Figure 5A). Information received about horizontal velocities, and the uncertainty of the results was used in the velocity analysis of the seismic imaging, which is the final step of the multi-step seismic analysis. Even though only 70 m of the model were covered by the rays (Figure 4), the deeper velocities were obtained by extrapolation of the velocity field. When compared to seismic tomography, MASW results are more certain between a depth range of 20 to 50 m, with an average difference of 120 m/s. This almost corresponds to a 50% increase in model accuracy for that depth range, assuming that the VP to VS ratio is a factor of 1.7. However large this may appear to be, such an approximation for near surface data is effective. Moreover, the combination of results obtained from two different, but connected, physical phenomena increases the reliability of the velocity model. The results obtained from surface wave modelling are more certain in the utmost 10 m, with an estimated uncertainty of 20 m/s of VS, which is about 35 m/s of Vp assuming the Vp/Vs factor of 1.7.
In comparison, the uncertainty of seismic VP tomography is much larger (150 m/s) for that part of the model. However, when the results are compared directly, the average VP velocity recalculated from Vs for the first 10m of the model (with a ratio factor of 1.7) was 680 m/s, where the tomographic velocity average from the first breaks for that area was 750 m/s. If we assume an extreme value of VP/Vs ratio (of, say, 2.0), with an uncertainty of 35 m/s of Vs, then the results are comparable. For that reason, the authors decided to apply tomographic velocity to the reflection imaging.
7 Seismic imaging
There is a difficulty in applying seismic imaging to shallow results obtained from velocity analysis as in many cases no external data is available and so gathering any information about vertical velocities is problematic. The problem results from the presence of strong surface waves and refractions mixing with observed reflections and, as a result, the S/N ratio is low enough to disturb classical, semblance-
based velocity analysis. In the presented work,the authors used a classical image processing scheme [36] (Table 2).
Steps of data imaging.
| Nr. | Processing Step |
|---|---|
| 1 | Data quality control |
| 2 | Vertical Stacking |
| 3 | Geometry building |
| 4 | Static corrections |
| 5 | Data filtering and gain control |
| 6 | Deconvolution |
| 7 | NMO with tomographic velocity |
| 8 | Horizontal stacking |
| 9 | Depth conversion |
At every step of the processing, multiple parameter settings were tested. During the data quality control step, multiple “death” traces were removed, and the corrected polarity of the traces was recorded by the Reftek 130 Texan stations. Moreover, panel comparison of vertical stacking algorithms was conducted in order to receive the best possible signal correlation. Because there were two types of receiver station, a geometry database was created manually, to obtain residual and static corrections. To improve the S/N ratio, simple noise suppression based on 1D and 2D F-K filters was conducted, with later deconvolution. Instead of applying stand-alone semblance velocity analysis, a smooth tomographic velocity model with estimated uncertainties was used. It is worth noting that the semblance-based analysis applied to the GPB Belsk data-set before adding the information from external methods, was not working properly. In the case of difficult data (e.g. where it was difficult to distinguish between noise and possible reflections), the application of an external velocity field was the only solution in order to obtain useful results. Due to anisotropy, refraction velocities are much faster than stacking ones. In order to fit refraction velocities to the reflection seismic, Dix’ equation [37], and semblance analysis was used for correcting the data fit. As a quality factor of the velocity field, horizontal straightening was observed and analysed. The best results received from the depth-based, estimated velocity field (Table 3) presented a visible NMO correction (Figure 6).
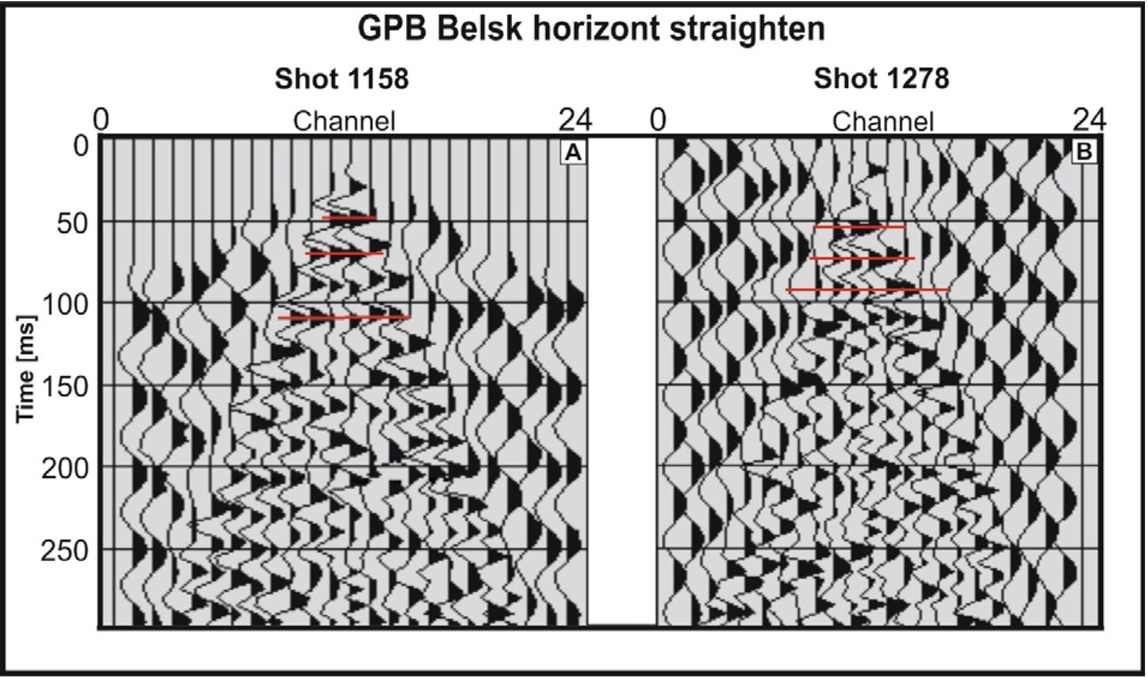
Application of the velocity model received from tomographic modelling to the reflection seismic analysis (NMO), allowing recognition of possible reflectors. Shot gathers in front of the profile (A), and the rear (B) reveal a straightening effect after application of the velocity model, which was impossible to obtain by the classic semblance analysis method.
Example of stacking velocities from the centre of the profile.
| Time [s] | Tomographic velocity [km/s] | Reflection velocity [km/s] | % of velocity |
|---|---|---|---|
| 0,00 | 0.75 | 0.75 | 100.00 |
| 25,00 | 0.95 | 0.95 | 100.00 |
| 50,00 | 1.14 | 1.14 | 100.00 |
| 75,00 | 1.32 | 1.32 | 100.00 |
| 100,00 | 1.49 | 1.34 | 90.00 |
| 125,00 | 1.66 | 1.49 | 90.00 |
| 150,00 | 1.82 | 1.55 | 85.00 |
| 175,00 | 1.98 | 1.58 | 80.00 |
| 200,00 | 2.15 | 1.72 | 80.00 |
| 225,00 | 2.32 | 1.74 | 75.00 |
| 250,00 | 2.49 | 1.74 | 70.00 |
| 275,00 | 2.66 | 1.86 | 70.00 |
| 300,00 | 2.83 | 1.84 | 65.00 |
| 325,00 | 3.00 | 1.80 | 60.00 |
| 350,00 | 3.16 | 1.90 | 60.00 |
| 375,00 | 3.33 | 2.00 | 60.00 |
| 400,00 | 3.50 | 2.10 | 60.00 |
| 425,00 | 3.67 | 2.20 | 60.00 |
| 450,00 | 3.84 | 2.30 | 60.00 |
| 475,00 | 4.01 | 2.40 | 60.00 |
Next, to the main velocity model, two disturbed velocity fields (faster and slower) were calculated, based on tomographic uncertainty. After applying an identical fitting procedure for all velocity fields, horizontal stacking, post-stack F-K filtering, deconvolution and time to depth conversion were carried out. As a result, the authors received the main seismic stack (Figure 5A) with two other deviation-based results. Comparison between images and manual picking of selected reflecting horizons, allowed us to estimate the difference in depth of the given reflections (Figure 7B). The authors were able to distinguish the main reflectors in the structure and estimate the uncertainty of those horizons in the depth domain (Figure 7A). Application of the tomographic velocity field, not only allowed the authors to solve the problem of correct velocity field estimation, but also resulted in additional information about results uncertainty in the depth domain that could easily be related to the real rock structures. In comparison with the classical approach to velocity analysis for NMO and TTD migration, the approach presented here allowed for fast recognition of the velocity field. However, only extrapolated values from the tomographic field were used for imaging depths greater than 50 m because it was properly recognised that the shallow subsurface allowed for correct correlations of the velocity field with possible reflectors at greater depths.
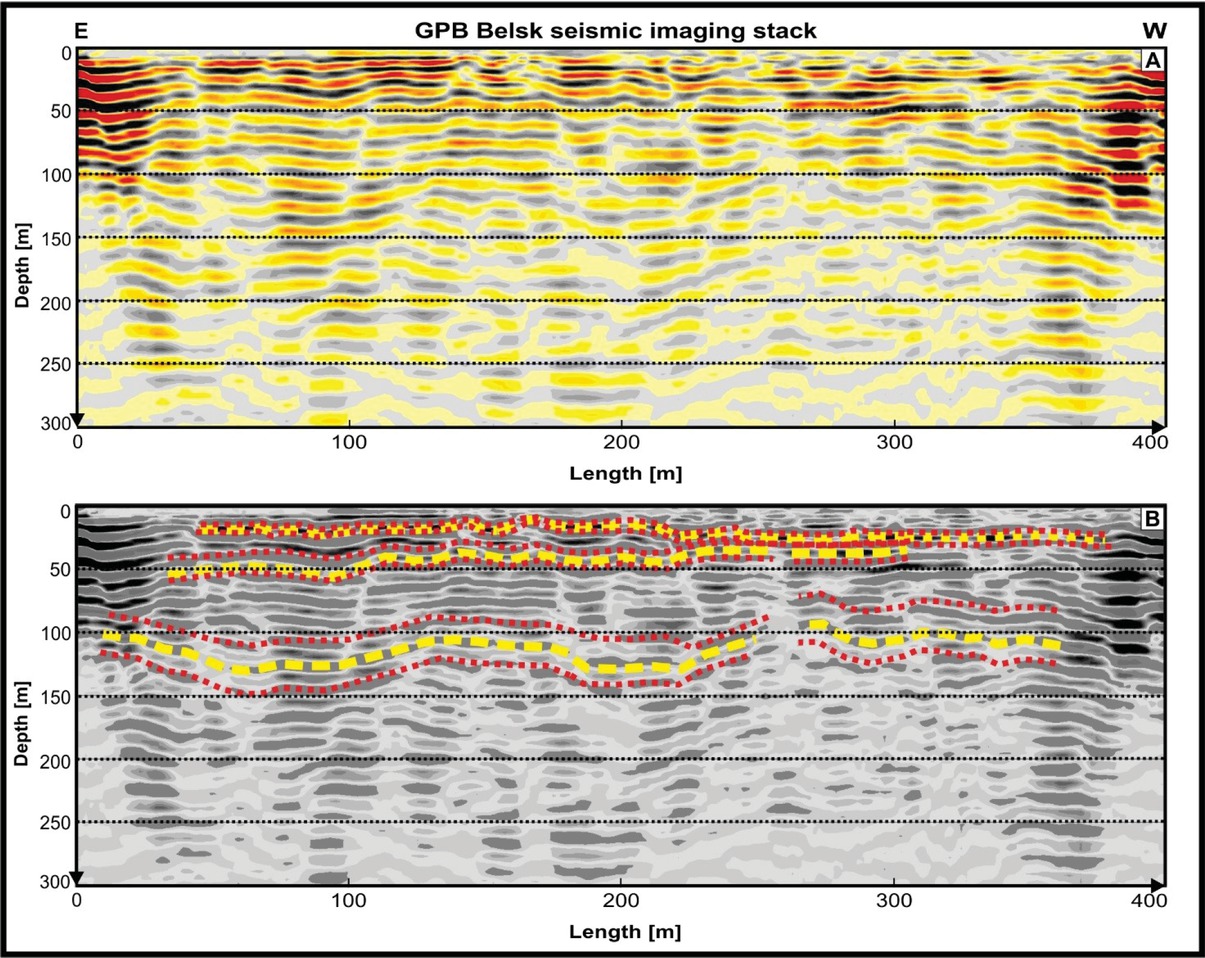
(A) Seismic stack obtained after data imaging of the GPB Belsk profile. Application of the velocity model received from external methods allowed correct stacking of the data, which is visible for the shallow structures, down to 50 m depth. Since tomographic methods allow for uncertainty estimation, stacks with extreme models allowed us to estimate the uncertainty of recognised reflectors (B).
8 Discussion of the results
In comparison to the standard processing flow that uses only a single data type, the methodology presented in this paper provides a better and more complete result. The main idea of every data assimilation procedure is to utilise every bit of additional information. This in all cases will lead to increases in the final result quality. As proved in the article [22], propagation of uncertainty between methods allows obtaining detailed information about the in-depth structures, even fora difficult sub-salt structures. Even in the industrial seismic profiling, where both high-resolution data, and geophysical information from borehole soundings are available, estimation of the results uncertainty is extremely useful for a correct correlation of the geophysical and geological information. The migration of the information between methods allows tightening the possible space of solutions and limits the interpretation errors. However, in the near-surface experiments, obtaining a certain geological model of the subsurface is more complicated.
In most cases, shallow experiments are conducted in places where no geophysical (e.g. VSP profiling) or geological information from boreholes is available. Even if they exist, in most cases usability of such data is limited to the final geological interpretation of the upper-most part of the seismic image. Moreover, the biggest problem with the estimation of the velocity field for seismic migration is unresolved. Adding the fact, that due to the scale of survey targets, all topographic and residual shifts have a much higher impact on the final result, the situation seems to be unresolvable. The methodology presented in work is a solution to those problems. Because of relatively shallow geological structures, estimation of migration velocity by the refraction methods is effective. To overcome the strong dependence of the final result on the initial model, the MASW and LVL based model was used. In addition to limiting the space of solution, such approach considers nearest surface effects, that are beyond the resolution of travel time tomography. In this paper, the results obtained by the MASW method correlate well with the tomographic solution. As presented, the application of such methodology requires information about result uncertainty, on each step of the processing. That information, not only improve the overall result’s quality but also allow for correct migration of the data between the methods. The seismic stack (Figure 7), where the increase of the horizon uncertainty with depth is visible, explicitly presents the need for such estimations. In the presented case study, the Quaternary post-glacial Pleistocene sediments were the main imaging target. All possible reflections are connected with structures formed during that period. The correlation of our results, with the data from shallow boreholes, especially the deepest ones in “Mała Wieś” and“ Stara Wieś” validated, that the thickness of Quaternary sediments is much higher than 100 meters because there are no strong reflections from larger depths on the seismic stack. Any deeper investigation requires more powerful seismic source and additional acquisition channels for better recording of the post-critical reflections. In the presented methodology, many assumptions which cannot be used for more complex geology was applied. In cases of rough geology, the joint 2D inversion of MASW results should be applied, instead of the interpolation of single 1D models.
Presented case study proves that the applied methodology was effective, as should be easily applied in similar near-surface studies. As a cost and time effective method, presented procedure greatly simplifies and improves the results of near-surface surveys without the need for additional data. In addition to modern high-resolution seismic surveys [39, 40], presented methodology increases the overall quality of the final result. Additionally, the presented methodology can be used in other scales, where layer striping approach is used, for example in industrial scale [41], or even lithospheric research [42]. For further improvement of the results of the presented methodology, the information from additional geophysical methods, based on the different physical parameter (e.g. ERT, GPR) can be used [43]. The scalability of the technique, to other scales, makes it cost and time efficient, and allows to solve multiple processing problems. Additional uncertainty parameter of the final seismic image will greatly simplify the interpretation, which is extremely useful not only in small scale experiments but also industrial-scale projects.
9 Conclusions
This work presents an uncertainty-based, multi-step seismic analysis that allows us to obtain final results with estimated reliability. Direct use of the uncertainty information between the methods allowed the authors to restrict the area of possible solutions for the consecutive methods. That approach leads to final results which showed detailed information about the subsurface through seismic imaging. Moreover, the application of external methods to the reflection seismic, allowed us to find solutions where the classical approach to velocity analysis was ineffective. The case study presented by the authors reveals that propagation of the information about model uncertainty should be treated equally in the results. The assumption that deviations in the results received from previous methods limit the possible solution range of more accurate consecutive ones leads to more certain results. Moreover, that approach allowed simplified processing of the data because the final model from the previous analysis is treated as a starting point for subsequent ones. The presented methodology allows us to overcome the problems that arise in near-surface surveys that are unsolvable using classical processing tools. In the presented study, an example of finding the velocity field for seismic imaging allowed for recovery information about reflection horizons in the dataset. The methodology presented by the authors is correct only if information about uncertainty is estimated and treated with caution. This approach allows correct, partial results transfer between methods,which results in less processing mistakes and a correct final solution. A similar methodology could be used for solving other special geophysical problems.
Acknowledgement
This research was funded by the National Science Centre, Poland (NCN) Grant UMO-2015/19/B/ST10/01833 and part of the work was supported within statutory activity No. 3841/E-41/S/2018 of the Ministry of Science and Higher Education of Poland.
References
[1] Park, C. B., Miller, R. D., Xia, J., (1999). Multichannel analysis of surface waves: Geophysics 64(3), 800-808. Report 2005-22.10.1190/1.1444590Suche in Google Scholar
[2] Miller, R. D., Xia, J., Park, C. B., Ivanov, J., (1999). Using MASW to map bedrock in Olathe, Kansas [Exp. Abs.]: Soc. Explor. Geophys 433-436.Suche in Google Scholar
[3] Stokoe, K. H. II, Wright, S. G., Bay, J. A., Roesset, J. M., (1994). Characterization of geotechnical sites by SASW method, Geophysical Characterization of Sites Oxford & IBH Publishing, New Delhi, India, pp. 15-25.Suche in Google Scholar
[4] Ezersky, M., Legchenko, A., (2015). Mapping of Salt Consolidation and Permeability Using MASW Method in the Dead Sea Sinkhole Problem., Engineering Geology for Society and Territory - Volume 5. Springer.10.1007/978-3-319-09048-1_89Suche in Google Scholar
[5] Fokin, I.V., Basakina, I.M., Kapustyan, N.K., Tikhotskii, S. A., Schur, D. Yu., (2012). Application of travel-time seismic tomography for archaeological studies of building foundations and basements, Seismic Instruments (2012) 48: 185. https://doi.org/10.3103/S074792391202003X10.3103/S074792391202003XSuche in Google Scholar
[6] Bruno, P. P., Improta L., Castiello A., Villan F., Montone P., (2010). The Vallo di Diano Fault System: New evidence for an active range-bounding fault in southern Italy using shallow, high-resolution seismic profiling, Bull. Seismol. Soc. Am. 100, no. 2, doi: 10.1785/0120090210.10.1785/0120090210Suche in Google Scholar
[7] Dolan, J. F., Pratt, T. L., (1997). High-resolution seismic reflection profiling of the Santa Monica fault zone, West Los Angeles, California, Geophys. Res. Lett 24 (16), 2051–2054.10.1029/97GL01940Suche in Google Scholar
[8] Uhlemann, S., Hagedorn, S., Dashwood, B., Maurer, H., Gunn, D., Dijkstra, T., Chambers, J., (2016). Landslide characterization using P- and S-wave seismic refraction tomography — the importance of elastic moduli, Journal of Applied Geophysics 134, 64-76.10.1016/j.jappgeo.2016.08.014Suche in Google Scholar
[9] Adelinet, M., Domínguez, C., Fortin, J., Violette, S., (2018). Seismic-refraction field experiments on Galapagos Islands: A quantitative tool for hydrogeology, Journal of Applied Geophysics 148, 139-151.10.1016/j.jappgeo.2017.10.009Suche in Google Scholar
[10] Gallardo, L. A., Max, A., Meju, M. A., (2003). Characterization of heterogeneous near-surface materials by joint 2D inversion of dc resistivity and seismic data, Geophys. Res. Lett 30(13), 1658, doi:10.1029/2003 GL017370, 2003.10.1029/2003GL017370Suche in Google Scholar
[11] Gallardo, L. A., Fontes, S. L., Meju, M. A., Buonora, M. P., de Lugao, P. P., (2012). Robust geophysical integration through structure-coupled joint inversion and multispectral fusion of seismic reflection, magnetotelluric, magnetic, and gravity images: Example from Santos Basin, offshore Brasil: Geophysics 77(5), 237–251, doi: https://doi.org/10.1190/GEO2011-0394.110.1190/geo2011-0394.1Suche in Google Scholar
[12] Colombo, D., de Stefano, M., (2007). Geophysical modelling via simultaneous joint inversion of seismic, gravity and electromagnetic data: Application to pre-stack depth imaging: The Leading Edge 26, 326–331, doi: https://doi.org/10.1190/1.271505710.1190/1.2715057Suche in Google Scholar
[13] de Stefano M., Andreasi, F. G., Re, S., Virgilio, M., Snyder, S. F., (2011). Multiple-domain, simultaneous joint inversion of geophysical data with application to subsalt imaging, Geophysics, 76(3), R69–R80, doi: https://doi.org/10.1190/1.355465210.1190/1.3554652Suche in Google Scholar
[14] Doetsch, J., Linde, N., Coscia, I., Greenhalgh, S. A., Green, A. G., (2010). Zonation for 3D aquifer characterization based on joint inversions of multimethod cross-hole geophysical data Geophysics 75(6), G53–G64, doi: https://doi.org/10.1190/1.349647610.1190/1.3496476Suche in Google Scholar
[15] Gao, G., Abubakar, A., Habashy, T. M., Pan, G., (2012). Joint petrophysical inversion of electromagnetic and full-waveform seismic data: Geophysics, 77(3), 3–18, doi: https://doi.org/10.1190/GEO2011-0157.110.1190/geo2011-0157.1Suche in Google Scholar
[16] Vozoff, K., Jupp, D. L. B., (1975). Joint inversion of geophysical data: Geophysical Journal of the Royal Astronomical Society 42, 977–991.10.1111/j.1365-246X.1975.tb06462.xSuche in Google Scholar
[17] Marciniak, A., (2017). Seismic tomography and MASW as a tool improving Imaging, MSc Thesis, Department of Earth Sciences, University of Silesia.Suche in Google Scholar
[18] Giustiniani, M., Tinivella, U., Accaino, F., (2010). P and S reflection and P refraction: An integration for characterising shallow subsurface, Journal of Applied Geophysics 71(4), 149-156.10.1016/j.jappgeo.2010.06.004Suche in Google Scholar
[19] Wu, Y., Nakagawa, S., Kneafsey, T. J., Dafflon, B., Hubbard, S., (2017). Electrical and seismic response of saline permafrost soil during freeze-thaw transition, Journal of Applied Geophysics 146, 16-26.10.1016/j.jappgeo.2017.08.008Suche in Google Scholar
[20] Wellmann, J. F., Regenauer-Lieb, K., (2012). Uncertainties have a meaning: Information entropy as a quality measure for 3-D geological models: Tectonophysics 526, 207–216.10.1016/j.tecto.2011.05.001Suche in Google Scholar
[21] Caers, J., (2011). Modelling Uncertainty in the Earth Sciences, John Wiley & Sons Ltd, Chichester, UK (June 2011).10.1002/9781119995920Suche in Google Scholar
[22] Majdański, M., Trzeciak, M., Gaczyński, E., et al. (2016). Seismic velocity estimation from post-critical wide-angle reflections in layered structures, Stud. Geophys. Geod. 60: 565. https://doi.org/10.1007/s11200-015-1268-010.1007/s11200-015-1268-0Suche in Google Scholar
[23] Hayward, N., Andrew, J. S., Calvert, A. J., (2007). Seismic reflection and tomographic velocity model constraints on the evolution of the Tofino forearc basin, British Columbia, Geophysical Journal International 168(2), 1 February, 634–646. https://doi.org/10.1111/j.1365-246X.2006.03209.x10.1111/j.1365-246X.2006.03209.xSuche in Google Scholar
[24] Stupnicka, E., (2007), Geologia regionalna Polski. Wydawnictwa Geologiczne, Warszawa, ISBN 978-83-235-1787-0Suche in Google Scholar
[25] Rix, G. J., Leipski, E. A., (1991). Accuracy and resolution of surface wave inversion. In: Bhatia, S. K., and Blaney, G. W., Eds. Recent advances in instrumentation, data acquisition and testing in soil dynamics: Am. Soc. Civil Eng 17–32.Suche in Google Scholar
[26] McMechan, G. A., Yedlin, M. J., (1981). Analysis of dispersive waves by wave field transformation: Geophysics 46, 869–874.10.1190/1.1441225Suche in Google Scholar
[27] Park, C. B., Miller, R. D., (2005). Seismic characterization of wind turbine sites near Lawton, Oklahoma, by the MASW method: Kansas Geological Survey Open-file.Suche in Google Scholar
[28] Islam, T., Chik, Z., Mustafa, M. M., Sanusi, H., (2013). Faster 2-D representation of geotechnical characteristics using MASW method: Faster tomography in MASW. Environmental Earth Sciences 70(1), 329-335. DOI: 10.1007/s12665-012-2130-0.10.1007/s12665-012-2130-0Suche in Google Scholar
[29] Eiben, A. E., Raue, P. E., Ruttkay, Z., (1994). Genetic algorithms with multi-parent recombination. Proceedings of the third international conference on parallel problem solving from nature (PPSN), Springer.10.1007/3-540-58484-6_252Suche in Google Scholar
[30] Fernández-Martínez, J. L., Xu, S., Sirieix, C., Fernández-Muniz, Z., Riss, J., (2017). Uncertainty analysis and probabilistic segmentation of electrical resistivity images: the 2D inverse problem. Geophysical Prospecting 65, 112-130. doi: 10.1111/1365-2478.12559.10.1111/1365-2478.12559Suche in Google Scholar
[31] Tompkins, M. J., Fernández-Martínez, J. L., Alumbaugh, D. L., Mukerji, T., (2011). Scalable uncertainty estimation for nonlinear inverse problems using parameter reduction, constraint mapping, and geometric sampling: Marine controlled-source electromagnetic examples Geophysics 76(4),10.1190/1.3581355Suche in Google Scholar
[32] Lee, M.W., (2003). Velocity Ratio and its Application to Predicting Velocities, U.S. Geological Survey Bulletin 2197Suche in Google Scholar
[33] Nolet, G., (2008). A Breviary of Seismic Tomography: Imaging the Interior of the Earth and Sun. Cambridge: Cambridge University Press. doi: 10.1017/CBO9780511984709.10.1017/CBO9780511984709Suche in Google Scholar
[34] Hobro, J. W. D., Singh, S., (1999). Joint interface and velocity estimation in three dimensions (JIVE3D), LITHOS science report, Department of Earth Sciences, University of Cambridge.Suche in Google Scholar
[35] Meléndez, A., Korenaga, J., Sallares, V., Miniussi, A., Ranero, C., (2015). TOMO3D: 3-D joint refraction and reflection travel-time tomography parallel code for active-source seismic data– synthetic test. Geophysical Journal International 203, 158-174. 10.1093/gji/ggv292.10.1093/gji/ggv292Suche in Google Scholar
[36] Yilmaz, Ö,. (2001) Seismic Data Analysis: Processing, Inversion, and Interpretation of Seismic Data, Society of Exploration Geophysicists, ISBN: 978-1-56080-158-010.1190/1.9781560801580Suche in Google Scholar
[37] Dix, C. H., (1955). Seismic velocities from surface measurements, Geophysics, 20, 68–86.10.1190/1.1438126Suche in Google Scholar
[38] Lingli, H., Jianhang, Z., (2011). Velocity update using high-resolution tomography in Santos Basin, Brazil, SEG Technical Program Expanded Abstracts 2011 January 2011, 3974-3978.Suche in Google Scholar
[39] Bruno, P., (2015). High-resolution seismic imaging in complex environments: a comparison among Common Reflection Surface stack; Common Midpoint stack; and pre-stack depth migration at the Ilva - Bagnoli brownfield site, Campi Flegrei, Italy. Geophysics. 80. 10.1190/GEO2014-0488.1.10.1190/geo2014-0488.1Suche in Google Scholar
[40] Bruno, P., Castiello, A., (2009). High-resolution onshore seismic imaging of complex volcanic structures: An example from Vulcano Island, Italy. Journal of Geophysical Research. 114. 10.1029/2008JB005998.10.1029/2008JB005998Suche in Google Scholar
[41] Malinowski, M., Guterch, A., Narkiewicz, M., Petecki, Z., Janik, T., Środa, P., Maksym, A., Probulski, J., Grad, M., Czuba, W., Gaczyński, E., Majdański, M., Jankowski, L., (2015). Geophysical constraints on the crustal structure of the East European Platform margin and its foreland based on the POLCRUST-01 deep reflection seismic profile. Tectonophysics, 653, 109-126, doi: 10.1016/j.tecto.2015.03.029.10.1016/j.tecto.2015.03.029Suche in Google Scholar
[42] Majdański, M., Kozlovskaya, E., Świeczak, M., Grad, M., (2009).Interpretation of geoid anomalies in the contact zone between the East European Craton and the Palaeozoic Platform - I. Estimation of effects of density inhomogeneities in the crust on geoid undulations. Geophysical Journal International, 177, 321-33310.1111/j.1365-246X.2008.03954.xSuche in Google Scholar
[43] Marciniak A., Owoc B., Wawrzyniak T., Nawrot A., Glazer M., Osuch M., Dobiński W., Majdański M., (2019). Recognition of the varying permafrost conditions in the SW Svalbard by multiple geophysical methods, EGU2019-377 | CR4.1/GM9.6, Conference AbstractSuche in Google Scholar
© 2019 A. Marciniak et al., published by De Gruyter
This work is licensed under the Creative Commons Attribution 4.0 Public License.
Artikel in diesem Heft
- Regular Articles
- 2D Seismic Interpretation of the Meyal Area, Northern Potwar Deform Zone, Potwar Basin, Pakistan
- A new method of lithologic identification and distribution characteristics of fine - grained sediments: A case study in southwest of Ordos Basin, China
- Modified Gompertz sigmoidal model removing fine-ending of grain-size distribution
- Diagenesis and its influence on reservoir quality and oil-water relative permeability: A case study in the Yanchang Formation Chang 8 tight sandstone oil reservoir, Ordos Basin, China
- Evaluation of AHRS algorithms for Foot-Mounted Inertial-based Indoor Navigation Systems
- Identification and evaluation of land use vulnerability in a coal mining area under the coupled human-environment
- Hydrocarbon Generation Potential of Chia Gara Formation in Three Selected Wells, Northern Iraq
- Source Analysis of Silicon and Uranium in uranium-rich shale in the Xiuwu Basin, Southern China
- Lithologic heterogeneity of lacustrine shale and its geological significance for shale hydrocarbon-a case study of Zhangjiatan Shale
- Characterization of soil permeability in the former Lake Texcoco, Mexico
- Detrital zircon trace elements from the Mesozoic Jiyuan Basin, central China and its implication on tectonic transition of the Qinling Orogenic Belt
- Turkey OpenStreetMap Dataset - Spatial Analysis of Development and Growth Proxies
- Morphological Changes of the Lower Ping and Chao Phraya Rivers, North and Central Thailand: Flood and Coastal Equilibrium Analyses
- Landscape Transformations in Rapidly Developing Peri-urban Areas of Accra, Ghana: Results of 30 years
- Division of shale sequences and prediction of the favorable shale gas intervals: an example of the Lower Cambrian of Yangtze Region in Xiuwu Basin
- Fractal characteristics of nanopores in lacustrine shales of the Triassic Yanchang Formation, Ordos Basin, NW China
- Selected components of geological structures and numerical modelling of slope stability
- Spatial data quality and uncertainty publication patterns and trends by bibliometric analysis
- Application of microstructure classification for the assessment of the variability of geological-engineering and pore space properties in clay soils
- Shear failure modes and AE characteristics of sandstone and marble fractures
- Ice Age theory: a correspondence between Milutin Milanković and Vojislav Mišković
- Are Serbian tourists worried? The effect of psychological factors on tourists’ behavior based on the perceived risk
- Real-Time Map Matching: A New Algorithm Integrating Spatio-Temporal Proximity and Improved Weighted Circle
- Characteristics and hysteresis of saturated-unsaturated seepage of soil landslides in the Three Gorges Reservoir Area, China
- Petrographical and geophysical investigation of the Ecca Group between Fort Beaufort and Grahamstown, in the Eastern Cape Province, South Africa
- Ecological risk assessment of geohazards in Natural World Heritage Sites: an empirical analysis of Bogda, Tianshan
- Integrated Subsurface Temperature Modeling beneath Mt. Lawu and Mt. Muriah in The Northeast Java Basin, Indonesia
- Go social for your own safety! Review of social networks use on natural disasters – case studies from worldwide
- Forestry Aridity Index in Vojvodina, North Serbia
- Natural Disasters vs Hotel Industry Resilience: An Exploratory Study among Hotel Managers from Europe
- Using Monarch Butterfly Optimization to Solve the Emergency Vehicle Routing Problem with Relief Materials in Sudden Disasters
- Potential influence of meteorological variables on forest fire risk in Serbia during the period 2000-2017
- Controlling factors on the geochemistry of Al-Shuaiba and Al-Mejarma coastal lagoons, Red Sea, Saudi Arabia
- The Influence of Kaolinite - Illite toward mechanical properties of Claystone
- Two critical books in the history of loess investigation: ‘Charakteristik der Felsarten’ by Karl Caesar von Leonhard and ‘Principles of Geology’ by Charles Lyell
- The Mechanism and Control Technology of Strong Strata Behavior in Extra-Thick Coal Seam Mining Influenced by Overlying Coal Pillar
- Shared Aerial Drone Videos — Prospects and Problems for Volunteered Geographic Information Research
- Stable isotopes of C and H in methane fermentation of agriculture substrates at different temperature conditions
- Prediction of Compression and Swelling Index Parameters of Quaternary Sediments from Index Tests at Mersin District
- Detection of old scattered windthrow using low cost resources. The case of Storm Xynthia in the Vosges Mountains, 28 February 2010
- Remediation of Copper and Zinc from wastewater by modified clay in Asir region southwest of Saudi Arabia
- Sedimentary facies of Paleogene lacustrine dolomicrite and implications for petroleum reservoirs in the southern Qianjiang Depression, China
- Correlation between ore particle flow pattern and velocity field through multiple drawpoints under the influence of a flexible barrier
- Atmospheric refractivity estimation from AIS signal power using the quantum-behaved particle swarm optimization algorithm
- A geophysical and hydro physico-chemical study of the contaminant impact of a solid waste landfill (swl) in King Williams’ Town, Eastern Cape, South Africa
- Landscape characterization using photographs from crowdsourced platforms: content analysis of social media photographs
- A Study on Transient Electromagnetic Interpretation Method Based on the Seismic Wave Impedance Inversion Model
- Stratigraphy of Architectural Elements of a Buried Monogenetic Volcanic System
- Variable secondary porosity modeling of carbonate rocks based on μ-CT images
- Traditional versus modern settlement on torrential alluvial fans considering the danger of debris flows: a case study of the Upper Sava Valley (NW Slovenia)
- The Influence of Gangue Particle size and Gangue Feeding Rate on Safety and Service Life of the Suspended Buffer’s Spring
- Research on the Transition Section Length of the Mixed Workface Using Gangue Backfilling Method and Caving Method
- Rainfall erosivity and extreme precipitation in the Pannonian basin
- Structure of the Sediment and Crust in the Northeast North China Craton from Improved Sequential H-k Stacking Method
- Planning Activities Improvements Responding Local Interests Change through Participatory Approach
- GIS-based landslide susceptibility mapping using bivariate statistical methods in North-western Tunisia
- Uncertainty based multi-step seismic analysis for near-surface imaging
- Deformation monitoring and prediction for residential areas in the Panji mining area based on an InSAR time series analysis and the GM-SVR model
- Statistical and expert-based landslide susceptibility modeling on a national scale applied to North Macedonia
- Natural hazards and their impact on rural settlements in NE Romania – A cartographical approach
- Rock fracture initiation and propagation by mechanical and hydraulic impact
- Influence of Rapid Transit on Accessibility Pattern and Economic Linkage at Urban Agglomeration Scale in China
- Near Infrared Spectroscopic Study of Trioctahedral Chlorites and Its Remote Sensing Application
- Problems with collapsible soils: Particle types and inter-particle bonding
- Unification of data from various seismic catalogues to study seismic activity in the Carpathians Mountain arc
- Quality assessment of DEM derived from topographic maps for geomorphometric purposes
- Remote Sensing Monitoring of Soil Moisture in the Daliuta Coal Mine Based on SPOT 5/6 and Worldview-2
- Utilizing Maximum Entropy Spectral Analysis (MESA) to identify Milankovitch cycles in Lower Member of Miocene Zhujiang Formation in north slope of Baiyun Sag, Pearl River Mouth Basin, South China Sea
- Stability Analysis of a Slurry Trench in Cohesive-Frictional Soils
- Integrating Landsat 7 and 8 data to improve basalt formation classification: A case study at Buon Ma Thuot region, Central Highland, Vietnam
- Assessment of the hydrocarbon potentiality of the Late Jurassic formations of NW Iraq: A case study based on TOC and Rock-Eval pyrolysis in selected oil-wells
- Rare earth element geochemistry of sediments from the southern Okinawa Trough since 3 ka: Implications for river-sea processes and sediment source
- Effect of gas adsorption-induced pore radius and effective stress on shale gas permeability in slip flow: New Insights
- Development of the Narva-Jõesuu beach, mineral composition of beach deposits and destruction of the pier, southeastern coast of the Gulf of Finland
- Selecting fracturing interval for the exploitation of tight oil reservoirs from logs: a case study
- A comprehensive scheme for lithological mapping using Sentinel-2A and ASTER GDEM in weathered and vegetated coastal zone, Southern China
- Sedimentary model of K-Successions Sandstones in H21 Area of Huizhou Depression, Pearl River Mouth Basin, South China Sea
- A non-uniform dip slip formula to calculate the coseismic deformation: Case study of Tohoku Mw9.0 Earthquake
- Decision trees in environmental justice research — a case study on the floods of 2001 and 2010 in Hungary
- The Impacts of Climate Change on Maximum Daily Discharge in the Payab Jamash Watershed, Iran
- Mass tourism in protected areas – underestimated threat? Polish National Parks case study
- Decadal variations of total organic carbon production in the inner-shelf of the South China Sea and East China Sea
- Hydrogeothermal potentials of Rogozna mountain and possibility of their valorization
- Postglacial talus slope development imaged by the ERT method: comparison of slopes from SW Spitsbergen, Norway and Tatra Mountains, Poland
- Seismotectonics of Malatya Fault, Eastern Turkey
- Investigating of soil features and landslide risk in Western-Atakent (İstanbul) using resistivity, MASW, Microtremor and boreholes methods
- Assessment of Aquifer Vulnerability Using Integrated Geophysical Approach in Weathered Terrains of South China
- An integrated analysis of mineralogical and microstructural characteristics and petrophysical properties of carbonate rocks in the lower Indus Basin, Pakistan
- Applicability of Hydrological Models for Flash Flood Simulation in Small Catchments of Hilly Area in China
- Heterogeneity analysis of shale reservoir based on multi-stage pumping data