Integrating Landsat 7 and 8 data to improve basalt formation classification: A case study at Buon Ma Thuot region, Central Highland, Vietnam
-
Ngo Van Liem
 ,
Dang Van Bao
,
Dang Van Bao

Abstract
Cenozoic basalt regions contain various natural resources that can be used for socio-economic development. Different quantitative and qualitative methods have been applied to understand the geological and geomorphological characteristics of basalt formations. Nowadays the integration of remote sensing and geographic information systems (GIS) has become a powerful method to distinguish geological formations. In this paper, authors combined satellite and fieldwork data to analyze the structure and morphology of highland geological formations in order to distinguish two main volcanic eruption episodes. Based on remote sensing analysis in this study, different spectral band ratios were generated to select the best one for basalt classification. Lastly, two spectral combinations (including band ratios 4/3, 6/2, 7/4 in Landsat 8 and 3/2, 5/1, 7/3 in Landsat 7) were chosen for the Maximum Likelihood classification. The final geological map based on the integration of Landsat 7 and 8 outcomes shows precisely the boundary of the basalt formations with the accuracy up to 93.7%. This outcome contributed significantly to the correction of geological maps. In further studies, authors suggest the integration of Landsat 7 and 8 data in geological studies and natural resource and environmental management at both local and regional scales.
1 Introduction
As the largest Cenozoic basalt region in Indochina, the three main basalt eruptive episodes in Vietnam occurred respectively in the Miocene, Pliocene and Pleistocene [1, 2], with the area of more than 25,000 km2 and depth of from 5 to 500 m [1, 3, 4, 5]. Cenozoic basalt regions can provide plenty of natural resources such as basalt soils for agricultural and forestry development [6, 7], bauxite sources [8, 9] and various geological heritages [10] for human well-being. Interestingly, the distribution of these three phases significantly affects land use planning and socio-economic development at both local and regional scales [9, 11, 12, 13]. However, the physical and chemical characteristics of basalt have been only analyzed at plot scales [14, 15]; while their areal distribution has been only mapped at 1: 250,000 scale in many countries [16, 17, 18], instead of at local scales because of data scarcity [19, 20].
In addition to traditional methods such as radiometric dating and geomorphological description [14, 15, 21], the integration between remote sensing and geographical information system (GIS) has become a potential tool to study and explain the history of geological development in volcanic regions [22, 23, 24, 25, 26]. Nowadays, modern sensors integrated satellites and aerial vehicles can be used freely for geological analysis at different scales, such as at national scales based on MODIS data with the low resolution from 500 m to 1 km [27] and at local/regional scales based on Sentinel-2 and unmanned aerial vehicles with the high resolution from 5 m to 10 m [28, 29]. Additionally, multi-spectral remote sensing bands (visible, infra-red and near-infrared spectra) are powerful data to collect, analyze and process physical properties, soil quality and geological characteristics [30]. As spaceborne moderate-resolution data, the Landsat imageries have been applied for decades in geology for interpretation of hydrothermal alteration, lithological discrimination, and tectonic setting [22, 31, 32, 33, 34]. In order to transform spectral data to useful information/data, different innovative methods such as principal component analysis, frequency analysis, the color combination have been tested successfully in the geological and geomorphological analysis [35, 36, 37, 38]. However, the use of the above methods to distinguish basalt phases has commonly resulted in a low accuracy in basalt rock classification.
As a solution, multiple ancillary data with texture information, such as DEM and geomorphic characteristics can be integrated with multispectral imagery to improve the basalt classification formed in the Pliocene and Pleistocene periods. Authors chose Buon Ma Thuot city in Vietnam and its surrounding region as a pilot case to investigate the potential use of Landsat 7 and Landsat 8 in the combination with GIS for basalt geological classification. Based on the remote sensing, GIS, structural, geometric and morphometric analysis and field survey data, this study aims to identify the location of volcanic eruptions, basalt distribution, and initial observations of different phases of volcanic activity. The size of basalt distribution was mapped, calibrated and standardized. Additionally, different volcanic eruptions were also interpreted. The interpretation of the origins, mechanisms and distributions of basalt soils and areas of bauxite concentration could be valuable to the geo-heritage and socioeconomic development, especially in the generation of lava caves, craters, waterfalls, lakes, columnar basalts, mines and mineral springs formed by volcanic activities [10]. The study not only has an important technical value and economic significance to improve basalt phase classification in (Central) Highland of Vietnam, but also has practical significance for mapping and editing geological maps in basalt areas.
2 Case study
The selected study region is located in the bordering areas of two provinces of Dak Lak and Dak Nong, Vietnam. The area in Dak Lak province includes Buon Ma Thuot city and part of the neighboring districts as Krong Ana, Cu Kuin, Krong Pac, Cu M’Ga and Buon Don districts. The area in Dak Nong province includes the eastern part of Cu Jut and the northeast of Krong No districts. The total research area is about 1,499 km2 (Figure 1).

Location map of study area.
The highest area in the northeast part reaches about 670 m, the lowest area in the western part reaches about 200 m (Figure 1). In the southern part, the mountain ranges have been significantly divided by endogenous and exogenous processes since the Jurassic epoch. Approximately 80.4% of the study area have a slight slope (lower than 8 degrees) and only 1.4%of the area have a high slope (higher than 25 degrees) (Figure 2). In the study area, some craters and waterfalls representing cycles of tectonic activity and volcanic eruption could be observed along the Serepok river which locate in the boundary between Dak Lak and Dak Nong provinces. In the Krong No area, some lava caves recently have provided various scientific knowledge and geo-heritage values for domestic and international tourists [10].

Morphometric maps: (a). Absolute elevation map; (b). Slope map; (c). Relative elevation map; (d). Drainage density map.
According to a modified geological map by scientists from VNU University of Sciences based on the geological map (scale of 1:200,000) published by the Department of Geology and Minerals of Vietnam (Figure 3), the area has a relatively simple geological structure with a large area covered by Neogene-Quaternary basalt rocks belonging to the Tuc Trung formation (notated as βN2-Q1tt in Figure 3) and the Xuan Loc formation (notated as

Geological map of Buon Ma Thuot and surrounding area (Adapted from the geological map generated by Department of Geology and Minerals.
The Jurassic formations include three types: Dray Linh (notated as J1đl in Figure 3), Ea Sup (notated as J2es in Figure 3) and La Nga (notated as J2ln in Figure 3). Quaternary sediment accumulation distributes along the river valleys, including fluvial sediments (notated as
Based on two field surveys in 2017 and 2018, most of residential areas in the study area are built on the Pliocene basalt formation. Because the Pliocene basalt formation distributes in flat lands with a thick weathering layer and soil of good quality, these lands are suitable for crop cultivation and residential activities. Therefore, authors included residential areas into the Pliocene basalt formation.
3 Database and methodology
3.1 Satellite selection
In order to select suitable remote sensing data for the basalt geological classification at local scales, some criterion was identified including free cost, a high number of spectral bands, available imageries taken in 2017 at medium resolution. Although ASTER and Sentinel-2 imageries provides freely a high potential to undertake semiquantitative mineral mapping, their multispectral bands have been taken in different resolutions with Landsat and not available in 2017. Whereas, Landsat imageries can be downloaded freely and updated monthly at the medium resolution of 30 m, excluding thermal infra-red band - band 10 and 11 for Landsat 8, and band 6 for Landsat 7, and band 8 - Panchromatic has a resolution of 100 m, 60 m and 15 m, respectively [39, 40]. In this study, authors proposed the use of both Landsat 7 and 8 for basalt classification processes. Both Landsat generations have the same spectral ranges, therefore it is easy to compare and combine their interpretation results. The use of the Landsat 7 can improve the accuracy in the Landsat 8 interpretation and vice versa (will be presented in section 4.1). Especially, both Landsat generations are capable of providing visible, near infra-red and shortwave infra-red data (Table 1). Each spectrum captures unique energy interactions with a surface, including rock structure. Therefore, the Landsat imageries were chosen as a useful data to distinguish lithology and identifying geological structural features [41, 42, 43, 44, 45].
The Landsat 7 (ETM+) and Landsat 8 (OLI) satellite images used in this study were provided for free by the UnitedStates Geological Survey (USGS). Compared to the Landsat 7, sensors in the Landsat 8 were improved in performance and reliability such as 12-bit quantized image sensors that produce better image quality than 8 bits of Landsat 7. Additionally, the Landsat 8 has 11 image bands taken 250 scenes a day, whereas the Landsat 7 only has 8 image bands. In this study, the Landsat 8 (OLI) image was taken on 17/02/2017 and Landsat 7 (ETM +) image was taken on 03/03/2017. According to the Table 1, the bands of the Landsat 8 have the same wavelength and spatial resolution as those of the Landsat 7. The integration between results calculated from Landsat 7 and 8 is commonly used to improve the accuracy in geological analysis [29, 46, 47, 48]. The integration process will be presented in next sections.
3.2 Band ratio selection
In satellite image analysis, the band ratios have been commonly used to (1) reduce illumination effects from the sun, slope and shadows [16, 49, 50]; (2) create a new spectral band to highlight the spectral differences associated with lithological and geological structures [51]. Some popular ratios were presented in Table 2. In order to highlight the structural differences and lithological characteristics, users can produce various combinations based on band ratios generated from one Landsat satellite image taken in a particular time and place [52, 53]. The ratio selection is necessary to distinguish main objectives with other fuzzy objectives. For instance, [52] have tested 28 color combinations based on the band ratios before selecting the best combination to identify and map the distribution of their lithological objectives in Malaysia.
In this study, authors carried out 21 different tests/combinations to select the best combination that can separate basalt phases in the study case. The visible channels for the geologic elements were selected to interpret lithological units, authors used RGB combinations between bands 6, 7 and 4 of Landsat 8 and between 5, 7 and 3 of Landsat 7 (as described in [41] as the first input ratio band for each type of the Landsat image. Additionally, the band ratios of 3 to 2; 5 to 1; and 7 to 3 of Landsat 7 and the band ratios of 4 to 3, 6 to 2 and 7 to 4 of Landsat 8 [53, 54, 55, 56, 57] were added to increase the contrast between lithological objectives and others as the second and third input data for computerized interpretation (Figure 4). According to [41], these combinations can highlight major geological features such as Jurassic appears in a cyanuric color, Quaternary sediments in a blue color, and basalt formations in a lighter blue color. In this study, (satellite) imagery classification was processed by Classification tool in ENVI 5.3 software. Conversions for synchronization of the satellite imagery database, maps were made by FME Desktop 2016 software.

RGB band ratio color images: (a) Landsat 7 images (3/2, 5/1, 7/3); (b) Landsat 8 images (4/3, 6/2, 7/4).
The spectral bands of Landsat - 8 OLI and TIRS compared to Landsat - 7 ETM+
| Landsat-7 ETM+ | Landsat-8 OLI | ||||
|---|---|---|---|---|---|
| Spectral Band | Resolution (m) | Wavelength (μm) | Spectral Band | Resolution (m) | Wavelength (μm) |
| Band 1-Coastal/Aerosol | 30 | 0.435-0.451 | |||
| Band 1-Blue | 30 | 0.441-0.514 | Band 2-Blue | 30 | 0.452-0.512 |
| Band 2-Green | 30 | 0.519-0.601 | Band 3-Green | 30 | 0.533-0.590 |
| Band 3-Red | 30 | 0.631 -0.692 | Band 4-Red | 30 | 0.636-0.673 |
| Band 4-NIR | 30 | 0.772 -0.898 | Band 5-NIR | 30 | 0.851 -0.879 |
| Band 5-SWIR-1 | 30 | 1.547-1.749 | Band 6-SWIR-1 | 30 | 1.566-1.651 |
| Band 6-TIR | 60 | 10.31 -12.36 | Band 10-TIR-1 | 100 | 10.60-11.19 |
| Band 11-TIR-2 | 100 | 11.50-12.51 | |||
| Band 7-SWIR-2 | 30 | 2.064-2.345 | Band 7-SWIR-2 | 30 | 2.107-2.294 |
| Band 8-Pan | 15 | 0.515-0.896 | Band 8-Pan | 15 | 0.503-0.676 |
| Band 9-Cirrus | 30 | 1.363-1.384 | |||
| (NIR-Near Infra-red; SWIR-Short Wavelength Infra-red; TIR-Thermal Infra-red; Pan-Panchromatic) | |||||
Summary table of lithological classification studies using band ratios
| Sensor | Ratio combination | Lithology/rock | Location | References |
|---|---|---|---|---|
| Landsat 5 TM | 5/3, 5/1, 7/5; 7/5, | Serpentinite, metavolcanics | Barramiya, Central Eastern | [48] |
| 5/4, 3/1 | Desert, Egypt | |||
| 4/3, 5/2, 3/1; 5/3, | Limestone/marble, granite, alluvium, coastal alluvium | Dayang Bunting & Tuba | [61] | |
| 4/3,4/1 &4/2, 5/3, | Islands, Langkawi, Malaysia | |||
| 4/3 4/3 1/3, 5/7, 3/5; 4/5, 6/7, 4/6 | Granites, migmatites, gabbros, dolerites; intermediate basalts, basalts, phonolites, tuffs, phonolitic trachytes, tephraytes, sediments | Rungwe Volcanic Province, Tanzania | [62] | |
| 3/1,4/5,3/2 | Basalt rocks | Kula, Manisa, Turkey | [54] | |
| Landsat 7 | 5/7, 5/1,4/1 | Gneisses, schists, granites; Sarabit El Khadim, Abu Hamata formations, basalt | Urn Bogma, Environs | [51] |
| Westcentral Sinai, Egypt. | ||||
| 3/1,5/7, 5/4; 5/7, | Precambrian basement and the Paleozoic sedimentary rocks | Tindouf Basin (Western | [63] | |
| 3/1,4/3 | Sahara) | |||
| 5/7,5/1,(5/4*3/4) | Felsic and granitic rocks from mafic and ultramafic lithology of ophiolitic origin | Abidiya, Sudan | [52] | |
| 7/3,7/2,5/2 | Gossan, Marble, Diorite, Volcanic rocks | Wadi Bulghah, Saudi Arabia | [53] | |
| 3/2,5/1,7/3 | Volcanic rocks, acidic metamorphic (quartzite, gneiss, migmatite) | Central Region of Kenya | [44] | |
| Landsat 8 | 7/5, 6/3, 6/7; 6/7, | Metamorphic rocks of volcano-sedimentary protoliths | Western Arabian Shield | [53] |
| 6/2 (6/5)*(4/5); | ||||
| 6/2,7/3,3 | Ultramafic | |||
| 6/7,6/5,4/2 | Mafic | |||
| 6/2, 6/7 and | Serpentine, metavolcanics | Korbiai-Gerf, SE Desert, | [35] | |
| (6/5)*(4/5) | Egypt | |||
| 4/3,6/2,7/4 | Neogene-Quaternary basalt, Jurassic formation, Quaternary sediment | Buon Ma Thuot, Central | Proposed in | |
| Highlands, Viet Nam | this study |
3.3 Additional abiotic variables
Fieldwork was conducted to study geological and geomorphological characteristics and to identify samples of different lithological types (Figure 5). Location of sample points was determined by handheld GPSMAP 78S. Accordingly, we have identified 85 sample points, including 30 basalt samples (including 19 samples from the Pliocene basalt formation and 11 samples from the Pleistocene basalt formation) and 55 other non-basalt samples (including 20 samples of Jurassic formations, 10 samples of Quaternary sedimentary formation, 10 samples of water surfaces and 15 samples of residential areas). Based on the geomorphological and hydrological characteristics of above standard samples, authors used geological map, soil map, geomorphological maps (slope, absolute elevation, relative elevation and river density) and satellite images to identify 228 additional samples. They include 48 samples of the Pliocene basalt formation, 36 samples of the Pleistocene basalt formation, 73 samples of Jurassic formations, 16 samples of Quaternary sediments, 27 samples of water surface and 28 samples of residential house. In total, 313 samples were collected (Figure 5) and randomly distributed at the ratio of 70% and 30% [58, 59]. Accordingly, 70% of the sample points were used for computerization (219 points), and the remaining 30% (94 points) of the samples were used to verify the results.

Distribution map of sampling points in analytical interpretation of basalt formations.
The Digital Elevation Model (DEM) with 12.5 m resolution was provided by the Alaska Satellite Facility (ASF), which was processed on 08/09/2009. DEM is analyzed by the Spatial Analyst Tools of ArcGIS 10.3 software. In addition, the study used satellite images, digital elevation models online provided by Google Earth Pro software. The elevation data was also added in the attribute table of sample points to compare with other remote sensing and abiotic variables.
3.4 Geological classification process
The flowchart of the basalt classification process is shown in Figure 6. The classification process can be divided to three steps including (1) data preparation and satellite image processing, (2) field survey and image interpretation, and (3) generation and validation of geological map. In the first step, in order to classify the lithology in Buon Ma Thuot and neighboring areas, Landsat 7 and 8 satellite images which were compositing in RGB by the band ratios. Band ratios are obtained easily by dividing digital number of each pixel at the one location in one band by each pixel at the same location in another band. Thus, band ratio technique highlights the spectral differences related to the specific materials to be mapped and disintegrates these surface materials from each other; otherwise, such information will not be available in any single band [57]. By applying this technique, lithology structures can be best distinguished by a combination of ratios that include short wavelength bands, the ratio of the long wavelength bands, and a ratio of one band each from short and long wavelength band groups [51].

Flowchart of the basalt classification process. Step 1: data preparation and satellite image processing, step 2: field survey and image interpretation, and step 3: generation and validation of geological map.
The RGB band ratio combination will be categorized according to the supervised classification. This is a probabilistic method that is able to arrange user-defined pixels into different classes. In it, all the pixels in an image are identified by the same spectral notation for the purpose of recognizing the identity, representative samples representing the different expressions that we want to classify. Standard samples were usually selected directly in the field or rely on reliable sources such as aerial photographs, satellite images and related maps. Accordingly, the more samples selected, the more accurate the classification will be. The sampling sites used a spectrum to give an outline of those areas. Digital image classification used spectrum information represented by one or more spectral channels of satellite imagery and attempts to classify each pixel independently based on this spectral information. In other cases, the objects are assigned all the pixels in the image according to the individual layers or the individual threads.
Supervised classification techniques include parallelepiped, minimum distance, maximum likelihood, spectral angle mapper (SAM), spectral information divergence (SID), and binary encoding. The most commonly used classification methods are the maximum likelihood classification (MLC) [60, 61, 62]. The MLC considers the statistics of each class in each image band to be dispersed in a regular manner and this method considers the ability of a pixel of a given class. Without selecting a probability threshold, all pixels must be sorted. Each pixel is assigned to a class with the highest probability (i.e., "Maximum likelihood"). This method is based on the hypothesis that the probability density function for each class is multivariate, and an unknown pixel is assigned to a class with the highest probability of belonging [62, 63]. The calculation is based not only on the distance value, but also on the degree of gray variation in each layer. This is an accurate classification method but takes a lot of time to compute and depends on the standard distribution of the data (as described by [60] for more detail).
In the second step of the flowchart of the basalt classification process, four geomorphological factors generated based on DEM at resolution 12.5 m include slope, relative elevation and absolute elevation and drainage density. The geomorphological characteristics were assigned to 313 samples that were collected in section 3.3. 75%of data were separated to be used as training data, whereas the rest of data were used as testing data to interpreted geological maps based on Landsat image in step 2. The distribution of geological samples will be validated in four above geomorphological factors. This information is important to classify geological classes in step 3 with the integration with outcomes from step 1. In step 3, the last field survey was carried out in October 2018 to validate the location of the Quaternary basalt formations, especially based on the appearance of craters. The main outcome is presented in section 4.3.
4 Results
4.1 Geological maps based on Landsat 7 and 8 analysis
Using the maximum likelihood classification method and carrying out the steps of the research process as described above, geological maps was developed based on the Landsat 7 and 8 data as shown in Figure 7. The lithological structures interpreted from the Landsat 7 data shows a more homogeneous distribution of the Pliocene basalt formation in Buon Ma Thuot city, Krong No and Krong Ana districts compared to outcomes from the Landsat 8 data. The contrast outcomes were found with the Pleistocene basalt formation. This formation distributes heterogeneously in the geological map based on the Landsat 7 and homogeneously in the map based on the Landsat 8. Both maps show that most area in Buon Ma Thuot citywere formed on Pliocene basalt formation. The vestiges of the Quaternary formation were detected along the boundary of Krong No and Krong Ana districts. The Jurassic formation could be found in mountainous areas along the boundary of Krong Ana district and Buon Ma Thuat city.
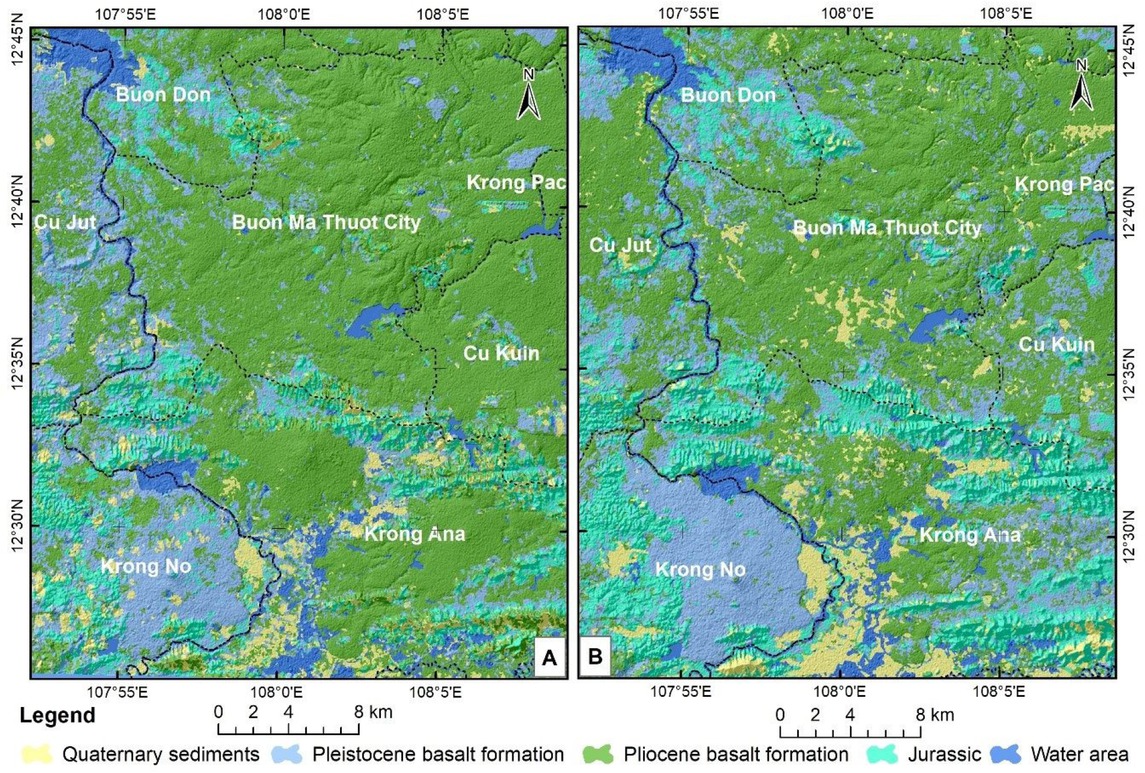
Geological maps generated based on Landsat 7 (A) and 8 (B) data.
The areal distribution and percentage of geological formations in the study case were shown in the Table 3. According to the percentage of all formations, the Pliocene basalt formation takes more than 55% of the whole region. The Pleistocene and Jurassic formations take from 14 to 19% of the whole region. The obvious difference between the outcomes from Landsat 7 and 8 data could be detected in Jurassic, Pleistocene and Pliocene basalt formations. The area of the Pleistocene basalt and Jurassic formations based on the Landsat 8 data is 3,000 ha and 6,500 ha respectively larger than those based on the Landsat 7 data. By contrast, the Pliocene basalt formation found in Landsat 8 is 10,000 ha smaller than in Landsat 8. The areal distribution of other formations in both data were similar.
Areal distribution of geological formations based on geological maps generated from Landsat 8 and Landsat 7 data at Buon Ma Thuot city and surrounding areas
| No. | Objects of interpretation | Based on Landsat 8 data | Based on Landsat 7 data | ||
|---|---|---|---|---|---|
| Area (ha) | Percentage (%) | Area (ha) | Percentage (%) | ||
| 1 | Quaternary sedimentary | 9534.1 | 6.4 | 8396.1 | 5.6 |
| 2 | Basalt Pleistocene formation | 32340.2 | 21.6 | 28936.7 | 19.3 |
| 3 | Basalt Pliocene formation | 72936.5 | 48.6 | 82911.8 | 55.3 |
| 4 | Jurassic formation | 27093.2 | 18.1 | 21590.1 | 14.4 |
| 5 | Water surface formation | 8027.2 | 5.3 | 8096.3 | 5.4 |
| Total | 149931.0 | 100 | 149931.0 | 100 | |
The accuracy of the results is shown in Tables 4 and 5. By using 30% of the remaining sample points (94 sample points) overlap the result map and count, it can be concluded that the accuracy of using Landsat 8 images was higher (89.9%) than using Landsat 7 images (80.3%). Interestingly, the Quaternary sedimentary samples were identified correctly 100%, whereas other formations were predicted with the accuracy of from 80 to 87% in both Landsat data. The total accuracy of the outcomes based on Landsat 7 data was reduced, especially in the Pleistocene basalt formation on the one hand when the accuracy of this formation only reached 33%. Compared to the outcomes based on the Landsat 8, the Pliocene basalt formation detected from Landsat 7 is better than 10%.
Evaluate accuracy in interpretation of objects using Landsat 8 images
| No. | Objects | Total of samples | Corrected samples | Uncorrected samples | Accuracy (%) | Errors (%) |
|---|---|---|---|---|---|---|
| 1 | Pliocene formation | 32 | 26 | 6 | 81.3 | 18.8 |
| 2 | Pleistocene formation | 12 | 12 | 0 | 100.0 | 0.0 |
| 3 | Jurassic formation | 31 | 25 | 6 | 80.6 | 19.4 |
| 4 | Quaternary sedimentary | 11 | 11 | 0 | 100.0 | 0.0 |
| 5 | Water surface | 8 | 7 | 1 | 87.5 | 12.5 |
| Total/Average | 94 | 81 | 13 | 89.9 | 10.1 |
Evaluate accuracy in interpretation of objects using Landsat 7 images
| No. | Objects | Total of samples | Corrected samples | Uncorrected samples | Accuracy (%) | Errors (%) |
|---|---|---|---|---|---|---|
| 1 | Pliocene formation | 32 | 30 | 2 | 93.8 | 6.3 |
| 2 | Pleistocene formation | 12 | 4 | 6 | 33.3 | 66.7 |
| 3 | Jurassic formation | 31 | 27 | 4 | 87.1 | 12.9 |
| 4 | Quaternary sedimentary | 11 | 11 | 0 | 100.0 | 0.0 |
| 5 | Water surface | 8 | 7 | 1 | 87.5 | 12.5 |
| Total/Average | 94 | 79 | 13 | 80.3 | 19.7 |
4.2 Geomorphological characteristics of basalt formations
Figure 8 showed the distribution of geological formations in different geomorphological and hydro- factors. Three basalt formations distribute at the elevation of from 400 to 500 m, whereas the Jurassic formation distribute in a wider range of elevation. The Quaternary basalt formation distribute mostly on about 400 m elevation. It is easier to observe differences between three basalt formations, as well as with the Jurassic formation, based on the relative elevation. The younger geological formations (such as the Quaternary basalt formation) have a lower value of relative elevation, compared to older ones (such as the Pliocene basalt formation). The similar trend is also found in the figure showing the distribution of basalt formation in different slope levels. The river density in four geological formations (including Jurassic one) seems to be more complex. The higher river density can be found in the Quaternary basalt formation, following to the Pliocene basalt formation. The older geological formations (such as the Jurassic and Pleistocene formations) have lower river density.

Distribution of basalt formations in different geomorphological and hydro-characteristics.
4.3 Final geological map based on the integration of Landsat 7 and 8 data
After validating the interpretation results of two Landsat data, the final geological map of the study case was carried out with the expert analysis in field surveys, topographical data, and associated maps. The boundaries of the major geological formations were delineated in the study area. Accordingly, the study area was divided into three main geological groups: basalt, Jurassic and Quaternary formations. Particularly, the basalt formation was divided into two specific types: Pliocene basalt and Pleistocene basalt formation. Especially, the classification between basalt and non-basalt formations shown in the Figure 9 is the integration of two interpretation results. Whereas the boundary of Pleistocene basalt formation was inherited from the Landsat 8 interpretation result (with accuracy of 100%), the boundary of Pliocene basalt formation was inherited from the Landsat 7 interpretation result (with accuracy of 93.8%) (Table 6). Therefore, the average accuracy of basalt geological classification based on Landsat data would be 96.9% and of all five geological formations would be 93.7%. As another result, eight ancient craters were identified and six of them locate in the Pliocene basalt formation.

The geological map based on integration of Landsat 7 and 8.
Accuracy comparison between three interpretation results
| No. | Objects | Accuracy of geological map based on (%) | ||
|---|---|---|---|---|
| Landsat 8 | Landsat 7 | Integration of Landsat 7 and 8 | ||
| 1 | Pliocene formation | 81.3 | 93.8 | 93.8 |
| 2 | Pleistocene formation | 100.0 | 33.3 | 100.0 |
| 3 | Jurassic formation | 80.6 | 87.1 | 87.1 |
| 4 | Quaternary sedimentary | 100.0 | 100.0 | 100.0 |
| 5 | Water surface | 87.5 | 87.5 | 87.5 |
| Total/Average | 89.9 | 80.3 | 93.68 | |
It is easy to observe the large area of the Buon Ma Thuot city and Cu Kuin, Krong Ana and Cu Jut districts have been formed on the Pliocene basalt formation. Whereas, the Krong No district is mainly formed on the Pleistocene basalt formation. The Jurassic formation distribute heterogeneously among other formations.
5 Discussions
5.1 Potential use of spectral band ratios in other geological studies
The interpretation results based on Landsat 7 and 8 for geological classification proved the potential of spectral band ratios as mentioned in previous geological studies that only used one type of data [36, 52, 53]. The interpretation for a single satellite image can commonly distinguish main geological formations such as Jurassic, Neogene and Quaternary formations but this method could not separate different geological materials in detail in each formation. The integration between two Landsat generations has taken full advantage of each interpretation result, particularly in basalt classification. In the case of research area, while the use of Landsat 7 data can interpret basalt materials belong to the Pliocene basalt formation, the use of Landsat 8 data can interpret basalt materials belong to the Pleistocene basalt formation. Therefore, authors propose the use of single satellite data for geological classification in general as the first step, and the use of integrated satellite data for basalt geological classification in detail. The successful development of new spectral band ratios for Landsat satellite images to classify basalt formations have proved a high potential use of these ratios for other satellite images such as Aster and Sentinel-2 images.
5.2 Comparison of the results with the traditional geological maps
Compared to the formal geological maps (at 1: 200,000 scale) published by the Department of Geology and Minerals of Vietnam (Figure 3), some differences between geological formations can be found as following:
The first issue relates to the accuracy of basalt and non-basalt formations based on the analysis of both morphological features and remote sensing. The Jurassic formation has made a complex terrain with high slope, deep division (Figures 2b and 2c) and a small drainage density (Figure 2d). Based on both Landsat satellite images, the Jurassic formation can be characterized with cyan color and rough structures, while the Quaternary formation can be identified with dark blue and smooth structure (Figure 4).However, the identification of basalt and non-basalt boundaries are different in the interpretation results with geological map (Figure 3).
In this section, authors emphasize two specific cases, such as in black frames that were denoted as "1" and "2" in Figures 4 and 8. In the frame 1, the Pleistocene basalt formation in the geological map (Figure 3) is overlapped the Jurassic formation. In fact, some lava caves were only found in the north-eastern sides of these overlapping areas, whereas a complex terrain formed by Jurassic formation could be observed easily in the western side of the frame 1 on the one hand. The distinguishing of the Jurassic and Pleistocene basalt formations in the frame 1 has proved the high accuracy of interpretation results. Another result was found in the frame 2. The satellite image showed a darker blue and finer texture of the Pliocene basalt tone and morphological maps (Figure 2b and 2c) showed that this area was characterized by small slopes and deep divisions like the Pliocene basalt formation. However, the area in the frame 2 was identified as the Jurassic formation in the geological map. Thus, the correct realignment between the basalt and non-basalt formations in the area of this result is very significant in correcting and re-normalizing the types of geological maps at the average scales (e.g. 1: 200,000 to 1: 50,000).
According to the geological map (Figure 3), the Pleistocene basalt formation secondly accounted for a major area of the Krong Ana district and a part of the Buon Ma Thuot city, while this formation was not found at the same places in the interpretation result (Figure 9). In Figure 4b, the spectrum of the Pleistocene basalt formation in the Krong No area are lighter green and brighter compared to the rest of the study area. In fact, the Pleistocene basalt rocks in Krong No district is relatively fresh, with poor weathering (Figure 10a and 10c), while the Pliocene basalt are strongly weathered, creating a thick basalt soil in other areas (Figure 10b and 10d).

Basalt at (a) Pleistocene formation in Chu B’luk volcano area, Krong No district, Dak Nong; (b) Pliocene formation, in Buon Ma Thuot city, Dak Lak; (c) in Chu B’luk, Krong No area; and (d) in Buon Ma Thuot City.
Lava caves, as another method to identify the area of the Pleistocene basalt formation, were found not only in Krong No district, but also in the Central Highlands of Vietnam. The location of these caves was found in the boundary of the Pleistocene basalt formation in the interpretation results. Although [5, 10, 13] also found the lava caves in Tan Phu and Dinh Quan area, Dong Nai province - Southeast Vietnam, he did not identify the geological formation of these caves. It is possible that basalt caves are formed only in the youngest geological period, so they are well preserved until today. Additionally, the distribution of “Quaternary basalt formation” in the interpreted maps was validated firstly based on the appearance of lava tubes’ mouths. In other words, the accuracy of outcomes to interpret the “Quaternary basalt formation” is high. Secondly, the outcomes (geological maps) were interpreted at the regional scale can become more useful for studies at the plot scales, especially in the identification of unknown lava tubes’ mouths by many interdisciplinary scientists.
6 Conclusions
The study presented the analysis and interpretation processes of satellite imageries in combination with the digital elevation model and morphometric maps to classify the geological formations and to identify the ancient craters in a highland area, Vietnam. Three main issues can be concluded as following:
Based on medium resolution data of the Landsat 7 and 8 satellite images, the lithological and volcanic landform features can be identified with a high accuracy at both regional and national scales, especially with the basalt area of Pleistocene basalt and Pliocene basalt formations.
The boundary of geological formations (e.g. basalt and non-basalt distribution) or geological maps obtained from Landsat data can be a used to calibrate/validate traditional geological maps and to interpret different volcanic eruptions and caves.
The integration of Landsat 7 and 8 data can be a powerful tool not only for geological studies, but it also provides various information for natural resource and environmental management.
Acknowledgement
This study was supported by Vietnam National University, Hanoi, project code QG.17.23. We are thankful to the VNU University of Science, Vietnam National University, Hanoi for providing all the facilities for this research. We are grateful for the time and efforts from the editors and the anonymous reviewers on improving our manuscript.
References
[1] Hoang N, Flower M, Chi C, Xuan P, Quy H, Son T, Collision-induced basalt eruptions at Pleiku and Buon Me Thuot, south-central Viet Nam. J Geodyn, 2013, 69 , 65–83,10.1016/j.jog.2012.03.012Search in Google Scholar
[2] Xuan P, Hoang N, Koo L, Geochemistry of late Cenozoic basalts in Vietnam and its tectonic significances. J Geol, 2004, 24B,Search in Google Scholar
[3] Anh L, Thuy N, Thanh N, Nam H, Assessment of organic matter content in basalt soils under cultivation ofmajor crops in Dak Lak province. Vietnam J Earth Sci, 2015, 37 , 110–7, (in Vietnamese with English summary)10.15625/0866-7187/37/2/7366Search in Google Scholar
[4] Dung T, Minh N, Eruptive-volcanic-basalt structures in the Truong Sa-Spratly Islands and adjacent areas from interpreting gravity and magnetic data. Vietnam J Earth Sci, 2017, 39 , 1–13,10.15625/0866-7187/39/1/9167Search in Google Scholar
[5] Hoang N, Shinjo R, Phuc LT, Anh LD, Huong TT, Pécskay Z, et al., Pleistocene basaltic volcanism in the Krông Nô area and vicinity, Dac Nong Province (Vietnam). J Asian Earth Sci, 2019, 181 (January), 103903, https://doi.org/10.1016/j.jseaes.2019.10390310.1016/j.jseaes.2019.103903Search in Google Scholar
[6] Zhou Y, Retallack GJ, Huang C, Early Eocene paleosol developed from basalt in southeastern Australia: implications for paleoclimate. Arab J Geosci, 2014, , 13,10.1007/s12517-014-1328-8Search in Google Scholar
[7] Vingiani S, Terribile F, Meunier A, Petit S, Catena Weathering of basaltic pebbles in a red soil from Sardinia: A microsite approach for the identi fi cation of secondary mineral phases. Catena, 2010, 83 (2–3), 96–106, http://dx.doi.org/10.1016/j.catena.2010.07.00110.1016/j.catena.2010.07.001Search in Google Scholar
[8] Dao N, Yem N, Tuyet N, Tam L, Geomorphological features of the basalt areas in the South Vietnam. J Geol, 1986, 172 (1), 17–20, (in Vietnamese with English summary)Search in Google Scholar
[9] Nien B, Anh T, Dung P, Hieu T, Ly V, Mai N, et al., Overview of precious stones, half precious stones, fine arting stones, ashlar facing stones and potentiality of them in the Tay Nguyen zone. Vietnam J Earth Sci, 2015, 37 , 16–27, (in Vietnamese with English summary)10.15625/0866-7187/37/1/6549Search in Google Scholar
[10] Phuc L, Tachihara H, Honda T, Tuat L, Thom B, Hoang N, Chikano Y, Yoshida, K, Tung N, Danh P, Hung M, Duc T, Vu P, Hoa N, Bien H, Quy T, Minh N,. Geological values of lava caves in Krongno Volcano Geopark, Dak Nong, Vietnam. Vietnam J Earth Sci, 2018, 40(4), 299-319,10.15625/0866-7187/40/4/13101Search in Google Scholar
[11] Ha N, Dung N, Ngoc H, Application of USLE and GIS tool to predict soil erosion potential and proposal land cover solutions to reduce soil loss in Tay Nguyen. Vietnam J Earth Sci, 2013, (35), 403–10, (in Vietnamese with English summary)Search in Google Scholar
[12] Phuong TH, Hai TQ, Bao D Van, Some natural heritages of outstanding values for tourism development in Central Highland. Vietnam J Earth Sci, 2015, 37 (2), http://dx.doi.org/10.15625/0866-7187/37/2/737510.15625/0866-7187/37/2/7375Search in Google Scholar
[13] Phuc LT, Su NK, Duc VT, Tuat LT, Toan PT, Tung NT, et al., New discovery of prehistoric archaeological remnants in volcanic caves in K’Rongno, Dak Nong province. Vietnam J Earth Sci, 2017, 39 (2), http://dx.doi.org/10.15625/0866-7187/39/2/918610.15625/0866-7187/39/2/9186Search in Google Scholar
[14] Monaldo E, Nerilli F, Vairo G, Basalt-based fiber-reinforced materials and structural applications in civil engineering. Compos Struct, 2019, 214 , 246–63, https://doi.org/10.1016/j.compstruct.2019.02.00210.1016/j.compstruct.2019.02.002Search in Google Scholar
[15] Monaldo E, Nerilli F, Vairo G, Effectiveness of some technical standards for debonding analysis in FRP-concrete systems. Compos Part B Eng, 2019, 160, 254–67, https://doi.org/10.1016/j.compositesb.2018.10.02210.1016/j.compositesb.2018.10.022Search in Google Scholar
[16] Sultan M, Arvidson RE, Sturchio NC, Guinness EA, Lithologic mapping in arid regions with Landsat thematic mapper data: Meatiq dome, Egypt. Geol Soc Am Bull, 1987, 99 (6), 748, http://dx.doi.org/10.1130/0016-7606(1987)99%3C748:lmiarw%3E2.0.co10.1130/0016-7606(1987)99<748:LMIARW>2.0.CO;2Search in Google Scholar
[17] Tran, Nguyen, Geological Map of Vietnam 1:1500000. 1986,Search in Google Scholar
[18] Msindai KA, Engineering geological mapping of Dar es Salaam city, Tanzania. Tanzania J Sci, 2004, 28 (2), http://dx.doi.org/10.4314/tjs.v28i2.1835610.4314/tjs.v28i2.18356Search in Google Scholar
[19] Anh LD, Hoang N, Shakirov RB, Huong TT, Geochemistry of late miocene-pleistocene basalts in the Phu Quy island area (East Vietnam Sea): Implication for mantle source feature and melt generation. Vietnam J Earth Sci, 2017, 39 (3), http://dx.doi.org/10.15625/0866-7187/39/3/1055910.15625/0866-7187/39/3/10559Search in Google Scholar
[20] Dung TT, Minh NQ, Eruptive-volcanic-basalt structures in the Truong Sa-Spratly Islands and adjacent areas from interpreting gravity and magnetic data. Vietnam J Earth Sci, 2017, 39 (1), http://dx.doi.org/10.15625/0866-7187/39/1/916710.15625/0866-7187/39/1/9167Search in Google Scholar
[21] Borrelli L, Antronico L, Gullà G, Sorriso-Valvo GM, Geology, geomorphology and dynamics of the 15 February 2010 Maierato landslide (Calabria, Italy). Geomorphology, 2014, 208 (February 2010), 50–73, http://dx.doi.org/10.1016/j.geomorph.2013.11.01510.1016/j.geomorph.2013.11.015Search in Google Scholar
[22] Kervyn M, Kervyn F, Goossens R, Rowland SK, Ernst GGJ,Mapping volcanic terrain using high-resolution and 3D satellite remote sensing. Geol Soc, 2007, , 5–30,10.1144/SP283.2Search in Google Scholar
[23] Merrett HC, Chen WW, Applications of geographical information systems and remote sensing in natural disaster hazard assessment and mitigation in Taiwan. Geomatics, Nat Hazards Risk, 2013, 4 (2), 145–63, http://dx.doi.org/10.1080/19475705.2012.68606410.1080/19475705.2012.686064Search in Google Scholar
[24] Pande CB, Khadri SFR, Moharir KN, Patode RS, Assessment of groundwater potential zonation ofMahesh River basin Akola and Buldhana districts, Maharashtra, India using remote sensing and GIS techniques. Sustain Water Resour Manag, 2017, 4 (4), 965–79, http://dx.doi.org/10.1007/s40899-017-0193-510.1007/s40899-017-0193-5Search in Google Scholar
[25] Mwaniki M, Möller M, Mwaniki MW, Matthias MSM, Schellmann G, Application of Remote Sensing Technologies to Mapthe Structural Geology of Central Region of. 2015, (March),10.1109/JSTARS.2015.2395094Search in Google Scholar
[26] Liem N Van, Dat NP, Dieu BT, Phai V Van, Trinh PT, Vinh HQ, et al., Assessment of Geomorphic Processes and Active Tectonics in Con Voi Mountain Range Area (Northern Vietnam) Using the Hypsometric Curve Analysis Method. Vietnam J Earth Sci, 2016, 38 (2), http://vjs.ac.vn/index.php/jse/article/view/860210.15625/0866-7187/38/2/8602Search in Google Scholar
[27] Ganguly S, Nemani RR, Zhang G, Hashimoto H, Milesi C, Michaelis A, et al., Generating global Leaf Area Index from Landsat: Algorithm formulation and demonstration. Remote Sens Environ, 2012, 122, 185–202, http://www.sciencedirect.com/science/article/pii/S003442571200044210.1016/j.rse.2011.10.032Search in Google Scholar
[28] van der Meer FD, van der Werff HMA, van Ruitenbeek FJA, Potential of ESA’s Sentinel-2 for geological applications. Remote Sens Environ, 2014, 148 , 124–33, http://dx.doi.org/10.1016/j.rse.2014.03.02210.1016/j.rse.2014.03.022Search in Google Scholar
[29] Mandanici E, Bitelli G, Preliminary Comparison of Sentinel-2 and Landsat 8 Imagery for a Combined Use. Remote Sens, 2016, 8 (12), 1014, http://dx.doi.org/10.3390/rs812101410.3390/rs8121014Search in Google Scholar
[30] Abdelrahman MAE, Natarajan A, Hegde R, Assessment of land suitability and capability by integrating remote sensing and GIS for agriculture in Chamarajanagar district, Karnataka, India. Egypt J Remote Sens Sp Sci, 2016, 19 (1), 125–41, http://dx.doi.org/10.1016/j.ejrs.2016.02.00110.1016/j.ejrs.2016.02.001Search in Google Scholar
[31] Thouret J-C, Volcanic geomorphology—an overview. Earth-Science Rev, 1999, 47 (1–2), 95–131, http://dx.doi.org/10.1016/s0012-8252(99)00014-810.1016/S0012-8252(99)00014-8Search in Google Scholar
[32] Moore CA, Hoffmann GA, Glenn NF, Quantifying Basalt Rock Outcrops in NRCS SoilMap Units Using Landsat-5 Data. Soil Horizons, 2007, 48 (3), 59, http://dx.doi.org/10.2136/sh2007.3.005910.2136/sh2007.3.0059Search in Google Scholar
[33] Prima ODA, Yoshida T, Characterization of volcanic geomorphology and geology by slope and topographic openness. Geomorphology, 2010, 118 (1–2), 22–32, http://dx.doi.org/10.1016/j.geomorph.2009.12.00510.1016/j.geomorph.2009.12.005Search in Google Scholar
[34] Mitchell JJ, Shrestha R, Moore-ellison CA, Glenn NF, Single and Multi-Date Landsat Classifications of Basalt to Support Soil Survey Efforts. 2013, (December 2014),10.3390/rs5104857Search in Google Scholar
[35] Behnia P, Harris JR, Rainbird RH, Williamson MC, Sheshpari M, Remote predictive mapping of bedrock geology using image classification of Landsat and SPOT data, western Minto Inlier, Victoria Island, Northwest Territories, Canada. Int J Remote Sens, 2012, 33 (21), 6876–903, http://dx.doi.org/10.1080/01431161.2012.69321910.1080/01431161.2012.693219Search in Google Scholar
[36] Leverington DW, Moon WM, Landsat-TM-Based Discrimination of Lithological Units Associated with the Purtuniq Ophiolite, Quebec, Canada. Remote Sens, 2012, 4 (5), 1208–31, http://dx.doi.org/10.3390/rs405120810.3390/rs4051208Search in Google Scholar
[37] Eldosouky AM, Abdelkareem M, Elkhateeb SO, Journal of African Earth Sciences Integration of remote sensing and aeromagnetic data for mapping structural features and hydrothermal alteration zones in Wadi Allaqi area , South Eastern Desert of Egypt. J African Earth Sci, 2017, 130 , 28–37, http://dx.doi.org/10.1016/j.jafrearsci.2017.03.00610.1016/j.jafrearsci.2017.03.006Search in Google Scholar
[38] Hassan SM, Sadek MF, Journal of African Earth Sciences Geologicalmapping and spectral based classi fi cation of basement rocks using remote sensing data analysis: The Korbiai-Gerf nappe complex , South Eastern Desert, Egypt. J African Earth Sci, 2017, 134 , 404–18, http://dx.doi.org/10.1016/j.jafrearsci.2017.07.00610.1016/j.jafrearsci.2017.07.006Search in Google Scholar
[39] Liu H, Hong Z, Zhang J, Niu H, Li S, Long L, Sedimentary characteristics and seismic geomorphology of gravity-flow channels in a rift basin: Oligocene Shahejie Formation, Qinan Slope, Huanghua Depression of Bohai Bay Basin, China. Mar Pet Geol, 2014, , 1–19, http://dx.doi.org/10.1016/j.marpetgeo.2016.02.01410.1016/j.marpetgeo.2016.02.014Search in Google Scholar
[40] Acharya T, Lee D, Yang I, Lee J, Identification of Water Bodies in a Landsat 8 OLI Image Using a J48 Decision Tree. Sensors, 2016, 16 (7), 1075, http://dx.doi.org/10.3390/s1607107510.3390/s16071075Search in Google Scholar PubMed PubMed Central
[41] Mwaniki M, Moeller M, Schellmann G, A comparison of Landsat 8 (OLI) and Landsat 7 (ETM+) in mapping geology and visualising lineaments: A case study of central region Kenya. 2015, XL (May), 11–5,10.5194/isprsarchives-XL-7-W3-897-2015Search in Google Scholar
[42] Kamel M, Youssef M, Hassan M, Bagash F, Utilization of ETM + Landsat data in geologic mapping of wadi Ghadir-Gabal Zabara area , Central Eastern Desert , Egypt. Egypt J Remote Sens Sp Sci, 2016, 19 (2), 343–60, http://dx.doi.org/10.1016/j.ejrs.2016.06.00310.1016/j.ejrs.2016.06.003Search in Google Scholar
[43] Takodjou Wambo JD, Ganno S, Djonthu Lahe YS, Kouankap Nono GD, Fossi DH, Tchouatcha MS, et al., Geostatistical and GIS analysis of the spatial variability of alluvial gold content in Ngoura-Colomines area, Eastern Cameroon: Implications for the exploration of primary gold deposit. J African Earth Sci, 2018, 142, 138–57, http://dx.doi.org/10.1016/j.jafrearsci.2018.03.01510.1016/j.jafrearsci.2018.03.015Search in Google Scholar
[44] Binam Mandeng EP, Bondjè Bidjeck LM, Takodjou Wambo JD, Taku A, Bineli Betsi T, Solange Ipan A, et al., Lithologic and structural mapping of the Abiete–Toko gold district in southern Cameroon, using Landsat 7 ETM+/SRTM. Comptes Rendus Geosci, 2018, 350 (3), 130–40, http://dx.doi.org/10.1016/j.crte.2017.11.00310.1016/j.crte.2017.11.003Search in Google Scholar
[45] Pour AB, Park Y, Park T-YS, Hong JK, Hashim M, Woo J, et al., Regional geology mapping using satellite-based remote sensing approach in Northern Victoria Land, Antarctica. Polar Sci, 2018, 16 , 23–46, http://dx.doi.org/10.1016/j.polar.2018.02.00410.1016/j.polar.2018.02.004Search in Google Scholar
[46] Roy DP, Wulder MA, Loveland TR, C.E. W, Allen RG, Anderson MC, et al., Landsat-8: Science and product vision for terrestrial global change research. Remote Sens Environ, 2014, 145, 154–72, http://dx.doi.org/10.1016/j.rse.2014.02.00110.1016/j.rse.2014.02.001Search in Google Scholar
[47] MwanikiMW,MatthiasMS, Schellmann G, Application of Remote Sensing Technologies to Map the Structural Geology of Central Region of Kenya. IEEE J Sel Top Appl Earth Obs Remote Sens, 2015, 8 (4), 1855–67, http://dx.doi.org/10.1109/jstars.2015.239509410.1109/JSTARS.2015.2395094Search in Google Scholar
[48] Holden CE, Woodcock CE, An analysis of Landsat 7 and Landsat 8 underflight data and the implications for time series investigations. Remote Sens Environ, 2016, 185, 16–36, http://dx.doi.org/10.1016/j.rse.2016.02.05210.1016/j.rse.2016.02.052Search in Google Scholar
[49] Adams JB, Filice AL, Spectral reflectance 0.4 to 2.0 microns of silicate rock powders. J Geophys Res, 1967, 72 (22), 5705–15, http://dx.doi.org/10.1029/jz072i022p0570510.1029/JZ072i022p05705Search in Google Scholar
[50] Kariuki PC, Woldai T, Van Der Meer F, Effectiveness of spectroscopy in identification of swelling indicator clay minerals. Int J Remote Sens, 2004, 25 (2), 455–69, http://dx.doi.org/10.1080/014311603100008431410.1080/0143116031000084314Search in Google Scholar
[51] Gad S, Kusky T, Lithological mapping in the Eastern Desert of Egypt, the Barramiya area, using Landsat thematic mapper (TM). J African Earth Sci, 2006, 44 (2), 196–202, http://dx.doi.org/10.1016/j.jafrearsci.2005.10.01410.1016/j.jafrearsci.2005.10.014Search in Google Scholar
[52] Ciampalini A, Garfagnoli F, Antonielli B, Del C, Moretti S, Ciampalini A, et al., Photo-lithological map of the southern flank of the Tindouf Basin (Western Sahara). 2012, 5647,10.1080/17445647.2012.746947Search in Google Scholar
[53] Abdelmalik. KW and Ali MA. Abd-Allah, Integration of remote sensing technique and field data in geologic mapping of an ophiolitic suture zone in western Arabian Shield. J African Earth Sci, 2018, 146, 180-190.10.1016/j.jafrearsci.2017.10.006Search in Google Scholar
[54] Bishta A, Lithologic Discrimination Using Selective Image Processing Technique of Landsat 7 Data, Um Bogma Environs West-central Sinai, Egypt. J King Abdulaziz Univ Sci, 2009, 20 (1), 193–213, http://dx.doi.org/10.4197/ear.20-1.1010.4197/Ear.20-1.10Search in Google Scholar
[55] Ali EA, El Khidir SO, Babikir IAA, Abdelrahman ME, Landsat ETM+7 Digital Image Processing Techniques for Lithological and Structural Lineament Enhancement: Case Study Around Abidiya Area, Sudan. Open Remote Sens J, 2012, 5 (1), 83-9, http://dx.doi.org/10.2174/187541390120501008310.2174/1875413901205010083Search in Google Scholar
[56] Madani A, Assessment and Evaluation of Band Ratios, Brovey and HSV Techniques for Lithologic Discrimination and Mapping Using Landsat ETM<sup>+</sup> and SPOT-5 Data. Int J Geosci, 2014, 05 (01), 5–11, http://dx.doi.org/10.4236/ijg.2014.5100210.4236/ijg.2014.51002Search in Google Scholar
[57] Corumluoglu O, Vural A, Asri I, Determination of Kula basalts (geosite) in Turkey using remote sensing techniques. Arab J Geosci, 2015, 8 (11), 10105–17, http://dx.doi.org/10.1007/s12517-015-1914-410.1007/s12517-015-1914-4Search in Google Scholar
[58] Xu C, Dai F, Xu X, Lee YH, GIS-based support vector machine modeling of earthquake-triggered landslide susceptibility in the Jianjiang River watershed, China. Geomorphology, 2012, 145–146 , 70–80, http://dx.doi.org/10.1016/j.geomorph.2011.12.04010.1016/j.geomorph.2011.12.040Search in Google Scholar
[59] Pham BT, Tien Bui D, Pourghasemi HR, Indra P, Dholakia MB, Landslide susceptibility assesssment in the Uttarakhand area (India) using GIS: a comparison study of prediction capability of naïve bayes, multilayer perceptron neural networks, and functional trees methods. Theor Appl Climatol, 2015, 128 (1–2), 255–73, http://dx.doi.org/10.1007/s00704-015-1702-910.1007/s00704-015-1702-9Search in Google Scholar
[60] Richards JA, Jia X, Remote Sensing Digital Image Analysis [Internet]. Springer Berlin Heidelberg; 1999., http://dx.doi.org/10.1007/978-3-662-03978-610.1007/978-3-662-03978-6Search in Google Scholar
[61] Chen X, Warner TA, Campagna DJ, Integrating visible, near-infrared and short-wave infrared hyperspectral and multispectral thermal imagery for geological mapping at Cuprite, Nevada. Remote Sens Environ, 2007, 110 (3), 344–56, http://dx.doi.org/10.1016/j.rse.2007.03.01510.33915/etd.4139Search in Google Scholar
[62] Ge W, Cheng Q, Tang Y, Jing L, Gao C, Lithological Classification Using Sentinel-2A Data in the Shibanjing Ophiolite Complex in Inner Mongolia, China. Remote Sens, 2018, 10 (4), 638, http://dx.doi.org/10.3390/rs1004063810.3390/rs10040638Search in Google Scholar
[63] Mondal S, Maiti R, Landslide Susceptibility Analysis of Shiv-Khola Watershed, Darjiling: A Remote Sensing & GIS Based Analytical Hierarchy Process (AHP). J Indian Soc Remote Sens, 2012, 40 (3), 483–96, http://link.springer.com/10.1007/s12524-011-0160-910.1007/s12524-011-0160-9Search in Google Scholar
© 2019 N. Van Liem et al., published by De Gruyter
This work is licensed under the Creative Commons Attribution 4.0 Public License.
Articles in the same Issue
- Regular Articles
- 2D Seismic Interpretation of the Meyal Area, Northern Potwar Deform Zone, Potwar Basin, Pakistan
- A new method of lithologic identification and distribution characteristics of fine - grained sediments: A case study in southwest of Ordos Basin, China
- Modified Gompertz sigmoidal model removing fine-ending of grain-size distribution
- Diagenesis and its influence on reservoir quality and oil-water relative permeability: A case study in the Yanchang Formation Chang 8 tight sandstone oil reservoir, Ordos Basin, China
- Evaluation of AHRS algorithms for Foot-Mounted Inertial-based Indoor Navigation Systems
- Identification and evaluation of land use vulnerability in a coal mining area under the coupled human-environment
- Hydrocarbon Generation Potential of Chia Gara Formation in Three Selected Wells, Northern Iraq
- Source Analysis of Silicon and Uranium in uranium-rich shale in the Xiuwu Basin, Southern China
- Lithologic heterogeneity of lacustrine shale and its geological significance for shale hydrocarbon-a case study of Zhangjiatan Shale
- Characterization of soil permeability in the former Lake Texcoco, Mexico
- Detrital zircon trace elements from the Mesozoic Jiyuan Basin, central China and its implication on tectonic transition of the Qinling Orogenic Belt
- Turkey OpenStreetMap Dataset - Spatial Analysis of Development and Growth Proxies
- Morphological Changes of the Lower Ping and Chao Phraya Rivers, North and Central Thailand: Flood and Coastal Equilibrium Analyses
- Landscape Transformations in Rapidly Developing Peri-urban Areas of Accra, Ghana: Results of 30 years
- Division of shale sequences and prediction of the favorable shale gas intervals: an example of the Lower Cambrian of Yangtze Region in Xiuwu Basin
- Fractal characteristics of nanopores in lacustrine shales of the Triassic Yanchang Formation, Ordos Basin, NW China
- Selected components of geological structures and numerical modelling of slope stability
- Spatial data quality and uncertainty publication patterns and trends by bibliometric analysis
- Application of microstructure classification for the assessment of the variability of geological-engineering and pore space properties in clay soils
- Shear failure modes and AE characteristics of sandstone and marble fractures
- Ice Age theory: a correspondence between Milutin Milanković and Vojislav Mišković
- Are Serbian tourists worried? The effect of psychological factors on tourists’ behavior based on the perceived risk
- Real-Time Map Matching: A New Algorithm Integrating Spatio-Temporal Proximity and Improved Weighted Circle
- Characteristics and hysteresis of saturated-unsaturated seepage of soil landslides in the Three Gorges Reservoir Area, China
- Petrographical and geophysical investigation of the Ecca Group between Fort Beaufort and Grahamstown, in the Eastern Cape Province, South Africa
- Ecological risk assessment of geohazards in Natural World Heritage Sites: an empirical analysis of Bogda, Tianshan
- Integrated Subsurface Temperature Modeling beneath Mt. Lawu and Mt. Muriah in The Northeast Java Basin, Indonesia
- Go social for your own safety! Review of social networks use on natural disasters – case studies from worldwide
- Forestry Aridity Index in Vojvodina, North Serbia
- Natural Disasters vs Hotel Industry Resilience: An Exploratory Study among Hotel Managers from Europe
- Using Monarch Butterfly Optimization to Solve the Emergency Vehicle Routing Problem with Relief Materials in Sudden Disasters
- Potential influence of meteorological variables on forest fire risk in Serbia during the period 2000-2017
- Controlling factors on the geochemistry of Al-Shuaiba and Al-Mejarma coastal lagoons, Red Sea, Saudi Arabia
- The Influence of Kaolinite - Illite toward mechanical properties of Claystone
- Two critical books in the history of loess investigation: ‘Charakteristik der Felsarten’ by Karl Caesar von Leonhard and ‘Principles of Geology’ by Charles Lyell
- The Mechanism and Control Technology of Strong Strata Behavior in Extra-Thick Coal Seam Mining Influenced by Overlying Coal Pillar
- Shared Aerial Drone Videos — Prospects and Problems for Volunteered Geographic Information Research
- Stable isotopes of C and H in methane fermentation of agriculture substrates at different temperature conditions
- Prediction of Compression and Swelling Index Parameters of Quaternary Sediments from Index Tests at Mersin District
- Detection of old scattered windthrow using low cost resources. The case of Storm Xynthia in the Vosges Mountains, 28 February 2010
- Remediation of Copper and Zinc from wastewater by modified clay in Asir region southwest of Saudi Arabia
- Sedimentary facies of Paleogene lacustrine dolomicrite and implications for petroleum reservoirs in the southern Qianjiang Depression, China
- Correlation between ore particle flow pattern and velocity field through multiple drawpoints under the influence of a flexible barrier
- Atmospheric refractivity estimation from AIS signal power using the quantum-behaved particle swarm optimization algorithm
- A geophysical and hydro physico-chemical study of the contaminant impact of a solid waste landfill (swl) in King Williams’ Town, Eastern Cape, South Africa
- Landscape characterization using photographs from crowdsourced platforms: content analysis of social media photographs
- A Study on Transient Electromagnetic Interpretation Method Based on the Seismic Wave Impedance Inversion Model
- Stratigraphy of Architectural Elements of a Buried Monogenetic Volcanic System
- Variable secondary porosity modeling of carbonate rocks based on μ-CT images
- Traditional versus modern settlement on torrential alluvial fans considering the danger of debris flows: a case study of the Upper Sava Valley (NW Slovenia)
- The Influence of Gangue Particle size and Gangue Feeding Rate on Safety and Service Life of the Suspended Buffer’s Spring
- Research on the Transition Section Length of the Mixed Workface Using Gangue Backfilling Method and Caving Method
- Rainfall erosivity and extreme precipitation in the Pannonian basin
- Structure of the Sediment and Crust in the Northeast North China Craton from Improved Sequential H-k Stacking Method
- Planning Activities Improvements Responding Local Interests Change through Participatory Approach
- GIS-based landslide susceptibility mapping using bivariate statistical methods in North-western Tunisia
- Uncertainty based multi-step seismic analysis for near-surface imaging
- Deformation monitoring and prediction for residential areas in the Panji mining area based on an InSAR time series analysis and the GM-SVR model
- Statistical and expert-based landslide susceptibility modeling on a national scale applied to North Macedonia
- Natural hazards and their impact on rural settlements in NE Romania – A cartographical approach
- Rock fracture initiation and propagation by mechanical and hydraulic impact
- Influence of Rapid Transit on Accessibility Pattern and Economic Linkage at Urban Agglomeration Scale in China
- Near Infrared Spectroscopic Study of Trioctahedral Chlorites and Its Remote Sensing Application
- Problems with collapsible soils: Particle types and inter-particle bonding
- Unification of data from various seismic catalogues to study seismic activity in the Carpathians Mountain arc
- Quality assessment of DEM derived from topographic maps for geomorphometric purposes
- Remote Sensing Monitoring of Soil Moisture in the Daliuta Coal Mine Based on SPOT 5/6 and Worldview-2
- Utilizing Maximum Entropy Spectral Analysis (MESA) to identify Milankovitch cycles in Lower Member of Miocene Zhujiang Formation in north slope of Baiyun Sag, Pearl River Mouth Basin, South China Sea
- Stability Analysis of a Slurry Trench in Cohesive-Frictional Soils
- Integrating Landsat 7 and 8 data to improve basalt formation classification: A case study at Buon Ma Thuot region, Central Highland, Vietnam
- Assessment of the hydrocarbon potentiality of the Late Jurassic formations of NW Iraq: A case study based on TOC and Rock-Eval pyrolysis in selected oil-wells
- Rare earth element geochemistry of sediments from the southern Okinawa Trough since 3 ka: Implications for river-sea processes and sediment source
- Effect of gas adsorption-induced pore radius and effective stress on shale gas permeability in slip flow: New Insights
- Development of the Narva-Jõesuu beach, mineral composition of beach deposits and destruction of the pier, southeastern coast of the Gulf of Finland
- Selecting fracturing interval for the exploitation of tight oil reservoirs from logs: a case study
- A comprehensive scheme for lithological mapping using Sentinel-2A and ASTER GDEM in weathered and vegetated coastal zone, Southern China
- Sedimentary model of K-Successions Sandstones in H21 Area of Huizhou Depression, Pearl River Mouth Basin, South China Sea
- A non-uniform dip slip formula to calculate the coseismic deformation: Case study of Tohoku Mw9.0 Earthquake
- Decision trees in environmental justice research — a case study on the floods of 2001 and 2010 in Hungary
- The Impacts of Climate Change on Maximum Daily Discharge in the Payab Jamash Watershed, Iran
- Mass tourism in protected areas – underestimated threat? Polish National Parks case study
- Decadal variations of total organic carbon production in the inner-shelf of the South China Sea and East China Sea
- Hydrogeothermal potentials of Rogozna mountain and possibility of their valorization
- Postglacial talus slope development imaged by the ERT method: comparison of slopes from SW Spitsbergen, Norway and Tatra Mountains, Poland
- Seismotectonics of Malatya Fault, Eastern Turkey
- Investigating of soil features and landslide risk in Western-Atakent (İstanbul) using resistivity, MASW, Microtremor and boreholes methods
- Assessment of Aquifer Vulnerability Using Integrated Geophysical Approach in Weathered Terrains of South China
- An integrated analysis of mineralogical and microstructural characteristics and petrophysical properties of carbonate rocks in the lower Indus Basin, Pakistan
- Applicability of Hydrological Models for Flash Flood Simulation in Small Catchments of Hilly Area in China
- Heterogeneity analysis of shale reservoir based on multi-stage pumping data