Petrographical and geophysical investigation of the Ecca Group between Fort Beaufort and Grahamstown, in the Eastern Cape Province, South Africa
-
Christopher Baiyegunhi
 ,
Zusakhe Nxantsiya
,
Zusakhe Nxantsiya

Abstract
The outcrop of the Ecca Group in the Eastern Cape Province was investigated in order to reveal petrographic and geophysical characteristics of the formations that make up the group which are vital information when considering fracking of the Karoo for shale gas. The petrographic study reveals that the rocks of the Ecca Group are both argillaceous and arenaceous rock with quartz, feldspar, micas and lithics as the framework minerals. The sandstones are graywackes, immature and poorly sorted, thus giving an indication that the source area is near. The observed heavy minerals aswell as the lithic grains signify that the minerals are of granitic, volcanic and metamorphic origin. The porosity result shows that of all the formations that make up the Ecca Group, the Whitehill Formation is the most porous with an average porosity of about 2.1% and also least dense with an average dry density of about 2.5 g/cm3. The least porous unit is the Ripon Formation with porosity of about 0.8% but has the highest dry density of approximately 2.8 g/cm3. The magnetic map shows some ring-like structures which coincide with dolerites that were mapped in the field. As revealed by the depth slices result, dolerite intrusions are pervasive in the northern part of the study area, extending to a depth of about 6000 m below the ground surface. The appearance of dolerite intrusions at the targeted depth (3000 - 5000 m) for gas exploration could pose a serious threat to fracking of the Karoo for shale gas.
1 Introduction
This study focuses on road cut exposures of the Ecca Group along road R67 between Fort Beaufort and Grahamstown (Figure 1). The Ecca Group is the second largest subdivision of the Karoo Supergroup in Southern Africa; it covers more than 50% of the South Africa’s land surface and it is believed to have been emplaced during the Early Permian. The Karoo is a semi-desert region of Southern Africa with vast distribution of sedimentary rocks that covers an area of up to 700 000 km2 [1]. The Karoo Supergroup owes its name to the Karoo region in which it was accumulated in an environment believed to be a retro-arc foreland basin environment [2]. To date, there is controversy surrounding the origin and development of the Karoo Basin. The basin is well known worldwide because of its fossil content that record an unbroken stratigraphic succession that span from the Carboniferous to the Middle Jurassic. Recently, it was envisaged that the Karoo basin developed due to blocks subsidence along the marginal faults [3, 4].
![Figure 1 Geological map of the study area (Modified from [1]). The inserted small red colour box shows the study area.](/document/doi/10.1515/geo-2019-0025/asset/graphic/j_geo-2019-0025_fig_001.jpg)
Geological map of the study area (Modified from [1]). The inserted small red colour box shows the study area.
The Ecca Group is a sedimentary geological unit that comprises mostly of shales and sandstones. Almost all of South Africa’s coal resources and one-third of the coal resources in the southern hemisphere are in the rocks of the Ecca Group [5]. The coal seams is described to be horizontal throughout in the Main Karoo Basin except where the seams are associated with dolerite intrusions [1]. The distribution, lateral extent, thickness and maceral content of these coal seams are controlled by basin tectonic and differential subsidence [1, 6]. The Ecca group is also believed to be hosting the much debated shale gas with more emphasises on the Whitehill and Collingham Formations in the southern Karoo. Since the discovery of natural gas deposit in the carbonaceous shale of the Whitehill and Collingham Formations, the Ecca Group has become famous; however, local exploration started in the 1960s but was later stopped in the late 1970s due to poor technical know-how [7, 8].
Lithostratigraphy of the Ecca Group in the Eastern Cape Province of South Africa [1].
| Group | Formation | Lithology | Special Characteristics | Ages |
|---|---|---|---|---|
| Ecca | Waterford | Sandstone, mudstone | Water escapes structures, slumping, ball and pillow structures | 258 - 252 Ma |
| Fort Brown | Sandstone shale, | Rhythmites | 262 - 258 Ma | |
| Ripon | Sandstone, shale | Wave ripples, Glossopteris, rhythmites | 267 - 262 Ma | |
| Collingham | Shale, claystones, tuff, siltstones, sandstones | Thinly bedded, yellow tuff, Glossopteris, trace fossils | 274 - 270 Ma | |
| Whitehill | Black carbonaceous shale, chert | Weathered white shale , pyritic, gypsum at surface, dolomite concretions | 275 Ma | |
| Prince Albert | Khaki shale, siltstones | Pyrite, quartz veins, pyritic, sharks teeth, foraminifera | 280 - 275 Ma |
Shale gas has become important in the last few years and the main exploration target is the Ecca Group due to the recent developments in technology on how to recover the natural gas from the host shale. Fracking or fracturing of the Karoo to extract shale gas has attracted more interest from researchers and economists. This is due to the credence that shale gas is an economically feasible fossil fuel for generating cheap and clean electricity. Thus reducing environmental pollution as well as help in meeting the increasing demands of electricity in South Africa. This study was undertaken in order to provide more information on the petrographic and geophysical characteristics of the Ecca Group in the Eastern Cape Province of South Africa.
1.1 Geological background
The Main Karoo Basin of South Africa hosts the thickest and stratigraphically most complete mega- sequence of several depositories of the Permo-Carboniferous to Jurassic age sediments in southwesternGondwana continent [2]. Several models have been proposed for the formation of the basin. The interpretation of the evolution and tectonic setting of the Karoo Basin vary from a transient hypothetical mantle plume related model [9], a retro-arc foreland basin formed as a result of shallow angle subduction of the palaeo-Pacific plate underneath the Gondwana supercontinent [1], a transtensional foreland system formed as a result of subsidence and tilting in a strikeslip regime [3, 4], extensional back-arc basin formed due to oblique subduction of the palaeo-Pacific plate under western Gondwana [10], to a thin-skinned fold belt that developed from collisional tectonics and distant subduction to the south [11]. The maximum preserved thickness of these mega-sequence that is adjacent to the Cape Fold Belt is in excess of 6 km [12]. The Ecca Group is a rock sequence that accumulated between the Late Carboniferous Dwyka Group and the Late Permian-Middle Triassic Beaufort Group, occupying most of the Permian time of the Karoo Supergroup [13]. The term Ecca was suggested by Rubidge (1858) in [13] for argillaceous sedimentary strata exposed in the Ecca Pass, near Grahamstown in the Eastern Cape Province, South Africa. Thus, the use of the term Ecca outside the Main Karoo Basin is sometimes questionable as the rock types could be totally different. The group comprises of shale, mudstones, siltstones, sandstones, minor conglomerate and coal.
Generally, the Karoo Supergroup is stratigraphically subdivided into five main groups, namely; the Dwyka (Late Carboniferous), Ecca (Early Permian), Beaufort (Late Permian–Middle Triassic), Stormberg (Late Triassic–Early Jurassic) and Drakensberg Groups (Middle Jurassic) [5]. The Drakensberg lavas are believed to have terminated sedimentation in the basin in the Middle Jurassic [14]. The rocks of the Ecca Group were first identified by [15] as the “Ecca Beds” and were separated from the overlying “Beaufort Beds” (now known as the Beaufort Group). The “Ecca Beds” were at a later stage renamed the “Ecca Series” by [16] in his fourfold sub-division of the “Karoo System”. [17] subdivided the Ecca “Series” in the southern Karoo Basin into a Lower, Middle and Upper Ecca Stage. The Ecca Series in the southern Karoo Basin was later renamed by [18] as the Ecca Group. At the same time, the Lower, Middle and Upper Ecca "Stages" became formalized as the Ripon, Fort Brown and Waterford Formations. The underlying Prince Albert and Whitehill Formations were also included into the Ecca Group as the formations that make up the Lower Ecca Group, although they had been part of the upper Dwyka. [18] later renamed the grey and yellow shales on top of the Whitehill Formation as the Collingham Formation. With slight alterations this stratigraphic outline was received by the South African Committee for Stratigraphy [19] and to date this stratigraphic outline for the southern Karoo Basin is used. The stratigraphy of the Ecca Group is however complex and this complexity is related to its mode of origin, deep marine water and shallow marine turbidites and submarine fan deposits from specific source areas [13]. The marine clays and mudstones of the Prince Albert Formation were deposited on the diamictites of the Dwyka Group in the south-eastern part of the Karoo Basin [20]. This was followed by the carbonaceous shale of the Whitehill Formation. Subsequently, the Collingham Formation that is made up of persistent grey shales alternating with yellow-claystones, as well as the sandstones and shales of the Ripon, Fort Brown and Waterford Formations were deposited on the submarine fans, shelf and deltas, respectively [18]. The Dwyka and Ecca Groups were deposited during the seaway transgression into the interior part of the southern Karoo Basin [21]. Nevertheless, at the end of Ecca time, complete regression in the Ecca Group occurred from the limits of the preserved basin [2]. The sedimentary fill of the basin accumulated under the influence of tectonics and climate changes [2, 22]. Thus, it reflects variable environments from glacial to deep marine, fluvial, deltaic, and aeolian regimes [23]. The deeper marine facies of the Karoo Super-group (i.e.Dwyka and early Ecca Groups) accumulated during the under-filled phase of the foreland system, while the shallow marine facies of the Karoo Supergroup (late Ecca Group) is related to the filled phase of the basin [2, 22], which was followed by an overfilled phase characterised by more fluvial sedimentation [24]. The changes in fluvial style in the Karoo Basin at the end of the Permian were activated by a pulse of thrusting in the southerly source area dated at about 247 Ma [2, 22].
1.2 Lithostratigraphy of the Ecca Group
The Ecca Group in the Eastern Cape Province of South Africa can be stratigraphically subdivided into five formations, namely; the Prince Albert, Whitehill, Collingham, Ripon, and Fort Brown Formations [18, 19, 24]. The Prince Albert Formation consists mostly of grey mudstone, in the form of olive-grey laminated shales, less laminated and more siliceous olive grey shale and some sandstone beds near the base [1]. Carbonaceous shales which are found around 5m from the top of the formation are dark green to black in colour [23]. Sandy beds have been noticed near the top of the formation as well as a soft brownish material having an abundance of iron oxide [23]. The fine grained mudstones were deposited by suspension settling whereas sandstone beds were deposited as a result of turbidity currents [1]. The Whitehill Formation is also known as the “white band” due to its white appearance on the surface which resulted from the weathering of black carbon bearing shales into white soft sediments. The formation is up to 60 m thick, with lenses of dolomite and organic rich layers [23]. The carbonaceous shale is finely laminated and probably formed in a highly anoxic environment as suggested by [25] and there is a likelihood that the sediments of the Whitehill Formation were deposited on an unstable slope, where slumping would have taken place. This would have resulted in an environment where there was large influx of carbonaceous matter. Contemporaneous faulting and folding of the Whitehill Formation is described as a “decollement”, and these are significant features of the Whitehill Formation [1].
The Collingham Formation that overlies the Whitehill Formation comprises of shale, mudstone, and siltstone. About six lithofacies have been documented in the Collingham Formation by [26], namely mudstone, siltstone and very fine grained sandstone, chert, terrigenous rock, phosphorite and K-bentonite (altered ash fall tuff). The occurrence of thin siltstone and sandstone layers is a result of low density, distal turbidity currents. Small convolutions and partly striations are found in the formation [1]. The trace fossils that have been found in association with the mudstone facies are mostly worm burrows Scolia and Planolites, which are trails formed by gastropods [26]. The Ripon Formation consists of sandstones, mudstone and carbonaceous shale. It is poorly sorted, with fine- to very fine-grained lithofeldspathic sandstone alternating with dark grey clastic rhythmite and mudstone [1]. The Fort Brown Formation lies conformably on the Ripon Formation and ranges in thickness from 500 – 1500 m representing a thick, relatively homogenous argillaceous sequence that presently has no stratigraphic subdivisions [19]. The Fort Brown Formation comprises of dark-grey shale and siltstone, with well-developed varved rhythmite. Stratigraphically, the lower Fort Brown Formation is more argillaceous, and has been proposed to represent deposition in a pro-delta setting [1]. The Ripon and Fort Brown Formations represent a turbidite fan complex with the direction of movement from the southeast in a deep to medium aqueous [27].
The Waterford Formation conformably overlies the Fort Brown Formation and it varies from about 150 – 580 m in thickness, depending on the locality, the formation is also characteristically more arenaceous than the underlying Fort Brown Formation [19]. The lithofacies of the Waterford Formation are mostly arenaceous and their internal geometries and structure, including current and wave induced cross-bedding, scour and fill features, planar beds, and ripple marks, coupled with the lack of desiccation features, all point to sub-aqueous deposition [19]. The fact that the facies associations are repeated several times in vertical succession and appear to exhibit a degree of cyclicity is suggestive of delta lobe switching [19]. The rocks forming the base of the Waterford Formation are therefore considered to have been deposited in a delta front environment as previously proposed by [5, 20, 25]. The Ecca Group rests directly on the pre-Karoo surface in some places, indicating a significant post-Dwyka Group topography and localized pre-Ecca erosion, such as non-deposition or erosion of the Dwyka Group [28].
2 Materials and methods
A total of 52 rock samples were collected along road cut exposure for density measurements and petrographic study. The Archimedes method was used to determine the densities of the rock samples. The porosity was calculated from the measured density values. The rock samples were sun dried for 24 hours in order to remove any moisture from the voids. The dry sample was placed on the weighing balance and the mass in air was recorded as dMa (Figure 2). The same sample was placed on the loop that was immersed in the water and the reading was quickly taken and recorded as dMb. Then for the saturated density, samples were soaked in water for 24 hours so that the pores spaces are saturated or completely filled with water, then the soaked sample was submerged in water and the reading is quickly taken and recorded as dMc. More details on the procedures for density measurement can be found in [29, 30].
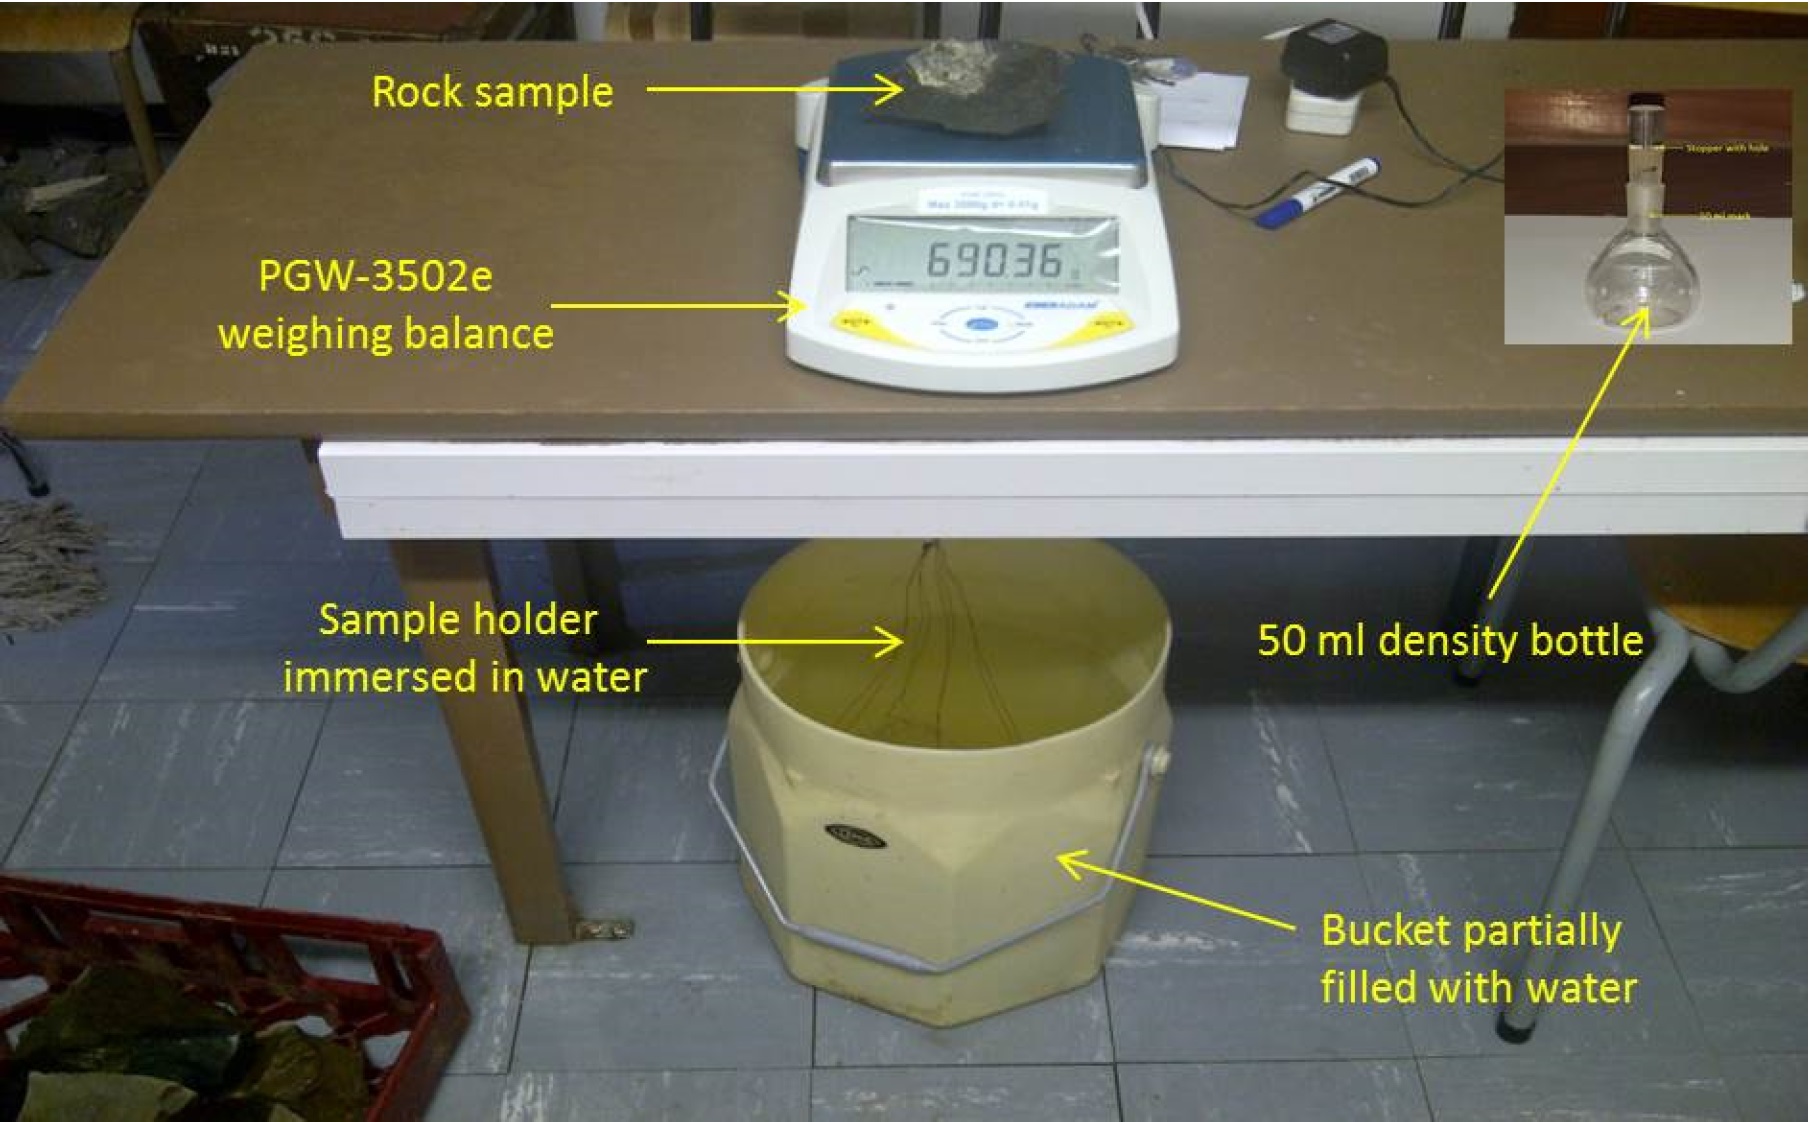
Mass of rock sampled being measured in the laboratory using Adam electronic weighing balance.
The mathematically expression to calculate dry, wet and grain density and porosity are shown below:
where dMa = mass of dry sample in air; dMb = mass of sample in water; dMc = mass of wet sample in water and ρw = density of water; ρd = dry density and ρp = grain density; wet = wet density; Ф = porosity.
Gridded aeromagnetic data was obtained from the Council for Geoscience South Africa (CGS). Airborne magnetic data was acquired over the Eastern Cape Province of South Africa in 1982. A proton precession magnetometer with 0.01 nT resolution was used to acquire the aeromagnetic data. The flight height and line spacing was 60 m and 750 m respectively, while sampling along lines was 250 m. The flight line direction was North-South with respect to UTM Zone 35S and tie line direction of East-West. Temporal magnetic variation and IGRF were both removed from the magnetic data by CGS in order to have signatures that are only due to the crustal magnetic field. The magnetic data was reduced to the pole (RTP) and Geosoft Oasis Montaj was used calculate radially averaged power spectrum. Getech Getgrid software was used to compute the magnetic depth slicing. The magnetic results are displayed as geophysical maps.
3 Results and Interpretation
3.1 Petrography
The rocks of the Ecca Group are both argillaceous and arenaceous rock. The argillaceous rock type are dominant in the lower Ecca Group (Prince Albert, Whitehill and Collingham Formations) while the arenaceous dominate the upper Ecca Group (Ripon and Fort Brown Formations). The argillaceous rocks of the lower Ecca Group are mostly laminated with some mineral grains lying parallel to the cleavage (Figure 3). Thin and thick beds were seen in areas without lamination. The framework minerals are quartz (monocrystalline quartz and polycrystalline quartz), feldspar (albite, microcline and orthoclase), micas (muscovite and biotite) and lithics. The lithic grains are igneous, sedimentary, metamorphic and volcanic in nature. The matrix minerals are muscovite, sericite, clay minerals (kaolinite, smectite, illite), feldspar and quartz. Most of the matrix minerals are formed due to recrystallization.Hematite and pyrite are the observed heavy minerals. The arenaceous (sandstones) of the upper Ecca Group are mostly graywackes (Figure 4). The sandstones are poorly sorted and dominated by fine grained matrix. The framework grains are quartz, feldspar and lithics. Based on the proportion or ratio of the feldspar to lithic fragments, the sandstones of the upper Ecca Group are termed arkosic sandstones. Feldspathic graywackes are dominant in the Ripon Formation and lithic graywackes (quartz and feldspar lithics) in the Fort Brown Formation.

Thin section photomicrograph of the shales from the lower Ecca Group (a) Detrital grains of the Prince Albert Formation; (b) Mineral grains lying parallel to the lamination planes or cleavage in shale from the Whitehill Formation; (c) Detrital quartz grains of the Whitehill Formation; (d) Lamination/alignment of grains of the Collingham Formation.
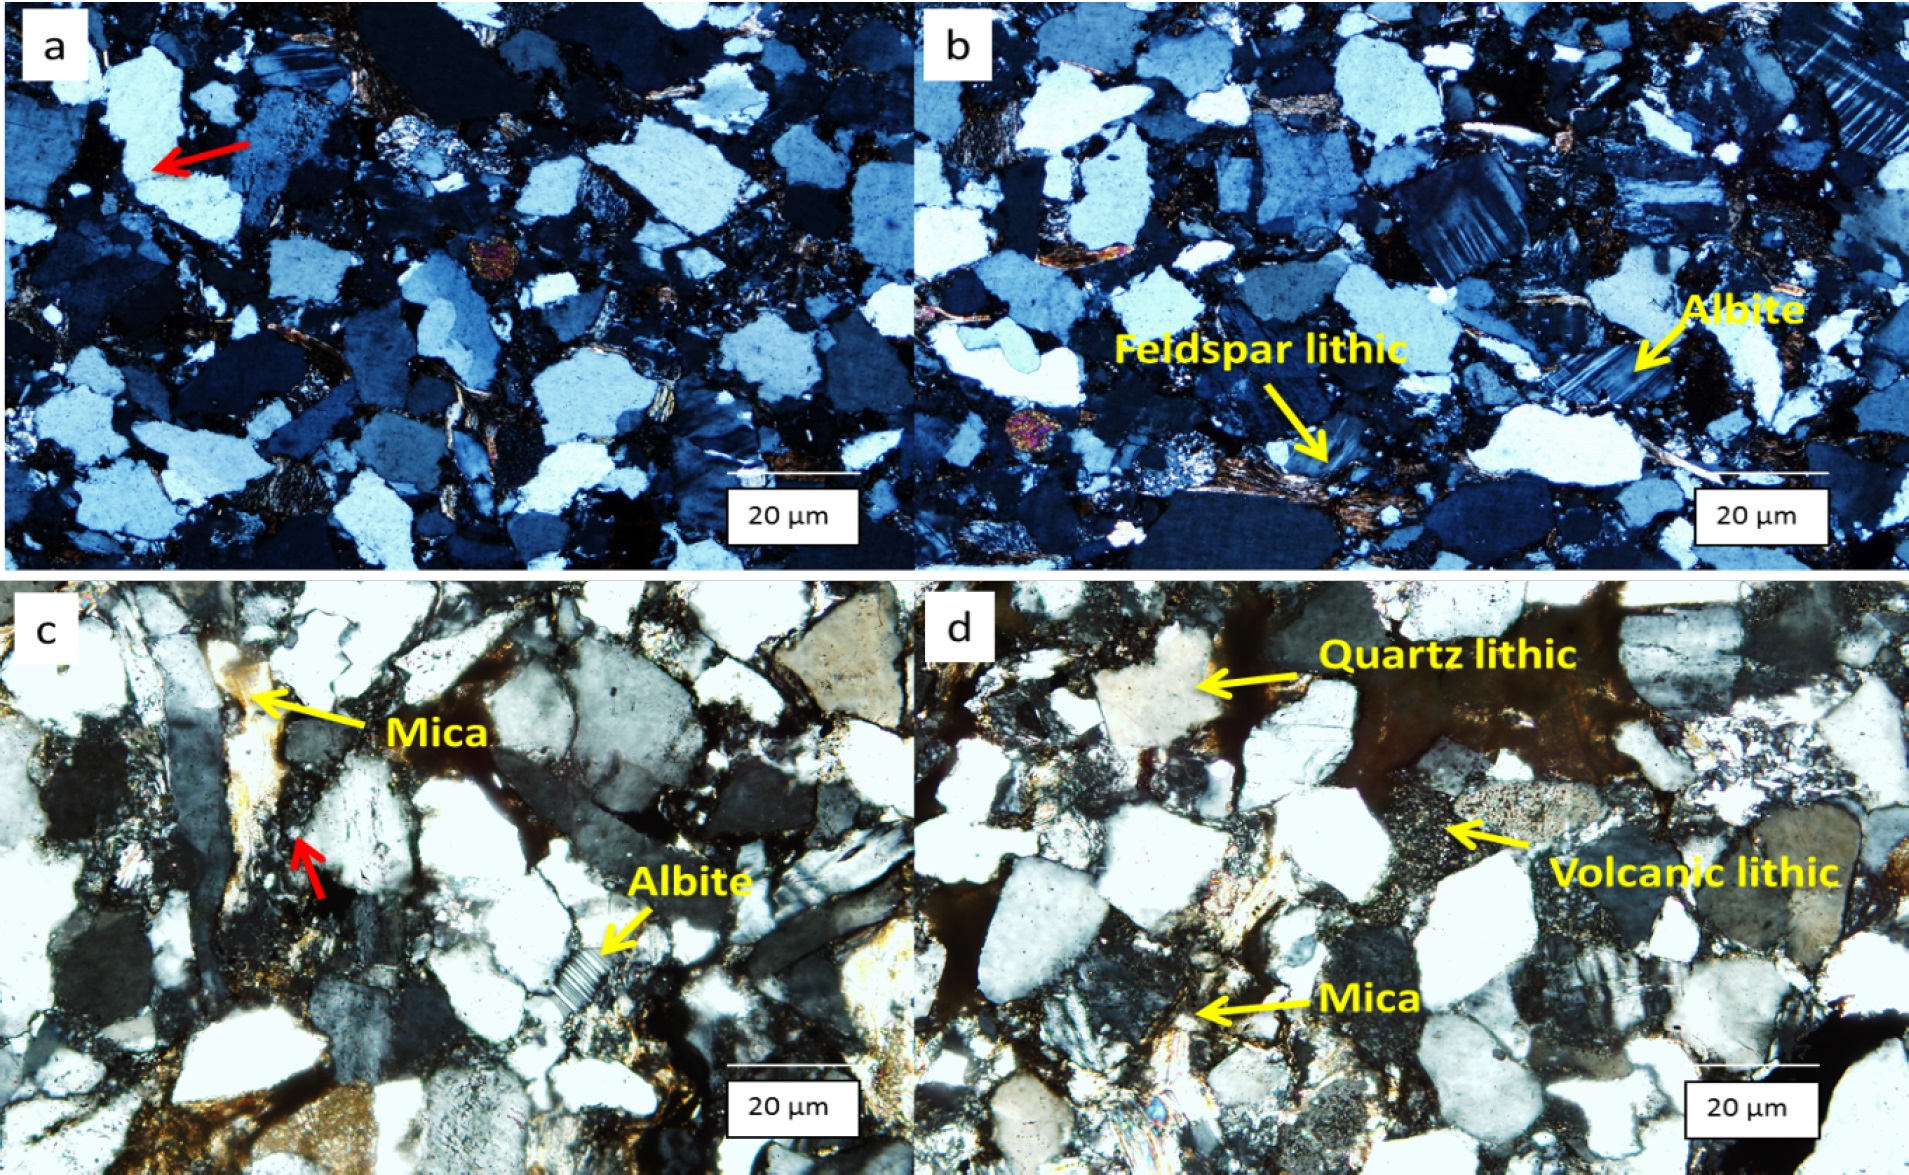
Thin section photomicrograph of the sandstones from the upper Ecca Group (a) Feldspathic graywackes of the Ripon Formation, red arrow depict polycrystalline quartz with two quartz grains; (b) Feldspar lithic and albite in sandstone from the Ripon Formation; (c) Framework minerals of the Fort Brown Formation, red arrow depict feldspar grains undergoing alteration to kaolinite; (d) Quartz and volcanic lithics of the Fort Brown Formation.
3.2 Density and porosity
The average density of water was obtained to be about 1.002 g/cm3 at room temperature 25∘C. The calculated densities of the rock samples are listed in Table 2. Bar charts showing densities and porosity of shales from the five formations are presented in Figure 10) and it can be depicted with the expression below:
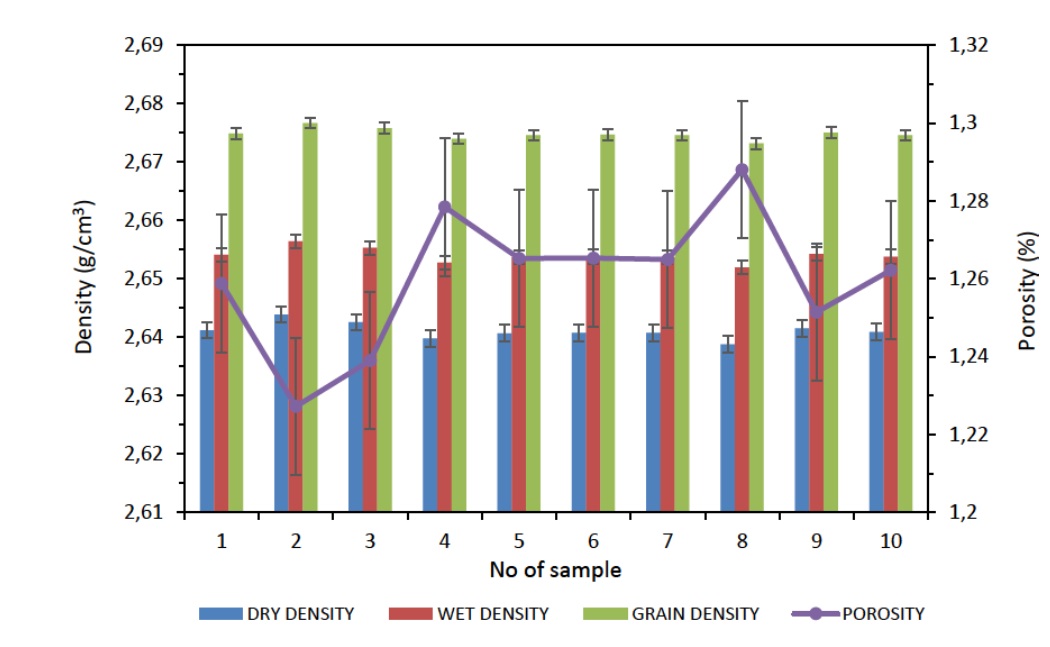
Bar chart showing densities and porosity of 10 shale samples from the Prince Albert Formation.
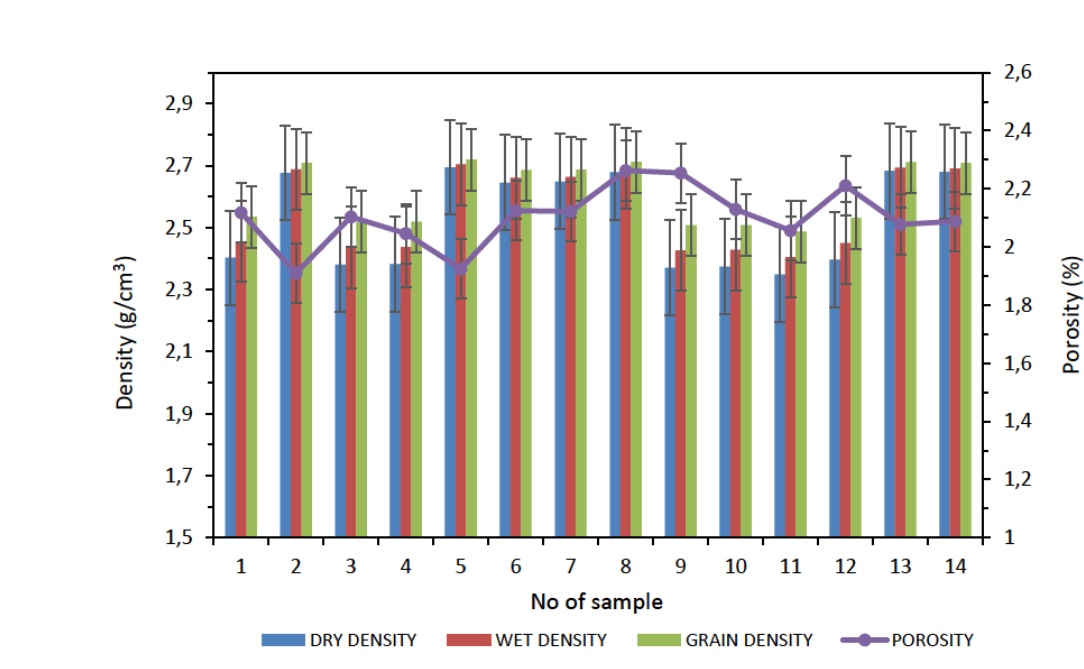
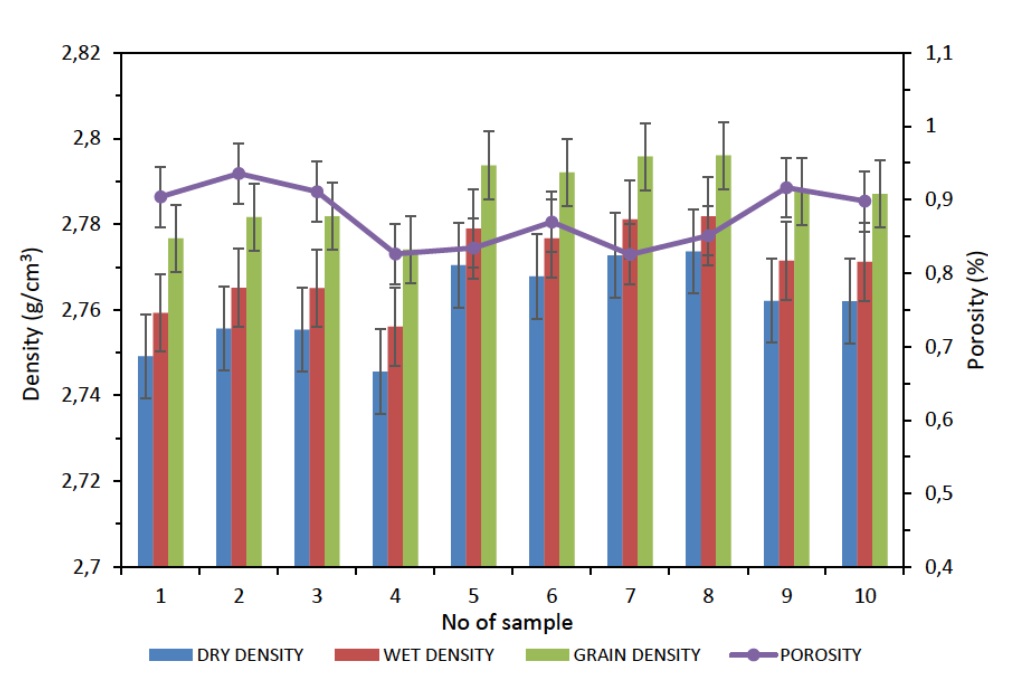
Chart of densities and porosity of 14 carbonaceous shale samples from the Whitehill Formation.
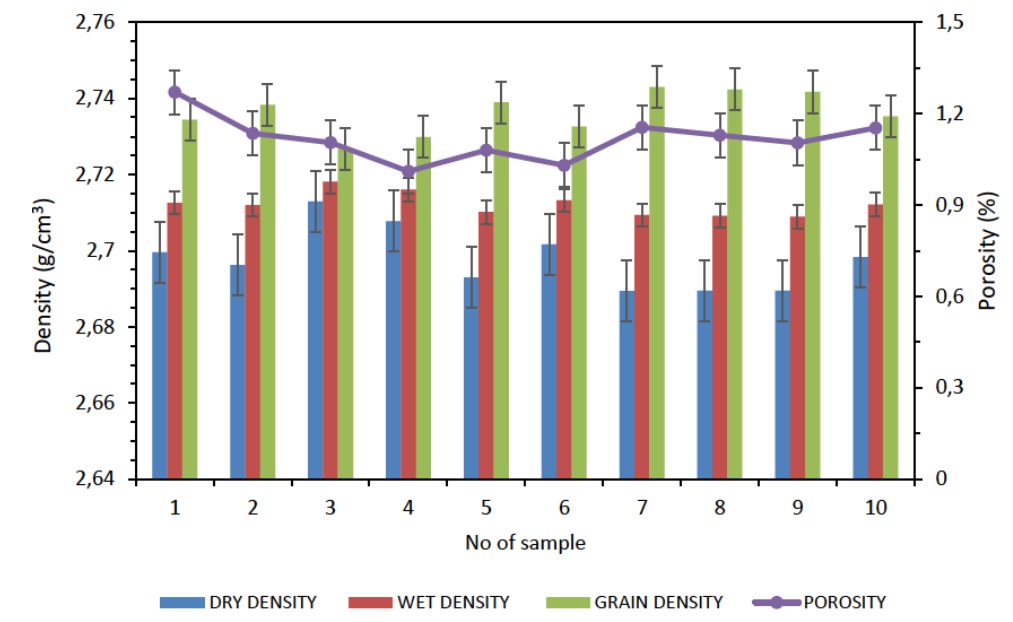
Chart of densities and porosity of 10 shale samples from the Collingham Formation.
Bar chart showing densities and porosity of 10 sandstone samples from the Ripon Formation.
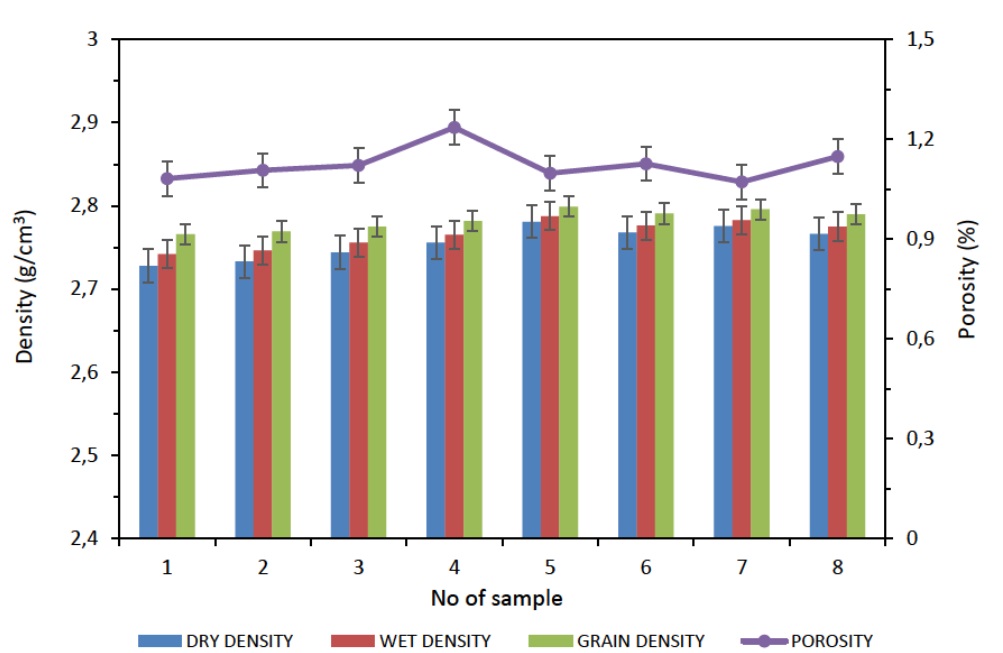
Chart showing densities and porosity of 8 sandstone samples from the Fort Brown Formation.

Average densities - porosity relationship for rocks from the Ecca Group. The negative correlation indicates that the lower the densities, the higher the porosity.
Average dry, wet and grain densities of the rock samples.
| FORMATION | LITHOLOGY | NUMBER OF SAMPLES | AVERAGE DRY DENSITY (g/cm3) | AVERAGE WET DENSITY (g/cm3) | AVERAGE PARTICLE DENSITY (g/cm3) | AVERAGE POROSITY (%) |
|---|---|---|---|---|---|---|
| Fort Brown | Shale | 8 | 2.7564 | 2.7663 | 2.7835 | 1.1238 |
| Ripon | Shale | 10 | 2.7615 | 2.7707 | 2.7867 | 0.8773 |
| Collingham | Shale / tuff | 10 | 2.6978 | 2.7122 | 2.7363 | 1.1175 |
| Whitehill | Black shale | 14 | 2.5258 | 2.5596 | 2.6102 | 2.1023 |
| Prince Albert | Khaki shale | 10 | 2.6411 | 2.6540 | 2.6748 | 1.2601 |
The porosity result reveals that the Whitehill Formation is the most porous unit with an average porosity of about 2.1% followed by the Prince Albert Formation with a porosity of 1.26%, then the Fort Brown, Collingham and Ripon Formations, respectively (Figure 11). The high porosity observed in the Whitehill Formation can be explained by the fact that these rocks have undergone extensive weathering, thus minerals like pyrite has been altered to gypsum and subsequently dissolve when in contact with water thereby opening pore spaces in rocks. The relationship between the average densities and porosity of all the formations that make up the Ecca Group shows that they are inversely correlated.
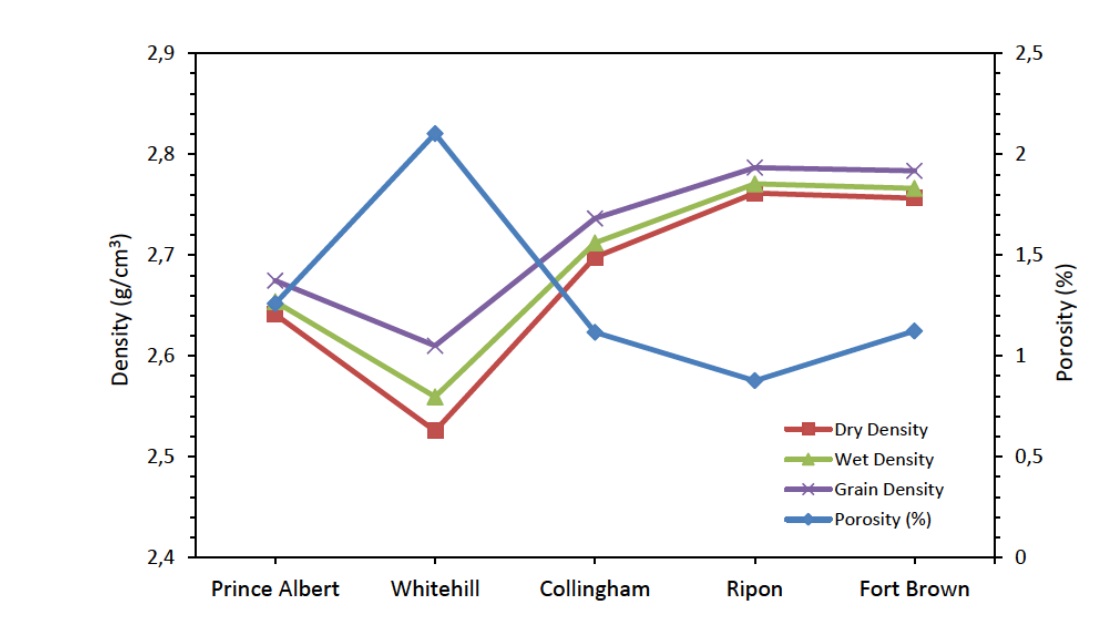
Variation of average densities and porosity with formation within the Ecca Group.
3.3 Magnetic
The magnetic data over the study area is shown in Figure 12. The main magnetic anomaly in Figure 12 has amplitude of up to 120 nT and runs from west to east across the study area. This anomaly is a “bean shape” anomaly and could be the result of a buried body with high magnetic minerals that stretches west - east across the study area. This anomaly may be part of the Mbashe anomaly identified and reported in [31]. The second long-wavelength anomaly is seen in the north-western part of the map. Several short-wavelength anomalies are evident in the northern part of the study area in Figure 12, and are highlighted further in Figure 13 (analytical signal).
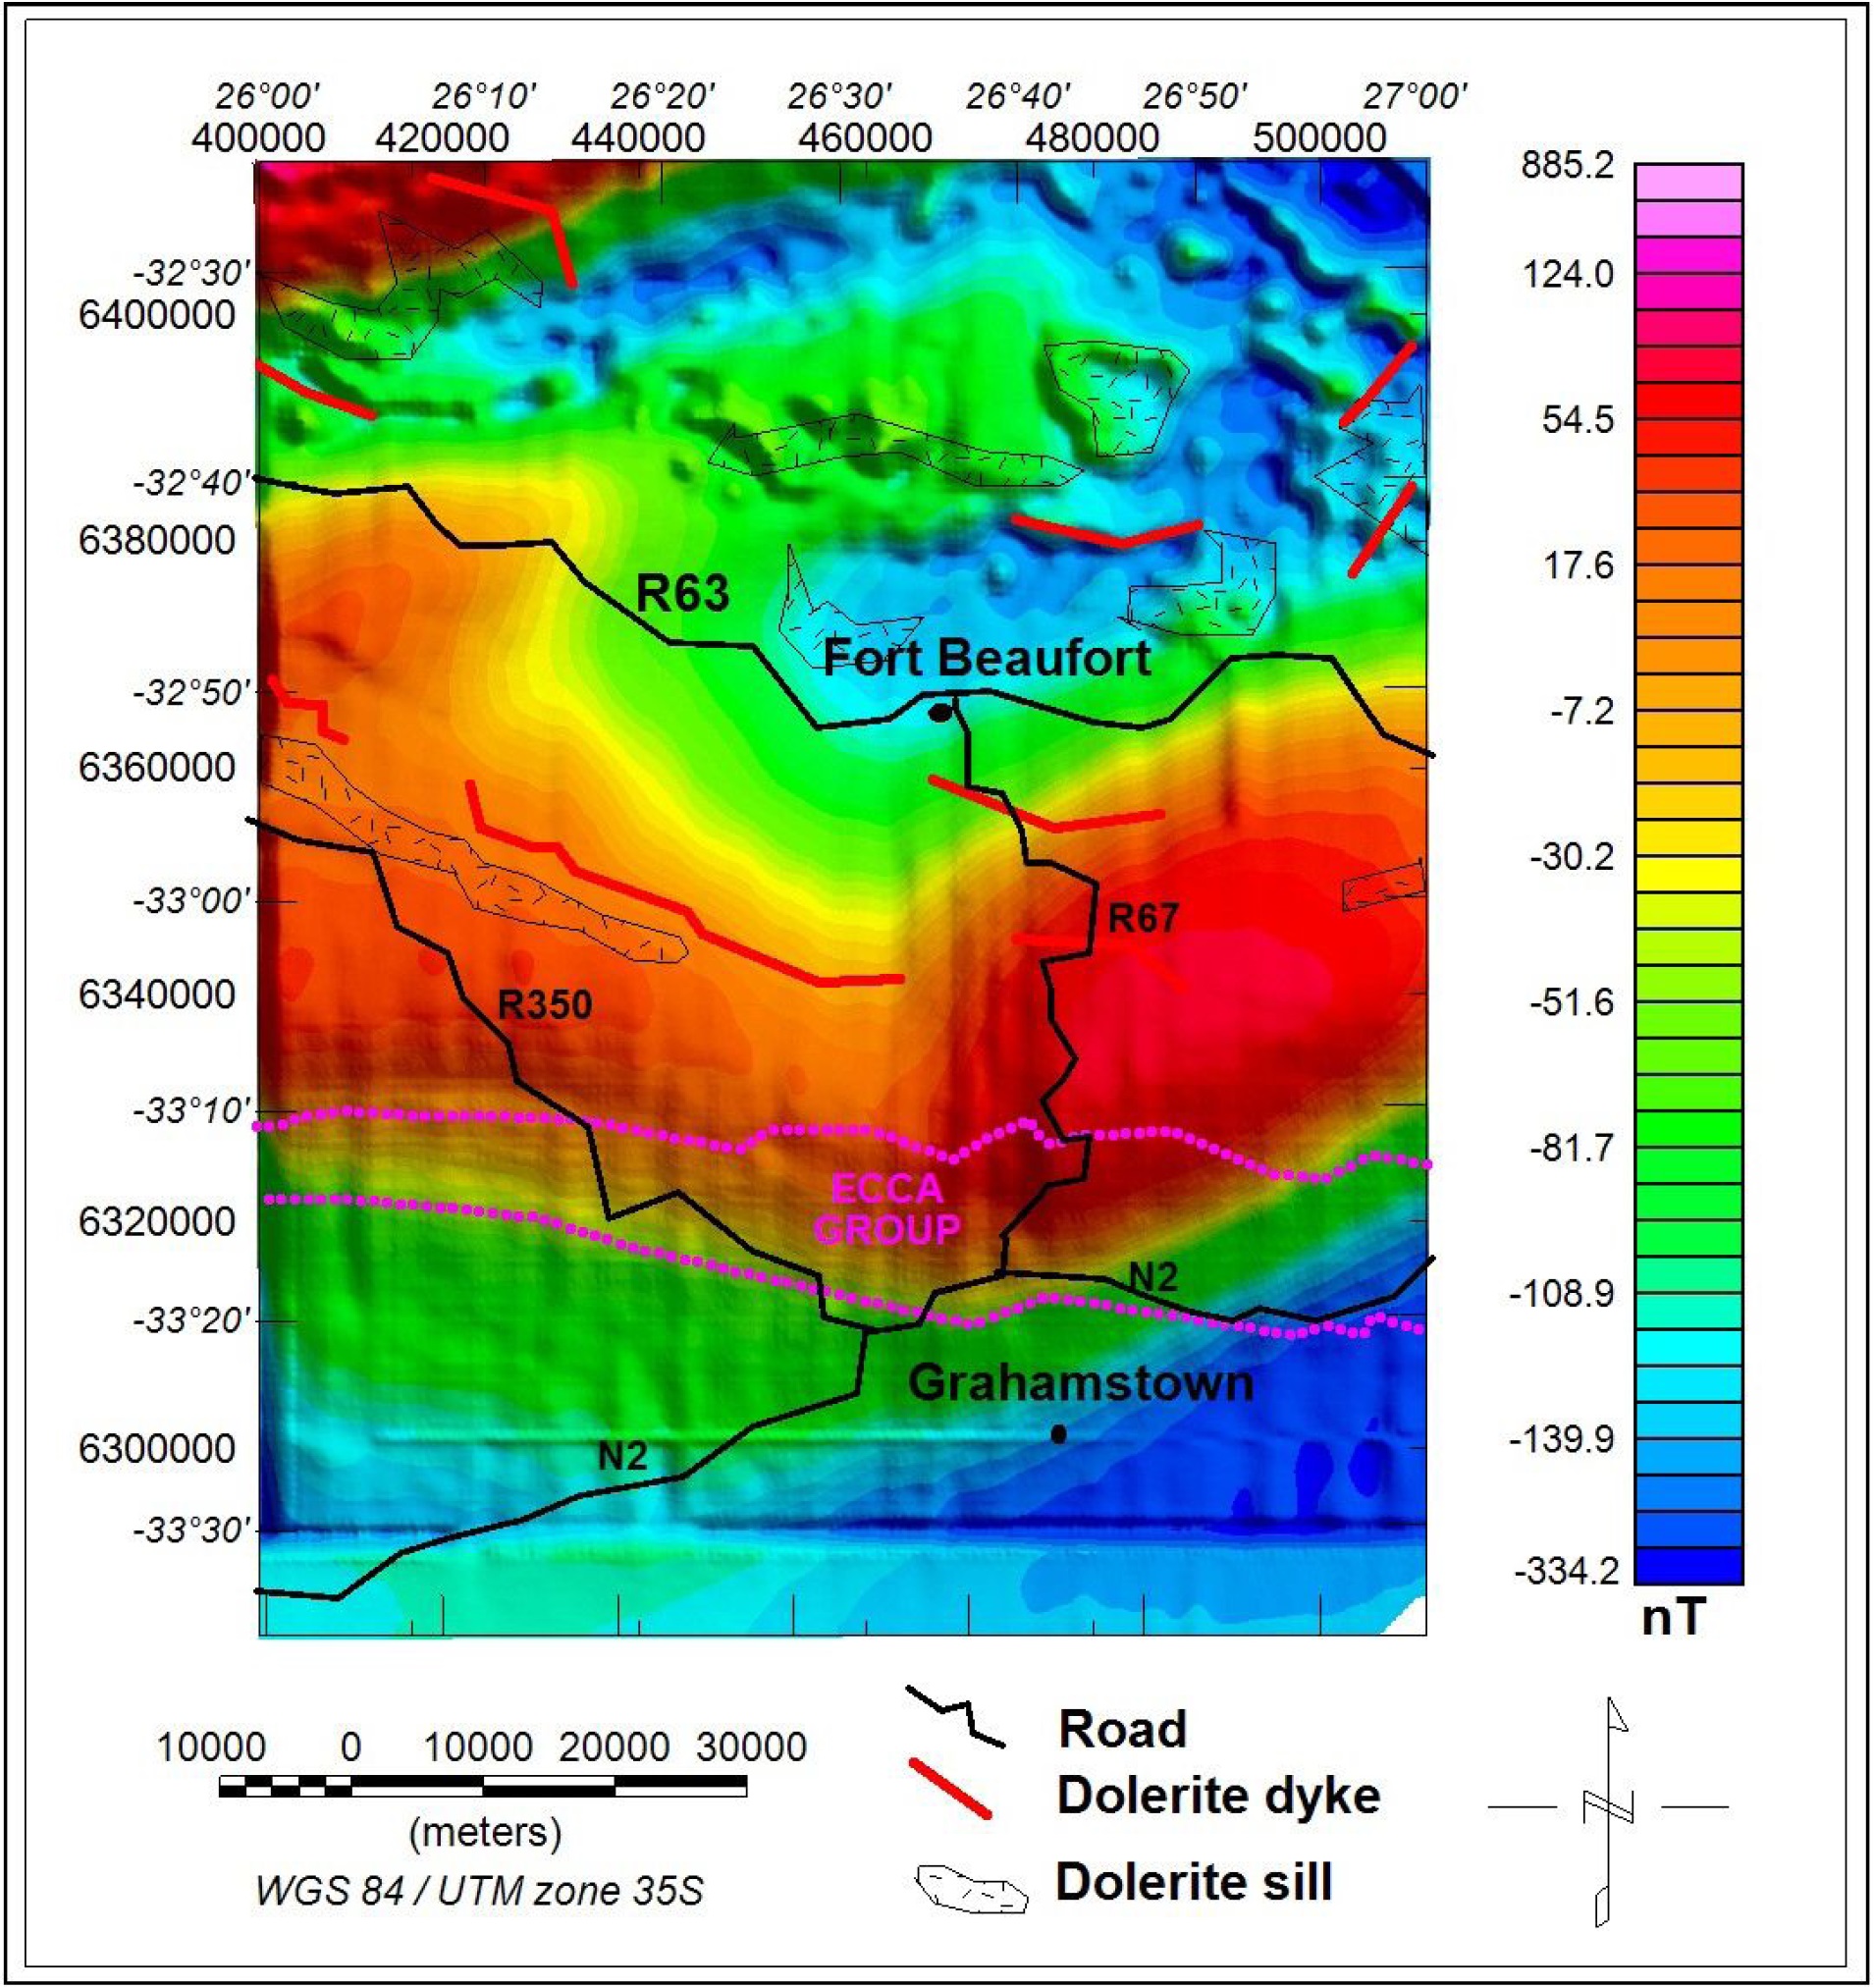
Reduced to the pole (RTP) magnetic anomaly map overlain on the mapped geology.
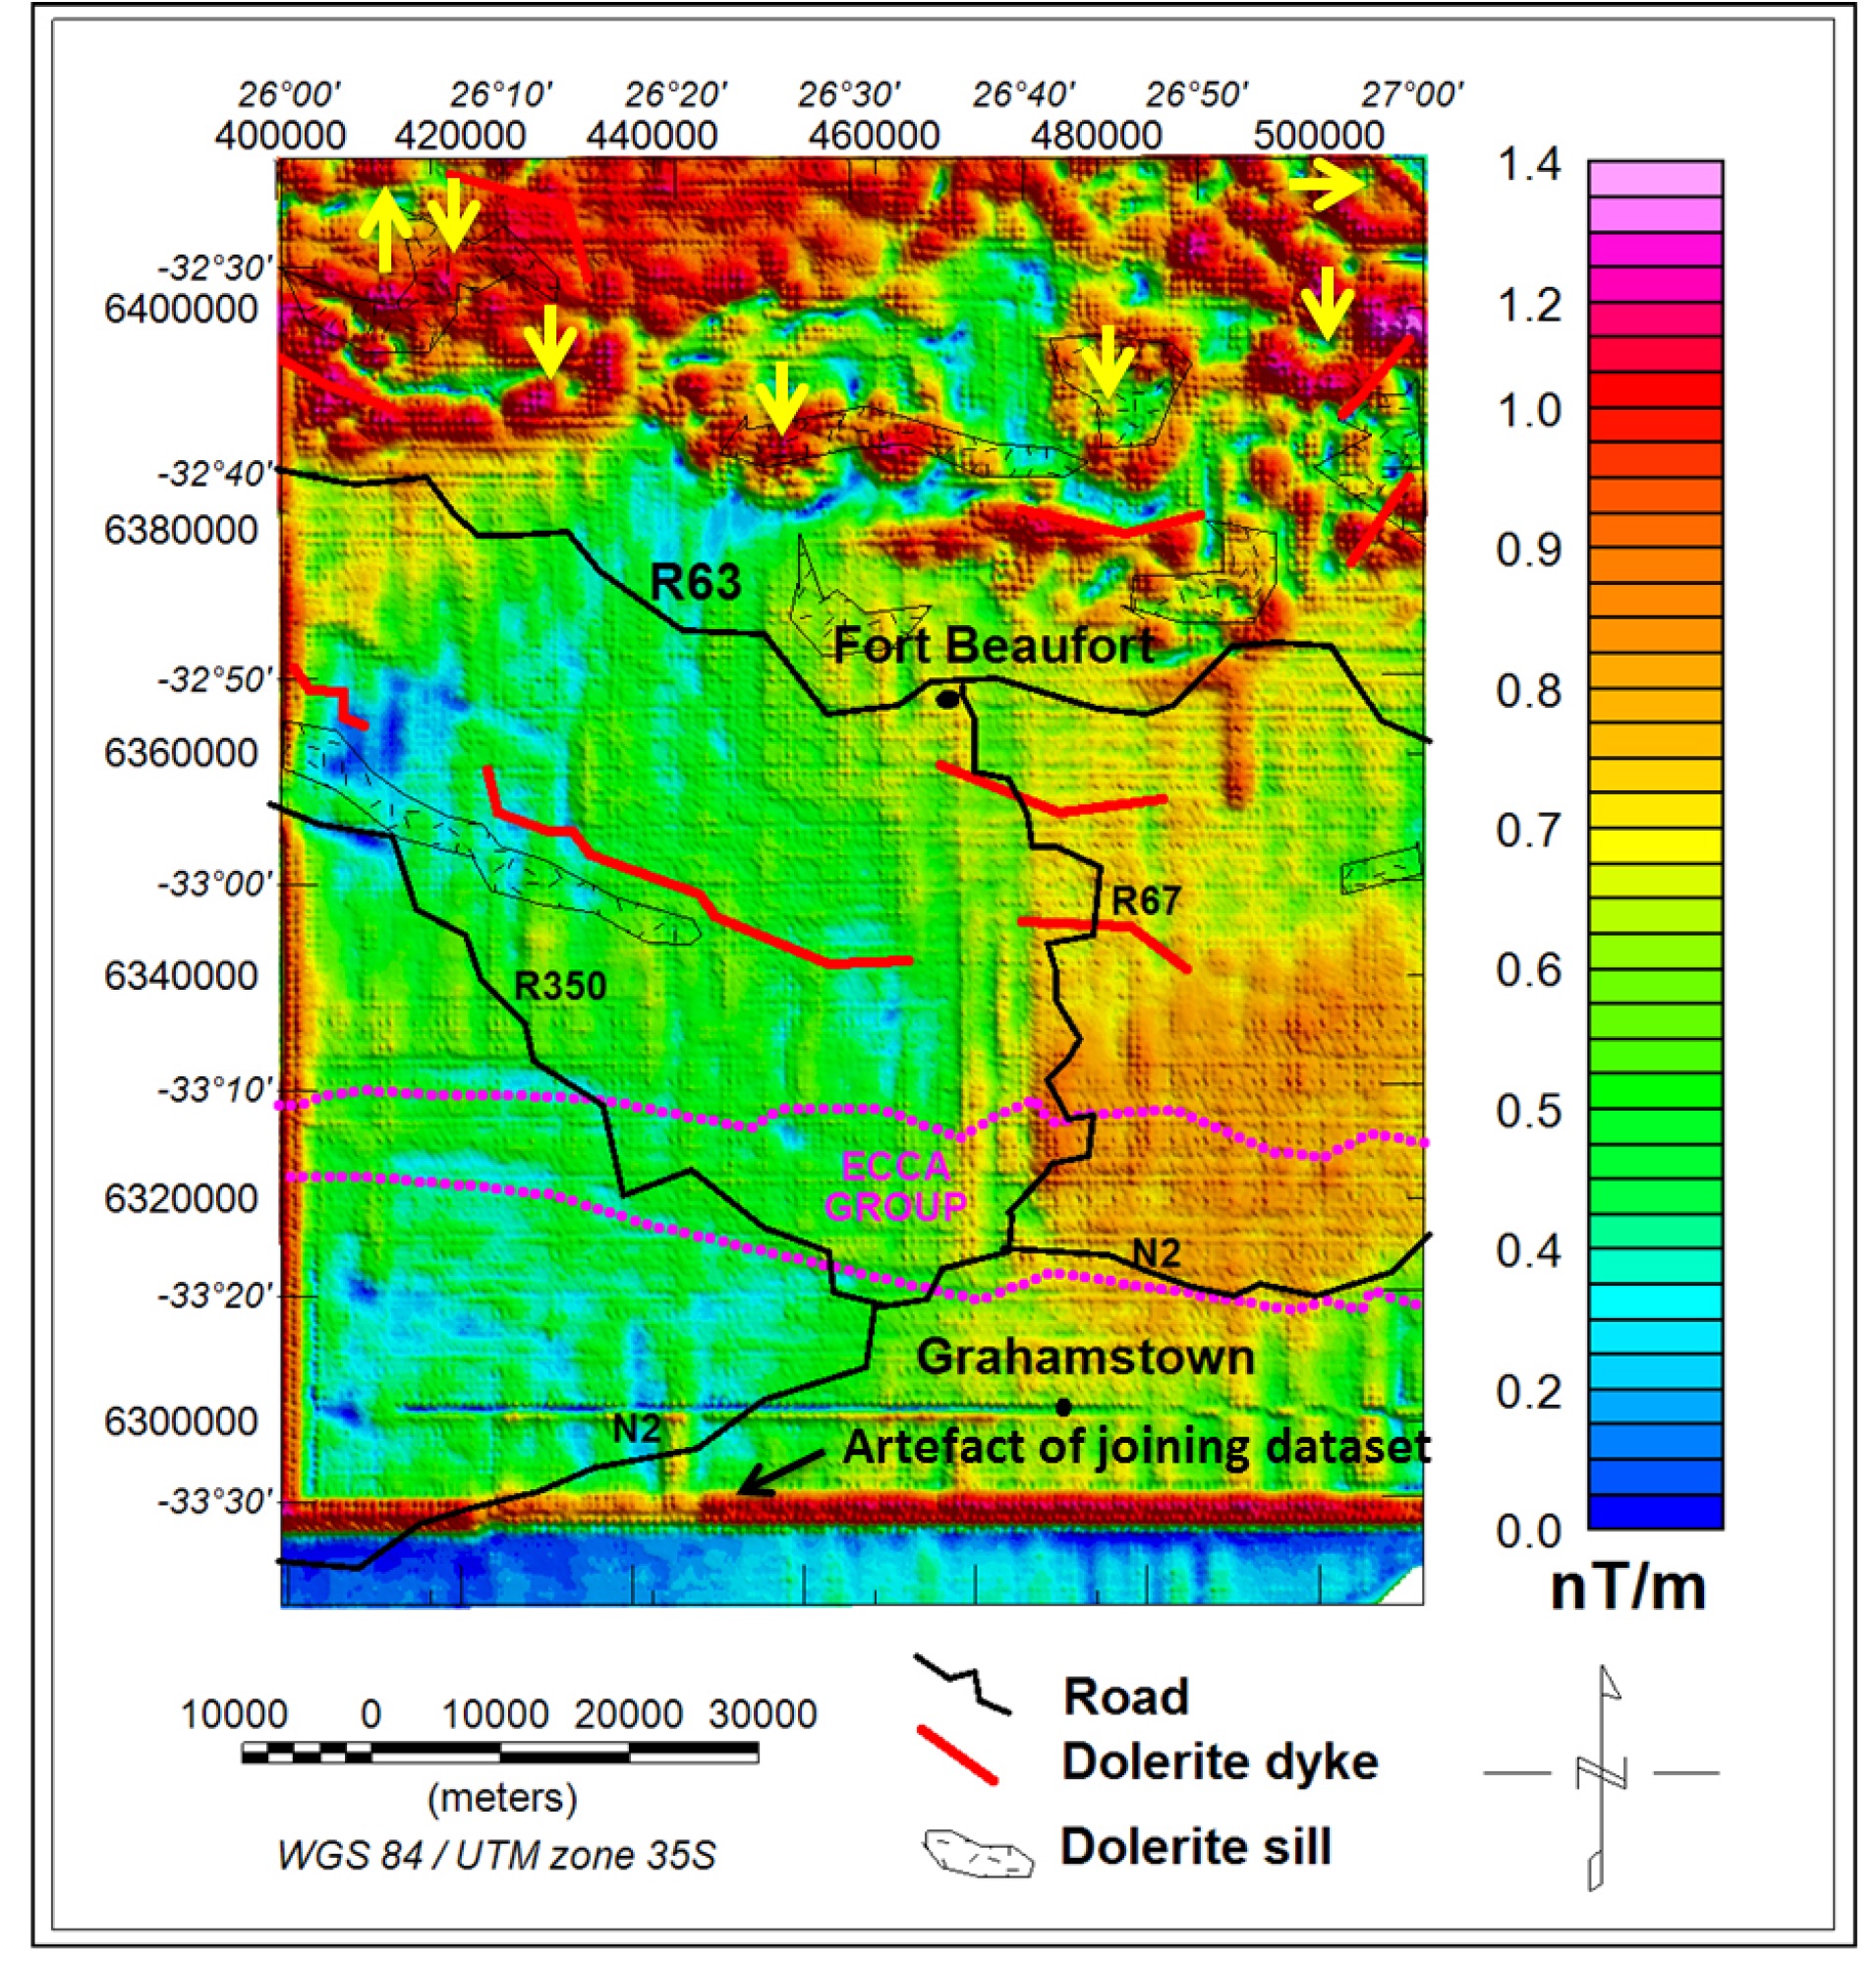
Analytical signal map overlain on the mapped geology.
The analytical signal map depicted in Figure 13 helps to detect/locate structures like dolerite intrusions and faults because it is not affected by magnetic field inclination or declination, as well as the direction of source magnetization. Dolerite intrusions (e.g. sills, shown with yellow arrows) are the main anomalies shown on the map and are dominant in the northern part of the map.
Depth to sources is connected to wavelength or frequency of the potential field data. The depth slices highlight specific interval of spatial frequencies (wavelength) that matches with the calculated or estimated depth in the subsurface by generating separate magnetic maps for a sequence of horizons with increasing depth. It aids comparison of amplitude response, thus the appearance and disappearance of a magnetic unit at different depth is recognised. Depth slicingworks on the principle of Wiener filtering, which assumes that potential field signals (i.e. magnetic and gravity) results from two or more uncorrelated arbitrary processes [32]. The various components of the data can be separated by highlighting the effects of shallow sources from deeper sources [32]. Most magnetic anomalies at the surface, usually originate at shallow depth, while obscure magnetic anomalies usually originate from a deeper depth [33]. Depth slices were performed and shown in Figure 14 in order to compare the anomaly amplitude responses at different depths such that the appearance and disappearance of magnetic anomalous features can be picked at a particular depth. Depth slice results (slices 1 - 6) clearly shows that the main magnetic anomaly in Figure 12 is due to a deeper source(s) because the anomalous body appears in all the depth slices and becomes broader with depth which is an indication that the source is very deep and possibly located in the basement. Thus, it is suggested that the anomaly is due to a buried magnetic-rich body within the basement. Also, a structural trend that coincides with the dolerite dykes and sills is seen in the far north-eastern part of slices 1- 5 (depth of about 1 – 10200 m) and thereafter disappear on slice 6 (depth of about 15800 m). The source of this trend is suggested to be located between the depths of about 10200 – 15800 m.
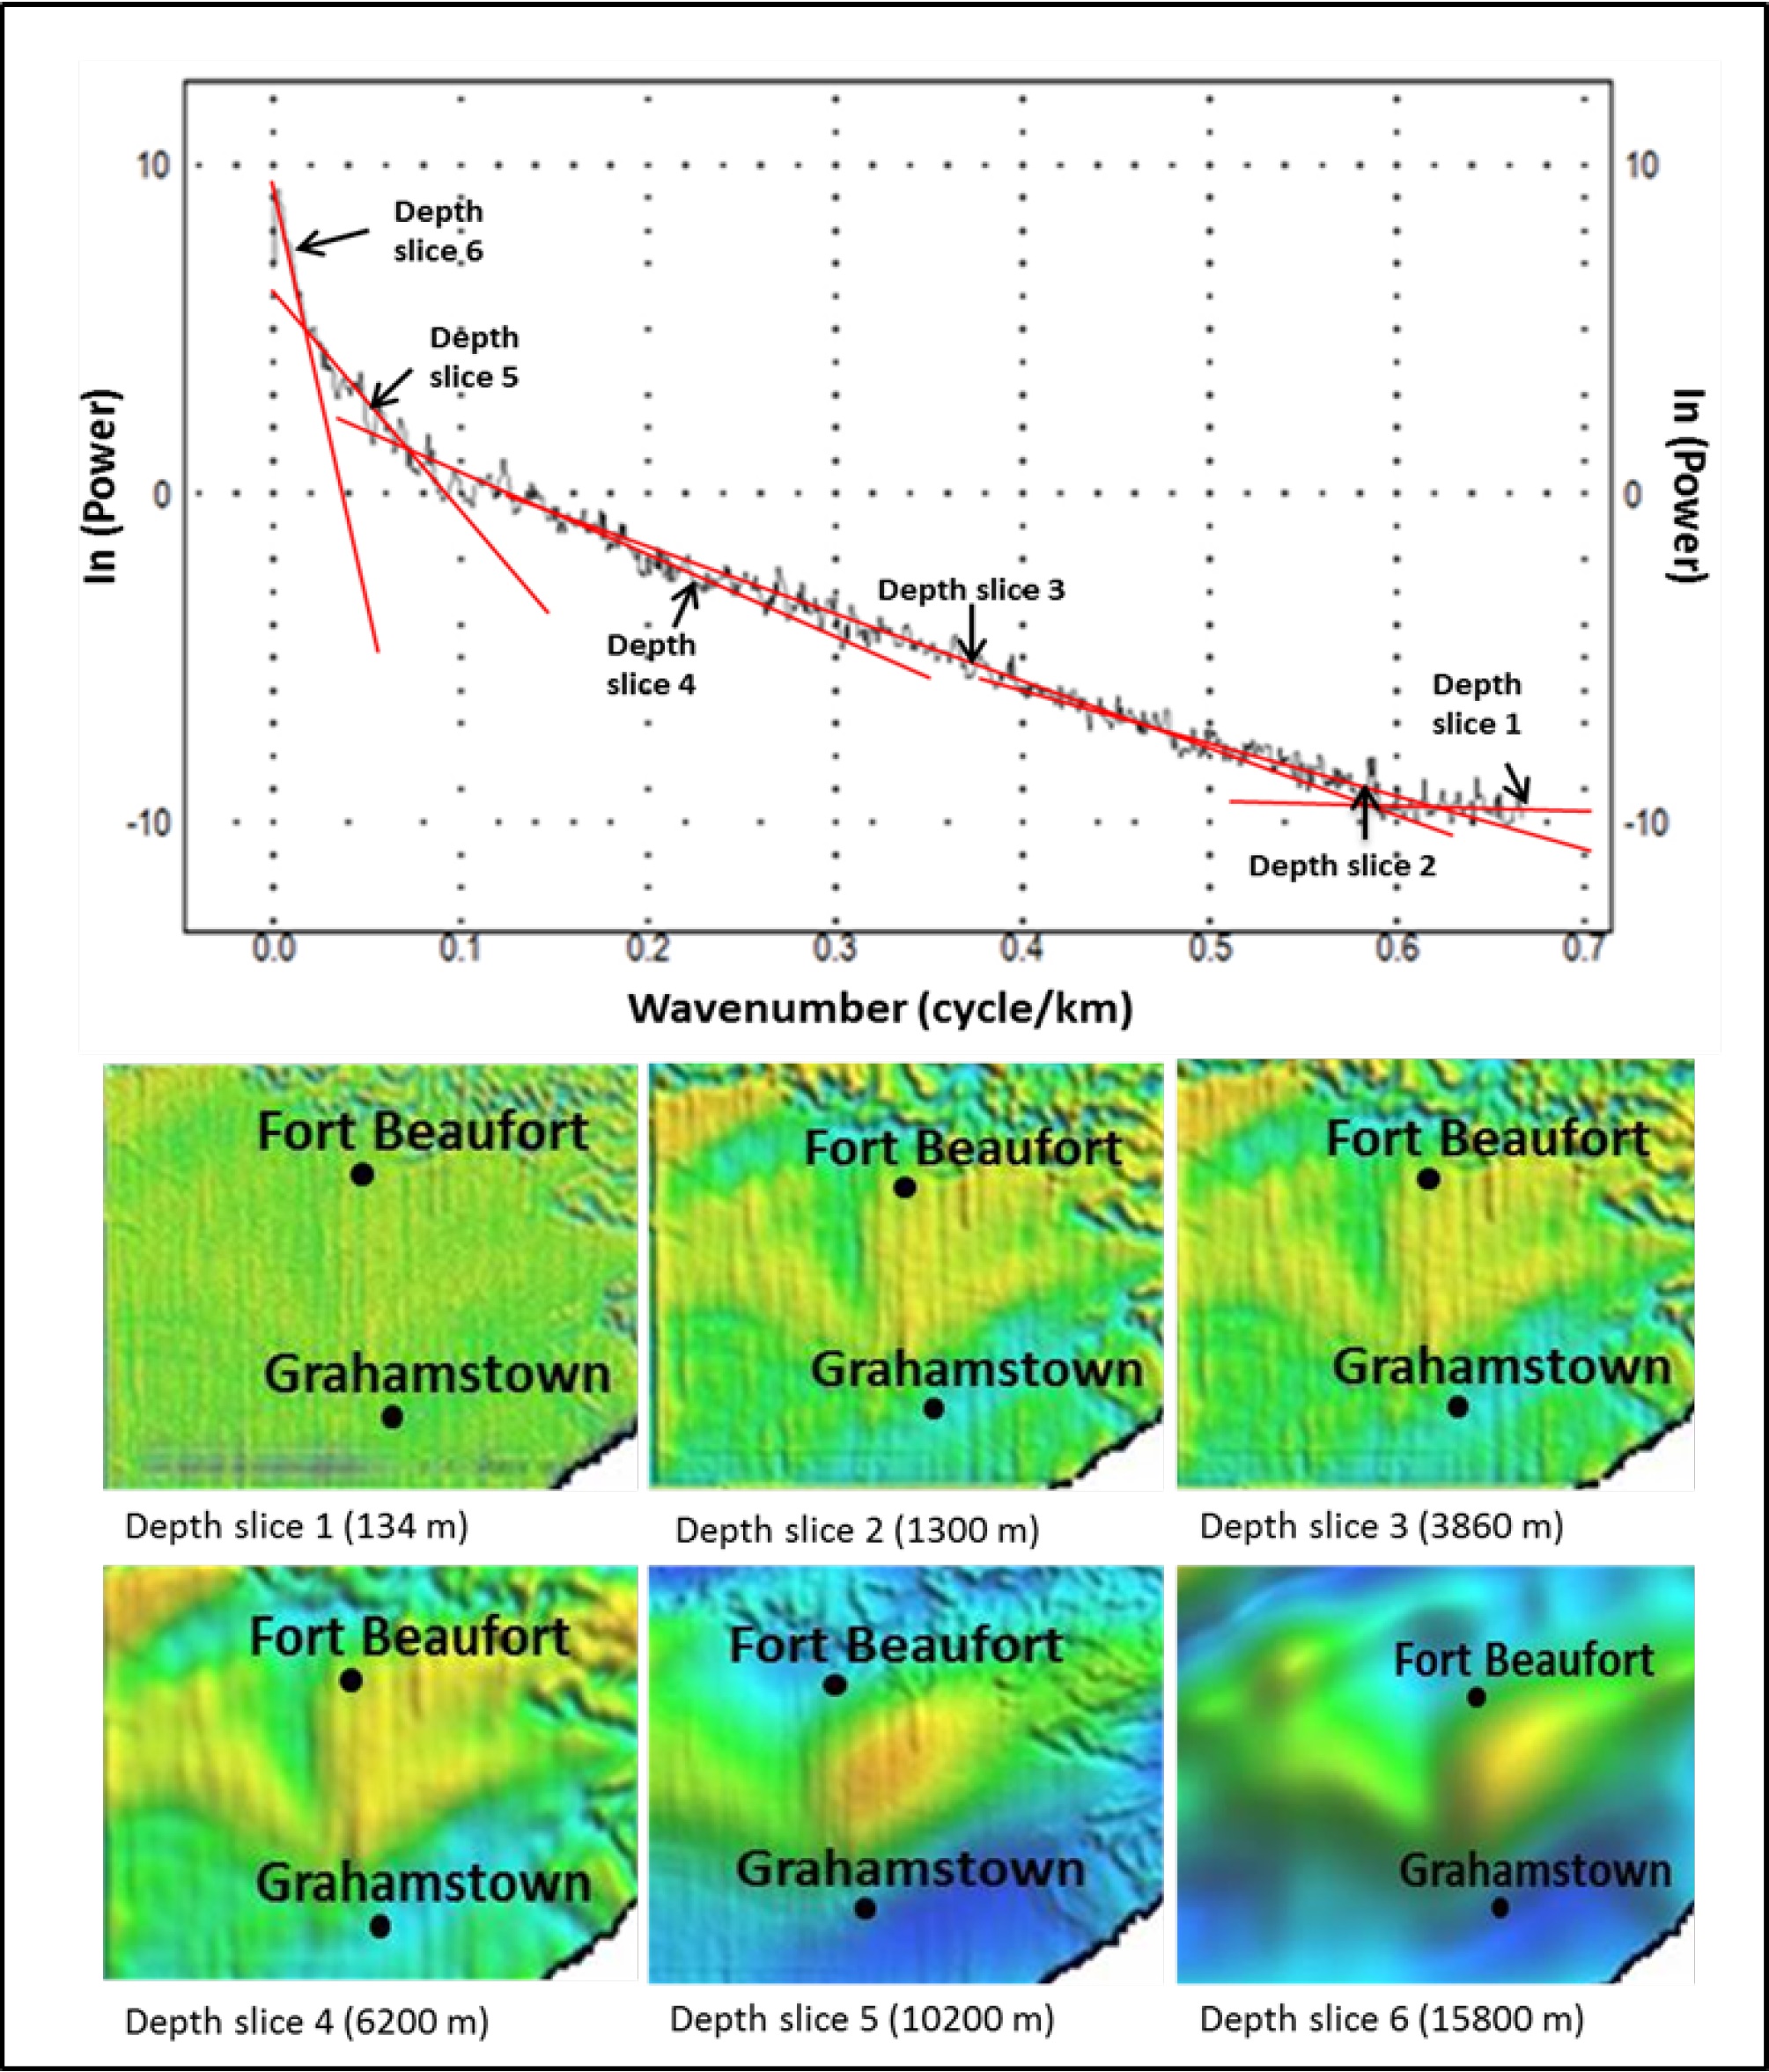
Depth slice showing changes in anomaly features with depth. The top power spectrum plot is displayed with a logarithmic stretch in order to show the strength of the sine and cosine components at each frequency since lower frequency Fourier components usually dominate aeromagnetic datasets due to the enormous changes in the amplitudes of the different spectral components. The radially averaged power spectrum of the field increases with decrease in depth (h) by a factor that is proportional to exponential (−4𝜋hk), where k is the wavenumber.
4 Discussion
The lower Ecca Group (the Prince Albert, Whitehill and the Collingham Formations) were believed to have accumulated in a deep marine basin, whilst the upper Ecca Group (the Ripon and Fort Brown Formations)were deposited in a deltaic-lacustrine environment. It was confirmed through mapping that the rocks of the Ecca Group are both argillaceous and arenaceous rock. The argillaceous rocks are mainly shales interbedded with mudstone and occasionally chert and clay stones which are of future economic significance when considering the large pure clay minerals in the study area. The sandstones are gray wackes (mainly feldspathic graywackes with few quartzitic-wackes), immature and poorly sorted, therefore, giving an indication that the source area is near. The observed heavy minerals as well as the lithic grains signify that the minerals are of granitic, volcanic and metamorphic origin. The Ecca Group density values range from 2.4 – 2.8 g/cm3. The porosity values range from 0.7 – 2.4%. The relationship between the average dry density and porosity indicates that the two variables are inversely correlated. The porosity results shows that the Whitehill Formation is the most porous unit with an average porosity of about 2.1% and Ripon Formation has the lowest with an average porosity of about 0.8%. This density and porosity values fall within the range of 2.3 – 2.8 g/cm3 and 1 – 10% that was envisaged by several authors like [29, 30, 34] that studied the formations that make up the Ecca Group.
Several short-wavelength anomalies (i.e. dolerite intrusions) are evident in the northern part of the study area in Figure 13, and are highlighted further in Figure 14 (analytic signal map). These anomalies are also shown in the depth slices result appearing in depth slice of about 6000 m below the ground surface. The targeted depth for unconventional shale gas exploration in the Karoo Basin falls between 3000 to 5000 m below the ground surface and hydrogeological investigation of Karoo aquifers are limited to shallow depths of up to 500 m. As revealed by the depth slices, dolerite intrusions extend to a depth of about 6000 m and form a network of complex structures. The appearance of dolerite intrusions at targeted depth for gas exploration could pose a serious threat to fracking of the Karoo for shale gas. Again, these dolerite intrusions could possibly affect or have affected the quality of the petroleum resources. The magnetic map also shows a major magnetic anomaly that trend in a west-easterly direction. This anomaly is a “bean shape” anomaly and could be the Mbashe anomaly that was documented by in [31]. Depth slice results (slices 1-6) clearly shows that this anomaly is due to a deeper source(s) because the anomalous body appears in all the depth slices and becomes broader with depth which is an indication that the source is very deep and possibly located in the basement. The depth that was determined for this anomaly from the depth slices also support the work of several authors that the “bean shape” anomaly which coincides with a “shallow, sub-horizontal conductive band and regionally continuous in the Karoo basin” was located at a depth of about 7 – 30 km underneath the surface [4, 35, 36, 37, 38]. The dominant gravity variation in the study area is of long wavelength and it is suggested to be a deeper source/interface inland that shallows towards the coast e.g. the basement and/or Moho.
5 Conclusions
The formations of the Ecca Group in the Eastern Cape Province of South Africa were investigated in order to reveal their petrographic and geophysical characteristics. The petrographic study reveals that the rocks of the Ecca Group are both argillaceous and arenaceous rock. The argillaceous rock types are dominant in the lower Ecca Group while the arenaceous dominate the upper Ecca Group. The framework minerals are quartz, feldspar, micas and lithics. The sandstones are graywackes, immature and poorly sorted possibly indicating that the source area is near. The observed heavy minerals as well as the lithic grains signify that the minerals are of granitic, volcanic and metamorphic origin. Based on the proportion or ratio of the feldspar to lithic fragments, the sandstones of upper Ecca Group are termed arkosic sandstones. The density of the Ecca Group rocks varies from2.525 – 2.782 g/cm3. The average porosity range from 0. 75 – 4.4%. Based on the depth slices result, the depth to the magnetic source of the structural trend that coincides with the dolerite intrusions was suggested to be located between the surface down to depths of between 10200 – 15800 m. These will have had a significant impact on the Whitehill Formation and therefore, the quantity of gas still in the basin.
Conflict of Interest
Conflict of Interests: The authors declare that there is no conflict of interests regarding the publication of this paper.
Acknowledgement
The authors thank Centre of Excellence for Integrated Mineral and Energy Resource Analysis (CIMERA) and the Govan Mbeki Research and Development Centre (GMRDC) at Fort Hare University for financial support. The Council for Geoscience (CGS) is appreciated for supplying the magnetic data.
References
[1] Johnson M.R., van Vuuren C.J., Visser J.N.J., Cole D.I., Wickens H. de V., Christie A.D.M., Roberts D.L and Brandl G., Sedimentary Rocks of the Karoo Supergroup. In: Johnson, M.R., Anhaeusser, C.R. and Thomas, R.L. (Eds.), The Geology of South Africa. Geological Society of South Africa, Johannesberg/Council for Geoscience, Pretoria, 2006, 461-499Suche in Google Scholar
[2] Catuneanu O., Hancox PJ., Rubidge BS., Reciprocal flexural behavior and contrasting stratigraphies: a new basin development model for the Karoo retroarc foreland system, South Africa. Basin Res., 1998, 10, 417-43910.1046/j.1365-2117.1998.00078.xSuche in Google Scholar
[3] Tankard, A., Welsink, H., Aukes, P., Newton, R., Stettler, E., Tectonic evolution of the Cape and Karoo basins of South Africa. Marine and Petroleum Geology, 2009, 26, 1379-141210.1016/j.marpetgeo.2009.01.022Suche in Google Scholar
[4] Tankard, A., Welsink, H., Aukes, P., Newton, R., Stettler, E., Geodynamic interpretation of the Cape and the Karoo basins, South Africa. Phanerozoic Passive Margins, Cratonic Basins and Global Tectonics Maps. 2012, 86910.1016/B978-0-444-56357-6.00022-6Suche in Google Scholar
[5] Johnson, M.R., Sandstone petrography, provenance and plate tectonic setting in Gondwana context of the south-eastern Cape Karoo basin. South African Journal of Geology, 1991, 94, 137-154Suche in Google Scholar
[6] Johnson, M.R., van Vuuren, C.J., Hegenberger, W.F., Key, R., Shoko, U. Stratigraphy of the Karoo Supergroup in southern Africa: an overview. J. Afr. Earth Sci., 1996, 23, 3-15.10.1016/S0899-5362(96)00048-6Suche in Google Scholar
[7] Cole, D.I., Evolution and Development of the Karoo Basin. In: de Wit, M.J., Ransome, I.G.D., (Ed.), Inversion Tectonics of the Cape Fold Belt, Karoo and Cretaceous Basins of Southern Africa. Balkema, Rotterdam, Netherland, 1992, 87-100Suche in Google Scholar
[8] Weckmann, U., Jung, A., Branch, T., Ritter, O., Comparison of electrical conductivity structures and 2D magnetic modelling along two profiles crossing the Beattie Magnetic Anomaly, South Africa. South African Journal of Geology, 2007, 110, 449-46410.2113/gssajg.110.2-3.449Suche in Google Scholar
[9] Turner, B.R., Tectono-stratigraphical development of the Upper Karoo foreland basin: Orogenic unloading versus thermally-induced Gondwana rifting. Journal of Africa Earth Science, 1999, 28, 215-23810.1016/S0899-5362(99)00025-1Suche in Google Scholar
[10] Flint, S.S., Hodgson, D.M., Sprague, A.R., Brunt, R.L., van der Merwe, W.C., Figueiredo, J., Prélat, A., Box, D., Di Celma, C., Kavanagh, J.P., Depositional architecture and sequence stratigraphy of the Karoo basin floor to shelf edge succession, Laingsburg depocentre, South Africa. Marine and Petroleum Geology, 2011, 28, 658-67410.1016/j.marpetgeo.2010.06.008Suche in Google Scholar
[11] Pángaro, F., Ramos, V.A., Palaeozoic crustal blocks of onshore and offshore central Argentina: New pieces of the southwestern Gondwana collage and their role in the accretion of Patagonia and the evolution of Mesozoic south Atlantic sedimentary basins. Marine and Petroleum Geology, 2012, 37, 150-16210.1016/j.marpetgeo.2012.05.010Suche in Google Scholar
[12] Smith, R.M.H., Ericksson, P.G., Botha,W.J., A review of the stratigraphy and sedimentary environments of the Karoo-aged basins of Southern Africa. Journal of African Earth Sciences, 1993, 16 (132), 143-16910.1016/0899-5362(93)90164-LSuche in Google Scholar
[13] Catuneanu, O., Wopfner, H., Eriksson, P.G., Cairncross, B., Rubidge, B.S., Smith, R.M.H., Hancox, P.J., The Karoo basins of south-central Africa. Journal of African Earth Sciences, 2005, 43, 211-25310.1016/j.jafrearsci.2005.07.007Suche in Google Scholar
[14] Smith, R., A review of the stratigraphy and sedimentary environments of the Karoo basin of South Africa. J. Afr. Earth Sci., 1990, 10, 117-13710.1016/0899-5362(90)90050-OSuche in Google Scholar
[15] Jones, T.R., On some secondary fossils from South Africa, Geological Society of London, 1867, 139-17510.1144/GSL.JGS.1867.023.01-02.24Suche in Google Scholar
[16] Rogers, A.W., Report of the acting geologist for the year 1902, Annual Report of the Geological Commn, Cape of Good Hope, 1903, 3-10Suche in Google Scholar
[17] Rossouw, P.J., General Geology: the southern Karoo in Results of an investigation into the possible presence of oil in Karoo rocks in parts of the Union of South Africa, Memoirs of the Geological Survey of South Africa, 14-36, 1953Suche in Google Scholar
[18] Johnson, M. R., Stratigraphy and sedimentology of the Cape and Karoo sequences in the Eastern Cape Province. PhD Thesis (unpublished), Department of Geology, Rhodes University, Grahamstown, 1976, 336ppSuche in Google Scholar
[19] SACS (South African Committee for Stratigraphy), Stratigraphy of South Africa. Part 1: Lithostratigraphy of the Republic of South Africa, South West Africa/Namibia and the Republics of Bophuthatswana, Transkei and Venda (Compiled by Kent, L.E.). Geological Survey of South Africa. Handbook, 1980, 8, 690ppSuche in Google Scholar
[20] Johnson M.R., Sandstone petrography, provenance and plate tectonic setting in Gondwana context of the south-eastern Cape Karoo basin. South African Journal of Geology, 1991, 94, 137-154Suche in Google Scholar
[21] Visser, J.N.J., Loock, J.C., Water depth in the main Karoo Basin, South Africa, during Ecca (Permian) sedimentation. Trans. Geol. Soc. S. Aft., 1978, 81, 185-191Suche in Google Scholar
[22] Catuneanu, O., Hancox, P.J., Cairncross, B., Rubidge, B.S., Foredeep submarine fans and forebulge deltas: orogenic off-loading in the underfilled Karoo Basin. Journal of African Earth Sciences, 2002, 35, 489-50210.1016/S0899-5362(02)00154-9Suche in Google Scholar
[23] Smith, R.M.H., Ericksson, P.G., Botha,W.J., A review of the stratigraphy and sedimentary environments of the Karoo-aged basins of Southern Africa. Journal of African Earth Sciences, 1993, 16 (132), 143-16910.1016/0899-5362(93)90164-LSuche in Google Scholar
[24] Catuneanu, O., Elango, H., Tectonic control on fluvial styles: the Balfour Formation of the Karoo Basin, South Africa. Sedimentary Geology, 2001, 140, 291-31310.1016/S0037-0738(00)00190-1Suche in Google Scholar
[25] Visser, J.N.J., A review of the Stormberg Group and Drakensberg volcanics in southern Africa. Palaeontolgia Africana, 1984, 5-27Suche in Google Scholar
[26] Viljoen, J.H.A., Sedimentology of the Collingham Formation, Karoo Supergroup. South African Journal of Geology, 1994, 167-183Suche in Google Scholar
[27] Katemaunzanga, D., Gunter, C.J., Lithostratigraphy, sedimentology and provenance of the Balfour Formation, Beaufort Group in the Fort Beaufort Alice area, Eastern Cape Province, South Africa. Acta Geologica Sinica (English Edition), 2009, 83, 902-91610.1111/j.1755-6724.2009.00110.xSuche in Google Scholar
[28] Segwabe, T., The Geological Framework and Depositional Environments of the Coal-Bearing Karoo Strata in the Central Kalahari Karoo Basin, Botswana. MSc thesis (unpubl.), Rhodes University, South Africa. 2008, 169ppSuche in Google Scholar
[29] Baiyegunhi, C., Gwavava, O., Variations in isochore thickness of the Ecca sediments in the Eastern Cape Province of South Africa,as deduced from gravity models. Acta Geologica Sinica (English Edition), 2016, 90(5), 1699-171210.1111/1755-6724.12811Suche in Google Scholar
[30] Baiyegunhi, C., Gwavava, O., Magnetic investigation and 2½D gravity profile modelling across the Beattie Magnetic Anomaly in the South-eastern Karoo Basin, South Africa. Acta Geophysica, 2017, 65,119-13810.1007/s11600-017-0011-3Suche in Google Scholar
[31] Thomas, R.J., Du Plessis, A.J., Fitch, F., Marshall, C.G.A., Miller, J.A., Von Brunn, V., Watkeys, M.K., Geological studies in southern Natal and Transkei: implications for the Cape Orogen. In Inversion Tectonics of the Cape Fold Belt, Karoo and Cretaceous Basins of Southern Africa, 1992, 186ppSuche in Google Scholar
[32] Fuller, B.D., Two-dimensional frequency analysis and design of grid operators. In: Hansen, D.A., Heinrichs, W.E., Holmer, R.C., MacDougall, R.E., Rogers, G.R., Sumner, J.S., Ward, S.H., 1967, Society of Exploration Geophysicists’ Mining Geophysics, 1967, 2, 658-708.Suche in Google Scholar
[33] Gunn, P.J., Application of Wiener filters to transformations of gravity and magnetic data: Geophysical Prospecting, 1972, 20, 860-87110.1111/j.1365-2478.1972.tb00671.xSuche in Google Scholar
[34] Van der Voort, I., Risk based decision tool for managing and protecting groundwater resources. PhD Thesis (unpublished), University of the Free State, Bloemfontein, 2001, 235ppSuche in Google Scholar
[35] Thomas, B., Oliver, R., Ute, W., Reinhard, F.S., Frank, S., The Whitehill Formation: a high conductivity marker horizon in the Karoo Basin. South Africa Journal of Geology, 2007, 110, 465-47610.2113/gssajg.110.2-3.465Suche in Google Scholar
[36] Weckmann, U., Jung, A., Branch, T., Ritter, O., Comparison of electrical conductivity structures and 2D magnetic modelling along two profiles crossing the Beattie Magnetic Anomaly, South Africa. South African Journal of Geology, 2007, 110, 449-46410.2113/gssajg.110.2-3.449Suche in Google Scholar
[37] Lindeque, A., Ryberg, T., Weber, M., Stankiewicz, J., De Wit, M.J., Deep crustal seismic reflection experiment across the Southern Karoo basin, South Africa. South Africa Journal of Geology, 2007, 110, 419-43810.2113/gssajg.110.2-3.419Suche in Google Scholar
[38] Lindeque, A., de Wit, M.J., Ryberg, T., Weber, M., Chevallier, L., Deep crustal profile across the Southern Karoo basin and Beattie magnetic anomaly, South Africa: An integrated interpretation with tectonic implications. South Africa Journal of Geology, 2011, 114, 265-29210.2113/gssajg.114.3-4.265Suche in Google Scholar
© 2019 C. Baiyegunhi et al., published by De Gruyter
This work is licensed under the Creative Commons Attribution 4.0 Public License.
Artikel in diesem Heft
- Regular Articles
- 2D Seismic Interpretation of the Meyal Area, Northern Potwar Deform Zone, Potwar Basin, Pakistan
- A new method of lithologic identification and distribution characteristics of fine - grained sediments: A case study in southwest of Ordos Basin, China
- Modified Gompertz sigmoidal model removing fine-ending of grain-size distribution
- Diagenesis and its influence on reservoir quality and oil-water relative permeability: A case study in the Yanchang Formation Chang 8 tight sandstone oil reservoir, Ordos Basin, China
- Evaluation of AHRS algorithms for Foot-Mounted Inertial-based Indoor Navigation Systems
- Identification and evaluation of land use vulnerability in a coal mining area under the coupled human-environment
- Hydrocarbon Generation Potential of Chia Gara Formation in Three Selected Wells, Northern Iraq
- Source Analysis of Silicon and Uranium in uranium-rich shale in the Xiuwu Basin, Southern China
- Lithologic heterogeneity of lacustrine shale and its geological significance for shale hydrocarbon-a case study of Zhangjiatan Shale
- Characterization of soil permeability in the former Lake Texcoco, Mexico
- Detrital zircon trace elements from the Mesozoic Jiyuan Basin, central China and its implication on tectonic transition of the Qinling Orogenic Belt
- Turkey OpenStreetMap Dataset - Spatial Analysis of Development and Growth Proxies
- Morphological Changes of the Lower Ping and Chao Phraya Rivers, North and Central Thailand: Flood and Coastal Equilibrium Analyses
- Landscape Transformations in Rapidly Developing Peri-urban Areas of Accra, Ghana: Results of 30 years
- Division of shale sequences and prediction of the favorable shale gas intervals: an example of the Lower Cambrian of Yangtze Region in Xiuwu Basin
- Fractal characteristics of nanopores in lacustrine shales of the Triassic Yanchang Formation, Ordos Basin, NW China
- Selected components of geological structures and numerical modelling of slope stability
- Spatial data quality and uncertainty publication patterns and trends by bibliometric analysis
- Application of microstructure classification for the assessment of the variability of geological-engineering and pore space properties in clay soils
- Shear failure modes and AE characteristics of sandstone and marble fractures
- Ice Age theory: a correspondence between Milutin Milanković and Vojislav Mišković
- Are Serbian tourists worried? The effect of psychological factors on tourists’ behavior based on the perceived risk
- Real-Time Map Matching: A New Algorithm Integrating Spatio-Temporal Proximity and Improved Weighted Circle
- Characteristics and hysteresis of saturated-unsaturated seepage of soil landslides in the Three Gorges Reservoir Area, China
- Petrographical and geophysical investigation of the Ecca Group between Fort Beaufort and Grahamstown, in the Eastern Cape Province, South Africa
- Ecological risk assessment of geohazards in Natural World Heritage Sites: an empirical analysis of Bogda, Tianshan
- Integrated Subsurface Temperature Modeling beneath Mt. Lawu and Mt. Muriah in The Northeast Java Basin, Indonesia
- Go social for your own safety! Review of social networks use on natural disasters – case studies from worldwide
- Forestry Aridity Index in Vojvodina, North Serbia
- Natural Disasters vs Hotel Industry Resilience: An Exploratory Study among Hotel Managers from Europe
- Using Monarch Butterfly Optimization to Solve the Emergency Vehicle Routing Problem with Relief Materials in Sudden Disasters
- Potential influence of meteorological variables on forest fire risk in Serbia during the period 2000-2017
- Controlling factors on the geochemistry of Al-Shuaiba and Al-Mejarma coastal lagoons, Red Sea, Saudi Arabia
- The Influence of Kaolinite - Illite toward mechanical properties of Claystone
- Two critical books in the history of loess investigation: ‘Charakteristik der Felsarten’ by Karl Caesar von Leonhard and ‘Principles of Geology’ by Charles Lyell
- The Mechanism and Control Technology of Strong Strata Behavior in Extra-Thick Coal Seam Mining Influenced by Overlying Coal Pillar
- Shared Aerial Drone Videos — Prospects and Problems for Volunteered Geographic Information Research
- Stable isotopes of C and H in methane fermentation of agriculture substrates at different temperature conditions
- Prediction of Compression and Swelling Index Parameters of Quaternary Sediments from Index Tests at Mersin District
- Detection of old scattered windthrow using low cost resources. The case of Storm Xynthia in the Vosges Mountains, 28 February 2010
- Remediation of Copper and Zinc from wastewater by modified clay in Asir region southwest of Saudi Arabia
- Sedimentary facies of Paleogene lacustrine dolomicrite and implications for petroleum reservoirs in the southern Qianjiang Depression, China
- Correlation between ore particle flow pattern and velocity field through multiple drawpoints under the influence of a flexible barrier
- Atmospheric refractivity estimation from AIS signal power using the quantum-behaved particle swarm optimization algorithm
- A geophysical and hydro physico-chemical study of the contaminant impact of a solid waste landfill (swl) in King Williams’ Town, Eastern Cape, South Africa
- Landscape characterization using photographs from crowdsourced platforms: content analysis of social media photographs
- A Study on Transient Electromagnetic Interpretation Method Based on the Seismic Wave Impedance Inversion Model
- Stratigraphy of Architectural Elements of a Buried Monogenetic Volcanic System
- Variable secondary porosity modeling of carbonate rocks based on μ-CT images
- Traditional versus modern settlement on torrential alluvial fans considering the danger of debris flows: a case study of the Upper Sava Valley (NW Slovenia)
- The Influence of Gangue Particle size and Gangue Feeding Rate on Safety and Service Life of the Suspended Buffer’s Spring
- Research on the Transition Section Length of the Mixed Workface Using Gangue Backfilling Method and Caving Method
- Rainfall erosivity and extreme precipitation in the Pannonian basin
- Structure of the Sediment and Crust in the Northeast North China Craton from Improved Sequential H-k Stacking Method
- Planning Activities Improvements Responding Local Interests Change through Participatory Approach
- GIS-based landslide susceptibility mapping using bivariate statistical methods in North-western Tunisia
- Uncertainty based multi-step seismic analysis for near-surface imaging
- Deformation monitoring and prediction for residential areas in the Panji mining area based on an InSAR time series analysis and the GM-SVR model
- Statistical and expert-based landslide susceptibility modeling on a national scale applied to North Macedonia
- Natural hazards and their impact on rural settlements in NE Romania – A cartographical approach
- Rock fracture initiation and propagation by mechanical and hydraulic impact
- Influence of Rapid Transit on Accessibility Pattern and Economic Linkage at Urban Agglomeration Scale in China
- Near Infrared Spectroscopic Study of Trioctahedral Chlorites and Its Remote Sensing Application
- Problems with collapsible soils: Particle types and inter-particle bonding
- Unification of data from various seismic catalogues to study seismic activity in the Carpathians Mountain arc
- Quality assessment of DEM derived from topographic maps for geomorphometric purposes
- Remote Sensing Monitoring of Soil Moisture in the Daliuta Coal Mine Based on SPOT 5/6 and Worldview-2
- Utilizing Maximum Entropy Spectral Analysis (MESA) to identify Milankovitch cycles in Lower Member of Miocene Zhujiang Formation in north slope of Baiyun Sag, Pearl River Mouth Basin, South China Sea
- Stability Analysis of a Slurry Trench in Cohesive-Frictional Soils
- Integrating Landsat 7 and 8 data to improve basalt formation classification: A case study at Buon Ma Thuot region, Central Highland, Vietnam
- Assessment of the hydrocarbon potentiality of the Late Jurassic formations of NW Iraq: A case study based on TOC and Rock-Eval pyrolysis in selected oil-wells
- Rare earth element geochemistry of sediments from the southern Okinawa Trough since 3 ka: Implications for river-sea processes and sediment source
- Effect of gas adsorption-induced pore radius and effective stress on shale gas permeability in slip flow: New Insights
- Development of the Narva-Jõesuu beach, mineral composition of beach deposits and destruction of the pier, southeastern coast of the Gulf of Finland
- Selecting fracturing interval for the exploitation of tight oil reservoirs from logs: a case study
- A comprehensive scheme for lithological mapping using Sentinel-2A and ASTER GDEM in weathered and vegetated coastal zone, Southern China
- Sedimentary model of K-Successions Sandstones in H21 Area of Huizhou Depression, Pearl River Mouth Basin, South China Sea
- A non-uniform dip slip formula to calculate the coseismic deformation: Case study of Tohoku Mw9.0 Earthquake
- Decision trees in environmental justice research — a case study on the floods of 2001 and 2010 in Hungary
- The Impacts of Climate Change on Maximum Daily Discharge in the Payab Jamash Watershed, Iran
- Mass tourism in protected areas – underestimated threat? Polish National Parks case study
- Decadal variations of total organic carbon production in the inner-shelf of the South China Sea and East China Sea
- Hydrogeothermal potentials of Rogozna mountain and possibility of their valorization
- Postglacial talus slope development imaged by the ERT method: comparison of slopes from SW Spitsbergen, Norway and Tatra Mountains, Poland
- Seismotectonics of Malatya Fault, Eastern Turkey
- Investigating of soil features and landslide risk in Western-Atakent (İstanbul) using resistivity, MASW, Microtremor and boreholes methods
- Assessment of Aquifer Vulnerability Using Integrated Geophysical Approach in Weathered Terrains of South China
- An integrated analysis of mineralogical and microstructural characteristics and petrophysical properties of carbonate rocks in the lower Indus Basin, Pakistan
- Applicability of Hydrological Models for Flash Flood Simulation in Small Catchments of Hilly Area in China
- Heterogeneity analysis of shale reservoir based on multi-stage pumping data