Stability Analysis of a Slurry Trench in Cohesive-Frictional Soils
-
Wei Li


Abstract
The slurry trench has become increasingly common in underground engineering and the stability of a slurry trench has been an important design issue. Although many studies have focused on the overall stability of a slurry trench, few of that are related to its local stability. Based on the limit analysis, both two dimensional and three dimensional rotational failure mechanisms for the local failure of a slurry trench in a sandwiched weak layer are proposed, and the upper solutions of 2D and 3D safety factors for local failure mechanisms are derived to evaluate the stability of a slurry trench. Moreover, a numerical analysis combined with the strength reduction technique is performed to investigate the local stability and the local failure process of a slurry trench. The proposed analytical method is verified through the comparison with the results of FLAC3D. Finally, a parametric study on the influences of geometric and geologic parameters on the local stability of the slurry trench are investigated. The results show that the investigation on the local stability of a slurry trench is effective and reasonable, which can provide a reference for the engineers in the practical engineering.
1 Introduction
A slurry trench is built for some reinforced concrete walls such as cut-off walls adjacent to groundwater or diaphragm walls surrounding tunnels and open cuts to lay foundations. A slurry trench has become increasingly common in underground engineering. Therefore, the stability of a slurry trench is an important design issue. There are typically two kinds of slurry trench failure, namely the overall and local failure. The overall failure tends to occur at the shallow layer of soil and then the failure zone propagates to the ground surface leading to the failure of slurry trench. While there is a relatively weak layer below the ground surface, the local failure of the weak layer would occur and influence the stability of the slurry trench, which could cause the unstable soil to flow into the slurry trench inducing lateral extrusion of the trench wall, even causing damage to the nearby architectural structure and buried pipelines, as shown in Figure 1.
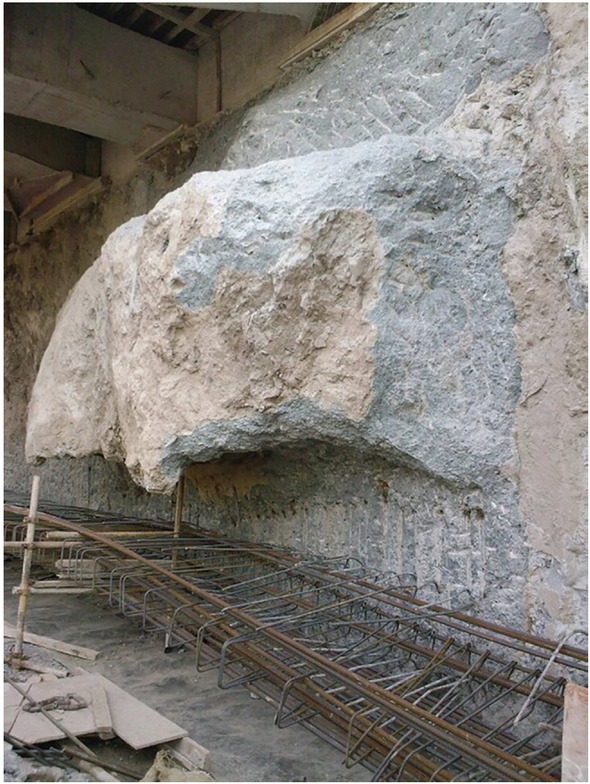
Concrete overflow caused by local failure of a slurry trench.
There have been several methods adopted to investigate the overall stability of a slurry trench. For good reproducibility, numerical simulations have been performed to investigate the stability of a slurry trench and visualize the failure zone [1, 2, 3, 4]. The limit equilibrium analysis methods investigate the bearing capacity problem by presupposing a failure mechanism and considering the static equilibrium of the failure zone [5, 6, 7, 8, 9, 10, 11]. Different influence factors of slurry trench are considered in these references. Moreover, Han et al. [12, 13] attempted to adopt the limit analysis to study the stability of a slurry trench for 2D and 3D failure mechanisms.
However, the references above mainly pay attention to the overall stability of a slurry trench but neglect the local stability of a slurry trench, which is also easy to occur when the geological condition is a weak soil layer sandwiched between two relatively stronger layers. In this case, the failure zone develops in the weak layer of the soil, and then the soil of weak layer near the trench wall will fall off and bury the slurry trench, which could severely affect the safety of engineering and cost more subsequent construction effort. With regard to the local stability of slurry trench, Tsai et al. [14, 15] and Shen [16] studied the problem of local stability of sandwiched weak soil in a slurry trench by adopting the limit equilibrium method to analyse the stress distribution on the trench surface. Xiao and Sun [10] investigate the local stability of a slurry trench through the centrifuge model test and found that the slurry trench is prone to a local failure in a sandwiched weaksoil. It is worth noting that Han et al. [13] proposed the local failure mechanism of a slurry trench based on the limit analysis, but their work is limited in the purely cohesive soil.
In this paper, the purpose is to adopt the limit analysis to develop a 2D and 3D local stability analysis of a slurry trench in a cohesive-frictional soil (weak layer) sandwiched by two relatively stronger soils. And a formula to determine the safety factor of local stability of a slurry trench is derived to obtain the upper bound solution. Besides, a numerical method combined with the strength reduction technique is presented to study the local stability of a slurry trench. Through the comparisons of results between the numerical method and analytical solution, the effectiveness and reasonability of the analytical approach is verified. Finally, a parametric study of the influence on the safety factor is carried out.
2 Limit Analysis for Local Stability of a Slurry Trench in Cohesive-Frictional Soils
The main advantages of limit analysis lie in its simplicity and rigorous theoretical basis considering the stress-strain relationship of soils without a prior assumption on the failure surface and stress distribution. There have been a number of research investigations related to the application of limit analysis to the slopes and tunnels, and it is shown that studies based on limit analysis have provided satisfactory results [17, 18, 19, 20, 21, 22, 23, 24, 25, 26, 27]. Therefore, this paper intends to apply the limit analysis to the local stability of a slurry trench. 2D and 3D rotational local failure mechanisms of a slurry trench suitable for cohesive-frictional soil (cohesive-frictional soil c ≠ 0φ ≠ 0, purely cohesive soil φ = 0, and purely frictional soil c = 0) are presented.
In order to follow the limit analysis theory, some assumptions must be made to simplify the complicated field conditions of a slurry trench into explicit theoretical model:
First, a kinematically admissible velocity field is assumed to satisfy the normal flow rule (equal dilatancy and friction angles
Where ɛ̇1, ɛ̇2, ɛ̇3 are principal strain rates and φ is the frictional angle.
Second, the thyxotropy of the slurry is assumed to make itself solidify and form a "cake" on the interface between the soil and slurry to prevent the fluid percolation in the soil. So the slurry and the underground water (if there is underground water) exerts a triangular hydrostatic pressure on the trench face, respectively.
Third, the local failure of a slurry trench is confined to a weak soil layer sandwiched by two stiff soils, the problem schematic is defined in Figure 2.

Problem definition.
The dissipation rate WD is calculated as the summation of the dot product of the elementary area and the velocity, as follows:
where c is the cohesion, St is the discontinuity surface surrounding the failure mechanism of slurry trench. vi is the velocity vector of elementary area dSi.
The work rate done by the soil weight WG is calculated as the summation of the dot product of the elementary block weight and the velocity, as follows:
where γi and vi is respectively the unit weight and the vertical component of velocity of elementary block dVi.
The work rate of the slurry pressure Wsr is calculated as the summation of the dot product of the slurry pressure of the elementary area and the velocity, as follows:
where Psri is the slurry pressure on the elementary area dSi, vi is the horizontal component of velocity, Sin is the interface between the soil and slurry.
If there is underground water in the soil, the parameters c, φ and γ above would be replaced by the effective cohesion c′, effective friction angle φ′ and the effective unit weight γ′, respectively. The work rate done by the hydrostatic pressure Ww on the trench face is calculated as follows:
where Pwi is the water pressure.
In this paper, the safety factor F of local stability of a slurry trench with given geometric parameters is defined as follows:
Eq. (6) is a common way to define the safety factor as the ratio of the load-resisting capacity to the destructive effect [12, 13, 26, 28, 29]. The minimum value of the safety factor F can be achieved by numerically optimization with the help of the optimization tool implemented in the Matlab. The process uses an arbitrary user-defined set of the independent parameters as the starting point of the optimization and converges to a unique optimum by a sequence of computations.
2.1 2D Limit Analysis for Local Stability
The 2D local failure schematic of a slurry trench with a geology condition that a weak layer(c − φ) is sandwiched between two relatively stronger layers is shown in Figure 3. A local failure develops inside the weak layer with a thickness of h. And the weak layer is h1 below the slurry level and h2 below the water level. The proposed 2D failure mechanism for the local stability of a slurry trench involves a rotational movement of a single rigid block, enveloped by a curve and defined by a logarithmic-spiral. The curve CFD is a surface of the velocity discontinuity rotating about the centre O, with an angular velocity ω. Note that r0, rh, θ0, θh, can be easily identified from Figure 3. A set of parameters are related to θ0 and θh. Hence, the rotational failure mechanism and the velocity field are entirely defined by θ0 and θh. The expression of r is described as follows:
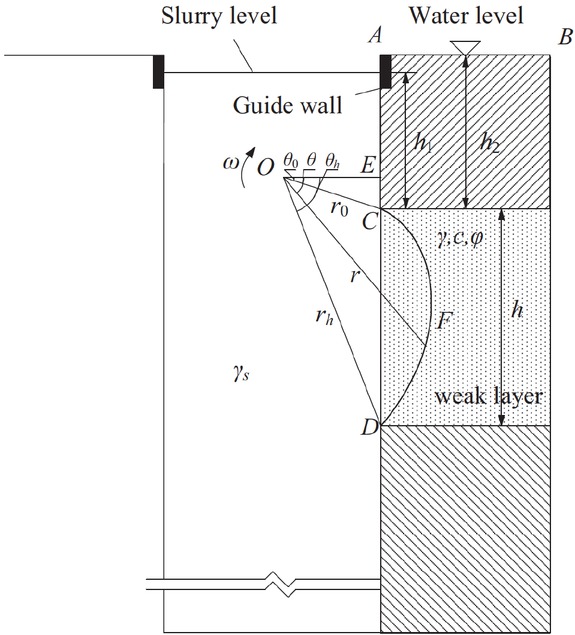
2D rotational mechanism schematic for the local failure of a slurry trench.
where θ is the angle with OE.
The work rate of the soil weight is calculated as the dot product of the soil weight of CFD and the vertical component of the velocity at the centroid. According to the centroid formula of the combined figure:
Therefore, the work rate of soil weight WG of CFD is calculated as follows:
where ACFD and
The elementary area dS along the discontinuity surface CFD is as follows:
According to Eq. (2), the dissipation is calculated as the integration along the discontinuity surface CFD, as follows:
The slurry pressure on the any point of interface CD is as follows:
where γsr is the unit weight of slurry in the trench.
The elementary area dS along the interface CD is as follows:
According to Eq. (4), the work rate done by the slurry pressure Wsr is calculated along the interface CD, as follows:
Similarly, the possible work rate done by the hydrostatic water pressure on the trench face CD is calculated as follows:
Where γw is the unit weight of water.
Hence, the safety factor F can be obtained by substituting the Eqs. (9), (11), (14) and (15) into the Eq. (6), which depends on the angle parameters θ0 and θh. A least upper bound solution can be found by numerically optimizing Eq. (6) with respect to θ0 and θh.
2.2 3D Limit Analysis for Local Stability
In this section, a 3D rotational local failure mechanism in cohesive-frictional soils is presented. The mechanism has a horn shape with an apex angle 2φ, and only a portion of this mechanism intersects with the weak layer of a slurry trench, as shown in Figure 4. The mechanism has one symmetric plane on the (x, z) plane. The trace of the mechanism (discontinuity surface) on the vertical symmetry plane is defined by two log spirals CD and C′D′.
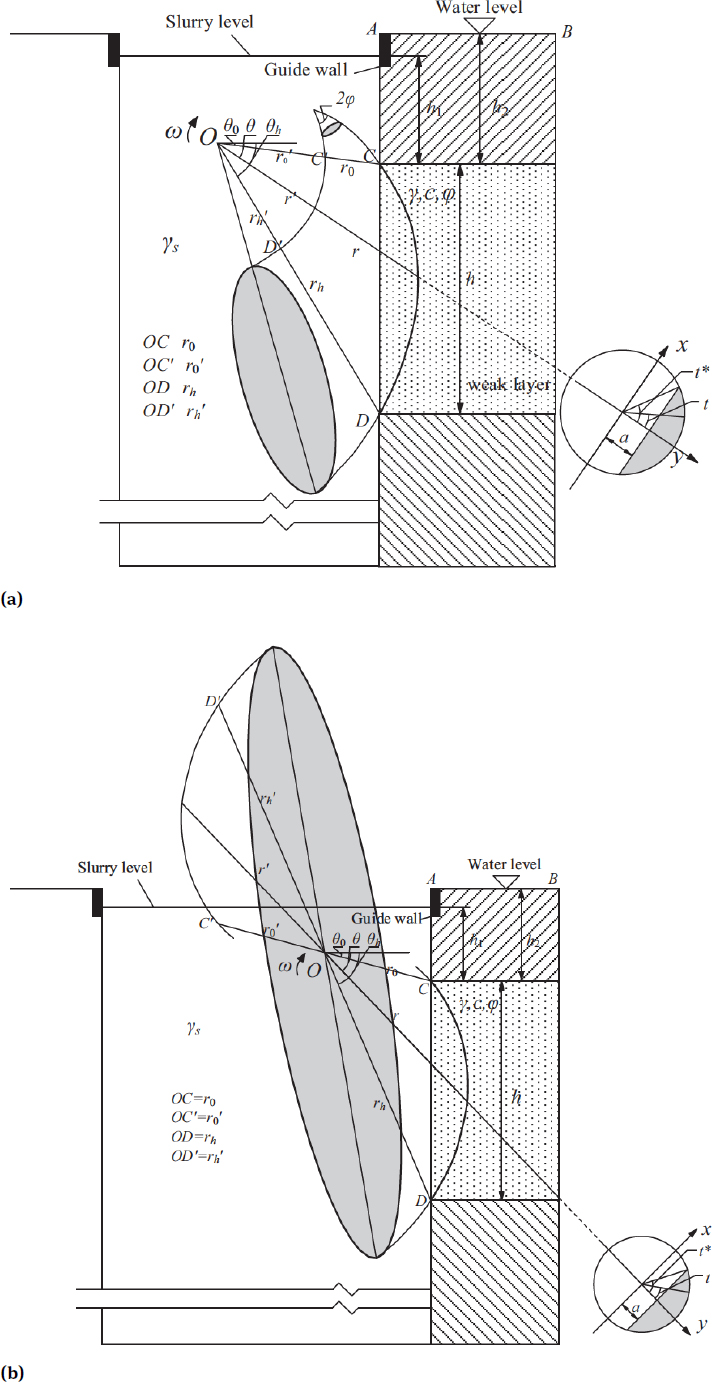
3D rotational mechanism schematic for the local failure of a slurry trench:
where r is distance of the point on the log spiral CD to the origin O (r′ represent the distance of the point of C′D′). r0 and rh are the length of OC and OD, respectively. Similarly,
The mechanism can be regarded as being generated by rotating a circle of increasing diameter (shaded circle in Figure 4) about an axis passing through point O outside the circle. When the circle is rotated about an axis passing through the circle
The ratio
To calculate the work rate of the failure mechanism, a local coordinate system (x, y) is adopted, as shown in Figure 4. (Axis x is perpendicular to the symmetric plane of the failure mechanism). And the shaded area in the (x, y) coordinate system represents one cross section of the failure block in the weak layer.
The infinitesimal elementary volume is calculated as follows:
Thus, according to the Eq. (3), the work rate of the soil weight can be obtained as follows:
where
where a is a function of θ, as follows:
The infinitesimal elementary area is calculated as follows:
Thus, according to the Eq. (2), the dissipation along the discontinuity surface is obtained as follows:
Where t* is described as follows:
where t is shown in Figure 4. Michalowski and Drescher [24] provided a simpler method for calculating the dissipation of the failure mechanism in cohesive-frictional soil, and more details can be found in that work (this method is confined to the soil with a non-zero friction angle φ). It is noted that the calculation for dissipation in this paper can be used for both cohesive-frictional and purely cohesive soils. The calculation can simply transform into the formula for purely cohesive soils when φ = 0.
The infinitesimal elementary area along the interface CD is calculated as follows:
According to the Eqs. (4) and (5), the work rates done by the slurry pressure and water pressure are respectively calculated as follows:
In the search for the minimum of the safety factor F, the ratio
3 Numerical Simulation
This section presents a study of numerical method on the local stability of a slurry trench. And the results of numerical simulation will be compared with the proposed analytical method. In this numerical model, the detailed information about the geologic and geometric conditions is summarized in Table 1 and the soil profile is shown in Figure 5.
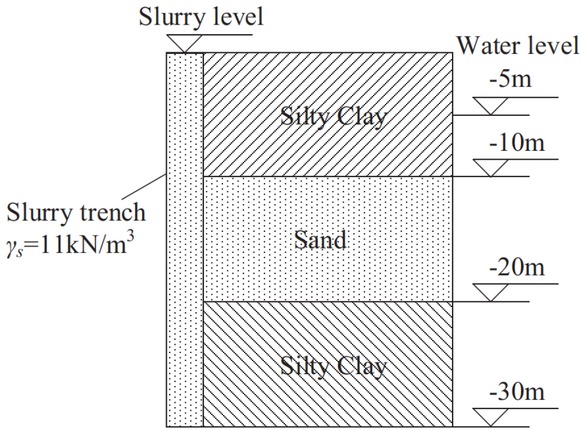
Soil profile of the slurry trench.
Geologic parameters
| Layer | Type | Unit Weight (kN/m3) | Es (MPa) | Cohesion (kPa) | Friction angle (∘) | Poisson ratio v |
|---|---|---|---|---|---|---|
| 1 | Silty clay | 20.0 | 7.2 | 45 | 17 | 0.4 |
| 2 | Sand | 20.0 | 14.4 | 5 | 20 | 0.4 |
| 3 | Silty clay | 20.0 | 9.8 | 45 | 17 | 0.4 |
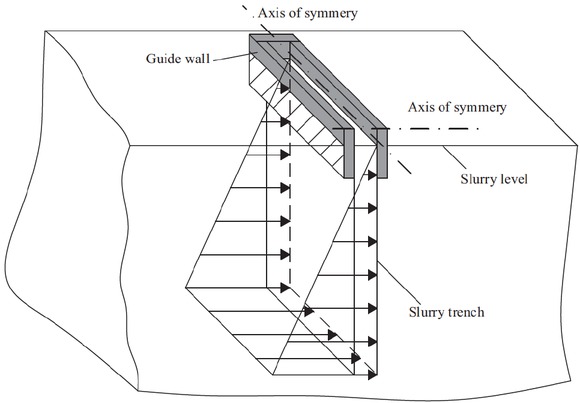
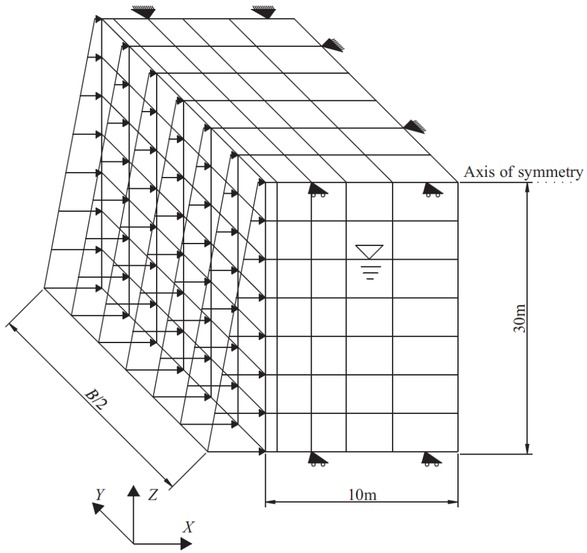
Figure 6 presents a half part of a slurry trench, it is easily found that the slurry trench has an advantage of symmetry along two axes. So this paper takes a quarter of the slurry trench model to study. Three layers are built in the numerical model, and a weak soil is sandwiched between two stiff soils, as shown in Figure 7. The numerical model is established with a discretization of 12000 zones and a total of 14091 nodes. The size of the numerical model is 10m in the X direction, 30m in the Z direction and 5m in the Y direction (the length B of trench is 10m). The boundary conditions are set as follows: Nodes at the bottom of mesh are fully fixed. Nodes on the vertical symmetric plane are only fixed in the X direction. And Nodes on the vertical boundary are only free to move vertically. The load distribution due to the slurry pressure acting on the trench face is converted into the equivalent nodal force in the FLAC 3D model. And a hydrostatic stress field is set up in the model. An elastic-perfectly plastic constitutive model governed by the Mohr-Coulomb criterion is assigned to the soil. In addition, the guide wall is simply modelled by preventing the nodes representing the guide wall from the movement in the X direction.
Schematic of a slurry trench model.
Numerical model of a slurry trench in FLAC3D.
In this numerical analysis, the safety factor is determined with the strength reduction method (SRM). The soil strength parameters of the weak soil are defined as follows:
The initial values of the safety factor F is provided with 0.1, which gives the high values of the strength parameters and the weak layer will be in the elastic condition. The safety factor F is then incrementally increased by 0.01 and the strength of weak layer is continuously reduced. The process is repeated until the failure occurs at the sandwiched soil layer (In FLAC 3D, a monitor point is set on the midpoint of weak layer. And the failure occurs when the displacement of the monitor point has a sudden increase). At this instant, the value of the safety factor F comes to be the minimal safety factor of local stability of a slurry trench, as shown in Figure 8.
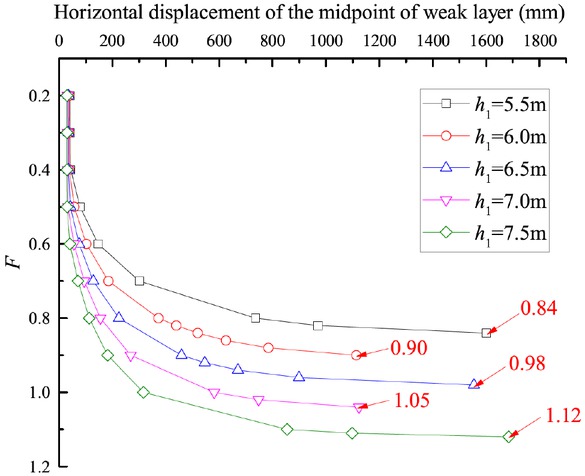
Determination on the safety factor of the weak layer in FLAC3D.
4 Results and Discussion
This section will present the results obtained from the analytical method and the numerical simulation. Both the safety factor F and the failure pattern of the analytical method will be compared with that of the numerical simulation. Besides, the influences of the geologic and geometric parameters on the safety factor will be investigated.
4.1 Comparison between the Numerical Simulation and the Analytical Method
In this section, the results of the proposed failure mechanism for a slurry trench in the cohesive-frictional soils will be compared with that of the numerical simulation.
Figure 9 presents the comparison between the SRM defined safety factors obtained from the numerical simulation and the load-resisting ratio defined safety factors calculated by the proposed kinematical analytical solution. It is noted that the lines representing respectively the numerical results and the analytical solutions intersects at the point where the safety factor is equal to 1.0. Before this point, the safety factors obtained from the analytical approach are smaller than that of the SRM-FLAC3D. Beyond this point, the SRM-FLAC3D gives a more conservative result. For the most practical cases, the engineering projects are considered to be safe when the F is larger than one, and the projects are believed to be dangerous or have a risk of failure when the F is smaller than one. Therefore, it is suggested that the engineers should take the results of the analytical approach and the SRM-FLAC3D simultaneously into consideration in different cases and choose a more secure way to determine the safety factor of the local stability of a slurry trench. Besides, it is shown that two methods give the same estimate on whether the slurry trench is safe or not, thus the local stability of a slurry trench can be assessed by the SRM-FLAC3D and analytical approach in the meantime.
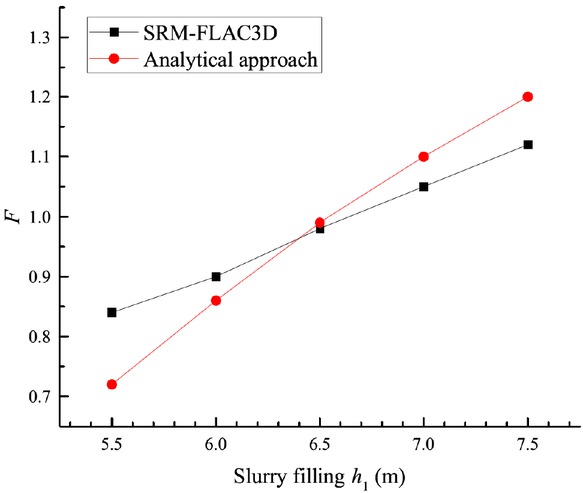
Comparison of the safety factors obtained from analytical approach and SRM-FLAC3D.
Figure 10 shows the comparison of the failure patterns predicted by the proposed failure mechanism and the contour of shear strain increment of FLAC3D in the vertical symmetric plane. The proposed failure mechanism is assumed to be confined to the sand layer sandwiched by two strong soils. The contour of shear strain increment of FLAC3D shows the zone where shear strain appears, and the zone of large shear strain is also regarded as the region where the shear failure occurs. It can be seen from Figure 10 that the large shear appears around the curve plotted by the analytical method. Consequently, the comparison shows the predicted discontinuity surface agrees well with the zone where large shear strain appears, which proves the discontinuity surface predicted by the analytical approach is reasonable and the local failure of a slurry trench occurs in the vicinity of the trench face of the weak layer.
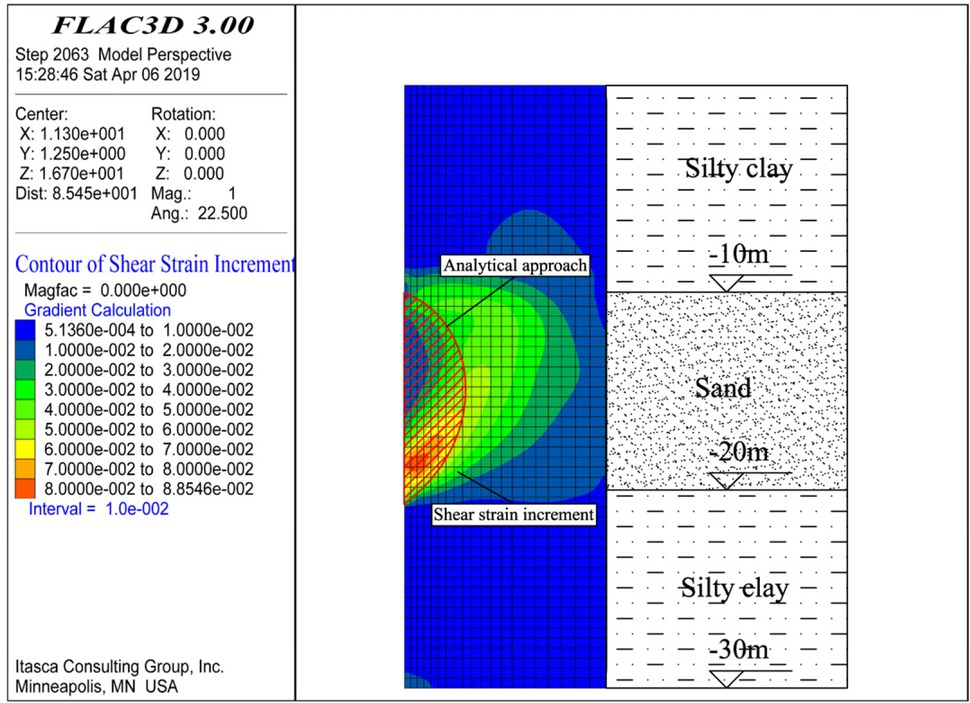
Comparison between the predicted discontinuity surface and the contour of shear strain increment of FLAC3D in the symmetric (x,z) plane.
Figure 11 shows the comparison of the failure patterns predicted by the proposed failure mechanism and the plastic zone obtained from FLAC3D in the vertical symmetric plane. It can be seen that the plastic zone of FLAC3D agrees well with the failure pattern of the analytical method. The plastic zone first occurs at two interfaces between the stiff soil and the sandwiched weak soil. And then the plastic zone extends in the sandwiched weak soil in a logarithmic spiral surface similar with the 3D failure mechanism proposed in this paper. At last, the plastic zone will develop throughout the whole weak soil layer and the local failure of the slurry trench happens.
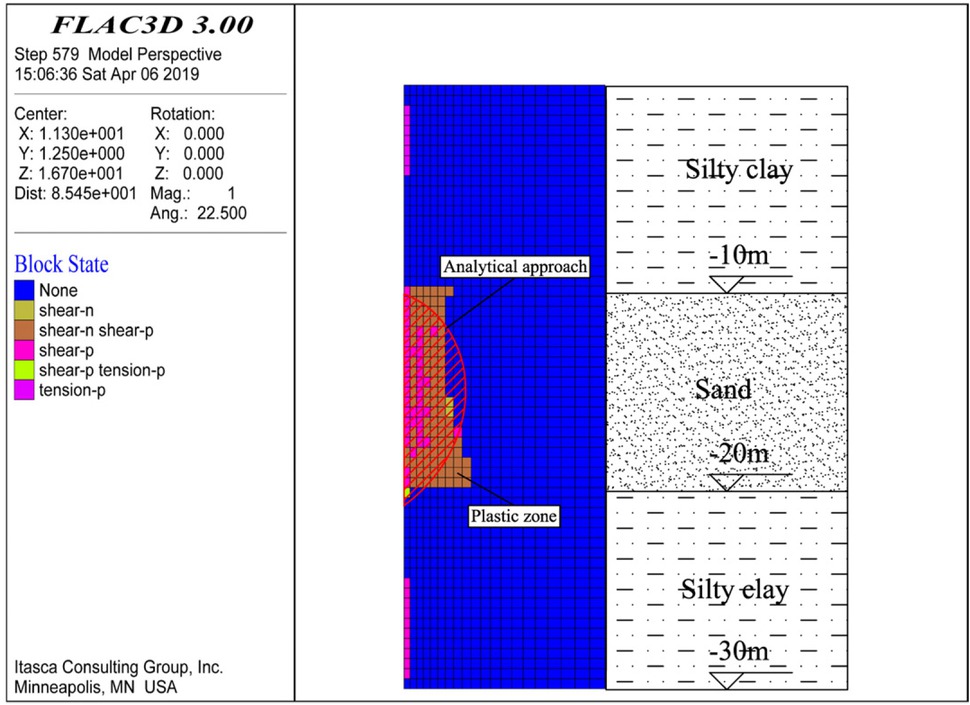
Comparison between the predicted discontinuity surface and the plastic zone of FLAC3D in the symmetric (x, z) plane.
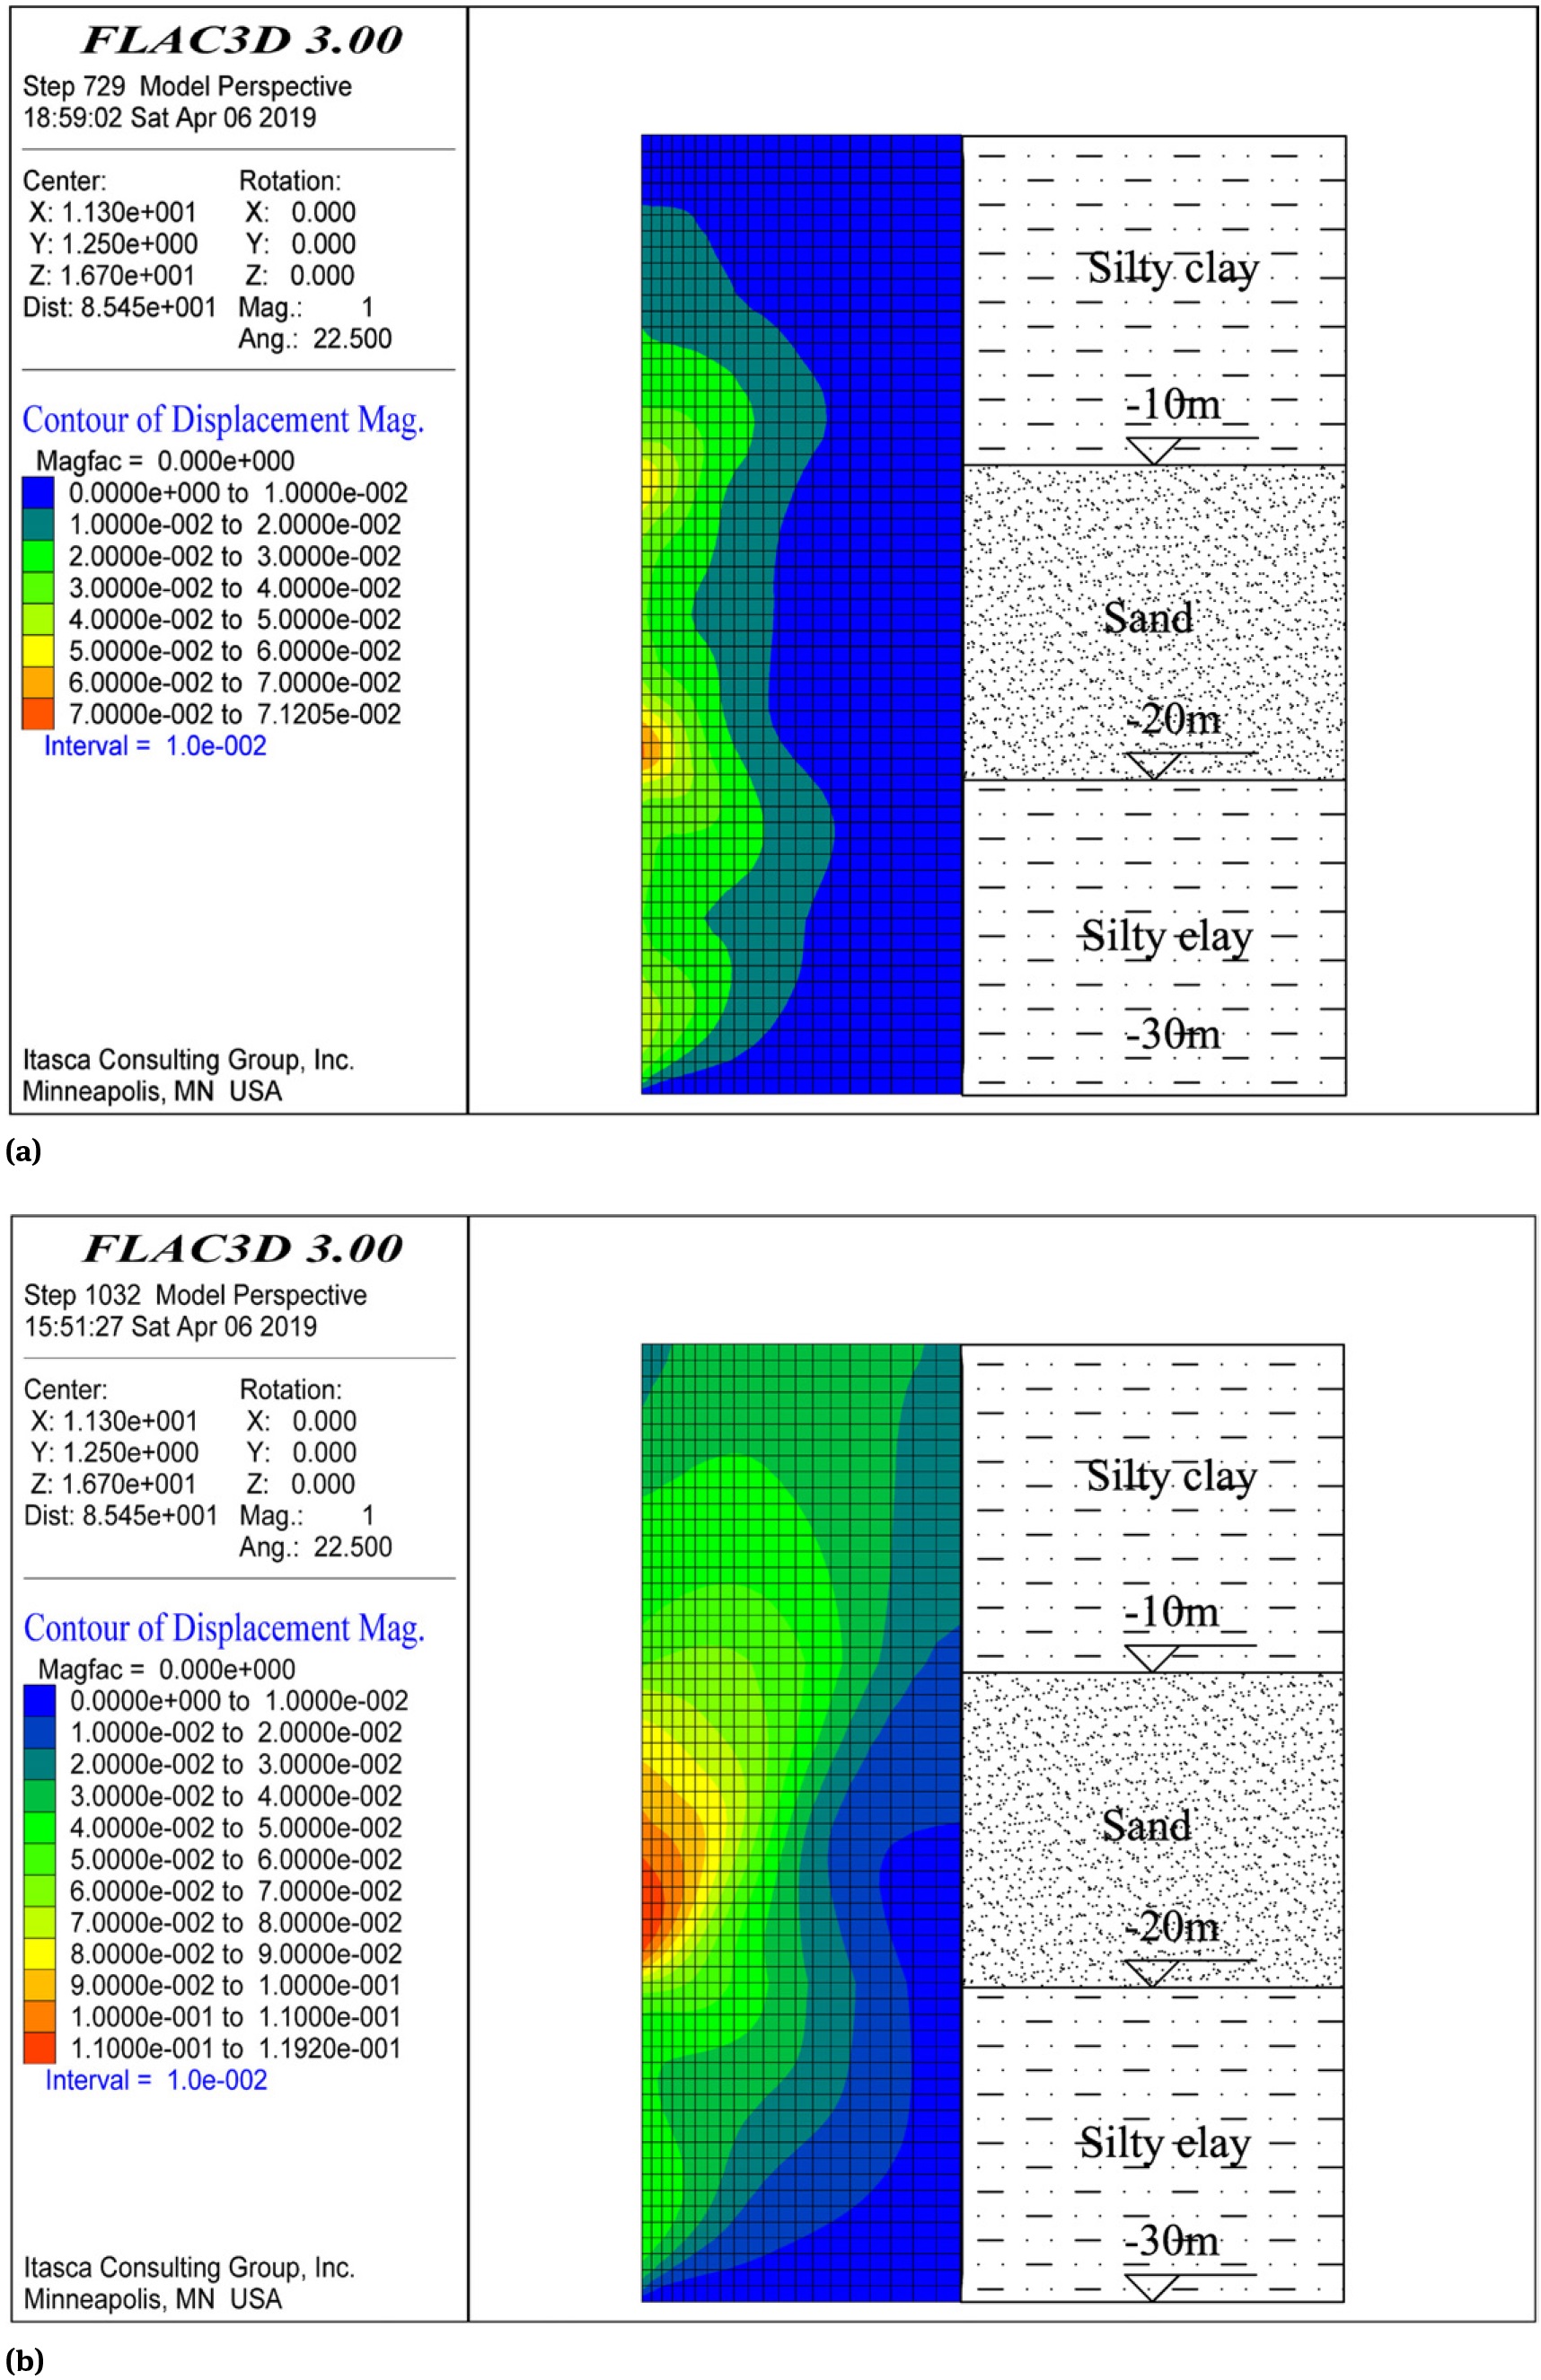
Local failure process of the weak layer in FLAC3D: (a) Initial stage; (b) Terminal stage; (c) Fall-off.
Figure 12 shows the local failure process of a slurry trench. At the initial stage, it can be seen from the Figure 12(a) that the displacement of two interfaces between sand and silty clay is larger than other zones. It shows that the local failure of a slurry trench initiates at the upper and lower boundaries of the weak layer. And then the local failure develops inside the weak layer and gradually propagates to the middle zone of the weak layer. Finally the local failure occurs when the upper and lower failure zones connect and the whole weak layer is intersected, as shown in Figure 12(b). After the local failure of a slurry trench, the failure soil inside the weak layer will be extruded by the gravity of the overlying soil. As a result, the failure soil falls off from the trench face, as shown in Figure 12(c). It is interesting to find that the situation of Figure 12(c) is similar with that shown in Figure 1.
4.2 Influences of the Geologic and Geometric Parameters on the Local Stability
In this section, the parametric studies of the safety factor F in 3D and 2D analyses of a slurry trench are presented. The influence investigations of the geometric and geologic parameters of a slurry trench on the safety factors F are conducted.
Figure 13 shows the curves of the safety factor F versus different geologic parameters. It is shown that the 3D safety factors increase with the increase of the ratio γsr /γ, cohesion c and friction angle φ, but decrease with the increase of the ratio B/h and converge to the minima of the safety factors, which are approximately 1.2 times greater than that of 2D analyses in three cases. The increase of the slurry density can directly increase the safety factor F. Moreover, it can be seen that the influences of the friction angle φ on the safety factor are obviously greater than that of the cohesion c, which suggests that the friction angle φ of the soil plays a more important part in improving the local stability of a slurry trench in cohesive-frictional soils.
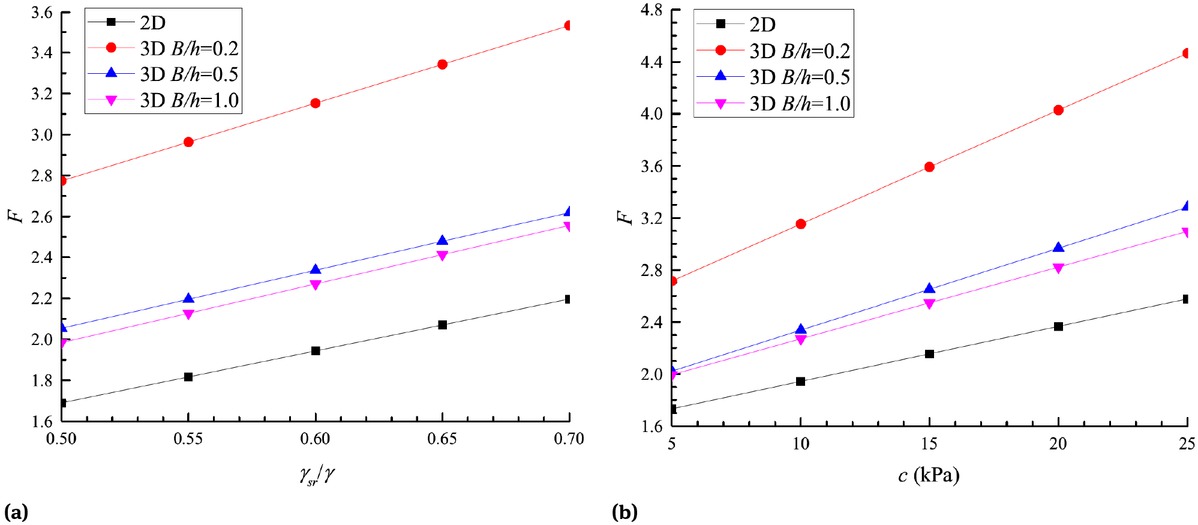
Influence of the geologic parameters on the safety factor (c = 10kPa, φ = 10, γ = 20kN/m3, γsr /γ = 0.6, h = 10m, h1 = 5m, h2 = 0m): (a) γsr /γ; (b) c; (c) φ.
Figure 14(a) presents the curves of the safety factor F versus the thickness h of the weak layer. The safety factor decreases with the increase of the thickness h of the weak layer. It is shown that the thickness h has a great impact on the safety factor F of the local stability. But with the increase of the thickness h, the decline rate of the safety factor gradually decreases. Figure 14(b) shows the curves of the safety factor F versus the ratio B/h with different thickness h. It can be seen that the safety factors is closely related with the ratio B/h. The safety factors rapidly converge to constant values with the increase of the ratio B/h, which was also mentioned by Duncan [30] and Michalowski and Drescher [28]. Thus the 3D safety factor is only suitable for the slurry trench with a limited length B in the third dimension. When the length B of the slurry trench is large, the 2D safety factor will give a more appropriate estimate on the local stability of a slurry trench.
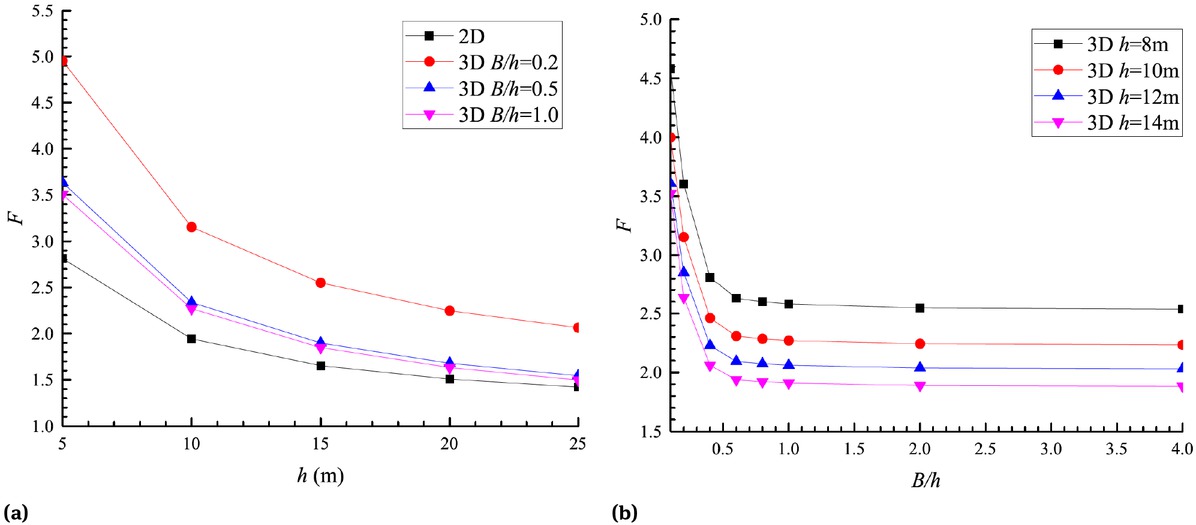
Influence of geometric parameters on the safety factor (c = 10kPa, φ = 10, γ = 20kN/m3, γsr /γ = 0.6, h1 = 5m, h2 = 0m): (a) h; (b) B/h.
5 Conclusions
The 2D and 3D rotational failure mechanisms for the local stability of the slurry trench in cohesive-frictional soils are presented in this paper. The upper solutions of the safety factors of the local stability are obtained through a theoretical derivation based on the kinematic method of the limit analysis. Moreover, a numerical simulation is performed to investigate the local stability of the slurry trench and verify the effectiveness and reasonability of the analytical solution. Finally, a parametric study is carried out to study the influences of the geometric and geologic parameters on the safety factor. The main conclusions are as follows:
The 2D local failure mechanism of the slurry trench in a weak soil sandwiched by two stiff soils is defined by a log-spiral. For the 3D local failure mechanisms of the slurry trench, the failure surfaces has a horn shape with an apex angle 2φ. The vertical symmetric plane is defined by two log-spirals, and the whole mechanism is generated by rotating a circle with increasing diameter.
A numerical method combined with the strength reduction technique is performed to study the local stability of the slurry trench. The local failure process of a slurry trench is summarized. The safety factors predicted by the numerical method and the solution of the analytical method give the same estimate on the safety of the slurry trench, and the local failure pattern obtained from analytical method corresponds with that of the numerical simulation, which verifies that the proposed analytical solution is effective and reasonable. It is suggested that the results of the analytical approach and SRM-FLAC3D should be taken into account simultaneously to study the local stability of a slurry trench
For the geologic parameters, the safety factors increase with the increase of the ratio γsr /γ, the friction angle φ and the cohesion c. The increase of the slurry density γsr can directly increase the safety factor. The influences of the friction angle φ on the safety factor are greater than that of the cohesion c, which plays a more important part in improving the local stability of a slurry trench in cohesive-frictional soils.
For the geometric parameters, the safety factors decrease with the increase of the thickness of weak layer h and the ratio of B/h. But the decline rate of safety factor will gradually decrease with the increase of the thickness h. The safety factors rapidly converge to the constant values with the increase of the ratio B/h, thus the 3D safety factor is only suitable for the slurry trench with a limited length B. When the length B of the slurry trench is large, the 2D safety factor will give a more appropriate estimate.
Acknowledgement
The authors acknowledge the financial support provided by Beijing Municipal Natural Science Foundation of China (Grant No.8172037) and the National Natural Science Foundation of China (Grant No.51978042)
References
[1] Oblozinsky P., Ugai K., Katagiri M., Saitoh K., Ishii T., Masuda T., et al A design method for slurry trench wall stability in sandy ground based on the elasto-plastic FEM. Comput. Geotech., 2001, 28(2), 145-159.10.1016/S0266-352X(00)00028-8Suche in Google Scholar
[2] Stolle D., Guo P., Limit equilibrium slope stability analysis using rigid finite elements. Can. Geotech. J., 2008, 45(5), 653–662.10.1139/T08-010Suche in Google Scholar
[3] Srivastava A., Babu G., Haldar S., Influence of spatial variability of permeability property on steady state seepage flow and slope stability analysis. Eng. Geol., 2010, 110(3), 93-101.10.1016/j.enggeo.2009.11.006Suche in Google Scholar
[4] Xu J., Debris slope stability analysis using three-dimensional finite element method based on maximum shear stress theory. Environ. Earth. Sci., 2011, 64(8), 2215–2222.10.1007/s12665-011-1049-1Suche in Google Scholar
[5] Tsai J.S., Chang J.C., Three-dimensional stability analysis for slurry-filled trench wall in cohesionless soil. Can. Geotech. J., 1996, 33(5), 798–808.10.1139/t96-105-325Suche in Google Scholar
[6] Tsai J.S., Jou L.D., Hsieh H.S., A full-scale stability experiment on a diaphragm wall trench. Can. Geotech. J., 2000, 37(2), 379-392.10.1139/t99-122Suche in Google Scholar
[7] Fox P.J., Analytical solutions for stability of slurry trench. J. Geotech. Geoenviron., 2004, 130(7), 749–758.10.1061/(ASCE)1090-0241(2004)130:7(749)Suche in Google Scholar
[8] Li Y.C., Pan Q., Cleall P.J., Chen Y.M., Ke H., Stability analysis of slurry trenches in similar layered soils. J. Geotech. Geoenviron., 2013, 139(12), 2104-2109.10.1061/(ASCE)GT.1943-5606.0000958Suche in Google Scholar
[9] Jin X.F., Liang S.T., Zhu X.J., Stability of Three-Dimensional Slurry Trenches with Inclined Ground Surface: A Theoretical Study. Adv. Mater. Sci. Eng., 2015(6), Article ID: 362160.10.1155/2015/362160Suche in Google Scholar
[10] Xiao H., Sun Y., Global and local stability analysis of slurry trenches under surcharge in soft soils. Int. J. Geotech. Eng., 2016, 10(2), 205-211.10.1080/19386362.2015.1105623Suche in Google Scholar
[11] Zhang F., Gao Y.F., Leshchinsky D., Zhu D.S., Lei G.H., Three-dimensional stability of slurry-supported trenches: End effects. Comput. Geotech., 2016, 74, 174-187.10.1016/j.compgeo.2016.01.009Suche in Google Scholar
[12] Han C.Y., Wang J.H., Xia X.H., Chen J.J., Limit analysis for local and overall stability of a slurry trench in cohesive soil. Int. J. Geomech., 2012, 15(5), 06014026.10.1061/(ASCE)GM.1943-5622.0000268Suche in Google Scholar
[13] Han C.Y., Chen J.J., Wang J.H., Xia X.H., 2D and 3D stability analysis of slurry trench in frictional/cohesive soil. J. Zhejiang. Uni-SC A., 2013, 14(2), 94-100.10.1631/jzus.A1200257Suche in Google Scholar
[14] Tsai J.S., Stability of weak sublayers in a slurry supported trench. Can. Geotech. J., 1997, 34(2), 189-196.10.1139/t96-107Suche in Google Scholar
[15] Tsai J.S., Chang C.C., Jou L.D., Lateral extrusion analysis of sandwiched weak soil in slurry trench. J. geotech. Geoenviron. Eng., 1998, 124(11), 1082-1090.10.1061/(ASCE)1090-0241(1998)124:11(1082)Suche in Google Scholar
[16] Shen C., Zhou S.H., Local Stability of Slurry Trench in Sandwiched Sand Layer with Confined Water Pressure. International Conference on Transportation Engineering, Chengdu, China. 2013, 2540-2548.10.1061/9780784413159.369Suche in Google Scholar
[17] Michalowski R.L., Limit analysis and stability charts for 3D slope failures. J. Geotech. Geoenviron. Eng., 2010, 136(4), 583-593.10.1061/(ASCE)GT.1943-5606.0000251Suche in Google Scholar
[18] Kumar J., Sahoo J.P., Upper bound solution for pullout capacity of vertical anchors in sand using finite elements and limit analysis. Int. J. Geomech., 2012, 12(3), 333-337.10.1061/(ASCE)GM.1943-5622.0000160Suche in Google Scholar
[19] Leca E., Dormieux L., Upper and lower bound solutions for the face stability of shallow circular tunnels in frictional material. Géotechnique, 1990, 40(4), 581-606.10.1680/geot.1990.40.4.581Suche in Google Scholar
[20] Soubra A.H., Kinematical approach to the face stability analysis of shallow circular tunnels. 8th International Symposium on Plasticity, Vancouver, Canada, 2002, 443-445.Suche in Google Scholar
[21] Subrin D., Wong H., Tunnel face stability in frictional material: a new 3D failure mechanism. Comptes Rendus Mecanique, 2002, 330(7), 513–519.10.1016/S1631-0721(02)01491-2Suche in Google Scholar
[22] Mollon G., Dias D., Soubra A.H., Probabilistic analysis and design of circular tunnels against face stability. Int. J. Geomech., 2009, 9(6), 237–249.10.1061/(ASCE)1532-3641(2009)9:6(237)Suche in Google Scholar
[23] Li W., Zhang C.P., Zhang X., Stability analysis of the tunnel face in the cohesive-frictional soils considering the arch effect and rotational mechanism. J. Chin. Inst. Eng., 2018, 41(8): 697-709.10.1080/02533839.2018.1534615Suche in Google Scholar
[24] Han K.H., Zhang C.P., Zhang D.L., Upper-bound solutions for the face stability of a shield tunnel in multilayered cohesive-frictional soils. Comput. Geotech., 2016, 79:1-9.10.1016/j.compgeo.2016.05.018Suche in Google Scholar
[25] Zhang C.P., Han K.H., Zhang D.L., Face stability analysis of shallow circular tunnels in cohesive-frictional soils. Tunn. Undergr. Sp. Tech., 2015, 50:345-357.10.1016/j.tust.2015.08.007Suche in Google Scholar
[26] Li W., Zhang C.P., Zhu W.J., Zhang D.L., Upper-bound solutions for the face stability of a non-circular NATM tunnel in clays with a linearly increasing undrained shear strength with depth. Comput. Geotech., 2019, 114, 103136. DOI: 10.1016/j.compgeo.2019.103136.10.1016/j.compgeo.2019.103136Suche in Google Scholar
[27] Li W., Zhang C.P., Face Stability Analysis for a Shield Tunnel in Anisotropic Sands. Int. J. Geomech., 2019, doi: 10.1061/(ASCE)GM.1943-5622.0001666.10.1061/(ASCE)GM.1943-5622.0001666Suche in Google Scholar
[28] Michalowski R.L., Drescher A., Three-dimensional stability of slopes and excavations. Géotechnique, 2009, 59(10), 839–850.10.1680/geot.8.P.136Suche in Google Scholar
[29] Anthoine A., Mixed modelling of reinforced soils within the framework of the yield design theory. Comput. Geotech., 1989, 7(1), 67–82.10.1016/0266-352X(89)90007-4Suche in Google Scholar
[30] Duncan J.M., State-of-the-art: limit equilibrium and finite element analysis of slopes. J. Geotech. Eng. Div., 1996, 122(7), 577-596.10.1061/(ASCE)0733-9410(1996)122:7(577)Suche in Google Scholar
© 2019 W. Li and C. Zhang, published by De Gruyter
This work is licensed under the Creative Commons Attribution 4.0 Public License.
Artikel in diesem Heft
- Regular Articles
- 2D Seismic Interpretation of the Meyal Area, Northern Potwar Deform Zone, Potwar Basin, Pakistan
- A new method of lithologic identification and distribution characteristics of fine - grained sediments: A case study in southwest of Ordos Basin, China
- Modified Gompertz sigmoidal model removing fine-ending of grain-size distribution
- Diagenesis and its influence on reservoir quality and oil-water relative permeability: A case study in the Yanchang Formation Chang 8 tight sandstone oil reservoir, Ordos Basin, China
- Evaluation of AHRS algorithms for Foot-Mounted Inertial-based Indoor Navigation Systems
- Identification and evaluation of land use vulnerability in a coal mining area under the coupled human-environment
- Hydrocarbon Generation Potential of Chia Gara Formation in Three Selected Wells, Northern Iraq
- Source Analysis of Silicon and Uranium in uranium-rich shale in the Xiuwu Basin, Southern China
- Lithologic heterogeneity of lacustrine shale and its geological significance for shale hydrocarbon-a case study of Zhangjiatan Shale
- Characterization of soil permeability in the former Lake Texcoco, Mexico
- Detrital zircon trace elements from the Mesozoic Jiyuan Basin, central China and its implication on tectonic transition of the Qinling Orogenic Belt
- Turkey OpenStreetMap Dataset - Spatial Analysis of Development and Growth Proxies
- Morphological Changes of the Lower Ping and Chao Phraya Rivers, North and Central Thailand: Flood and Coastal Equilibrium Analyses
- Landscape Transformations in Rapidly Developing Peri-urban Areas of Accra, Ghana: Results of 30 years
- Division of shale sequences and prediction of the favorable shale gas intervals: an example of the Lower Cambrian of Yangtze Region in Xiuwu Basin
- Fractal characteristics of nanopores in lacustrine shales of the Triassic Yanchang Formation, Ordos Basin, NW China
- Selected components of geological structures and numerical modelling of slope stability
- Spatial data quality and uncertainty publication patterns and trends by bibliometric analysis
- Application of microstructure classification for the assessment of the variability of geological-engineering and pore space properties in clay soils
- Shear failure modes and AE characteristics of sandstone and marble fractures
- Ice Age theory: a correspondence between Milutin Milanković and Vojislav Mišković
- Are Serbian tourists worried? The effect of psychological factors on tourists’ behavior based on the perceived risk
- Real-Time Map Matching: A New Algorithm Integrating Spatio-Temporal Proximity and Improved Weighted Circle
- Characteristics and hysteresis of saturated-unsaturated seepage of soil landslides in the Three Gorges Reservoir Area, China
- Petrographical and geophysical investigation of the Ecca Group between Fort Beaufort and Grahamstown, in the Eastern Cape Province, South Africa
- Ecological risk assessment of geohazards in Natural World Heritage Sites: an empirical analysis of Bogda, Tianshan
- Integrated Subsurface Temperature Modeling beneath Mt. Lawu and Mt. Muriah in The Northeast Java Basin, Indonesia
- Go social for your own safety! Review of social networks use on natural disasters – case studies from worldwide
- Forestry Aridity Index in Vojvodina, North Serbia
- Natural Disasters vs Hotel Industry Resilience: An Exploratory Study among Hotel Managers from Europe
- Using Monarch Butterfly Optimization to Solve the Emergency Vehicle Routing Problem with Relief Materials in Sudden Disasters
- Potential influence of meteorological variables on forest fire risk in Serbia during the period 2000-2017
- Controlling factors on the geochemistry of Al-Shuaiba and Al-Mejarma coastal lagoons, Red Sea, Saudi Arabia
- The Influence of Kaolinite - Illite toward mechanical properties of Claystone
- Two critical books in the history of loess investigation: ‘Charakteristik der Felsarten’ by Karl Caesar von Leonhard and ‘Principles of Geology’ by Charles Lyell
- The Mechanism and Control Technology of Strong Strata Behavior in Extra-Thick Coal Seam Mining Influenced by Overlying Coal Pillar
- Shared Aerial Drone Videos — Prospects and Problems for Volunteered Geographic Information Research
- Stable isotopes of C and H in methane fermentation of agriculture substrates at different temperature conditions
- Prediction of Compression and Swelling Index Parameters of Quaternary Sediments from Index Tests at Mersin District
- Detection of old scattered windthrow using low cost resources. The case of Storm Xynthia in the Vosges Mountains, 28 February 2010
- Remediation of Copper and Zinc from wastewater by modified clay in Asir region southwest of Saudi Arabia
- Sedimentary facies of Paleogene lacustrine dolomicrite and implications for petroleum reservoirs in the southern Qianjiang Depression, China
- Correlation between ore particle flow pattern and velocity field through multiple drawpoints under the influence of a flexible barrier
- Atmospheric refractivity estimation from AIS signal power using the quantum-behaved particle swarm optimization algorithm
- A geophysical and hydro physico-chemical study of the contaminant impact of a solid waste landfill (swl) in King Williams’ Town, Eastern Cape, South Africa
- Landscape characterization using photographs from crowdsourced platforms: content analysis of social media photographs
- A Study on Transient Electromagnetic Interpretation Method Based on the Seismic Wave Impedance Inversion Model
- Stratigraphy of Architectural Elements of a Buried Monogenetic Volcanic System
- Variable secondary porosity modeling of carbonate rocks based on μ-CT images
- Traditional versus modern settlement on torrential alluvial fans considering the danger of debris flows: a case study of the Upper Sava Valley (NW Slovenia)
- The Influence of Gangue Particle size and Gangue Feeding Rate on Safety and Service Life of the Suspended Buffer’s Spring
- Research on the Transition Section Length of the Mixed Workface Using Gangue Backfilling Method and Caving Method
- Rainfall erosivity and extreme precipitation in the Pannonian basin
- Structure of the Sediment and Crust in the Northeast North China Craton from Improved Sequential H-k Stacking Method
- Planning Activities Improvements Responding Local Interests Change through Participatory Approach
- GIS-based landslide susceptibility mapping using bivariate statistical methods in North-western Tunisia
- Uncertainty based multi-step seismic analysis for near-surface imaging
- Deformation monitoring and prediction for residential areas in the Panji mining area based on an InSAR time series analysis and the GM-SVR model
- Statistical and expert-based landslide susceptibility modeling on a national scale applied to North Macedonia
- Natural hazards and their impact on rural settlements in NE Romania – A cartographical approach
- Rock fracture initiation and propagation by mechanical and hydraulic impact
- Influence of Rapid Transit on Accessibility Pattern and Economic Linkage at Urban Agglomeration Scale in China
- Near Infrared Spectroscopic Study of Trioctahedral Chlorites and Its Remote Sensing Application
- Problems with collapsible soils: Particle types and inter-particle bonding
- Unification of data from various seismic catalogues to study seismic activity in the Carpathians Mountain arc
- Quality assessment of DEM derived from topographic maps for geomorphometric purposes
- Remote Sensing Monitoring of Soil Moisture in the Daliuta Coal Mine Based on SPOT 5/6 and Worldview-2
- Utilizing Maximum Entropy Spectral Analysis (MESA) to identify Milankovitch cycles in Lower Member of Miocene Zhujiang Formation in north slope of Baiyun Sag, Pearl River Mouth Basin, South China Sea
- Stability Analysis of a Slurry Trench in Cohesive-Frictional Soils
- Integrating Landsat 7 and 8 data to improve basalt formation classification: A case study at Buon Ma Thuot region, Central Highland, Vietnam
- Assessment of the hydrocarbon potentiality of the Late Jurassic formations of NW Iraq: A case study based on TOC and Rock-Eval pyrolysis in selected oil-wells
- Rare earth element geochemistry of sediments from the southern Okinawa Trough since 3 ka: Implications for river-sea processes and sediment source
- Effect of gas adsorption-induced pore radius and effective stress on shale gas permeability in slip flow: New Insights
- Development of the Narva-Jõesuu beach, mineral composition of beach deposits and destruction of the pier, southeastern coast of the Gulf of Finland
- Selecting fracturing interval for the exploitation of tight oil reservoirs from logs: a case study
- A comprehensive scheme for lithological mapping using Sentinel-2A and ASTER GDEM in weathered and vegetated coastal zone, Southern China
- Sedimentary model of K-Successions Sandstones in H21 Area of Huizhou Depression, Pearl River Mouth Basin, South China Sea
- A non-uniform dip slip formula to calculate the coseismic deformation: Case study of Tohoku Mw9.0 Earthquake
- Decision trees in environmental justice research — a case study on the floods of 2001 and 2010 in Hungary
- The Impacts of Climate Change on Maximum Daily Discharge in the Payab Jamash Watershed, Iran
- Mass tourism in protected areas – underestimated threat? Polish National Parks case study
- Decadal variations of total organic carbon production in the inner-shelf of the South China Sea and East China Sea
- Hydrogeothermal potentials of Rogozna mountain and possibility of their valorization
- Postglacial talus slope development imaged by the ERT method: comparison of slopes from SW Spitsbergen, Norway and Tatra Mountains, Poland
- Seismotectonics of Malatya Fault, Eastern Turkey
- Investigating of soil features and landslide risk in Western-Atakent (İstanbul) using resistivity, MASW, Microtremor and boreholes methods
- Assessment of Aquifer Vulnerability Using Integrated Geophysical Approach in Weathered Terrains of South China
- An integrated analysis of mineralogical and microstructural characteristics and petrophysical properties of carbonate rocks in the lower Indus Basin, Pakistan
- Applicability of Hydrological Models for Flash Flood Simulation in Small Catchments of Hilly Area in China
- Heterogeneity analysis of shale reservoir based on multi-stage pumping data