Rock fracture initiation and propagation by mechanical and hydraulic impact
-
Thomas Stoxreiter
 ,
Robert Wenighofer
,
Robert Wenighofer

Abstract
Rock fracture due to high-pressure fluid jetting and insert indentation was experimentally investigated. In the frame of this article, indentation designates the process of pressing a tungsten carbide insert (TCI) for roller cone bits displacement-controlled into the rock surface. Under atmospheric conditions, several crystalline and one sedimentary rock type were tested. Depending on the size, type and bonding of the mineral grains, distinct differences in fracture behaviour were observed. The influence of elevated ambient pressure regimes on the evolving cracks and fractures in the tested granite revealed that microcracking ceases with increasing ambient pressure, while the specific energy is also significantly affected. Under similar conditions, indentation experiments were performed on undamaged samples and on samples containing jetted kerfs. A distinct variation in the measured maximum force and removed volume indicated different underlying rock fracture mechanisms. By applying methods for crack visualization and three-dimensional rendering, it turned out that the dimensions of the kerf significantly affected the mechanism of fracture initiation and propagation as well as the extent of the associated fracture pattern. Furthermore, the common practice of characterizing the rock excavation process only via measurable quantities such as the specific energy, without considering the created fracture pattern, yields misleading results.
1 Introduction
1.1 Motivation
The fracture of rock due to various types of mechanical loading has been studied for decades, yielding pioneering conclusions and creating a great understanding of the underlying mechanisms. Various theoretical and experimental approaches were pursued, resulting in the generation of numerous analytical and numerical models. However, the present study was performed in the framework of the ThermoDrill project. The objective of the project was to develop a high-pressure fluid jet-assisted rotary drilling system. High-pressure jet-assisted drilling poses different boundary conditions for the mechanical rock destruction process compared to conventional rotary drilling. Therefore, the comprehensive knowledge on rock fracture related to conventional rotary drilling is not directly applicable. One major aspect of this paper concerns the state-of-the-art about rock fracture induced by mechanical indentation and hydraulic impact. Not only for drilling purposes but also related to material characterization applications. The limitations of available research results to describe the rock fracture mechanisms through high-pressure jetassisted drilling properly emphasize the requirement for additional investigations. The interaction of drill bit inserts with jetted kerfs was hardly researched and no relevant literature could be found concerning rock fracturing by high-pressure fluid jets under various ambient pressure conditions. Hence, a comprehensive experimental study was conducted to provide detailed information about the fracture network induced by high-pressure fluid jets and mechanical insert indentation at elevated ambient pressure. Furthermore, this paper aims to improve the understanding of the impact of jetted kerfs on the macroscopic fracture behaviour and the energy consumption during mechanical rock excavation. More general, the conducted experiments can be described as the mechanical indentation of a rock face in the sphere of a free surface with limited dimensions and defined orientation at elevated confining pressure. Hence, the conclusions of this paper are valid for any task, which can be described in a similar manner.
1.2 State-of-the-art and related work
Applying the common definition of fracture in the literature [1], the term fracture is related to the macroscopic separation and not the microscopic process of unbinding. However, macroscopic fracture behaviour of rock cannot be treated isolated from the formation and propagation of microcracks. Brittle failure of rock is a localization process and the failure mechanism is inextricably linked with mineralogy, pressure, and temperature conditions [2]. The sliding crack model of Brace & Bombolakis [3] became one of the most popular models to describe rock failure under overall compression, especially to describe the procedures during faulting in the earth’s crust. Valuable insights on crack growth and coalescence during macroscopic failure were generated [4, 5], including a mathematical treatment. These insights into the effects of confining pressure and the orientation of pre-existing flaws to the direction of maximum compression on the manifestation of macroscopic fracture are of particular relevance in the current article. The influence of microcrack density on the mechanical properties of rock was already validated [6]. Although the observed alteration of mechanical and physical parameters, such as stiffness and porosity, were related to thermally damaged granite, the main findings are applicable to cracks introduced by any type of loading and might be used as a damage indicator. The same approach applies for related theories in the field of material science. The necessity for an extensive understanding of the occurring processes during hardness testing led to the detailed investigation of the material response to the indentation of wedge-like tools. The amount and distribution of given flaws characterizes the material behaviour just prior to fracture [7]. However, the subsequent crack growth depends on the boundary conditions, which coincides with the fundamental conclusions in rock fracture. Based on the indenter geometry, the associated elastic stress distribution was calculated on either a Boussinesq field or a Hertzian field. However, the basic assumption of cracking perpendicular to the direction of maximum principal (tensile) stress was proved by experimental evidence for both cases to a certain extent. Further, qualitative models for brittle materials were developed. Lawn & Wilshaw [7] also showed that the material response to either spherical or sharp indenter is merging under several conditions. The observed effects of residual stresses during unloading which lead to chipping are integrated in the model and were confirmed for rock and glasses [8]. Other researchers [9, 10] for the evaluation of a circular flat-bottomed punch penetrating a rock surface took a similar approach. The calculation of the stress field for crack propagation was performed numerically. In combination with their experimental results, dilatant behaviour and increasing rock strength in the damaged zone below the indenter were supposed to be the controlling mechanisms for the type and extent of the occurring fractures. Continuously monitoring the crack formation and crack propagation during loading in different rock types revealed the significant influence of grain size and grain bonding on the fracture process [11]. Furthermore, Lindqvist et al. [11] emphasize the dominant role of the tensile stress field and the fact that rock damage by cracking and crushing beneath the indenter results in a decrease of stiffness in the load-displacement curve. The comprehensive review in [12] underlines the conclusion that most of the mechanical energy is used in the formation of the crushed zone and only a small amount is available for other types of rock fracture such as chipping. Hence, any method that increases the amount of energy available for chipping would increase the efficiency of the rock destruction process.
Relevant parameters during drilling, such as borehole pressure or effective stress, were not covered by the previously mentioned researchers, since these are commonly not present in hardness testing or rock cutting. Because of their significance in the drilling process, the effect of simulated borehole conditions was investigated largely in the past. Crucial correlations between the crater volume and the differential, hydrostatic, and overburden pressure were defined during indentation experiments [13]. Furthermore, distinction has to be made between brittle and pseudoplastic crater formation, depending on the pressure regime and loading rate. Additionally, the influence of the insert geometry on the type of failure, which is also connected to the characteristics of the force-displacement curve has to be considered [14]. Attributed to the high acting stresses in the near wellbore zone and in contrast to rock cutting, macroscopically plastic behaviour of rock during indentation was observed for several types of rock. Consequently, these observations were treated in form of analytical calculations based on the plasticity theory [15]. During their plastic limit analysis, the researchers also investigated the interaction between neighbouring craters, referred to as indexing, which is also relevant in the present paper. The drilling process can be optimized by defining ideal indexing distances, based on a minimum specific energy approach [16]. However, damage or fracturing of the rock surrounding the indentation area is not considered. This implies that their calculations are solely based on geometrical configurations and plasticity theory. Nevertheless, the critical indexing distance against a free surface was verified by experiments under various ambient conditions [17]. Besides providing crucial information on the different contributions of side and bottom chipping forces and optimum indexing distances, the experimental setup suppressed three-dimensional effects. An even more serious limitation for the application of these findings in the current analysis is that the free surface was not limited vertically but infinite in length.
However, due to the complex nature of rock fracturing, numerical models with different simulation strategies were applied with increased regularity. Numerical simulations yielded some important conclusions, especially related to the effect of confining pressure [18]. Increasing confining pressure not only shifts the point of maximum tensile stress, which is the expected location of crack initiation, away from the indentation axis, but also changes the inclination of expected crack propagation from vertical to nearly horizontal. Experiments confirmed these fundamental conclusions [19]. Although free surfaces regularly occur in drilling applications, namely the craters created by previous indentations, only few researchers addressed this topic in particular. A numerical approach, based on the discrete element method, was pursued to study the influence of lateral confining pressure and the presence of a ledge on the fracture development due to an indenting insert [20]. Certainly, neither in the experiments [19] nor in the numerical simulations [20] was the confining pressure applied on all surfaces. This procedure deems acceptable for rock cutting or hardness testing, but not for deep drilling. Differential pressure was neglected up to now by all researchers. The circumstance that free surfaces in drilling are of limited extension in the vertical direction severely restricts the application of the described results for drilling-related tasks. Recently performed studies [21] integrate the crucial effects of pore pressure and mud pressure and show the attracting impact of a joint on propagating cracks.
In contrast to indentation by mechanical tools, rock fracturing through the impact of high-pressure fluid jets has been far less researched. Early approaches in physically describing rock excavation by high-pressure water jets relate the rock erosion characteristics to the permeability of the rock [22, 23, 24, 25]. Later a different physical model with the purpose of overcoming the limitations of the two preceding theories was proposed. This model suggests that excessive mechanical stresses lead to grain crushing in an indentation process [26]. Rock erosion and cutting performance prediction models [27, 28, 29, 30] for submerged conditions are available for various ambient pressure regimes, but the authors are not aware of any study approaching the induced crack pattern in the vicinity of the created kerfs. This fact is particularly surprising, considering that fractures in the surrounding rock are expected to have a significant impact on the mechanical excavation. For instance, Geier & Hood [31] verify that kerfs created by high-pressure water jets distinctly lower the forces acting on a single polycrystalline diamond compact cutter, but no fracture analysis was performed and the kerfs were treated as idealized free surface. A similar approach was pursued in form of simplified numerical simulations of the indentation of a cutter near a kerf [32]. The rock was universally assigned with poroelastic properties, fractures or damage of the surrounding rock by the high-pressure fluid jets were not considered.
Regarding the investigation of microcracking and macroscopic fracturing, several established methods exist. Starting with the work of Brace et al. [33], many researchers used scanning electron microscopy (SEM) to monitor cracking during loading or subsequently. Nicco et al. [34] provide a comprehensive review of potential methods for characterizing rock cracks. However,SEM and most other methods have the disadvantage of being primary 2D while crack propagation is a 3D process. Computer Tomography (CT) actually constitutes the capabilities of nondestructive three-dimensional analysis. Certainly, the extremely small spatial dimensions of the cracks prohibit an automated 3D evaluation by now [35]. Thus, tedious manual evaluation; e.g., with the aid of computer aided design (CAD) programs would become necessary. This procedure still bears the risk that cracks are not detected and the results depend on the evaluating person.
2 High-pressure fluid jet experiments
2.1 Experimental set up
In the frame of the ThermoDrill project, a comprehensive experimental study was conducted to investigate the performance of high-pressure jet cutting under various ambient pressure conditions [36]. Because the geological target formations for enhanced geothermal systems are most likely crystalline rocks, the study focused on these rock types. Core samples from actual geothermal drilling operations, but also samples extracted from quarries were investigated. Besides the detailed description of the experimental setup, the rock properties and the mineralogical composition, the study shows also the significant impact of the ambient pressure regime on the jet cutting performance [36].
Under atmospheric conditions, a total of six different rock types were tested. Besides Neuhauser granite, an intrusive rock of the Bohemian Massif, all of the specimens were extracted out of core samples from geothermal well-bores. The general setup and the relevant processing steps for the tests under atmospheric conditions are shown in Figure 1. To simulate the cutting velocities encountered during drilling operations, the samples were mounted on a turning table beneath the high-pressure nozzle (Figure 1a). To allow for a proper mounting of the cylindrical core samples, the original cores were cut into 40 mm long discs, which were subsequently bedded in mortar. The diameter of the discs ranged from 50 to 120 mm, depending on the core dimensions. After the experiments, the specimens were dried and loose material in the jet cuts was removed. Subsequently the depth, width and total area of the created kerfs were measured with a highly accurate laser sensor (Figure 1c). The specimens were mounted on the turning table and slowly rotated below the sensor. After measuring the kerf dimensions, the samples were prepared for saturation with a two-component fluorescing epoxy resin (Figure 1d). For that purpose, the rock samples were carefully removed from the mortar. Following the suggestions made in [37], the samples were placed in a desiccator and a vacuum was applied. The two-component epoxy resin was mixed with fluorescing powder and poured onto the samples through an injector valve. A hardening time for the epoxy resin at rest of at least 24 hours was required. This method for rock fracture analysis was chosen because it already proved to be very efficient for similar purposes and provides a sufficient resolution for the current task. Subsequently the rock specimens were cut with a diamond saw into slices of approx. 2 to 3 mm thickness (see Figure 1e). The relevant jetting parameters were equal for all rock types and are summarized in Table 1. The cutting velocities are simply calculated via the RPM and the perimeter. Since the RPM was 60, the cutting velocity and the perimeter were equal, ranging from ca. 400 to ca. 700 mm/s.

a) Rock samples embedded in mortar, mounted on the turning table below the high-pressure nozzle; b) specimen after kerfs with the radii R1 to R4 were jetted; c) specimen mounted on the turning table below the laser sensor with the jetted kerfs in mortar being pasted over to not disturb the measurement in the rock samples; d) prepared rock sample for the saturation with the two-component fluorescing epoxy resin, the position of the central rock slice is indicated and e) 2 – 3 mm thick saturated rock slice for the fracture analysis.
Relevant parameters for the jet cutting experiments under atmospheric conditions.
| Jet Pressure, MPa | 400 |
| Nozzle diameter, mm | 0.25 |
| Stand-off distance, mm | 11.0 |
| Hydraulic power, kW | 12.7 |
| RPM | 60 |
| Radius R1, mm | 110 |
| Radius R2, mm | 95 |
| Radius R3, mm | 80 |
| Radius R4, mm | 65 |
Actual drilling operations are usually performed in a pressure environment, which is very different from atmospheric conditions. To simulate these conditions, jet cutting experiments were performed under various ambient pressure conditions [36]. For that purpose, a pressure vessel was used, in which the hydrostatic pressure was acting on all surfaces of the rock specimens. A scheme of the pressure vessel is shown in Figure 2. The rock specimen (1) diameter was 220 mm,the standard height of the sample was 90 mm but could be changed if required. The sample was placed centrically on the turning table (2). The turntable was mounted on a cylindrical roller bearing and connected to the coupling, spur gear and motor via a sealed shaft (3). A frequency inverter enabled a progressive control of the rotational speed. The stand-off distance could be changed from 2 to 15 mm by using nozzle holders (4) with different lengths and associated different distances to the rock surface. The pressure inside the vessel was controlled via a valve and was measured via manometers (5). The pressure vessel could be either filled with water or drilling mud.
![Figure 2 Sketch of the pressure vessel without drive unit and pressure control valve [36].](/document/doi/10.1515/geo-2019-0061/asset/graphic/j_geo-2019-0061_fig_002.jpg)
Sketch of the pressure vessel without drive unit and pressure control valve [36].
The term back pressure refers to the acting pressure on the layer of fluid between the nozzle orifice and the rock surface. However, without going into detail on the physical effects of back pressure on the jet propagation, the attainable cutting performance is significantly reduced when compared with the atmospheric conditions having equal jet properties. Therefore, it was interesting to investigate if the mode and extent of microcracking, respectively the macroscopic fracturing, changes with the hydrostatic pressure level. It is important to note that the rock specimens were built in the chamber dry and according to permeability measurements, the rock was classified as impermeable. Hence, the pores are not assumed to be interconnected and the general stress state in the rock after pressurization of the chamber is hydrostatic and equal to the chamber pressure in magnitude. Especially for the short duration of the experiments. After pressurization, the high-pressure fluid jet was applied to the rock surface and subsequently the jet pressure and chamber pressure were directly released. So, the duration of one experiment from pressurization of the chamber to the release of all pressures was generally less than 1 minute. For a satisfying interaction between the jetted kerf and the indenting insert, a certain depth of the kerf is required. Due to the diminishing cutting performance, the hydraulic power of the jet was significantly increased. Nozzle orifice diameters of 1.5 mm and jet pressures of 250 MPa resulted in a maximum applied hydraulic power of around 200 kW.
3 Results
A compilation of the results of the crack evaluation is shown in Figure 3 for four different types of rock, namely Neuhauser granite (NH), Monzo granite (MG), Basel granite (BG), and Buntsandstone (BST). The photo series always shows the same kerf along its cutting track, with reference to Figure 1, the according radii can be found in Table 2. The associated jetting parameters are presented in Table 1. Both sides of the rock slices were investigated, the rear was mirrored to maintain the view on the kerfs and the fracture network. The distance between each image is ca. 2.5 mm, resulting in total displayed length of approximately 12.5 mm. This distance was chosen because all relevant features are captured within this length. The observed cracks and their distribution were clearly detectable under UV light, but not under ambient light with the naked eye. Therefore, the extension and dimension of the crack pattern could be defined properly under UV-light, as well the fundamental mode of cracking.
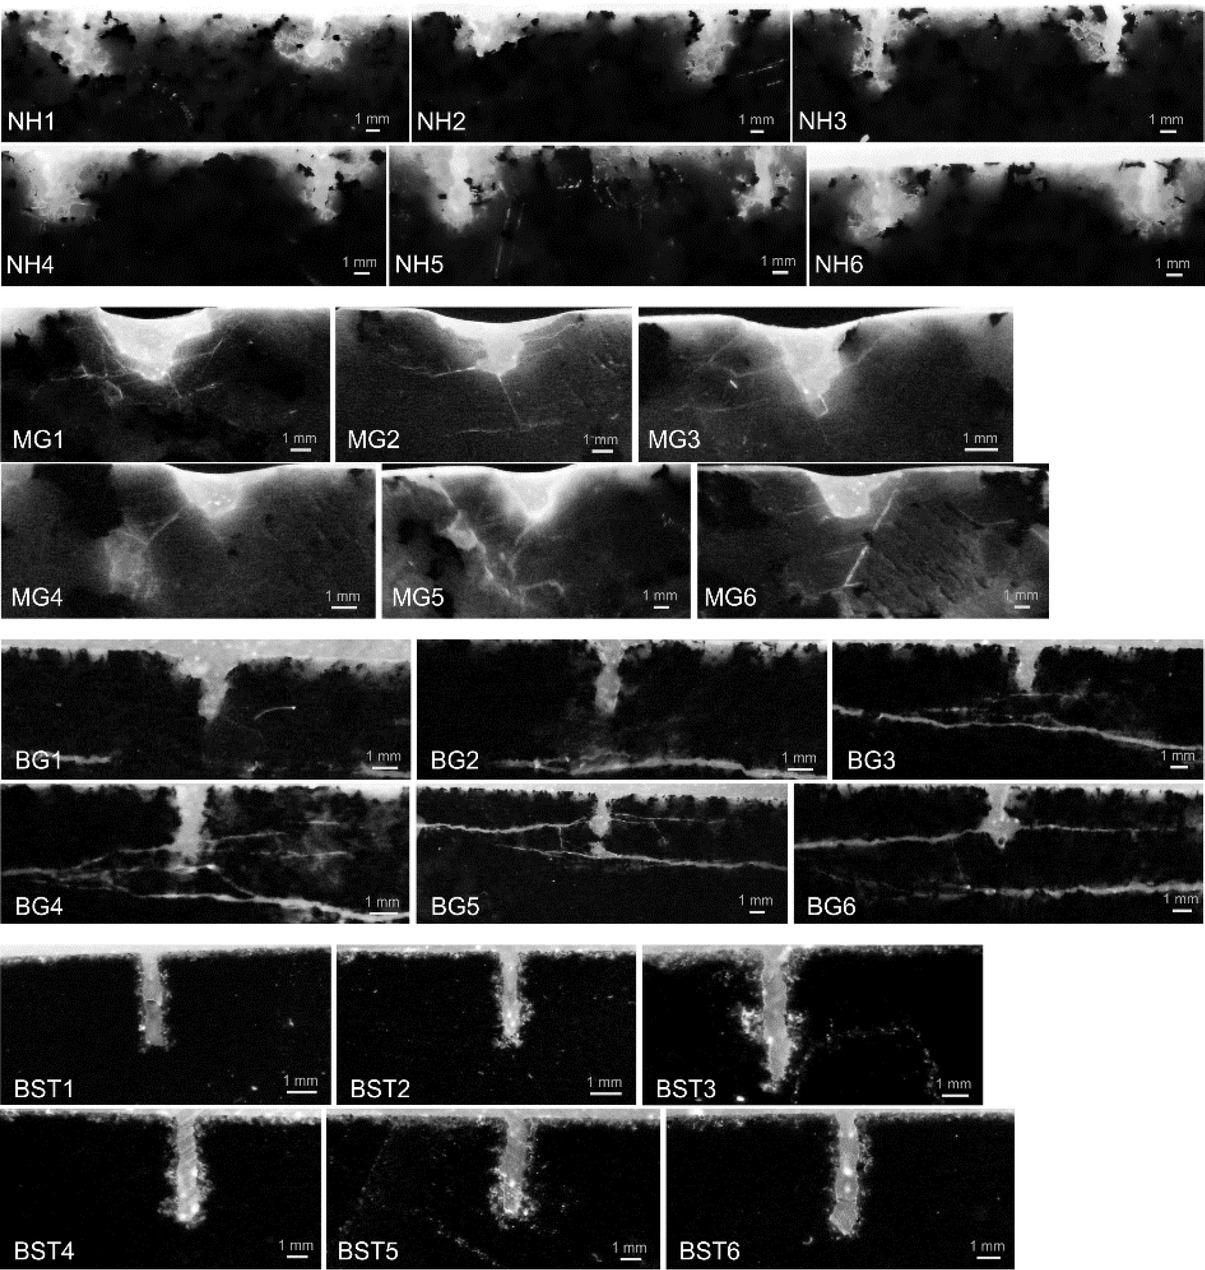
Results of crack evaluation for jet cutting experiments under atmospheric conditions. Each picture shows the same kerf(s), but at successive positions along their cutting track. For instance, for Neuhauser granite this means that the position of NH1 is 0.0, of NH2 is 2.5, of NH3 is 5.0, of NH4 is 7.5, of NH5 is 10.0 and the position of NH6 at 12.5 mm. The associated radii for the kerfs are shown in Table 2.
Associated radii for the kerfs illustrated in Figure 3.
| Rock type | NH-left | NH-right | MG | BG | BST |
|---|---|---|---|---|---|
| Radius, mm | 65 | 80 | 80 | 65 | 80 |
The shape of the kerfs created in Neuhauser granite depends on the minerals encountered during jetting. While phyllosilicates such as biotite were simply cut direct through the grains without any transgranular cracks, it appears that harder minerals such as quartz, but also feldspar, cracked in the transgranular as well as in intergranular mode. As shown in Figure 3, the kerfs were often shrouded by a symmetric zone of microcracks in a fairly radial extension of up to 2 mm, which resembles the damaged zone beneath an indenter. This condition could be an indication for tensile stress induced cracks, similar to the crack initiation theory in granite with an indenting wedge [11]. There were also asymmetric microcrack patterns on only one side of the kerf (NH3) or in vertical direction beneath the bottom (NH3 and NH2). These effects are attributed to the narrow variation of mineral grains affected by the high-pressure jet. As opposed to the situation in Neuhauser granite with a maximum grain size of approx. 2 mm and a relatively homogenous distribution of the minerals, Monzo granite originating from a geothermal wellbore in Soultz-sous-Forêts and contains feldspar grains several tens of millimetres in size. The kerf, illustrated in MG1 to MG6, is located in such a grain and transgranular cracking along two structural planes of relative weakness (parting surfaces) was identified as the dominant cracking mechanism. The two structural planes of relative weakness are nearly orthogonal and mostly linear (see Figure 4a). The results are comparable to experiments with far field compression [2].However, pre-existing microcracks and fractures in Monzo granite and their interaction with newly created cracks give rise to quite complex patterns of inter- and transgranular cracks, as shown in Figure 4a. The results for Falkenberg granite are not shown because they are in qualitative agreement with the results of Monzo granite, with both having a similar mineralogical structure.
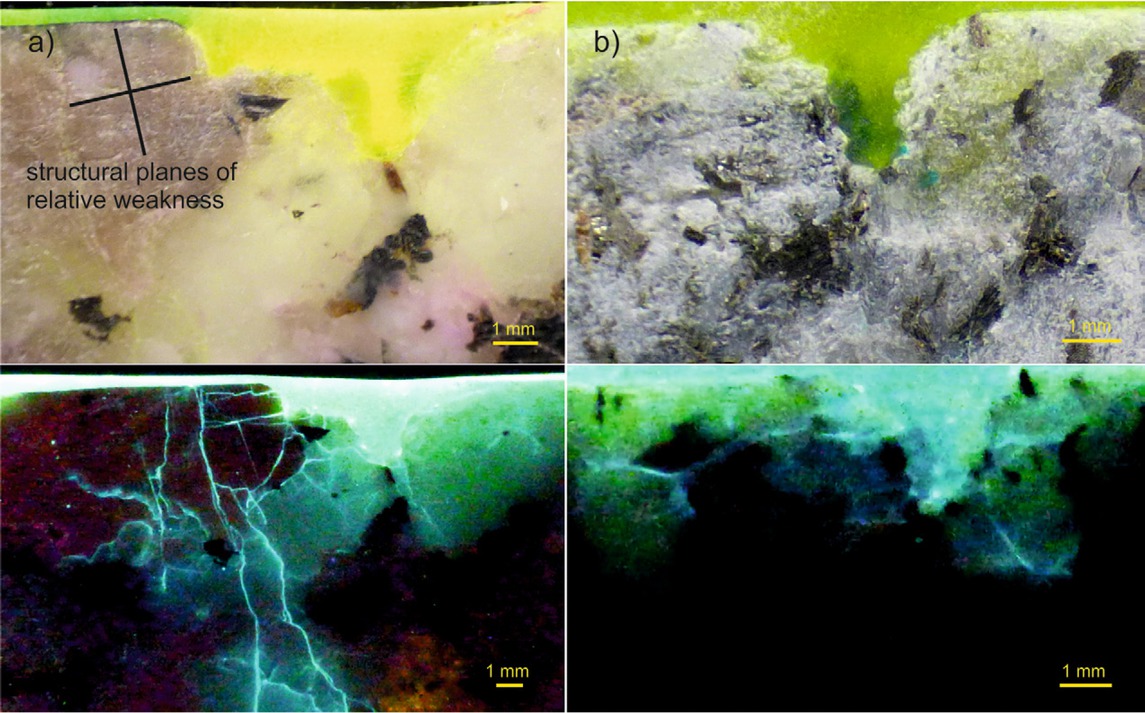
The different types of crack propagation, depending on the mineralogical composition, are shown. On the one hand, the crack pattern in Monzo granite with dominant transgranular cracks along the two structural planes of relative weakness (parting surfaces) (a). On the other hand a jetted kerf in Basel granite, outside the fine-grained xenolith lens with no preferential type or direction of microcracking (b).
For Basel granite, having a fine-to-medium grained composition, barely any cracks emerged around the jetted kerf as shown in Figure 3 from BG1 to BG6. The reason for this behaviour was attributed to a high bonding strength of the very small grains and a low porosity. If larger feldspar grains were raked by the high-pressure jet, identical fractures as in the Monzo granite were observed. A salient feature is the shallow dipping, pre-existing fracture, which is steadily approaching the cutting depth of the jet cuts. The interaction between the jetted kerf and this fracture occurs at a distance of roughly 1 to 2 mm(BG4) in the form of short fractures. Besides an enlarged cross-sectional area at the location of interaction, no additional damage developed. So, for this particular rock type, a neighbouring fracture has nearly no effect. It should be mentioned that the unconfined compressive strength (UCS) of Basel granite is only approximately 80% of the UCS of Neuhauser granite. All kerfs illustrated in BG1 to BG6 were located in a fine-grained xenolith lens, whereas Figure 4b shows a jetted kerf outside this lens. The observed crack pattern resembles those in Neuhauser granite, although less microcracks were observed
Although being by far the weakest rock type tested in terms of strength properties, the shape of the kerfs in Buntsandstone is uniform and straight. The damaged zone has a very limited extent, actually less than 1 mm. The areas filled with the fluorescing epoxy resin, visible in the BST1 to BST6 images, appear to be interconnected pores and loosened grains, possibly created by the extensive pressure of water penetrating the pores. Relevant information can also be extracted from the graphs shown in Figure 5. These graphs show the measured cutting depth and removed volume per unit length associated with the kerfs illustrated in Figure 3. Therefore, the related jetting parameters were those, which are presented in Table 1. The cutting depth in Buntsandstone is nearly double that for the crystalline rocks (see Figure 5a). All of the experiments were conducted with the same hydraulic power of the jet and identical cutting velocities. Therefore, the energy input was the same for all tests.
![Figure 5 Jet cutting performance under atmospheric conditions represented as a) cutting depth and b) removed volume per unit length [36].](/document/doi/10.1515/geo-2019-0061/asset/graphic/j_geo-2019-0061_fig_005.jpg)
Jet cutting performance under atmospheric conditions represented as a) cutting depth and b) removed volume per unit length [36].
In total, more than 100 kerfs were jetted under elevated pressure conditions, where the results illustrated in Figure 6 contain a representative selection for all those experiments. For the most part, Neuhauser granite was used because it represents a typical rock type for geothermal drilling, but is also relatively homogenous and sufficiently available. Hence, the subsequent evaluation only concerns Neuhauser granite. The distance between the positions of the images along the cutting track of the kerf is ca. 2.5 mm, similar to Figure 3. The relevant jetting parameters and back pressure levels for each particular kerf in Figure 6 are summarized in Table 3. However, the conclusions from these experiments are only directly applicable for similar rock types. If a rock type with distinctly different structure and properties is considered, the conclusion might not be perfectly valid.
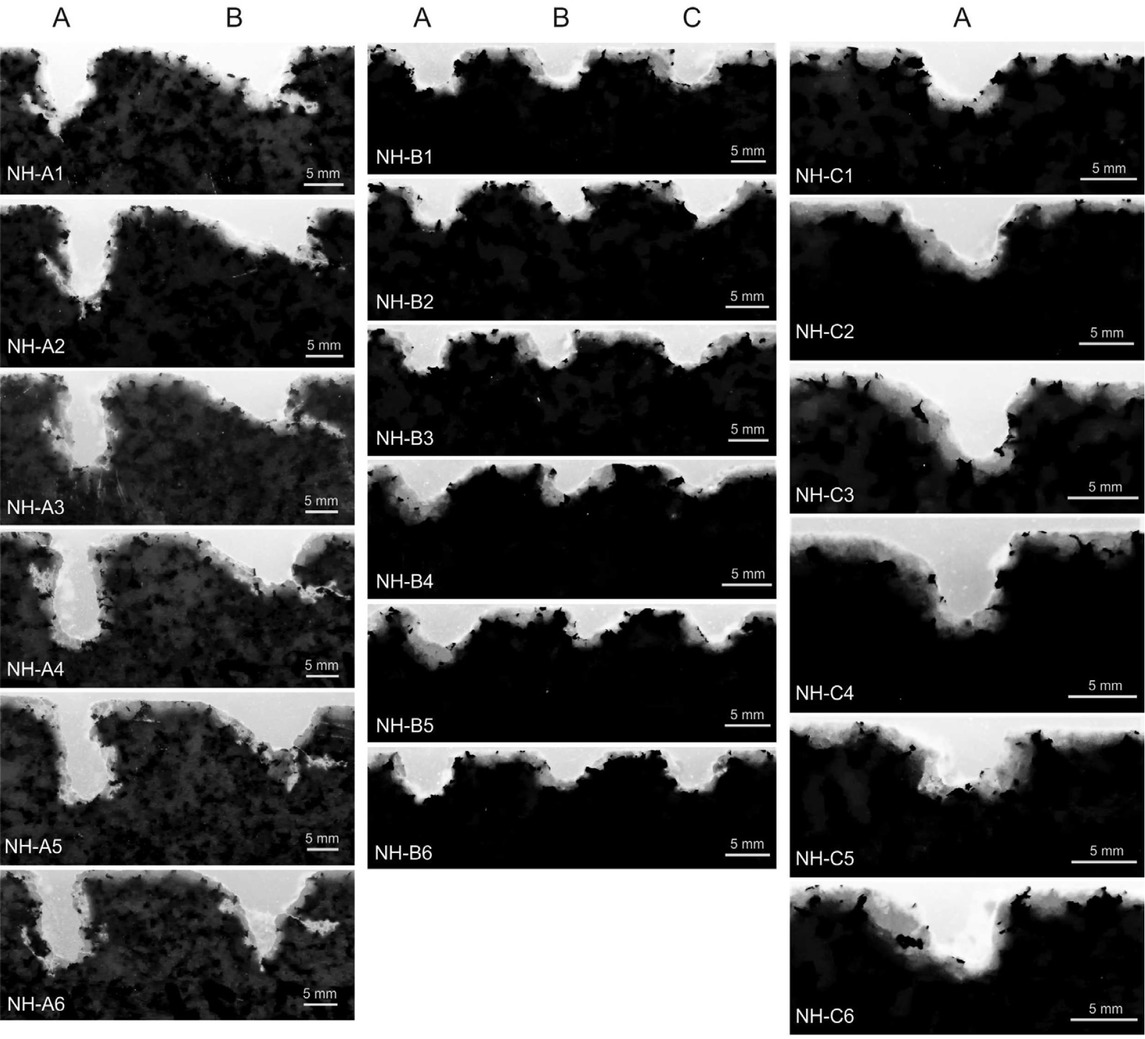
Crack evaluation results for jet cutting experiments under simulated wellbore conditions. Each picture shows the same kerfs, but at successive positions along their cutting track. The associated radii for the kerfs and the important jet parameters are shown in Table 3.
Relevant high-pressure jet parameters related to the experiments shown in Figure 6
| Kerf label | NH-A A | NH-A B | NH-B A | NH-B B | NH-B C | NH-C A | ||
|---|---|---|---|---|---|---|---|---|
| Nozzle type | Type 1 | Type 2 | ||||||
| Hydraulic power, kW | 180 | 85 | 180 | |||||
| Back pressure, MPa | 0 | 11 | 17.5 | 27.5 | ||||
| Cutting velocity, mm/s | 408 | 503 | 410 | 503 | 597 | 503 | ||
| Radius, mm | 65 | 80 | 65 | 80 | 95 | 80 |
The influence of increasing chamber pressure on the microcrack pattern is described subsequently and is clearly shown in Figure 6. Certainly, the outcome of the experiments with zero chamber pressure, pictured in NH-A1 to NH-A6, are quite different compared with the NH1 to NH6 results, illustrated in Figure 3. Increasing the hydraulic jet power from 7 kW to 180 kW for that particular case changed the mode of cracking significantly. Both experiments were conducted with nozzle type 2. A small nozzle orifice diameter of 0.25 mm in combination with 400 MPa jet pressure creates rather uniform and straight craters with distinct microcracking (see Figure 3). An orifice diameter of 1.5 mm combined with 250 MPa jet pressure results in massive surface chipping and only few microcracks (see Figure 6). The kerfs for zero chamber pressure and nozzle type 2 are characterized by massive chipping, where these subvertical cracks apparently propagated to the surface. This conclusion is supported by images where the chip did not form, but a prominent crack toward the free surface was clearly visible. Surprisingly, the current results have a close resemblance to the findings of a study [38] where projectiles were shot at the rock surface. Although the authors do not follow the conclusion of crack propagation along the trajectories of maximum shear, the concept of an incremental deepening of the actual curve, accompanied by gradual fracturing of the surrounding rock, appears reasonable for the present study. The left kerf in the NH-A photo spread was created by a nozzle type 1, which has a different internal shape and a more focused jet than nozzle type 2. The cutting velocity was only approximately 70% of that for the right cut. Hence, the energy input was larger and more focused, leading to a faster deepening with fewer cracks connected to surface. Furthermore, experiments with two different types of drilling mud were conducted, where no significant difference in the qualitative and quantitative results was observed. These conclusions are represented by the results shown in Figure 7 as well. Here, the specific energy is monotonically increasing as a function of the chamber pressure. This statement is valid for both nozzle types and for water and mud as well. For sufficiently small stand-off distances, the contribution of altering jet properties with increasing chamber pressure on the microcrack development is not expected to be significant. Hence, ceasing of the cracking process around the actual kerf is directly dependent to the stress state in the rock. The important implication for the indentation experiments described in section 4 is that the kerfs can simply be treated as additional free surface with known dimensions. Microcracks or fractures created during the jetting process are not likely to occur, because all of the specimens were prepared under a 30 MPa chamber pressure.
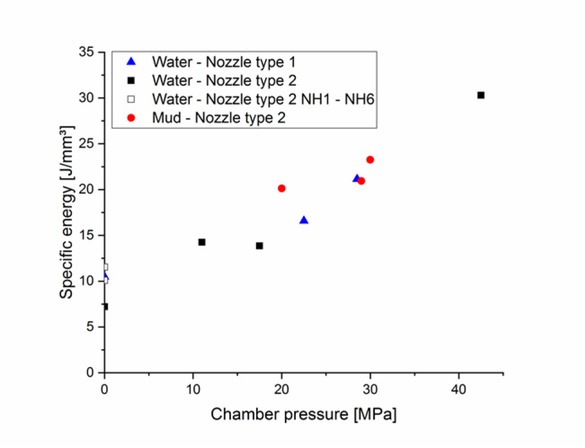
Specific energy required for jet cutting under different back pressure levels.
4 Indentation experiments
4.1 Experimental setup
The experiments conducted in this study were confined to tasks that were not, or only insufficiently, treated until now. Consistent with the previous investigations, the indentation experiments were performed on Neuhauser granite specimens. The specimens had a diameter of 220 mm and a height of 90 mm. The specimens were prepared by creating the jet kerfs under a 30 MPa chamber pressure. Subsequently, the kerf geometry was measured with the help of a laser sensor. For the indentation testing, the samples were mounted in a steel ring and the annular space was filled with mortar. After the mortar hardened, the sample surface was sprayed uniformly with a grey coating to allow for a better visualization of the indentation craters, before being mounted in the testing device.
Because the novel high-pressure jet-assisted drill bit prototypes were based on roller cone design, a bullet-shaped tungsten carbide insert with an approx. 4.5 mmtip radius was used. Before the actual test procedure began, the insert had to be placed as accurate as possible on the sample surface at the desired radial position. The insert was supposed to be placed 12 mm, 6 mm and 3 mm apart from the edge of the jetted kerf, but also directly at the axis of the kerf. Due to a slight eccentricity of the samples and the erratic shape of the jetted kerfs, direct positioning by way of coordinates was too inaccurate. Hence, a piece of clay was placed at the expected indentation coordinates and the insert was carefully lowered in the clay without indenting the rock. By measuring the deviation from the desired position, the coordinates could be corrected and the actual experiment commenced after removing the clay.
By subsequent evaluation of the position accuracy, a deviation of 1 to 2 mm was still observable. However, even the subsequent measurement of the position was deficient, because the true centre of indentation was not always clearly identifiable. Consequently, the effects of this misalignment were most serious for the experiments directly at the kerf axis and 3 mm from the edge of the kerf. After completing the positioning, the pressure chamber was closed and filled with mineral oil. Subsequently, the oil in the chamber was pressurized to 30 MPa, generating a hydrostatic stress state in the rock specimen. The indentation of the insert ensued usually displacement controlled with a rate of 2.54 mm/s to fixed penetrations depths of 0.762 to 4.572 mm, with 0.762 mm intermediate stages.
Each penetration depth at each radial position was tested at least twice, but normally three times. After each experiment, the pressure was released and the loose rock chips and grains were removed before the next test began. When the testing campaigns on the samples were completed, the removed volume was measured with a photogrammetric procedure. For that purpose, the jetted kerfs were filled with purple-coloured clay to not be included in the volume measurement. These samples are shown in Figure 8 after the measurement. Indeed, for the experiments with 3 mm distance of the insert to the edge of the kerf, the distinction between material already removed during jetting and the removed volume by the insert was to a degree not possible. For the experiments directly at the axis of the kerf, no removed volume measurement was accomplished for obvious reasons. In this case, only the force-displacement curves were investigated. Additionally, baseline experiments on undamaged specimens were conducted. Due to technical reasons, no measurement of the removed volume on these specimens were possible, but the force-displacement curves are available.
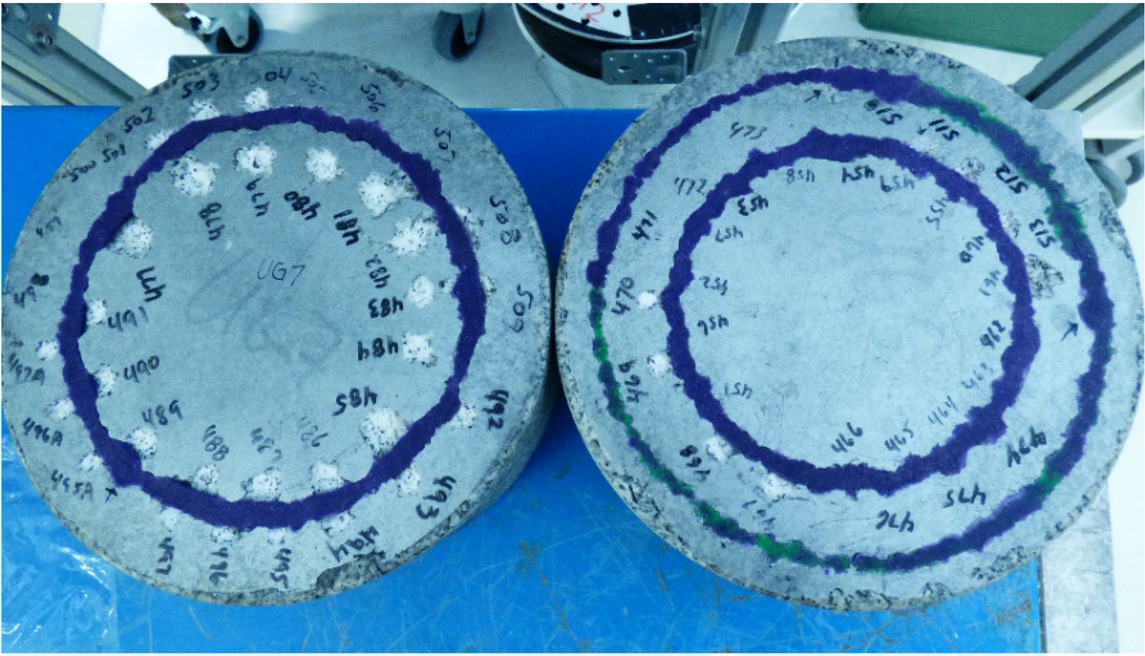
Rock specimens after indentation, with the jetted kerfs filled with purple-coloured clay.
After measuring the removed volume, the purple-coloured clay was removed and the specimens were prepared for saturation with the fluorescent two-component epoxy resin. The procedure was again similar to that described before. Requiring a setting time of approximately 24 hours after saturation, the samples were subsequently cut by a diamond saw parallel to the rock surface to reduce the height by roughly 50 mm, which allowed for ease of handling during the crack evaluation. The specimens were cut into the slices perpendicular to the surface, where the general objective was to arrange the cuts at optimum positions to maximize the results in the later evaluations. Clearly, the information contained at positions directly at the cut was lost, but interpolation between the images properly compensates for these losses. Two of the prepared rock specimens for cutting with the diamond saw are shown in Figure 9. Subsequently, the slices were investigated with the help of UV light to visualize the fracture pattern. After the evaluation, random samples were subject to dye penetration testing to verify if any cracks were left unfilled with the fluorescent epoxy resin. For both pre-jetted samples, no unfilled cracks were observed in the spot tests. However, in a few specimens, cracks not filled with the epoxy resin but seemingly with finely crushed powder were observed. These cracks were integrated in the analysis manually. By contrast, at the rock specimen of the baseline indentation experiments, scarcely any crack was filled with the epoxy resin. The cratered surface was again coated before the saturation with the epoxy resin. Certainly, the coating penetrated the created cracks and pores and blocked them for later saturation with the epoxy resin. For that reason, all of the rock slices of the baseline experiments were treated with the dye penetration testing; thus, enabling identification of the major characteristics.
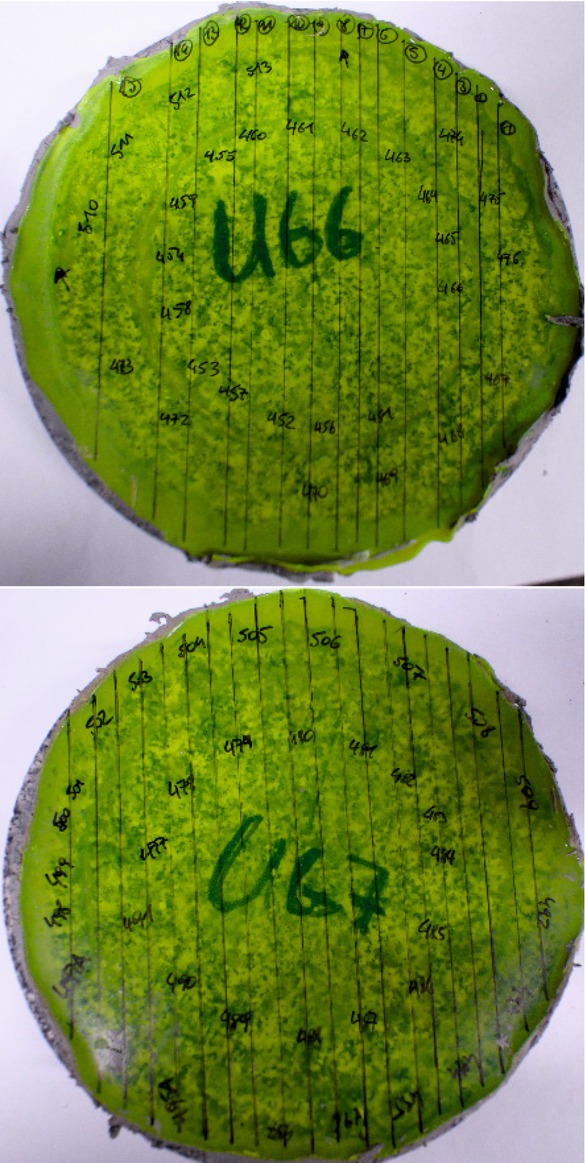
Saturated rock specimens with guidelines for cutting.
The measurement of the removed volume was done photogrammetric. Improving computer hardware performance has been in parallel with the development of an increasingly automated processing of the imagery, leading to structure from motion (SfM) [39, 40]. SfM has yielded a significant expansion of photogrammetric usage into other disciplines such as rock mechanical testing because its application is facilitated remarkably by well-documented commercial software. The resources involved in the current paper were mainly an SLR-camera (Nikon DS5300) mounted on a linear guide driven by a motor and the SfM-software PhotoScan Professional. The SLR-camera provides 24 megapixel on a 23.5 x 15.6mm CMOS sensor which in conjunction with a 55 mm-lens of focal length furnishes a resolution of 0.04 mm/pixel (Nikon Corporation 2019) on the surface of the tested samples. The surface was captured from a distance of 0.5 m with a high overlap. The overlap of the images amounts to approximately 90%. The linear guide, which provided highly precise camera positions for the images captured, moved the slide with the mounted camera and a rotary encoder was used to introduce a highly accurate metric scale into the photogrammetric processing of the images.
As SfM largely employs consumer cameras, it is best practice that the essentials of the lens system such as focal length, projection centre, and distortion parameters be optimized in the bundle adjustment as made in the present contribution. In this processing step, the images were connected using corresponding features. A 3D model of the rock samples was generated and an improved estimation of the intrinsics was computed [40]. The densification of the point cloud constituted the final step of the processing tool chain provided by photoscanning and led to the resolution already stated previously. The volumes of the craters in the tested samples were derived from the dense 3D reconstruction whose z-axis was oriented such that it was perpendicular to the sample surface. The function 2.5D Volume of CloudCompare software was utilized, which is a 3D point cloud editing and processing software. As a general feature, prior to determining the volumes using this function, sample surfaces before and after indentation need to be deconstructed into parallelepipeds whose axis were perpendicular to the planar sample surface. The 2.5D Volume applies the subsequent equation (1) which sums up all of the parallelepipeds dVi constituting the volume of a single crater Vol (GPL software, 2019).
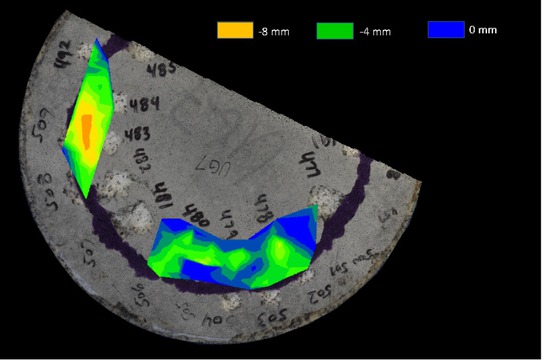
Whereas the craters in the sample surface were obtained from photogrammetric processing, the surface before indentation was defined by polygons that delineate the intended surface from undamaged polished sample areas as a boundary. The z-value of the undamaged planar surface was assigned to the vertices of every single polygon,n which is the base of the interpolation to gain the heighti of the parallelepipeds in equation (1). One of the samples, shown in Figure 10, highlights the depths of three craters. The depths correspond to the heighti of the parallelepipeds dVi in equation (1), according to the colour scheme. The grid step in the formula was chosen to be 0.25 mm in the x- and y-direction of the coordinate system, approximating every single crater adequately by far more than 1000 dVi. The colour scheme used in Figure 10 was chosen to coincide with the later results section.
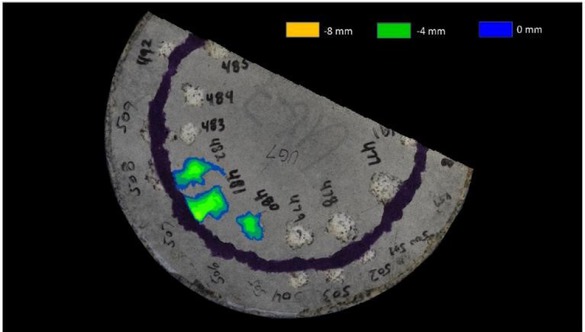
3D reconstruction of a sample showing the colour-coded depths induced by indentation.
5 Results
Referring to [16, 17], the specific energy was plotted vs. the normalized distance l/w as shown in Figure 11. The diameter of the insert w at the particular maximum indentation depth d was determined by the geometry of the in sert. Whereas l is solely the distance of the axis of the indenting insert with respect to the edge of the kerf. The mechanical work done during indentation was obtained by calculating the area beneath the force-displacement curve for each experiment; using Simpson’s rule for integration. Based on a high sampling rate of 2000 Hz, the accuracy of the calculations was considered sufficient for this purpose. The specific energy was then calculated by dividing the mechanical work done by the removed volume, measured with the described photogrammetric procedure. Because no removed volume measurement for the baseline experiments was available, it had to be estimated from the indentation tests of the pre-jetted specimens. For that purpose, test runs with no visual interaction with the kerf were treated as baseline experiments. A normalized distance of 2.5 l/w was assumed to be appropriate for the integration into Figure 11, while the true distance would be infinite. The surprisingly good conformity of the baseline experiments demonstrates the applicability of the proposed procedure very well.
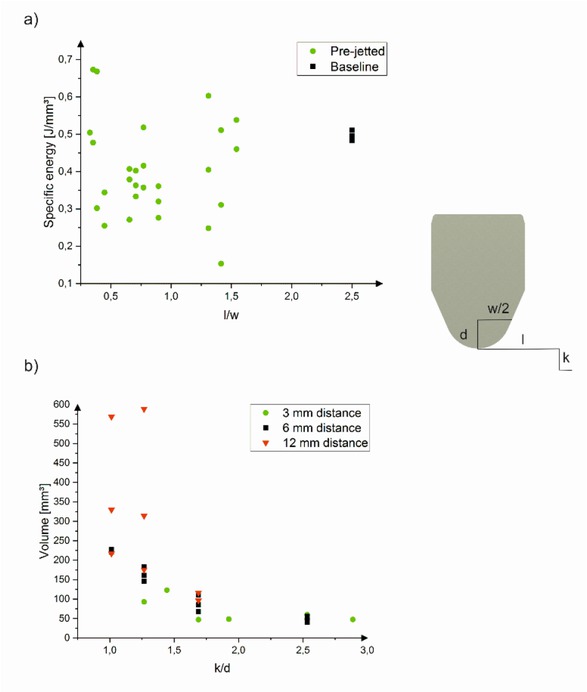
a) Specific energy dependent on the normalized distance l/w and b) Removed volume dependent on the normalized kerf depth k/d.
The relevant experimental data are provided in Table 4,where attention should focus on the fact that the specific energy for jetting is around 50 times larger than that for indentation. However, the extensive scattering of the results prevents the analysis from reliably identifying trends as was reported in [16]. Because of the bullet-shaped insert in the current study, a direct comparison is not possible anyway. The number of data points below the specific energy for the baseline experiments are larger than the data points above the baseline specific energy, indicating the beneficial impact of the kerf on the mechanical indentation. On closer inspection of Figure 11, it becomes apparent that the scattering for values of l/w in the region of 0.6 to 0.9 is significantly less than for the residual values. Considering that these experiments were performed with a 6 mm distance to the edge of the kerf, the obvious explanation is that nearly all tests resulted in interfering craters with the kerf (see Figure 8).Hence, the removed volume and the work done by the insert were rather constant. The scattering of the results with low l/w values is most likely associated with the difficulty to distinguish between removed volume from jetting and indention, in combination with the inevitable misalignment of the insert. The distribution at high l/w values is unambiguously related to the developing fracture pattern during indentation, as shown subsequently.
Summary of the relevant indentation experiment results.
| Experiment | Distance | Indentation | Diameter | Work | Removed | Specific |
|---|---|---|---|---|---|---|
| l | depth d | w | of insert | volume | energy | |
| mm | mm | mm | J | mm3 | J/mm3 | |
| 496 | 3 | 1.524 | 6.7 | 15.24 | 59.79 | 0.25 |
| 497 | 3 | 1.524 | 6.7 | 16.64 | 48.43 | 0.34 |
| 495A | 6 | 1.524 | 6.7 | 14.59 | 40.44 | 0.36 |
| 496A | 6 | 1.524 | 6.7 | 15.31 | 55.47 | 0.28 |
| 497A | 6 | 1.524 | 6.7 | 15.65 | 48.92 | 0.32 |
| 469 | 3 | 2.286 | 7.78 | 32.79 | 108.61 | 0.30 |
| 502 | 3 | 2.286 | 7.78 | 31.46 | 47.09 | 0.67 |
| 492 | 6 | 2.286 | 7.78 | 35.07 | 67.66 | 0.52 |
| 493 | 6 | 2.286 | 7.78 | 39.31 | 110.04 | 0.36 |
| 494 | 6 | 2.286 | 7.78 | 35.44 | 85.24 | 0.42 |
| 483 | 12 | 2.286 | 7.78 | 51.85 | 96.34 | 0.54 |
| 484 | 12 | 2.286 | 7.78 | 53.34 | 115.96 | 0.46 |
| Baseline | 25 | 2.286 | 7.78 | 52.59 | 106.15 | 0.50 |
| 468 | 3 | 3.048 | 8.48 | 58.67 | 122.93 | 0.48 |
| 503 | 3 | 3.048 | 8.48 | 62.61 | 93.02 | 0.67 |
| 489 | 6 | 3.048 | 8.48 | 61.04 | 183.10 | 0.33 |
| 490 | 6 | 3.048 | 8.48 | 58.36 | 160.80 | 0.36 |
| 491 | 6 | 3.048 | 8.48 | 58.64 | 145.70 | 0.40 |
| 480 | 12 | 3.048 | 8.48 | 89.64 | 175.50 | 0.51 |
| 481 | 12 | 3.048 | 8.48 | 90.21 | 588.80 | 0.15 |
| 482 | 12 | 3.048 | 8.48 | 97.52 | 313.90 | 0.31 |
| Baseline | 25 | 3.048 | 8.48 | 89.64 | 175.50 | 0.51 |
| 486 | 6 | 3.81 | 9.16 | 91.14 | 224.12 | 0.41 |
| 487 | 6 | 3.81 | 9.16 | 86.28 | 227.81 | 0.38 |
| 488 | 6 | 3.81 | 9.16 | 59.78 | 220.51 | 0.27 |
| MW | 6 | 3.81 | 9.16 | 79.07 | 224.15 | 0.35 |
| 477 | 12 | 3.81 | 9.16 | 141.05 | 568.60 | 0.25 |
| 478 | 12 | 3.81 | 9.16 | 133.42 | 329.50 | 0.40 |
| 479 | 12 | 3.81 | 9.16 | 130.96 | 217.28 | 0.60 |
| Baseline | 25 | 3.81 | 9.16 | 132.19 | 273.39 | 0.48 |
Based on numerical simulations, a theoretical optimum kerf distance and kerf depth related to the indentation depth was computed [32]. While the current experimental data do not show a similar identifiable trend of the normalized kerf distance on the removed volume, the kerf depth k normalized by the indentation depth d reveals a clear trend (see Figure 11). The experimental evidence confirms the assumed feature that the kerf depth is a crucial parameter, especially with increasing indentation depth. Consequently, future investigations on the effect of a free surface on the mechanisms during tool indentation should take this fact into account. An unlimited length of the free surface parallel to the load axis will most likely produce misleading results. As shown in Figure 12 a, the mean values of all experiments with equal indentation depths and distances to the edge of the kerf are illustrated. The maximum force increases distinctly with increasing distance l. For inserts placed directly above the axis or the edge of the kerf (0 mm distance l), the force increases only significantly when the sides of the insert indent the side walls of the kerf and come closer to the kerf bottom. Interestingly, for indentations with 3 mmand 6 mmdistance l, the maximum force approaches a peak value asymptotically. This is only valid for the tested range of indentation depths. Theoretically, the curves of the baseline experiments should be the upper bound for the maximum force. However, since the baseline rock specimen was from another charge of the quarry, the rock properties were slightly different. This circumstance is noticeable in Figure 12 b where the mean value curve for 3.05 mm indentation depth is exemplarily illustrated. An interesting characteristic is the decreasing initial stiffness with decreasing distance to the edge of the kerf. The slope of the force – indentation depth curve is a measure of this stiffness. A simple linear elastic numerical simulation with a rigid indenter was set up to validate that this stiffness degradation is related to the reduction in geometrical resistance by the kerf. Indeed, with increasing indentation depth, microcrack and fracture development were probably contributing significantly to the stiffness reduction, especially in the region where the force remains nearly constant and for small distances to the edge of the kerf.
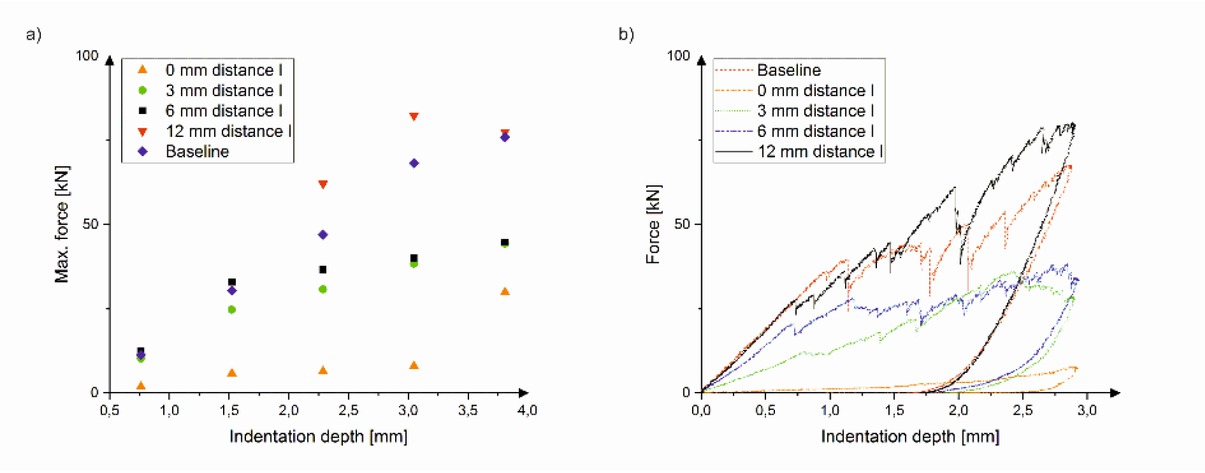
a) Mean value of the maximum force per indentation depth and b) Force-displacement curves for the 3.05 mm indentation depth.
The previous investigations on developing crack patterns due to kerfing by high-pressure jetting revealed that under the applied chamber pressure of 30 MPa, no cracks or fractures surrounding the kerf were created. The investigation of a comparison sample prepared with identical parameters yielded two minute cracks over a total kerf length of more than 900 mm. Additional cracks and fractures other than the naturally occurring would obviously distort the results. Hence, the jetted kerfs were treated solely as free surface with limited spatial dimensions for the following evaluation. Three adjacent slices of the baseline specimen are illustrated in Figure 13, showing characteristic features of the baseline experiments. The numbers above the images indicate the maximum indentation depth of the insert, not the actual depth of the crater. The actual depth of the craters are mostly deeper than the actual indentation depth. Although the samples were indented under 30 MPa confining pressure, numerous distinct tension cracks were observed in vertical direction. This type of fracture is commonly referred to as being rather brittle [19]. Recall that the samples originally had a 90 mm thickness and not only roughly 40 mm as in the images. These vertical and subvertical fractures occurred from indentation depths of 3.81 mmand upwards. From pictures B1A to B3A the interaction between the indentations in the form of a vertical fracture is evident. Furthermore, the subhorizontal shallow fracture in the B2A and B2B images is definitely identified as connection between two indentations. The same applies to image B3A where the indentations are connected by a subhorizontal fracture, most likely created by the shallower indentation, which was conducted subsequently. Unfortunately, no information is available at which stage each of the fractures formed, but the mutual interaction is obvious. Therefore, multiple indentations on a single surface are critical for an independent result. Considering that the distance between the indentations shown in the images B1A and B3A was more than 12 mm, no visible chipping occurred in between. The size of the crushed zone increased with the indentation depth as predicted for self-similar problems and the observed fracture characteristics are generally in agreement with the available experimental results [19] and numerical simulations [20], although they treated only two-dimensional problems.
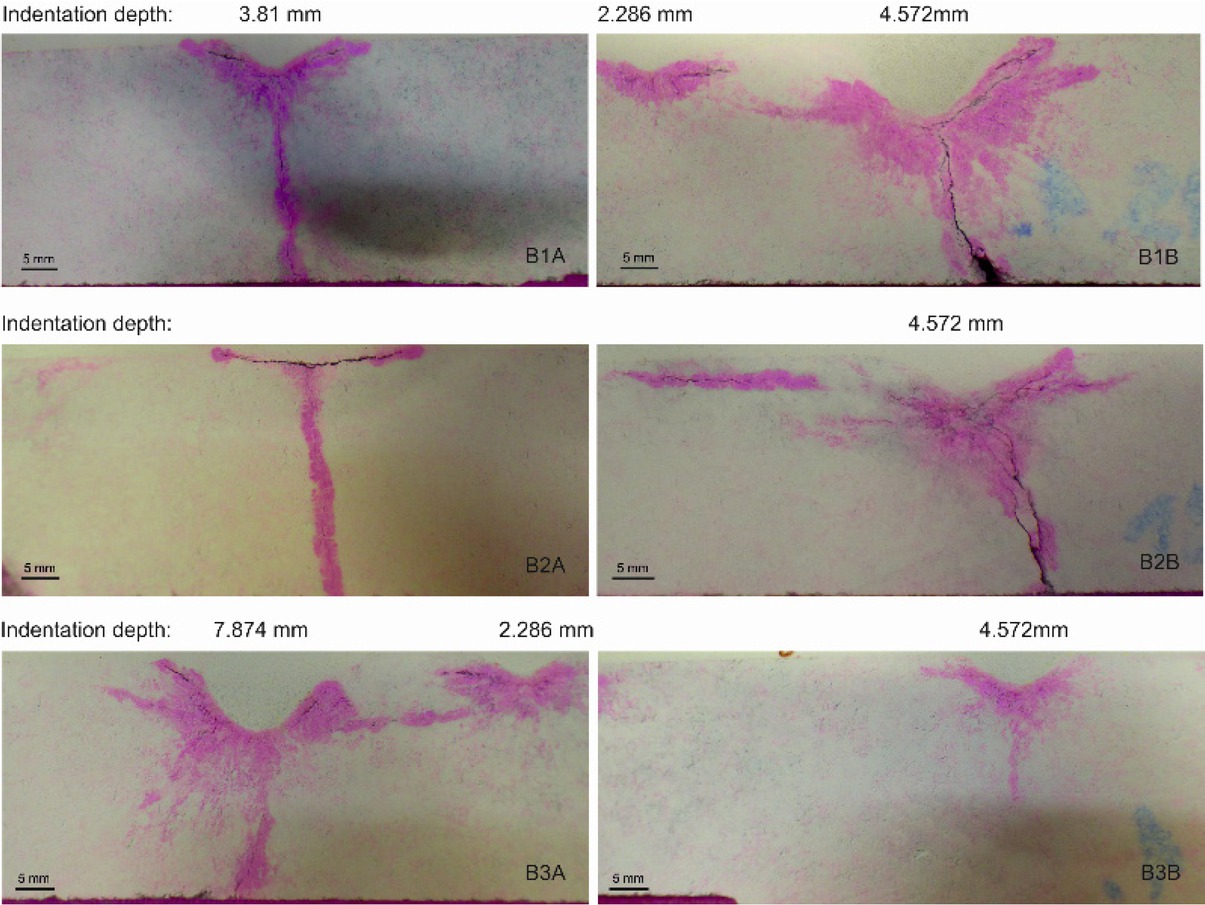
Rock specimens of baseline experiments, prepared with the dye penetration procedure.
The numbers above the pictures in Figure 14 indicate the test run and are linked to the data presented in Table 4. This series of images shows a representative portion of the tested specimen, evaluated with UV light after being saturated with the fluorescent epoxy resin. From Figure 9, it is clear that the cuts with the diamond saw were not made radially, leading to glancing intersections, which makes a spatial analysis difficult. However, for the spatial detection of fractures and cracks for the indentation experiments a three-dimensional investigation procedure is needed. Certainly, even a common CT scan was not an option for a sample of the given size and the required resolution for the detection of microcracks and fractures. In order to generate a 3D crack pattern of at least some of the regions of the specimen an alternative procedure was pursued. The images from the evaluation with UV light were integrated in the point cloud which was created during the photogrammetric measurements. For that purpose, the 2D extension of the fractures detected by UV light were measured and referenced to fixed points in the images, which were also traceable in the point cloud. These fixed points could be e.g. edges of kerfs or craters and the specimen boundaries. Furthermore, the main fractures were modelled with polylines to obtain pure geometrical relations. Before cutting the samples, pictures like those in Figure 9 were made with the position of the cuts marked. With the help of identical geometries in the point cloud and in the picture, the sample could be rotated, translated and scaled until the geometries coincided. By knowing the position and extension of the two-dimensional cracks, now represented by polylines, the fractures could be scaled and subsequently integrated in the point cloud. The result of this admittedly elaborate procedure is shown in Figure 15, where two different regions of the specimen were integrated and allow for a three-dimensional crack evaluation.
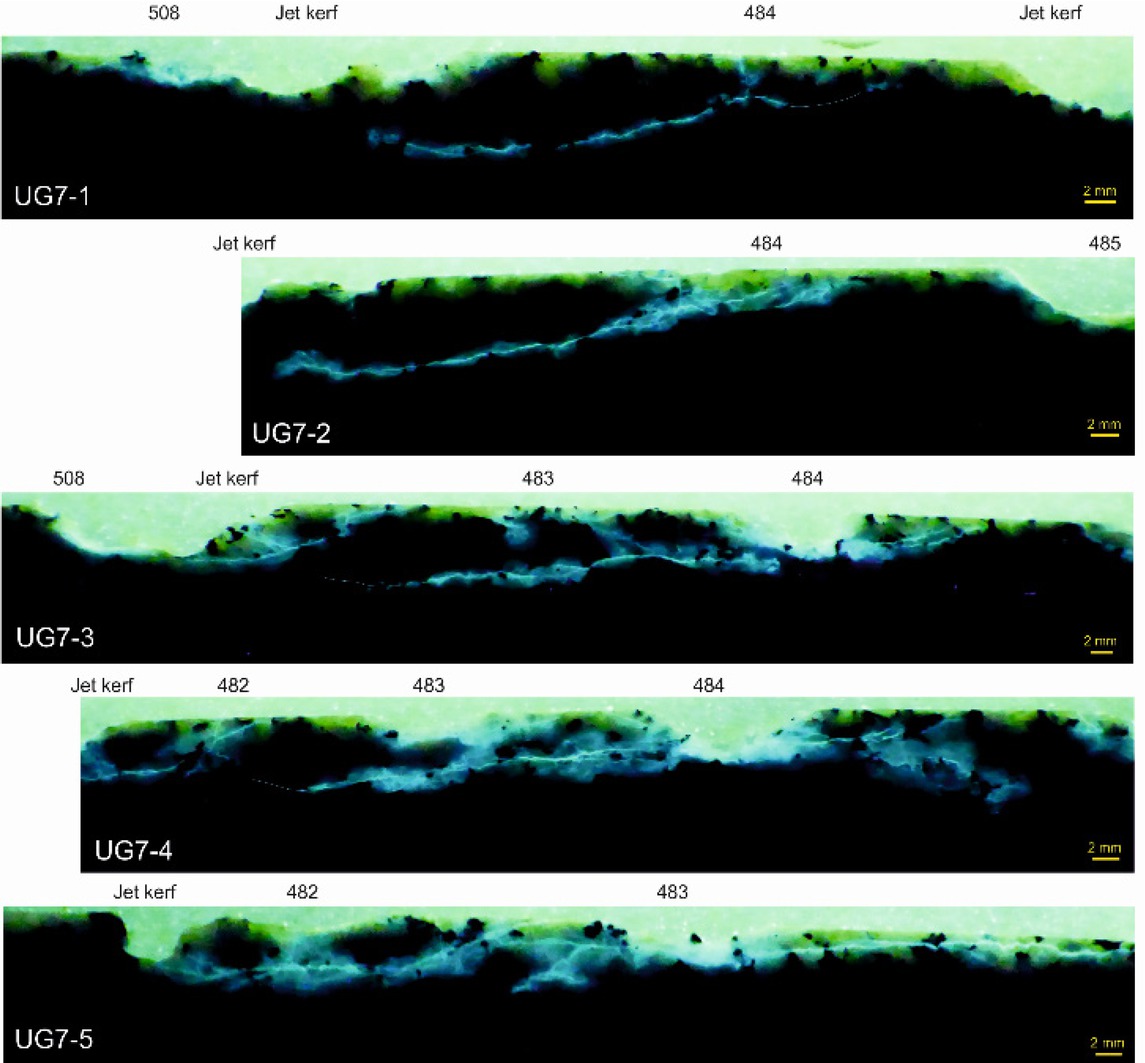
Rock specimen UG7 prepared with fluorescing epoxy resin.
Combined point cloud and an image of the rock specimen to allow for a 3D fracture evaluation.
6 Discussion
After evaluating the developed fracture and crack patterns related to mechanical and hydraulic loading, the underlying mechanisms are discussed. For the jetting experiments under atmospheric conditions, the size of the mineral grains beneath the impinging high-pressure jet affected the fracture behaviour. The almost radial cracks are probably attributed to tensile stress because of their propagation along the expected direction of maximum compressive stresses. In the xenolith lenses of the Basel granite, distinctly less microcracks developed than in the areas with larger grain size. A reasonable explanation for these observations is that many of the microcracks in areas with larger mineral grain size were generated during unloading. This effect is similar to the process of crack formation described in [8]. Instead of a mechanical indenter, the high-pressure fluid jet loads the bottom of the eroded kerf and causes initially small (sub)-vertical cracks to form. After the jet passed by, unloading of the kerf bottom occurs and the incompatibility strains between the irreversible deformation zone and the surrounding elastic region cause residual stresses which are the driving forces for those microcracks. The small to very small, homogeneously distributed, mineral grains in the xenolith lenses in the Basel granite largely prevent such effects.
Buntsandstone has the smallest grain size of all tested specimens. Consequently, the described effect should also occur in Buntsandstone, resulting in shallow kerfs. However, the cutting depth in Buntsandstone is around 200% of the cutting depth in Basel granite. Furthermore, the damaged zone around the jetted kerfs in Buntsandstone has a very limited extent, actually less than 1 mm. In the current case, the short duration of exposure to the jet pressure on the dry rock specimen is most likely the reason for the small damaged zone in Buntsandstone. The results illustrated in Figure 5a support the conclusion that the mechanisms of crack initiation and propagation are distinctly different for sandstone and for the crystalline rock types. Hence, permeability and porosity are supposed to control the fracture and erosion behaviour instead of the grain size in sandstone. The permeability of Buntsand-stone is determined to be ca. 1800 mD, while the permeability of Neuhauser granite ranged from 0.07 mD to impermeable. It is reasonably assumed that the permeability of Basel granite is in the range of Neuhauser granite. These results allow to derive a preliminary theory for the rock erosion mechanisms by high-pressure fluid jets.
For relatively weak rock types such as sandstone, the proposed theory in which cutting occurs by continuous erosion of ledges beneath the jet applies quite well [26]. For crystalline rock the situation is different. In this case, the process might be quite similar to the process of mechanical destruction by inserts. The rock directly beneath the impinging high-pressure jet is crushed and removed by the fluid jet; however, cracks form simultaneously. Depending on the most energy efficient path, the cracks form either along the trajectory of maximum compressive stress or along structural planes of relative weakness and other flaws. The existence and direction of flaws and the size and distribution of minerals have a significant impact on the developing pattern. Figure 4 illustrates this conclusion. Considerations concerning the specific energy support this theory. The removed volume in Figure 5b is a direct measure of the specific energy, dependent on the cutting velocity. AsMonzo granite has the largest removed volume, the excavation process is most efficient. The opposite applies for Buntsandstone, although the cutting depth is nearly twice that of Monzo granite. Hence, the brittle fracture along structural planes of relative weakness as e.g. in feldspar grains in Monzo granite generates the largest removed volume. Whereas surface chipping represents a significant fraction of the removed volume. This is therefore the most energy efficient method of rock excavation by high-pressure fluid jets. Extensive creation of microcracks around a crushed or removed zone as in e.g. Neuhauser granite is nearly as inefficient as pure crushing of grains and cement matrix in sandstone. According to the structure of Basel granite, being a mix of fine-grained material and larger grains of feldspar, it is not surprising that the curve is among the others. The volume of the prominent pre-existing fracture was excluded from the measurement in Basel granite.
The experiments under simulated wellbore conditions revealed that the ambient pressure regime has a significant influence on the crack formation. Anincreasing chamber pressure, synonymous for an increasing hydrostatic stress state in the rock specimen, prevents microcracking. Up to 20 MPa chamber pressure, microcracks occurred occasionally, but above 20 MPa pressure, scarcely any microcracks emerged. The lighted band around the kerf boundaries in Figure 6 originates from the backlight and not from cracks. However, all kerfs show funnel like chipping, a clear indication for tensile stress induced cracks. Two effects are supposed to be responsible for the observed behaviour. The initial hydrostatic compressive stress hampers the development of tensile stresses, although tensile stresses are expected to cause microcracking along the maximum compressive stress trajectory during the jetting process. This observation is in agreement with related research, showing that cracks emanating from tips of flaws are soon arrested in case that lateral confinement is present. Horii & Nemat-Nasser [4] also state that a set of suitably oriented flaws interacts and results in a cracked zone, even under confining pressure. Moreover, the increasing rock strength with increasing confining pressure is expected to affect the fracture behaviour as well. Referring to [14], applied confining pressures of more than 30 MPa almost certainly add up to a more ductile behaviour. Therefore microcrack initiation and propagation might be inhibited by the overall rock response, an effect also observed for only lateral confinement [19].
The subsequent part of the discussion considers the rock fracture related to the insert indentation as well as the link to the jetted kerfs. In some of the fractures in Figure 14, a small portion was not filled with the epoxy resin but was visible by visual inspection and is therefore indicted by hairlines. However, a salient characteristic is the high amount of primary subhorizontal fractures toward the nearest free surface and the complete absence of vertical cracks. Albeit, the deep-seated fracture beginning in UG7-1 to actually UG7-4 is interesting, especially from its trajectory point of view. As already indicated by numerical simulations, fractures appear to slow down before reaching the free surface [20]. These observations are not associated with the acting confining pressure, but to the effect of the kerf as a free surface. Simple linear elastic numerical simulations showed that the kerf leads to a rotation of the direction of maximum compression towards the kerf, which appears to act also as a boundary for crack propagation. The rock surface was a boundary for the direction and the magnitude of the principal stresses. However, confining pressure was also applied on the rock surface. It is assumed that the fractures orient themselves and propagate in the direction of the maximum compressive stress for low lateral confinement [4]. Including the findings of [2],where under confined conditions cracks propagated in the post failure region at certain angles with respect to the maximum compression, the mechanisms seem to be similar here. The crack propagation was bound between the sample surface and the direction of maximum compression toward the kerf.
Furthermore, subordinate Hertzian cone cracks and short vertical fractures were observed rarely. In case the indentation of the insert was near the edge of the kerf, actually no relevant cracks emerged and the insert simply removed the interjacent material. Referring to Figure 15, between indentations 478 to 480, connection fractures, which were also observed in the baseline experiments, were distinctly noticeable. Massive fracturing towards the kerf occurred also. However, a salient difference compared with the baseline experiments is that fractures propagated primary toward the free surface instead of forming an extensive crushed zone or creating vertical cracks. Since cracks form along the path of least resistance, the fracture propagation towards the free surface seems to be beneficial from an energetic point of view.
The results shown at the indentations 483 and 484 support this conclusion. The deep-seated fracture, also illustrated in UG7-1 to UG7-4, forms a pronounced fracture toward the kerf and stops near, but before the kerf. Although not performed in 3D and for a different load case, simulations show that existing joints and fractures attract new fractures, comparable to the effect of a local zone of weakness [21]. Hence, if a previous indentation already formed fractures toward the kerf, these act as a guideline or source for newly created fractures by the neighbouring indentation. Additionally, the three-dimensional evaluation explains the excessive scattering shown in Figure 11a. Analytically, the scattering was a result of widely differing removed volumes, separated from that identical indentation parameters. Due to local inhomogeneities, the energy release rate was presumably for some fractures sufficient to reach the free surface, for other fractures the propagation ceased nearby. The same observations were made for the baseline experiments. However, in an actual drilling operations adjacent inserts would provide the required energy input to remove the volume. Consequently, the entire drilling process would be much more efficient. Large scale drilling experiments validated this conclusion [41].
7 Conclusions
In the present study, rock fracture by different types of loading was investigated. The evaluation was based on experimental results and techniques to visualize the developing crack patterns. The following conclusions are drawn:
High-pressure fluid jetting experiments were conducted under atmospheric conditions with different types of rocks. The evaluation of the evolved cracks and fractures exhibited a strong dependency on the type, size, and bonding of the mineral grains. Distinction had to be made between crystalline and sedimentary rocks. A general conclusion for crystalline rock types is that the smaller the mineral grains are, the less microcracks were observed associated to the impact of the high-pressure jet. Large-grained crystalline rock types revealed prominent transgranular microcracking along the structural planes of relative weakness. The fracture behaviour due to hydraulic loading by high-pressure fluid jets closely resembled that of insert indentation. In contrast, jet cutting in sandstone proceeds by continuous erosion of ledges beneath the jet as proposed by current models. The intensity of microcracking and the cutting performance were found to be dependent also on the hydraulic jet power, the nozzle type and the ambient pressure regime. The specific energy for rock removal increased and microcrack formation in the surrounding rock decreased with increasing ambient pressure.
Indentation experiments with a bullet-shaped tungsten carbide insert were conducted on virgin rock samples but also on specimens with jetted kerfs. Generally, the kerfs represent additional free surfaces. Rotation of the direction of maximum compression stress and tensile stress induced cracking toward the free surface appear to be the main mechanisms. 3D rendering of the evolving fracture pattern revealed the large amount and geometrical distribution of subsurface fractures. These subsurface fractures did not cause chipping but interaction between adjacent indentations occurred. Not taking this observations into account for the calculation of important quantities such as the specific energy, distorts the results and leads to deceptive conclusions about the macroscopic fracture behaviour. The effect of the limited dimensions of the free surface and the indentation distance were found to be significant for the fracture process.
Acknowledgement
The generous effort of Mariusz Czerniak and Patrick Pratter during the evaluation phase was highly appreciated. Many thanks to Dr. Nina Gegenhuber for her help during the specimen saturation and to Dr. Martin Ziegler for providing a core sample from the Basel site for our experiments. The authors are thankful to GEIE Exploitation Minière de la Chaleur for getting access to the Soultz core samples, to Helmholz-Zentrum Potsdam (GFZ) for providing a core sample from the KTB site, and to the Federal Institute for Geosciences and Natural Resources (BGR) in Hannover for providing a core sample from the Falkenberg site.We would also like to express our appreciation to Schlumberger for supporting the release of this paper. This project has received funding from the European Union‘sHorizon 2020 research and innovation programme under grant agreement No. 641202.
References
[1] Gross D., Seelig T., Fracture mechanics – With an Introduction to Micromechanics. 3rd ed., Springer, 201710.1007/978-3-319-71090-7Search in Google Scholar
[2] Wong T.F., Micromechanics of Faulting in Westerly Granite. International Journal of Rock Mechanics and Mining Sciences & Geomechanics Abstracts, 1982, Vol. 19. https://doi.org/10.1016/0148-9062(82)91631-X10.1016/0148-9062(82)91631-XSearch in Google Scholar
[3] Brace W.F., Bombolakis E.G., A Note on Brittle Crack Growth in Compression. Journal of Geophysical Research Atmospheres, 1963, Vol. 68. https://doi.org/10.1029/JZ068i012p0370910.1029/JZ068i012p03709Search in Google Scholar
[4] Horii H., Nemat-Nasser S., Compression-Induced Microcrack Growth in Brittle Solids: Axial Splitting and Shear Failure. Journal of Geophysical Research, 1985, Vol. 90. https://doi.org/10.1029/JB090iB04p0310510.1029/JB090iB04p03105Search in Google Scholar
[5] Kemeny J.M., Cook N.G.W., Crack Models for the Failure of Rocks in Compression. In: Second International Conference on Constitutive Laws for Engineering Materials: Theory and Applications, 1987Search in Google Scholar
[6] Griffiths L., Heap M.J., Baud P., Schmittbuhl J., Quantification of microcrack characteristics and implications for stiffness and strength of granite. International Journal of Rock Mechanics and Mining Sciences, 2017, Vol. 100. https://doi.org/10.1016/j.ijrmms.2017.10.01310.1016/j.ijrmms.2017.10.013Search in Google Scholar
[7] Lawn B., Wilshaw R., Indentation fracture: principles and applications. Journal of Materials Science, 1975, Vol. 10. https://doi.org/10.1007/BF0082322410.1007/BF00823224Search in Google Scholar
[8] Swain M.V., Lawn B.T., Indentation Fracture in Brittle Rocks and Glasses. International Journal of Rock Mechanics and Mining Sciences & Geomechanics Abstracts, 1976, Vol. 13. https://doi.org/10.1016/0148-9062(76)91830-110.1016/0148-9062(76)91830-1Search in Google Scholar
[9] Wagner H., Schümann E.H.R., The stamp-load bearing strength of rock an experimental and theoretical investigation. Rock Mechanics and Rock Engineering, 1971, Vol. 3. https://doi.org/10.1007/BF0123817910.1007/BF01238179Search in Google Scholar
[10] Cook N.G.W., Hood M., Tsai F., Observations of crack growth in hard rock loaded by an indenter. International Journal of Rock Mechanics and Mining Sciences & Geomechanics Abstracts, 1984, Vol. 2110.1016/0148-9062(84)91177-XSearch in Google Scholar
[11] Lindqvist P.A., Lai H.H., Alm O., Indentation fracture development in rock continuously observed with a scanning electron microscope. International Journal of Rock Mechanics and Mining Sciences & Geomechanics Abstracts, 1984, Volume 2110.1016/0148-9062(84)90794-0Search in Google Scholar
[12] Mishnaevsky Jr. L.L., Physical Mechanisms of Hard Rock Fragmentation under Mechanical Loading: A Review. International Journal of Rock Mechanics and Mining Sciences & Geomechanics Abstracts, 1995, Vol. 32. https://doi.org/10.1016/0148-9062(95)00027-E10.1016/0148-9062(95)00027-ESearch in Google Scholar
[13] Maurer W.., Bit-Tooth Penetration Under Simulated Borehole Conditions. Journal of Petroleum Technology, 1965, Vol. 17. https://doi.org/10.2118/1260-PA10.2118/1260-PASearch in Google Scholar
[14] Gnirk P.F., Cheatham Jr. J.B., An Experimental Study of Single Bit-Tooth Penetration Into Dry Rock at Confining Pressures 0 to 5,000 psi. Society of Petroleum Engineers Journal, 1965, Vol. 5. https://doi.org/10.2118/1051-PA10.2118/1051-PASearch in Google Scholar
[15] Cheatham Jr. J.B., Pittman R.W., Plastic limit analysis applied to a simplified drilling problem. ISRM, Proceedings of. 1stt Congress, Lisbon, 1966Search in Google Scholar
[16] Gnirk P.F., Cheatham Jr. J.B., A theoretical description of rotary drilling for idealized down-hole bit/rock conditions. Society of Petroleum Engineers, 1969, doi:10.2118/2243-PA10.2118/2243-PASearch in Google Scholar
[17] Musselman J.A., Cheatham Jr. J.B., Plane-Strain Chip Formation In Carthage Marble. Proceedings of the 10th U.S. Symposium on Rock Mechanics (USRMS), Austin, Texas, 1968Search in Google Scholar
[18] Huang H., Damjanac B., Detournay E., Normal Wedge Indentation in Rocks with Lateral Confinement. Rock Mechanics and Rock Engineering, 1998, Vol. 31. https://doi.org/10.1007/s00603005001010.1007/s006030050010Search in Google Scholar
[19] Chen L.H., Labuz J.F., Indentation of rock by wedge-shaped tools. International Journal of Rock Mechanics and Mining Sciences, 2006, Vol. 43. https://doi.org/10.1016/j.ijrmms.2006.03.00510.1016/j.ijrmms.2006.03.005Search in Google Scholar
[20] Huang H., Detournay E., Discrete element modeling of tool-rock interaction II: rock indentation. International Journal for Numerical and Analytical Methods in Geomechanics, 2013, Vol. 37. https://doi.org/10.1002/nag.211410.1002/nag.2114Search in Google Scholar
[21] Zhu X., Liu W., He X., The Investigation of Roc Indentation Simulation Based on Discrete Element Method. KSCE Journal of Civil Engineering, 2017, Vol. 21. https://doi.org/10.1007/s12205-016-0033-410.1007/s12205-016-0033-4Search in Google Scholar
[22] Crow S.C., A theory of hydraulic rock cutting. International Journal of Rock Mechanics and Mining Sciences & Geomechanics Abstracts, 1973, Vol. 1010.1016/0148-9062(73)90006-5Search in Google Scholar
[23] Rehbinder G., Slot Cutting in Rock with a High Speed Water Jet. International Journal of Rock Mechanics and Mining Sciences & Geomechanics Abstracts, 1977, Vol. 14. https://doi.org/10.1016/0148-9062(77)90734-310.1016/0148-9062(77)90734-3Search in Google Scholar
[24] Rehbinder G.,Measurement of the Average Pore Velocity ofWater Flowing Through a Rock Specimen. Rock mechanics and Rock Engineering, 1978, Vol. 11. https://doi.org/10.1007/BF0189088210.1007/BF01890882Search in Google Scholar
[25] Rehbinder G., A Theory About Cutting Rock With a Water Jet. Rock mechanics and Rock engineering, 1980, Vol. 12. https://doi.org/10.1007/BF0125102810.1007/BF01251028Search in Google Scholar
[26] Hood M., Nordlund R., Thimons E., A Study of Rock Erosion using High-Pressure Water Jets. International Journal of Rock Mechanics and Mining Sciences & Geomechanics Abstracts, 1990, Vol. 27. https://doi.org/10.1016/0148-9062(90)94856-O10.1016/0148-9062(90)94856-OSearch in Google Scholar
[27] Hlaváč L.M., Hlavácová I.M., Kušnerová M., Mádr M., Research of waterjet interaction with submerged rock materials. WJTA American Waterjet Conference, Minneapolis, Minnesota, 2001Search in Google Scholar
[28] Hlaváč L.M., Mádr M., Kušnerová M., Kaličinský J., New Results of Unterwater Rock Cutting By Pure Waterjet. WJTA American Waterjet Conference, Houston, Texas, 2005Search in Google Scholar
[29] Reichmann J.M., Research and Development of a High-Pressure Waterjet Coring Device for Geothermal Exploration and Drilling. Flow Industries, Inc., Kent, WA (USA), 1977Search in Google Scholar
[30] Kolle J.J., Jet Kerfing Parameters for Confined Rock. Proceedings of the fourth U.S. water jet conference, University of California, Berkeley, 1987Search in Google Scholar
[31] Geier J.E., Hood M., The Effect of Pre-Weakening a Rock Surface, byWaterjet Kerfing, on Cutting Tool forces. Journal of Engineering for Industry, 1989, 111. https://doi.org/10.1115/1.318872710.1115/1.3188727Search in Google Scholar
[32] Veenhuizen S.D., Kolle J.J., Rice C.C., O’Hanlon T.A., Ultra-High-pressure Jet Assist of Mechanical Drilling. SPE/IADC Drilling Conference, Amsterdam, Netherlands, 1997, https://doi.org/10.2118/37579-MS10.2118/37579-MSSearch in Google Scholar
[33] Brace W.F., Silver E., Hadley K., Goetze C., Cracks and Pores: A Closer Look. Science, 1972, https://doi.org/10.1029/GM016p026510.1126/science.178.4057.162Search in Google Scholar PubMed
[34] Nicco M., Holley E.A., Hartlieb P., Kaunda R., Nelson P.P.; Methods for Characterizing Cracks Induced in Rock. Rock Mech Rock Eng, 2018; 51:2075-2093 https://doi.org/10.1007/s00603-018-1445-x10.1007/s00603-018-1445-xSearch in Google Scholar
[35] Hartlieb P., Grafe B., Shepelb T., Malovykb A., Akbaria B., Experimental study on artificially induced crack patterns and their consequences in mechanical excavation processes. International Journal of Rock Mechanics and Mining Sciences, 2017, Vol. 100. https://doi.org/10.1016/j.ijrmms.2017.10.02410.1016/j.ijrmms.2017.10.024Search in Google Scholar
[36] Stoxreiter T., Martin A., Teza D., Galler R., Hard rock cutting with high-pressure jets in various ambient pressure regimes. International Journal of Rock Mechanics and Mining Sciences, 2018, Vol. 108. https://doi.org/10.1016/j.ijrmms.2018.06.00710.1016/j.ijrmms.2018.06.007Search in Google Scholar
[37] Entacher M., Schuller E., Galler R., Rock failure and Crack Propagation Beneath Disc Cutters. Rock Mechanics and Rock Engineering, 2014, Vol. 48. https://doi.org/10.1007/s00603-014-0661-210.1007/s00603-014-0661-2Search in Google Scholar
[38] Maurer W.C., Rinehart J.S., Impact Crater Formation in Rock. Journal of Applied Physics, 1960, Vol. 31. https://doi.org/10.1063/1.173581410.1063/1.1735814Search in Google Scholar
[39] Snavely N., Seitz S.M., Szelski R., Modeling the World from Internet Photo Collection. International Journal of Computer Vision, 2008, Vol. 80. https://doi.org/10.1007/s11263-007-0107-310.1007/s11263-007-0107-3Search in Google Scholar
[40] Luhmann T., Nahbereichsphotogrammetrie: Grundlagen, Methoden und Anwendungen. Wichmann Verlag, 2018 (in German)Search in Google Scholar
[41] Stoxreiter T., Portwood G., Gerbaud L., Seibel O., Essl S., Plang J., Hofstätter H., Full-scale experimental investigation of the performance of a jet-assisted rotary drilling system in crystalline rock. International Journal of Rock Mechanics and Mining Sciences, 2019, Vol. 11510.1016/j.ijrmms.2019.01.011Search in Google Scholar
© 2019 T. Stoxreiter et al., published by De Gruyter
This work is licensed under the Creative Commons Attribution 4.0 Public License.
Articles in the same Issue
- Regular Articles
- 2D Seismic Interpretation of the Meyal Area, Northern Potwar Deform Zone, Potwar Basin, Pakistan
- A new method of lithologic identification and distribution characteristics of fine - grained sediments: A case study in southwest of Ordos Basin, China
- Modified Gompertz sigmoidal model removing fine-ending of grain-size distribution
- Diagenesis and its influence on reservoir quality and oil-water relative permeability: A case study in the Yanchang Formation Chang 8 tight sandstone oil reservoir, Ordos Basin, China
- Evaluation of AHRS algorithms for Foot-Mounted Inertial-based Indoor Navigation Systems
- Identification and evaluation of land use vulnerability in a coal mining area under the coupled human-environment
- Hydrocarbon Generation Potential of Chia Gara Formation in Three Selected Wells, Northern Iraq
- Source Analysis of Silicon and Uranium in uranium-rich shale in the Xiuwu Basin, Southern China
- Lithologic heterogeneity of lacustrine shale and its geological significance for shale hydrocarbon-a case study of Zhangjiatan Shale
- Characterization of soil permeability in the former Lake Texcoco, Mexico
- Detrital zircon trace elements from the Mesozoic Jiyuan Basin, central China and its implication on tectonic transition of the Qinling Orogenic Belt
- Turkey OpenStreetMap Dataset - Spatial Analysis of Development and Growth Proxies
- Morphological Changes of the Lower Ping and Chao Phraya Rivers, North and Central Thailand: Flood and Coastal Equilibrium Analyses
- Landscape Transformations in Rapidly Developing Peri-urban Areas of Accra, Ghana: Results of 30 years
- Division of shale sequences and prediction of the favorable shale gas intervals: an example of the Lower Cambrian of Yangtze Region in Xiuwu Basin
- Fractal characteristics of nanopores in lacustrine shales of the Triassic Yanchang Formation, Ordos Basin, NW China
- Selected components of geological structures and numerical modelling of slope stability
- Spatial data quality and uncertainty publication patterns and trends by bibliometric analysis
- Application of microstructure classification for the assessment of the variability of geological-engineering and pore space properties in clay soils
- Shear failure modes and AE characteristics of sandstone and marble fractures
- Ice Age theory: a correspondence between Milutin Milanković and Vojislav Mišković
- Are Serbian tourists worried? The effect of psychological factors on tourists’ behavior based on the perceived risk
- Real-Time Map Matching: A New Algorithm Integrating Spatio-Temporal Proximity and Improved Weighted Circle
- Characteristics and hysteresis of saturated-unsaturated seepage of soil landslides in the Three Gorges Reservoir Area, China
- Petrographical and geophysical investigation of the Ecca Group between Fort Beaufort and Grahamstown, in the Eastern Cape Province, South Africa
- Ecological risk assessment of geohazards in Natural World Heritage Sites: an empirical analysis of Bogda, Tianshan
- Integrated Subsurface Temperature Modeling beneath Mt. Lawu and Mt. Muriah in The Northeast Java Basin, Indonesia
- Go social for your own safety! Review of social networks use on natural disasters – case studies from worldwide
- Forestry Aridity Index in Vojvodina, North Serbia
- Natural Disasters vs Hotel Industry Resilience: An Exploratory Study among Hotel Managers from Europe
- Using Monarch Butterfly Optimization to Solve the Emergency Vehicle Routing Problem with Relief Materials in Sudden Disasters
- Potential influence of meteorological variables on forest fire risk in Serbia during the period 2000-2017
- Controlling factors on the geochemistry of Al-Shuaiba and Al-Mejarma coastal lagoons, Red Sea, Saudi Arabia
- The Influence of Kaolinite - Illite toward mechanical properties of Claystone
- Two critical books in the history of loess investigation: ‘Charakteristik der Felsarten’ by Karl Caesar von Leonhard and ‘Principles of Geology’ by Charles Lyell
- The Mechanism and Control Technology of Strong Strata Behavior in Extra-Thick Coal Seam Mining Influenced by Overlying Coal Pillar
- Shared Aerial Drone Videos — Prospects and Problems for Volunteered Geographic Information Research
- Stable isotopes of C and H in methane fermentation of agriculture substrates at different temperature conditions
- Prediction of Compression and Swelling Index Parameters of Quaternary Sediments from Index Tests at Mersin District
- Detection of old scattered windthrow using low cost resources. The case of Storm Xynthia in the Vosges Mountains, 28 February 2010
- Remediation of Copper and Zinc from wastewater by modified clay in Asir region southwest of Saudi Arabia
- Sedimentary facies of Paleogene lacustrine dolomicrite and implications for petroleum reservoirs in the southern Qianjiang Depression, China
- Correlation between ore particle flow pattern and velocity field through multiple drawpoints under the influence of a flexible barrier
- Atmospheric refractivity estimation from AIS signal power using the quantum-behaved particle swarm optimization algorithm
- A geophysical and hydro physico-chemical study of the contaminant impact of a solid waste landfill (swl) in King Williams’ Town, Eastern Cape, South Africa
- Landscape characterization using photographs from crowdsourced platforms: content analysis of social media photographs
- A Study on Transient Electromagnetic Interpretation Method Based on the Seismic Wave Impedance Inversion Model
- Stratigraphy of Architectural Elements of a Buried Monogenetic Volcanic System
- Variable secondary porosity modeling of carbonate rocks based on μ-CT images
- Traditional versus modern settlement on torrential alluvial fans considering the danger of debris flows: a case study of the Upper Sava Valley (NW Slovenia)
- The Influence of Gangue Particle size and Gangue Feeding Rate on Safety and Service Life of the Suspended Buffer’s Spring
- Research on the Transition Section Length of the Mixed Workface Using Gangue Backfilling Method and Caving Method
- Rainfall erosivity and extreme precipitation in the Pannonian basin
- Structure of the Sediment and Crust in the Northeast North China Craton from Improved Sequential H-k Stacking Method
- Planning Activities Improvements Responding Local Interests Change through Participatory Approach
- GIS-based landslide susceptibility mapping using bivariate statistical methods in North-western Tunisia
- Uncertainty based multi-step seismic analysis for near-surface imaging
- Deformation monitoring and prediction for residential areas in the Panji mining area based on an InSAR time series analysis and the GM-SVR model
- Statistical and expert-based landslide susceptibility modeling on a national scale applied to North Macedonia
- Natural hazards and their impact on rural settlements in NE Romania – A cartographical approach
- Rock fracture initiation and propagation by mechanical and hydraulic impact
- Influence of Rapid Transit on Accessibility Pattern and Economic Linkage at Urban Agglomeration Scale in China
- Near Infrared Spectroscopic Study of Trioctahedral Chlorites and Its Remote Sensing Application
- Problems with collapsible soils: Particle types and inter-particle bonding
- Unification of data from various seismic catalogues to study seismic activity in the Carpathians Mountain arc
- Quality assessment of DEM derived from topographic maps for geomorphometric purposes
- Remote Sensing Monitoring of Soil Moisture in the Daliuta Coal Mine Based on SPOT 5/6 and Worldview-2
- Utilizing Maximum Entropy Spectral Analysis (MESA) to identify Milankovitch cycles in Lower Member of Miocene Zhujiang Formation in north slope of Baiyun Sag, Pearl River Mouth Basin, South China Sea
- Stability Analysis of a Slurry Trench in Cohesive-Frictional Soils
- Integrating Landsat 7 and 8 data to improve basalt formation classification: A case study at Buon Ma Thuot region, Central Highland, Vietnam
- Assessment of the hydrocarbon potentiality of the Late Jurassic formations of NW Iraq: A case study based on TOC and Rock-Eval pyrolysis in selected oil-wells
- Rare earth element geochemistry of sediments from the southern Okinawa Trough since 3 ka: Implications for river-sea processes and sediment source
- Effect of gas adsorption-induced pore radius and effective stress on shale gas permeability in slip flow: New Insights
- Development of the Narva-Jõesuu beach, mineral composition of beach deposits and destruction of the pier, southeastern coast of the Gulf of Finland
- Selecting fracturing interval for the exploitation of tight oil reservoirs from logs: a case study
- A comprehensive scheme for lithological mapping using Sentinel-2A and ASTER GDEM in weathered and vegetated coastal zone, Southern China
- Sedimentary model of K-Successions Sandstones in H21 Area of Huizhou Depression, Pearl River Mouth Basin, South China Sea
- A non-uniform dip slip formula to calculate the coseismic deformation: Case study of Tohoku Mw9.0 Earthquake
- Decision trees in environmental justice research — a case study on the floods of 2001 and 2010 in Hungary
- The Impacts of Climate Change on Maximum Daily Discharge in the Payab Jamash Watershed, Iran
- Mass tourism in protected areas – underestimated threat? Polish National Parks case study
- Decadal variations of total organic carbon production in the inner-shelf of the South China Sea and East China Sea
- Hydrogeothermal potentials of Rogozna mountain and possibility of their valorization
- Postglacial talus slope development imaged by the ERT method: comparison of slopes from SW Spitsbergen, Norway and Tatra Mountains, Poland
- Seismotectonics of Malatya Fault, Eastern Turkey
- Investigating of soil features and landslide risk in Western-Atakent (İstanbul) using resistivity, MASW, Microtremor and boreholes methods
- Assessment of Aquifer Vulnerability Using Integrated Geophysical Approach in Weathered Terrains of South China
- An integrated analysis of mineralogical and microstructural characteristics and petrophysical properties of carbonate rocks in the lower Indus Basin, Pakistan
- Applicability of Hydrological Models for Flash Flood Simulation in Small Catchments of Hilly Area in China
- Heterogeneity analysis of shale reservoir based on multi-stage pumping data