Landscape characterization using photographs from crowdsourced platforms: content analysis of social media photographs
-
Aitor Àvila Callau


Abstract
Landscape characterisation using social media photographs from popular platforms has been proposed as a landscape and ecosystem services approach. However, popular crowdsourced websites provide uncharacterized data and are only representative of the general public. Photographs from crowdsourced sports platforms, whose users are more homogeneous, could help to characterise landscape more uniformly. In this study we use automated content analysis from photographs on Wikiloc, a crowd-sourced sports platform, to characterize landscape in the Ebro Delta Natural Park, a protected area in Spain. Our approach applies big data procedures and spatial analysis to provide in-depth information regarding what draws visitors’ attention to a landscape and to ascertain their intrasite flow. Our results show that sports users are keen on natural landscapes and pay less attention to rural and degraded landscapes, and that areas closer to paths are more photographed than more distant areas.
1 Introduction
Landscape characterisation can be defined as the way a landscape is described and understood through one’s senses, particularly sight. It is considered a prior step to landscape appraisal and is related to landscape recognition, character and value, etc. [1]. In the last few decades many studies [e.g. 1, 2] have been conducted on landscape characterisation, which has become one of the most discussed topics in landscape studies [3, 4]. The term landscape is a polysemic signifier usually used as an umbrella under which various features and configurations find shelter. The Council of Europe [5] defines landscape as an “area, as perceived by people, whose character is the result of the action and interaction of natural and/or human factors”. Landscape characterisation has profound implications for public and academic purposes [6, 7, 8], while landscape quality is considered hugely important for one’s well-being [5]. Landscape characterisation is built on physical features such as landforms and land cover and how these features interrelate [9, 10] as well as on psychological processes and cognitive assessments [11, 12]. How landscape is understood is also fundamental in tourism and recreation [13]. It is viewed as a key topic in ecosystem services [14] that varies according to the user or type of user [15]. However, landscape characterisation as a component of landscape appraisal is a complex process. Judgments and preference judgments are subject to a high degree of variance and different users may have different opinions. Consensus is not easy to achieve [16]. In this paper we present a procedure for landscape characterisation that is based on photograph content analysis acquired from crowdsourced sports websites. This procedure is intended to facilitate an approach to landscape using data from a homogeneous type of user.
Numerous studies have used photographs as the main source of information for a landscape approach, especially landscape preferences [e.g. 7, 8, 17]. A photograph is understood to reveal what attracts the attention of the visitor to a site [18]. Whether related to aesthetics [19] or intimate feelings [17], the act of taking a photograph reveals that something in the landscape has caught the visitor’s eye [20, 21]. Studies using social media photographs as a big data source have proved useful in understanding and mapping ecosystem services [13, 22, 23] and opened the door to new sources of information for pinpointing what features and aspects of the landscape attract people’s interest in a given place [20, 24, 25, 26]. In addition, volunteered geographic information (VGI) is understood to provide relevant, free and easy access to sources of information [27]. However, VGI is an emerging field and still poses certain problems and methodological challenges, such as the heterogeneity of the crowdsourced user’s profile [e.g. 14].
Previous studies have used geo-tagged photographs as the main source of information or as a proxy for evaluating public interest in a place [21]. The general assumption is that the greater the density of photographs, the greater the visitor appeal [24, 28, 29]. Besides geolocation, some other studies rely on semantic analysis and use photographs tagged by users as a data source. A case in point is [30] where density of photographs and tags are analyzed to understand preferences in urban landscape between locals and tourists; the study reveals differences in interpreting and approaching the landscape as well as the meaning it has for various types of users according to the tags used. Content analysis of photographs gives deeper insight in what is depicted in each image. Hu et al., (2014) [31] pointed out that image content of photographs on Instagram can be roughly categorized in self-portraits, friends, activities, images with embedded text, food, and gadgets, followed by fashion and pets; landscape and landscape views didn’t appear among the most commonly photographed images. Studies conducted in protected areas using tagged photographs on Instagram reveal the potential of social media photographs to provide information on users’ activity patterns [32] and prove to be a useful tool in park management; however, users on Instagram seem to share (and tag) photos where activities are prevalent to landscape views. The density, spatial analysis, and semantic analysis of the photographs can therefore be complemented with content analysis [31]. Ultimately, photograph tagging is a voluntary act performed by the users themselves, who may not record any tags, may not be diligent in recording them, or may do so according to their own criteria [33]. In short, content analysis is the basis of landscape characterisation and therefore the basis for any approach based on landscape attributes. In fact, content analysis should be understood as a prior step for any in-depth landscape approach based on social media images. Some authors [34] assert that content analysis is needed to ensure that photographs are relevant to ecosystem services and to determine which aspects of the environment people find most interesting.
Many crowdsourced websites provide photographs that can be used as a data source for landscape characterisation. Popular platforms such as Panoramio, Flickr and Instagram are used by a wide range of users and are popular with broad sections of society [22, 25, 31]. Although all platforms are quite similar, each one tends to be preferred by a certain type of user [35]. Moreover, the fact that it is impossible to differentiate between demographic and social profiles introduces a bias that makes it difficult to generalize results. As different types of users behave and understand landscape differently [36, 37], the representativeness of social media photographs has been debated [e.g. 14, 26]. Crowdsourced sports websites such as Strava, Endomondo, GPSies, MapMyRide, Runtastic and Wikiloc reduce this bias. Like other popular platforms, sports websites do not allow demographic distinctions. However, as they are intended for a specific population (i.e. sports users), their user spectrum is narrow and therefore more homogeneous than those of other popular platforms. The main aim of this study is to demonstrate a procedure for landscape characterisation that is based on automated image recognition downloaded from social media sports platforms. We hypothesize that the user profile of crowdsourced sports sites is different from and more homogeneous than that of other popular platforms and that this homogeneity responds better to the profile of the average visitor to a protected area. We use Wikiloc photographs as the data source and the Ebro Delta Natural Park as the study area. Our objectives are: (1) to assess landscape characterization by using crowdsourced sports website photographs; (2) to pinpoint what attracts attention to the landscape from both a thematic and a spatial point of view; and (3) to evaluate crowdsourced sports website photographs as a data source for characterising the landscape.
2 Methods
Landscape characterisation is conducted in three steps: data source and webscraping; tagging and classifying the photographs; and content and spatial analysis.
2.1 Data source and webscraping
Outdoor web service Wikiloc was chosen as a VGI data source because it is the most popular outdoor activities website in the region [37, 38]. Wikiloc is a crowdsourced online service that began operating in 2006. Ten years later it had over 3.5 million users worldwide [39]. Its main purpose is to record and share outdoor tracks that can be complemented with comments and photographs. Trails can be recorded using any GNSS data logger/device, while the tracks can be recorded and the photographs taken and up-loaded by smartphone in situ or shortly afterwards to ensure they are georeferenced [40]. The popularity of Wikiloc is demonstrated by the over 8.5 million outdoor tracks and 14.5 million photographs shared over the last dozen years or so. Wikiloc has run on Google since 2008. Live tracking can be uploaded using apps for IOS and Android devices.
A framework embracing the Ebro Delta Natural Park was designed to enable downloading of Wikiloc photographs taken between 2006 and 2016. The Park’s marine protected area was included in this framework in order to also take into account photographs taken from water-craft (i.e. kayak, canoe or boat, etc.) and analyse all the photographs that depict the studied area. Data were downloaded using webscraping techniques, and a geodatabase was set up to collect the photographs’ attributes, which include identifiers, names, elevation and X,Y coordinates, and links to the same image (Table 1).
Example of the geodatabase.
| Id_track | Id_point | Name_point | Type_point | elevation | lat | lng | Id_img | url_img |
|---|---|---|---|---|---|---|---|---|
| 118373 | 118633 | Ullal de Baltasar | unspedified | 0 | 40,672982 | 0,59348771 | 16707 | http.//s0.wklcdn.com/image_0/94 43/118633/1670 7.jpg |
2.2 Tagging and classification of photographs
Image recognition software enables cloud computing to analyse vast amounts of images for large areas. Software such as Clarifai, Google Cloud Vision and Microsoft Computer Vision provide image recognition formulae based on cloud algorithms that can be used to analyse and code complex images for research purposes [33]. 8-bit software is an image recognition software that analyses images by using artificial intelligence and providing selected tags, or key words, for the images based on their visual content. 8-bit software has proved effective in recognising landscape and open spaces and for detecting and tagging small elements in the landscape such as litter.
The photographs were tagged according to their content by using descriptive keywords [14]. 8-bit software generates 10 descriptive labels for each photograph and provides a probability score for them to be true between 0.01 and 0.99. Any label with a score above 0.10 is considered reliable. A second selection was then made that considered only images with scores above 0.10 (Table 2).
Example of the tags generated by 8-bit software for photograph 1,716,873.
| Id_img | Lat | lng | tag | score |
|---|---|---|---|---|
| 1716873 | 40,709338 | 0,581983 | Furrow | 0.359 |
| 1716873 | 40,709338 | 0,581983 | Plain | 0.238 |
| 1716873 | 40,709338 | 0,581983 | Rut | 0.131 |
| 1716873 | 40,709338 | 0,581983 | Cultivated land | 0.109 |
| 1716873 | 40,709338 | 0,581983 | Grain field | 0.036 |
| 1716873 | 40,709338 | 0,581983 | Steppe | 0.023 |
| 1716873 | 40,709338 | 0,581983 | Saltpan | 0.015 |
| 1716873 | 40,709338 | 0,581983 | Field | 0.013 |
| 1716873 | 40,709338 | 0,581983 | Maze | 0.012 |
| 1716873 | 40,709338 | 0,581983 | Runway | 0.011 |
The tagged photographs were divided into eight types and 37 subtypes according to the main feature they represented [17]. Classification was performed directly when 8-bit software tags were clear and double-checked manually when they were not. Tag classification considered eight types, four of which typified the landscape while four typified social reactions or interests. These eight types were: “natural landscape”,when the predominant elements photographed referred to natural landscape features such as vegetation or bodies of water; “rural landscape”, when the predominant elements referred to rural landscape features such as agriculture or fishing tackle in bodies of water; “cultural landscape”,when the predominant elements referred to cultural landscape features such as historic or artistic monuments and buildings; “urban landscape”, when the predominant elements referred to urban landscape features such as towns, streets and roads; “recreation and social situations”, when the predominant elements referred to recreational experiences such as cycling, sunbathing or picnicking; “facilities and infrastructures”, when the predominant elements referred to trails and related facilities such as vantage points, birdwatching hides or car parks; “emotional reactions”, when the predominant elements referred to particular atmospheric or light conditions creating attractive views such as sunset, dawn or rain; “disturbing elements”, when the predominant elements referred to elements or behaviours that threatened or diminished conservation values, e.g. littering, crowded areas or car parking in prohibited spaces (Table 3).
Type and subtype tags.
| Type | Subtype (main feature represented) |
|---|---|
| Natural landscape | Ocean |
| River | |
| Lagoon | |
| Beach, dune field | |
| Vegetation | |
| Bird life | |
| Rural landscape | Crop |
| Path | |
| Irrigation infrastructure | |
| Fishing port | |
| Cultural landscape | Buildings of traditional architecture |
| Tower, castle | |
| Church, hermitage | |
| Monument, sculpture | |
| Lighthouse | |
| Bridge | |
| Museum, information office | |
| Urban landscape | Ordinary building |
| Road | |
| Tourist accommodation | |
| Supermarket | |
| Recreation and | Cycling |
| social situations | Hiking |
| Kayaking | |
| Tourist cruises | |
| Sunbathing | |
| Gastronomic experience | |
| Facilities and | Signposting, information board |
| infrastructures | Viewpoint |
| Picnic area | |
| Bicycle path | |
| Emotional reactions | Sunset, dawn |
| Sky, clouds, lightning | |
| Disturbing elements | Litter |
| Unleashed dog | |
| Damaged facility | |
| Car, van or caravan parked in prohibited | |
| spaces |
2.3 Attributes and spatial analysis
Attribute analysis was conducted by considering the content of the photographs (Table 3). Spatial analysis was particularly useful for understanding distribution patterns and higher concentrations of events. Like many other studies [e.g. 8, 20, 28], we assumed that the more photographed a place is the more it catches the eye of the visitor. Spatial operations were performed using ArcGis 10.2, and included attributes and spatial queries, geoprocessing, and Kernel analysis to weigh and estimate the density of the photographs. Kernel analysis infers density of features in a given location around these features. The result is Kernel density based on a quadratic formula, with the highest scores at the centre of the density surface and the rest gradually diminishing towards the edges of the surface. Since the surface density tapers from sample points on a spatial basis, the Kernel algorithm provides a fairly accurate inference for concentration of geographical features [41].
Land cover maps were used as an ancillary data source. Highly accurate maps (pixel resolution 0.25m; accuracy at 1:2.500) depicting 58 categories for the studied area were used [42]. Tourist attractions to the site were also mapped using official and unofficial sources of information [43, 44]. Up to 64 tourist attractions were registered, including landmarks, vantage points, museums and information offices, picnic areas, natural sites and settlements.
3 Area studied
Located in the eastern façade of the Iberian Peninsula, the Ebro Delta is one of the largest wetlands in the Mediterranean basin (Figure 1). Extending over 330 km2, it is largely covered by rice fields (65%), dune fields and beaches (8.1%), lagoons (6.2%) and marshes (6.1%), though riverine forests, salt mines, historic buildings, roads, canals and towns make up a rich and varied landscape. The area is a natural park, which is also protected by the Natura 2000 network, the Ramsar convention and the Man and Biosphere Programme, and includes six reserves where human visitation is controlled or even prohibited. In addition to the local population, each year over 150,000 visitors [43] are attracted to the area by its views and distinctive scenery, which appears in every brochure for the region [44]. Tourists also enjoy its beaches, go on river cruises, sample the local cuisine, and take part in outdoor activities such as cycling and birdwatching. The managers of the Park have designed 10 discovery trails covering the entire Delta area and Ebro Delta scenery.

Area studied.
4 Results
Landscape characterisation was conducted by downloading, tagging, cleansing, and analysing 2,639 Wikiloc photographs taken between 2006 and 2016. After these photographs had been tagged and cleansed, the final number of photographs used in the study was 2,131 (80.75% of the original photographs).
Analysis of these photographs provided interesting results in terms of landscape characterisation from both the spatial and the attributive points of view.
4.1 Spatial distribution
Most photographs (42.2%) were located along the coast, especially the northern one (59.8% of all littoral photographs). A quarter of the photographs (25.7%) were taken along the Ebro River, particularly at the mouth. The rest of the photographs were scattered around the Delta and, although some clusters are observed, vast areas appear with no photographs at all. The proportion of photographs at the northern and southern edges of the Delta is similar, though their distribution is clustered on the northern side. With regard to typology, natural landscapes are highly clustered along the coast, while urban landscapes are highly clustered around the towns. Cultural and rural landscapes are scattered everywhere but are more common close to the Ebro River and the coast. The highest density of photographs is observed near the mouth of the river, followed by certain lagoons and landmarks such as bridges and lighthouses. Clusters around beach access points and natural reserves are also observed (Figure 2).
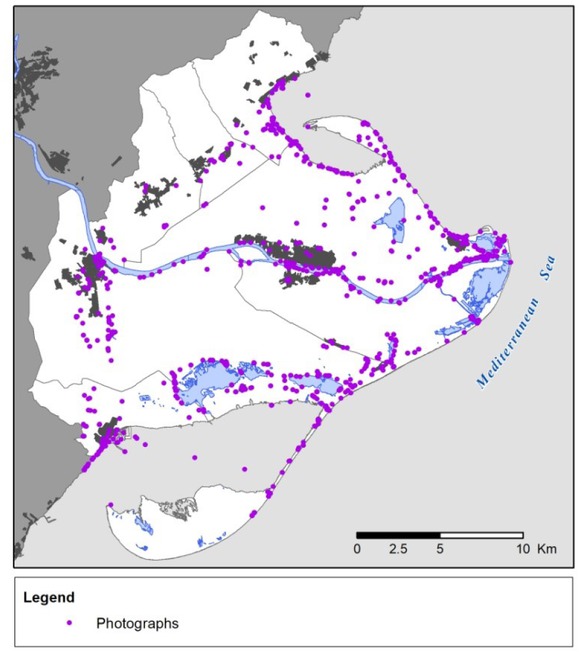
Distribution of photographs.
4.2 Image content
Three quarters of the photographs analysed describe landscape features, while the rest describe landscape elements or some form of emotion. Natural landscape is the landscape that is most often photographed (two fifths, or 43.1%, of the photographs analysed). Rural landscape accounts for 16% of all photographs, while cultural landscape and urban landscape account for 11% and 3.9%, respectively.
The most photographed subtype of natural landscape is beach and dune fields (35.6% of all natural landscape photographs), followed by the Ebro River itself (22.3%) and lagoons (20.7%). Depictions of vegetation represent 9.9% of all natural landscape photographs, while those of birdlife and the ocean represent 5.8% and 5.7%, respectively. Photographs of rural landscapes mainly depict crops (36.9%), irrigation infrastructure (27.3%) and paths through agricultural fields (21.1%). These three categories are closely related and together account for four fifths of all rural landscape photographs. Cultural landscapes comprise a large number of subtypes, most of which are equally represented. Monuments and sculptures (22.2%), bridges (21.3%) and churches or hermitages (19.6%) are prevalent. Lighthouses appear to catch the visitor’s eye (15.9%), as do towers and castles (9.2%). Less represented items, on the other hand, include museum and information offices (7.5%) and buildings with traditional architecture (9.2%). Urban landscapes, which are hardly represented at all, mainly depict roads (60.4%) and ordinary buildings (33.7%).
Facilities and infrastructures account for a seventh (14.7%) of all photographs. In most cases (44.4%) these are photographs of vantage points, while in other cases they are of signposts and information boards (34.8%) or cycle paths (14%). Recreation and social situations account for 10.3% of all photographs. These are mainly depicted by images showing people cycling (63.4%) or taking part in other outdoor activities, e.g. river tourist cruises (11.9%), hiking (10.5%), and kayaking, sunbathing, and enjoying local food (roughly 5% each). Fewer than one out every 200 photographs depict sunsets or sunrise. Very few images show disturbing elements (0.38%). Examples of these categories are shown in Figure 3.
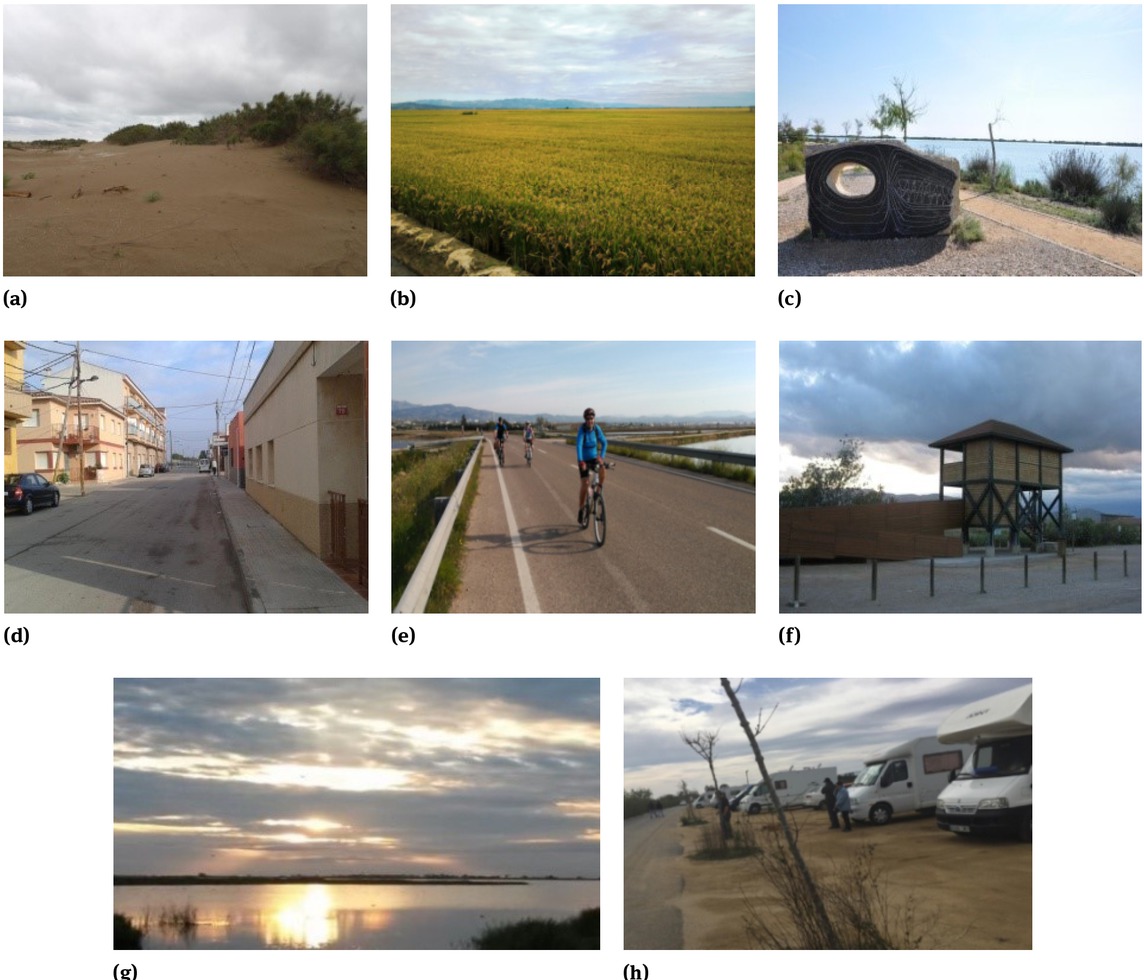
Examples of photographs. An example of the commonest subtype is recorded. (a) Natural landscape (beach, dune field); (b) Rural landscape (rice crop); (c) Cultural landscape (monument, sculpture); (d) Urban landscape (road); (e) Recreation and social situations (cycling); (f) Facilities and infrastructures (vantage point); (g) Emotional reactions (sunset, sunrise); (h) Disturbing elements (cars parked in prohibited areas).
4.3 Spatial analysis
Spatial analysis reveals a rather eccentric distribution since most of the photographs are clustered on the outer borders of the delta while photographs of its hinterland are almost absent. Photographs are related to the network of roads and paths and a clear spatial correlation is found with paved roads and cycling routes. Official discovery trails account for most of the photographs uploaded. Spatial analysis shows that 55% of all photographs are taken within 200m of these trails. Nearly two thirds of all photographs (63.46%) are taken in reserves, which are mainly
located near the coast. A great deal of these (70.29%) is taken in reserves where human visitation is allowed,while 29.71% (i.e. 18.86% of all photographs) are taken in reserves where human visitation is prohibited.
A clear correlation exists between a high density of photographs and a high density of tourist attractions: 64 tourist attractions are mapped in the Ebro Delta and 51.22% of all photographs are taken within 500m of these (and 66.65% within 1km). A third of the photographs, on the other hand, are not clearly linked to any tourist attraction.
A highest density of photographs is found in the last stretch of the Ebro River: a secondary cluster appears near the mouth of the river around popular beaches and natural areas, where restaurants, souvenirs shops, vantage points, the start/finish of cycle routes, and river cruises are to be found. Lower densities appear at other popular spots such as natural sites, some renewed beaches, and the start/finish of discovery tracks. Kernel analysis reveals lower concentrations mainly on the coast at information offices, vantage points, landmarks and towns. Clusters around natural sites are more prevalent than around other landscape features or landmarks, except at the mouth of the Ebro River, where many tourist attractions are found (Figure 4).
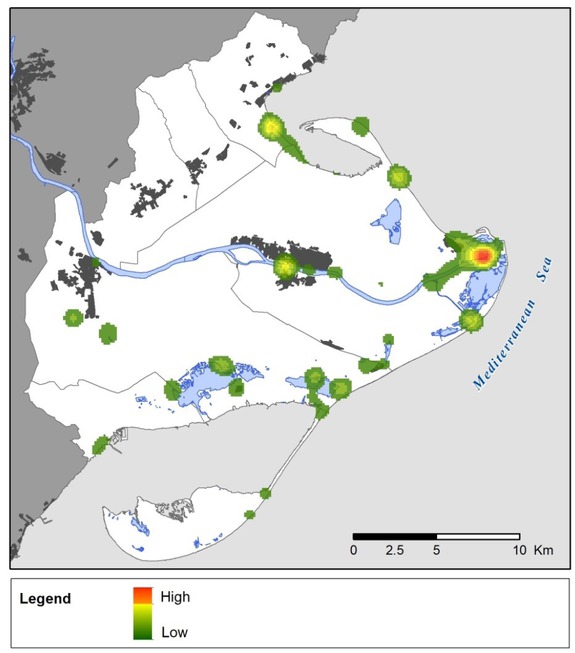
Kernel density of all photographs.
Kernel analysis by landscape type reveals the spatial distribution of landscape elements and interests analysed. The analysis was performed for all types of photographs except those depicting emotional reactions and disturbing elements because there were too few of these for analysis (Figure 5). Natural landscape densities mainly appear along the coast, around lagoons, at the mouth of the Ebro, and on certain beaches. Rural landscape densities, on the other hand, are scattered all over the Delta, including the hinterland, and mostly overlap rice cultures and irrigation infrastructures. Cultural landscape photographs are clearly clustered in four areas where the most important visitor landmarks are located, i.e. the Passador bridge, Montsià hermitage, sculptures at the mouth of the Ebro River, and the Fangar lighthouse. Urban landscape photographs are mainly clustered in three towns: Deltebre, Poble Nou, and Ampolla. Recreational and social situations are highly dispersed: some clusters are found on beaches, others appear in towns and at natural sites, and a few occur around restaurants. Finally, photographs of facilities and infrastructures are found near information centres or vantage points, especially if their architecture is distinctive (Figure 5).
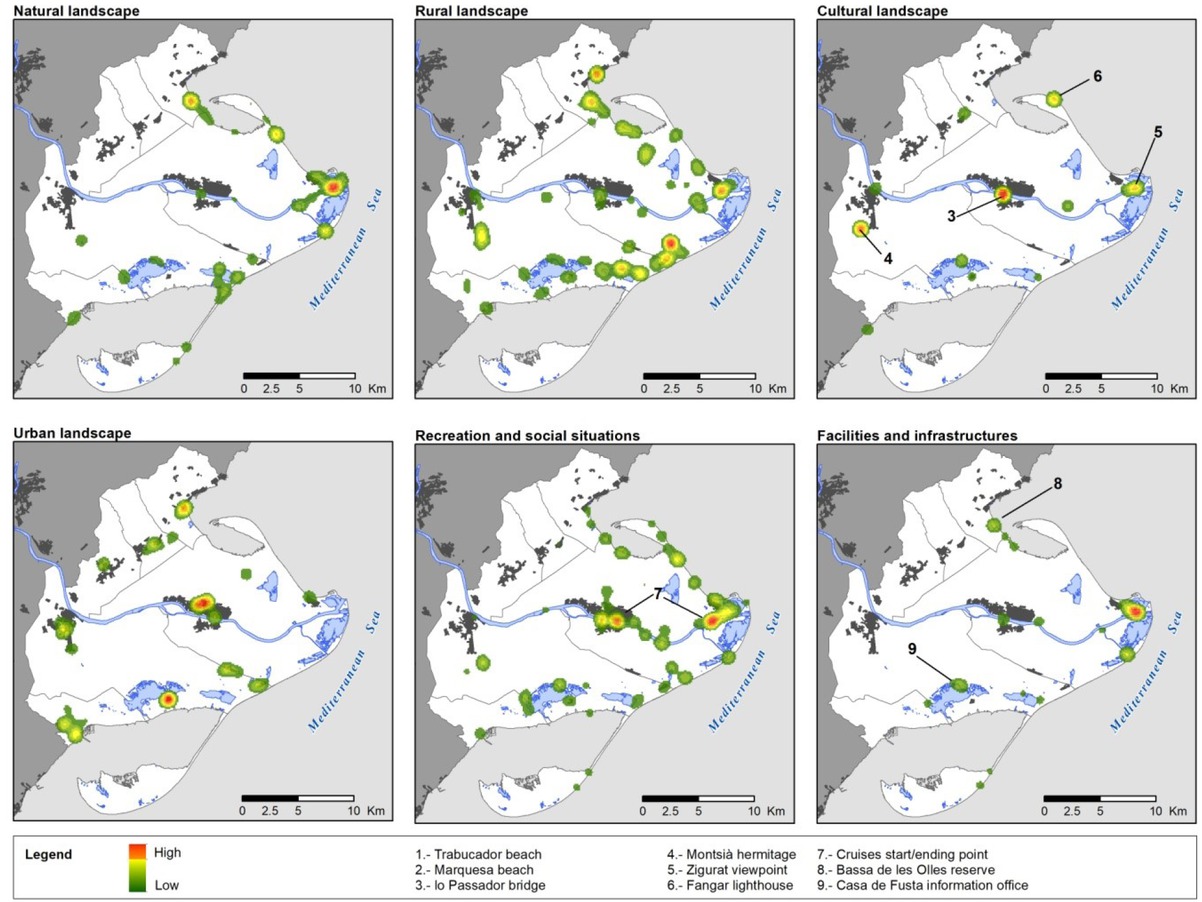
Kernel density of photographs by type.
5 Discussion
This study has three main goals: to conduct landscape characterisation, to adopt a thematic and spatial approach to pinpoint what attracts visitor’s attention to the landscape, and to analyse the suitability of using crowd-sourced sports photographs as a proxy for studying landscape. Given that landscape is multidimensional, our approach mainly focuses on its spatial dimension and on related topics.
5.1 Landscape characterisation
Since most (43.1%) of the photographs visitors upload to the Ebro Delta depict natural landscape, this kind of landscape is the one that attracts most attention among Wikiloc users. This is relevant because while natural land coverage (forests, shrubs, lagoons, marshes, salt lakes, beaches and dunes) accounts for almost 24% of the surface area, uploaded photographs of these features represent nearly twice that figure. In other words, less than a quarter of the Ebro Delta accounts for more than two fifths of the photographs.Most importantly, natural landscape is considered by users to be the most homogeneous type of landscape though it is not preeminent. Beaches and dune fields are the most photographed type of landscape (accounting for 15.3% of all natural landscape photographs) even though they represent barely 8% of the total area of the Delta and dune fields appear on only one beach along a strip of less than 1km. A higher disproportion is found with lagoons (which account for nearly 21% of all photographs taken in the Delta but just over 6% of the Delta surface) and especially with the Ebro River itself, for which the disproportion has a ratio of 10 (i.e. 22.3% of photographs account for 2.2% of the surface). Disregarding accessibility [8],we may say that natural landscapes attract people’s attention more vigorously than other kinds of landscape, which is why they are more photographed. Similar observations have been found in other areas. For example, [17] asserts that visitors to a protected area in Sweden were more attracted to natural features than to rural or social ones,while [20] observed in Slovakia that landscapes with a greater degree of wilderness (e.g. alpine and subalpine landscapes) were also the most photographed on social media. Other studies [e.g. 45, 46] also indicate a preference for natural landscapes. Lakes, lagoons, rivers and other water bodies in general are also reported as being particularly photographed [14] and aesthetically valuable [22].
Landscape characterisation reveals another significant bias between rural landscapes and the real world. Rural landscape is mainly made up of rice (65% of the Delta area) and other crops, as well as paths and irrigation infrastructures (6.2% of the area), which together make up the most prevalent landscape type and cover almost three quarters of the Delta area. However, the photographs taken of rural landscapes represent just 16% of all photographs. While rice is the agricultural feature that shapes the Delta’s character, only 6.9% of all photographs depict this crop. Other items related to rural landscapes, such as paths and irrigation channels, are photographed but account for just a small fraction of images. Some studies have reported that agricultural landscapes tend to be less photographed than other types [14, 20]. Indeed, analyses of crowdsourced photographs across Europe also show a lower density, if not an absence, of photographs in large agricultural areas [23]. This is interesting because many studies of public preferences [e.g. 6, 47, 48] have reported a liking for rural landscapes on the grounds of their economic value, perceived productivity, cultural heritage, ecological significance, or sustainability, etc. Some agrarian landscapes are particularly sought-after, especially when they include buildings with traditional architecture and show the visitor a coherent and unitary image [49]. Some elements, such as the presence of livestock or traditional farming systems, also seem to be greatly appreciated [36, 48]. The rural landscape of the Ebro Delta consists of large plots of rice fields scarcely sprinkled with trees between the fields and a dense network of paths and irrigation channels. Its general appearance is extremely homogeneous. Traditional farm buildings occasionally appear with a few new constructions. It is difficult to understand why Wikiloc users do not dedicate a greater proportion of their photographs to rural landscapes since such landscapes are considered to be a major tourist attraction [44] containing features that tend to be appreciated [47, 48, 49]. In fact, our analysis reveals that some photographs are tagged as depicting elements of rural landscape rather than the rural landscape itself (e.g. buildings with traditional architecture account for 0.47% of all photographs though they are classified as cultural landscape) but these are not very numerous. Some authors [36] assert that people may express different appreciation patterns for rural landscapes and that preferences are diversified. It may also be that sport users on Wikiloc do not follow the same patterns as other visitors even though the rural landscape of the Delta is clearly understood to be a tourist attraction [44]. It seems that Wikiloc users take the rural landscape for granted and, because of its homogeneity and unitary image, take fewer photographs of it than they do of other configurations (37.2% fewer than natural landscapes even though rural landscapes are three times as common). Landscape perception and appraisal processes are complex [16]. Other studies of photographs uploaded to social media [e.g. 15] have reported similar behaviours and the image perceived by the visitor should be understood by capturing both random attributes and holistic elements, as destinations are perceived multidimensionally [50].
Very few photographs (0.38%) show disturbing elements, while degraded sites appear to be absent in the area. However, natural park authorities are aware that many sites are in fact spoilt and make intensive efforts to clean up the area, especially where picnics are taken. At sites such as natural beaches, a no-cleaning policy is in operation and environmental awareness campaigns are the preferred environmental measures [43]. Beaches with stranded materials or litter that has washed in from the sea are common but these elements do not appear among the uploaded photographs (0.05%). Degraded sites and examples of human misbehaviour are rare in Wikiloc images (only one out of every 200 photographs). Indeed, all types of human activity appear to be underrepresented or even avoided. Other studies have also clearly shown that disturbing or negative photographs are underrepresented. For instance, [51] reports 7% of photographs with negative connotations, while [50] consider them to be negligible. According to [15], some destinations have a romantic ideal in which the presence of humans is understood to be a disturbance. People and their activities are often removed or avoided to make photographs appear ‘more scenic’, and landscapes are sometimes photographed as if they were uninhabited. Numerous photographs (10.3%) were tagged as being related to social or recreational situations. Apart from these ‘human-intended’ photographs, however, the presence of people in Wikiloc photographs is very low.
5.2 Spatial distribution
The spatial distribution of the photographs reveals certain movements and spatial patterns that may be understood to be behavioural [37]. Many studies report that the more appraised a landscape is, the more photographed it is [20, 28] and this idea is underscored by the large number of photographs [e.g. 13]. Some studies using photograph densities [22, 25] have detected clusters of certain landscape settings and stressed that photograph content analysis is paramount to understanding people’s preferences [26, 33]. Our findings suggest that photograph distribution, photograph density and photograph content –though related–seem to respond to different drivers.Most photographs (almost 68%) are taken on the edges of the Delta or by the banks of the river while some of the inland Delta areas, which are actually the core of the Delta, are almost devoid of photographs. This may suggest a preference for coastal or fluvial views. However, closer analysis reveals a clear correlation between official discovery trails and uploaded photographs since over half of all photographs (55%) are taken near these trails. This becomes more evident if we consider that the number and density of trails on the northern side of the Delta are greater than on the southern side and that the photographs taken on the northern side are more scattered than those on the southern side. This is confirmed by spatial analysis. As well as distribution, density is also important, as is shown by Kernel analysis of photographs clustered around tourist attractions (51.22% within 500m) and natural reserves (63.46%), most of which are linked by discovery trails.
Wikiloc users tend to photograph areas around paths and roads, especially on official discovery trails, and show a clear preference for tourist attractions and natural landscapes. However, spatial analysis shows that the main explanation for the distribution of the photographs is not their thematic attributes but their spatial location, since their appearance is explained by these official trails. This is logical if we remember that Wikiloc users are mainly sporty individuals who enjoy taking part in outdoor activities. Some authors [29] noticed similar patterns with other types of users. For example, 95% of photographs taken in a Dutch peri-urban area were shot within 100m of a road, while [8] considered accessibility to be a main issue when they analysed the spatial patterns of photographs. On the other hand, [15] found that visitors tend to take photographs of tourist attractions as if following a “checklist” to make their experience seem more rewarding. Our results show that the distribution of photographs is defined by official trails and that photograph clustering is defined by the user’s preferences. Users tend to take photographs of their movements around the Delta, which are defined by discovery trails, and that they take more photographs where they find interesting attractions. Users’ spatial patterns are strongly conditioned by discovery trails, so the photographs they take – and therefore the landscape they configure and appraise –are greatly influenced by their movements.
5.3 Factors that attract a visitor’s attention
A central question regarding landscape characterisation with social media is what aspect of the landscape draws the visitor’s attention [29]. In other words, why do visitors photograph one type of landscape but not another? A first approach suggests that photographs are taken of the most common, i.e. representative, landscapes. However, our study demonstrates that visitors to the Delta pay less attention to representative landscapes, i.e. rural ones (16% of the photographs), than to singular landscapes (i.e. natural ones). It could be argued that people taking in the sights wish to report outstanding landscapes, or at least to photograph landscape elements that are considered aesthetically valuable [e.g. 22]. However, most photographs analysed show only common elements in the landscape or places that have a certain meaning for the users themselves, such as a road junction, a signpost, people hiking, or bikes leaning against a wall. It turns out that most of the landscape types analysed are not representative but singular and, though they cannot be considered unpleasant, not all of them can be described as being outstandingly beautiful. When it comes to technical quality, most of the photograph slack any particular beauty or aesthetic purpose. A random sample of the photographs (n=50) reveals that 32% of them depict landmarks or outstanding sites or are taken with a clear aesthetic purpose. This means that 68% of the photographs are just ordinary and, whatever their content, their meaning cannot be easily typified. Why visitors took these photographs seems to be more related to their movements around the area and their emotional reactions, feelings and personal experience than to any landscape-driven purpose. As we have already stated, many photographs are related to the visitors’ spatial patterns and preferences. However, even if their content is clearly tagged, their meaning is difficult to understand and can be explained only by the visitors themselves.
Some authors [29] showed that visual attractiveness, though important, is not the only aspect that attracts a person’s attention. Studies of ecosystem services [e.g. 14, 26] suggest a clear attraction to places where recreation and relaxation can be enjoyed, and this is not necessarily related to aesthetics. Several studies [e.g. 33] have focused on the urban population and have reported that many users are less keen on natural landscapes than may be expected [25]. In this study we demonstrate the opposite (since 43.1% of the photographs depict natural landscapes). It appears that some users are drawn more to certain types of landscapes than to others. We believe this is because Wikiloc is intended for sports users, whose preferences and behaviours are different from those of other users. In fact, [26] reported that people find a wide range of landscapes attractive, and [36] also found that people have diverse preferences and enjoy different kinds of landscapes. Other studies based on photograph preferences [7, 16], also found diverse type of users, while [18] stressed the importance of the “emotional element” when taking photographs. Our results suggest that while sports users are not especially keen on landscape aesthetics, they are more interested in natural landscapes than any other type and that they prefer landscapes with fewer disturbances than degraded landscapes.
5.4 Crowdsourced sports websites as a data source
Social media photographs provide a huge amount of volunteered geographic information (VGI) that invites new approaches to landscape studies [29]. Unlike other procedures, such as Visitor Employed Photography (VEP), VGI methods do not rely on hypothetically stated landscape preferences and provide proxies that are far more diverse and numerous [e.g. 33]. The relative advantages and disadvantages of VEP and VGI have been the object of attention [14, 26] and include time, representativeness, engagement and, especially, bias [15, 17, 18]. Clearly, however,VGI is publicly available, free of charge and free of commitment and opens up a wide range of possibilities [24, 27, 51].
Sports-sharing website platforms such as Wikiloc offer several advantages over other popular crowdsourced sites such as Flickr and Panoramio regarding landscape characterization. Firstly, they cater for a narrower population than other platforms. Like other popular platforms, its users’ profiles are heterogeneous and impossible to classify [22, 26]. However, the fact that users upload their data onto an outdoor activities site shows that they are interested in those activities and so they have certain interests in common. This means they are members of a more homogeneous population than those on other popular crowd-sourced platforms. Secondly, in protected areas people who take part in outdoor activities are more common than others, so there is less bias in the sample population. Finally, just as popular platforms may broadly represent the general public [25], sports websites may broadly represent some uncharacterized population that is keen on outdoor activities and is a characterized segment of the general public.
6 Conclusions
This study presents a procedure for landscape characterization using photographs from Wikiloc, a crowdsourced platform for outdoor activities. Sports websites allow for a narrower and more homogeneous population analysis than other popular social media platforms because their users share a common interest in outdoor activities. In places such as protected areas, this type of platform represents the most common type of user well. As we show in this study of the Ebro Delta, this approach can be used to explain the landscape user’s preferences, determine intra-site visitor flow, and provide an alternative procedure for landscape characterisation for a certain group of users. Photograph analysis from popular crowdsourced platforms is praised for broadly representing common public patterns, while photographs from crowdsourced sports platforms are valuable because they represent a characterized population segment. Like other VGI data sources, photographs from crowdsourced sports platforms are free of charge and commitment, and provide a vast and interesting range of applications.
This case study of the Ebro Delta shows that visitors to the area tend to take photographs along their intra-site flow. Most photographs are taken close to discovery trails, and the prevalent landscape photographed is the one seen from these trails. People are more attracted to natural landscapes than to rural or degraded ones and do not show a strong interest in landscape aesthetics. We believe this responds to the most common user profile on Wikiloc. Although a higher density of photographs appears around natural sites and tourist attractions, photographs are scattered all over the Delta but mainly close to the discovery trails. Although the contents of the photographs can be clearly tagged, their meaning is difficult to interpret because they mainly respond to visitor experiences. Further studies may help to clarify this point. Detailed studies of the type of Wikiloc user (e.g. cyclist, hiker, etc.) may be valuable for a detailed landscape approach. A procedure for mapping landscape types through photographs is also still pending. This study is in line with an emerging range of studies on landscape and ecosystem services and has implications for visitor management in protected areas.
Acknowledgement
This work was supported by the Spanish Ministry of Science, Innovation and Universities (AEI / FEDER, UE) under Grant CHORA (contract number CSO2017-82411-P). The GRATET Research Group is funded by the Catalan Government under code 2009-SG744.
References
[1] Nogué J., Sala, P., Grau J., The Landscape Catalogues of Catalonia. Methodology. Landscape Observatory of Catalonia, 2016. http://www.catpaisatge.net/fitxers/publicacions/metodologia_catalegs/Documents_3_ENG.pdf10.1080/01426397.2017.1305344Suche in Google Scholar
[2] Tudor C., An Approach to Landscape Character Assessment. Natural England, 2014. https://assets.publishing.service.gov.uk/government/uploads/system/uploads/attachment_data/file/691184/landscape-character-assessment.pdfSuche in Google Scholar
[3] Franch-Pardo I., Napoletano B.M., Bocco G., Barrasa S., Cáncer-Pomar L., The Role of Geographical Landscape Studies for Sustainable Territorial Planning. Sustainability, 2017, 9, 1-23, doi:10.3390/su911212310.3390/su9112123Suche in Google Scholar
[4] Simensen T., Halvorsen R., Erikstad L., Methods for landscape characterization and mapping: A systematic review. Landusepol, 2018, 75, 557-569, doi:10.3390/su911212310.3390/su9112123Suche in Google Scholar
[5] Council of Europe. European Landscape Convention, 2000. https://rm.coe.int/CoERMPublicCommonSearchServices/DisplayDCTMContent?documentId=0900001680080621Suche in Google Scholar
[6] Howley P., Landscape aesthetics: assessing the general public’s preferences towards rural landscapes. Ecolecon, 2011, 72, 161-169, doi:10.1016/j.ecolecon.2011.09.02610.1016/j.ecolecon.2011.09.026Suche in Google Scholar
[7] Frank C., Fürst C., Koschke L., Witt A., Makeschin F., Assessment of landscape aesthetics – Validation of a landscape metrics-based assessment by visual estimation of the scenic beauty. Ecolind, 2013, 32, 222-231, http://dx.doi.org/10.1016/j.ecolind.2013.03.02610.1016/j.ecolind.2013.03.026Suche in Google Scholar
[8] van Zanten B., Verbug P.H., Scholte S.S.K., Tieskens K.F., Using choice modeling to map aesthetic values at a landscape scale: Lessons from a Dutch case study. Ecolecol, 2016, 130, 221-231, http://dx.doi.org/10.1016/j.ecolecon.2016.07.00810.1016/j.ecolecon.2016.07.008Suche in Google Scholar
[9] Bolòs M., Manual de Ciencia del Paisaje. Masson, Barcelona, 1992.Suche in Google Scholar
[10] Serrano Giné D., A Renewed Approach to the ABC Landscape Assessment Method: An Application to Muntanyes d’Ordal, Barcelona Metropolitan Area. Landscape Online, 2018, 56, 1-13, doi:10.3097/LO.20185610.3097/LO.201856Suche in Google Scholar
[11] Kaplan S., Kaplan R., Cognition and environment: Functioning in an uncertain world. Praeger, New York, 1984.Suche in Google Scholar
[12] Tveit M., Ode A., Fry G., Key concepts in a framework for analysing visual landscape character. Landscape Research 2007, 31, 3, 229-255, https://doi.org/10.1080/0142639060078326910.1080/01426390600783269Suche in Google Scholar
[13] Wood S. A., Guerry A.D., Silver J.M., Lacayo M., Using social media to quantify nature-based tourism and recreation. Scientific Reports, 2013, 3,1-7, doi: 10.1038/srep0297610.1038/srep02976Suche in Google Scholar PubMed PubMed Central
[14] Oteros-Rozas E., Martín-López B., Fagerholm N., Bieling C., Plieninger T., Using social media photos to explore the relation between cultural ecosystem services and landscape features across five European sites. Ecolind, 2018, Volume 94, Part 2, 74-86, http://dx.doi.org/10.1016/j.ecolind.2017.02.00910.1016/j.ecolind.2017.02.009Suche in Google Scholar
[15] Donaire A., Camprubí R., Galí, N., Tourist clusters from Flickr travel photography. Tmp, 2014, 11, 26-33, http://dx.doi.org/10.1016/j.tmp.2014.02.00310.1016/j.tmp.2014.02.003Suche in Google Scholar
[16] Kalivoda O., Vojar J., Skrivanová Z., Zahradník D., Consensus in landscape preference judgements: The effects of landscape visual aesthetic quality and respondents’ characteristics. Jenvman, 2014, 137, 36-44, http://dx.doi.org/10.1016/j.jenvman.2014.02.00910.1016/j.jenvman.2014.02.009Suche in Google Scholar PubMed
[17] Hansen A.S., Testing visitor produced pictures as a management strategy to study visitor experience qualities – A Swedish marine case study. Jort, 2016, 14, 52-64, http://dx.doi.org/10.1016/j.jort.2016.05.00110.1016/j.jort.2016.05.001Suche in Google Scholar
[18] Balomenou N., Garrod B., Using Volunteer-Employed Photography to Inform Tourism Planning Decisions: A Case Study of St David’s Peninsula, Wales. Tourman, 2014, 44, 1-53, https://doi.org/10.1016/j.tourman.2014.02.01510.1016/j.tourman.2014.02.015Suche in Google Scholar
[19] Bevk T., Martínez N.M., Brereton P., Laloševi M., Peri M., Iterative Digital Photo-based Assessment for Rural Landscape Perception: A Small Experiment from County Wicklow, Ireland. Journal of Digital Landscape Architecture, 2017, 2,18-27, doi:10.14627/53762900310.14627/537629003Suche in Google Scholar
[20] Lieskovský J., Rusňák T., Klimantová A., Izsóff M., Gašparovičová P., Appreciation of landscape aesthetic values in Slovakia assessed by social media photographs. Open Geosci, 2017, 9, 593599, https://doi.org/10.1515/geo-2017-004410.1515/geo-2017-0044Suche in Google Scholar
[21] Hadi A.A., Mizuuchi Y., Honjo T., Furuya K., Identifying Impressive Landscape Objects Based on Geotagged Photographs (A Case Study of Self-Portraits and Ordinary Photos). Jitode, 2017, 5, 2, 73-80, DOI: 10.21776/ub.jitode.2017.005.02.0210.21776/ub.jitode.2017.005.02.02Suche in Google Scholar
[22] Tenerelli P., Demšar U., and Luque S., Crowdsourcing indicators for cultural ecosystem services: a geographically weighted approach for mountain landscapes. Ecoind, 2016, 64: 237-248, http://dx.doi.org/10.1016/j.ecolind.2015.12.04210.1016/j.ecolind.2015.12.042Suche in Google Scholar
[23] van Zanten, B., van Berkel, D.B., Meentemeyer, R.K., Smith, J.W., Tieskens, K.F., Verburg, P.H. Continental-scale quantification of landscape values using social media data. Proceedings of the National Academy of Sciences of the United States of America, 2016, 113, 46, 12974-12979, www.pnas.org/lookup/suppl/doi/10.1073/pnas.1614158113.10.1073/pnas.1614158113Suche in Google Scholar PubMed PubMed Central
[24] Hochmair H.H., Zielstra D., Analyzing user contribution patterns of drone pictures to the Dronestagram photo sharing portal. Journal of Spatial Science, 2015, 60,1, 79-98, https://doi.org/10.1080/14498596.2015.96934010.1080/14498596.2015.969340Suche in Google Scholar
[25] Lagenmeyer J., Calgani F., Baró F., Mapping the intangible: Using geolocated social media data to examine landscape aesthetics. Landusepol, 2018, 77, 542-552, https://doi.org/10.1016/j.landusepol.2018.05.04910.1016/j.landusepol.2018.05.049Suche in Google Scholar
[26] van Berkel D., Tabrizian P., Dorning M.A., Smart L., Newcomb D., Mehaffey M., Neale A., Meentemeyer R.K., Quantifying the visual-sensory landscape qualities that contribute to cultural ecosystem services using social media and LiDAR. Ecoser, 2018, 31,326-335, https://doi.org/10.1016/j.ecoser.2018.03.02210.1016/j.ecoser.2018.03.022Suche in Google Scholar PubMed PubMed Central
[27] Goodchild M., Citizens as voluntary sensors: spatial data infrastructure in the world of web 2.0. IJSDIR, 2007, 2, 24-32.Suche in Google Scholar
[28] Sugimoto K., Analysis of Scenic Perception and its Spatial Tendency: Using Digital Cameras, GPS loggers, and GIS. Sbspro, 2011, 21, 43-52, doi:10.1016/j.sbspro.2011.07.01010.1016/j.sbspro.2011.07.010Suche in Google Scholar
[29] Tieskens K. F., van Zanten B.T., Schulp C.J.E., Verburg P.H., Aesthetic appreciation of the cultural landscape through social media: An analysis of revealed preference in the Dutch river landscape. Landurbplan, 2018, 177, 128-137, https://doi.org/10.1016/j.landurbplan.2018.05.00210.1016/j.landurbplan.2018.05.002Suche in Google Scholar
[30] Ginzarly M., Pereira Roders A., Teller A., Mapping historic urban landscape values through social media. Jculher, 2019, 36,1-11, https://doi.org/10.1016/j.culher.2018.10.00210.1016/j.culher.2018.10.002Suche in Google Scholar
[31] Hu Y., Manikonda S., Kambhampti S., What we Instagram: A First Analysis of Instagram Photo Content and User Types. Proceedings of the 8th international Conference on Weblogs and Social Media, ICWSM 2014, 595-598, Ann Arbor, United States, 1-4 June 2014Suche in Google Scholar
[32] Heikinheimo V., Di Minin E., Tenkanen H., Hausmann A., Erkkonen J., Toivonen T., User-Generated Geographic Information for Visitor Monitoring in a National Park: A Comparison of Social Media Data and Visitor Survey. ISPRS Int.J.Geo-Inf, 2017, 6, 85, 2-14, doi:10.3390/ijgi6030085.10.3390/ijgi6030085Suche in Google Scholar
[33] Richards D.R., Tunçer B., Using image recognition to automate assessment of cultural ecosystem services from social media photographs. Ecoser, 2018, 31, 318-325, http://dx.doi.org/10.1016/j.ecoser.2017.09.00410.1016/j.ecoser.2017.09.004Suche in Google Scholar
[34] Richards D., Friess A., A rapid indicator of cultural ecosystem service usage at a fine spatial scale: Content analysis of social media photographs. Ecoind, 2015, 53, 187-195, http://dx.doi.org/10.1016/j.ecolind.2015.01.03410.1016/j.ecolind.2015.01.034Suche in Google Scholar
[35] Alexa, 2019. http://www.alexa.comSuche in Google Scholar
[36] Almeida M., Loupa-Ramos I., Menezes H., Carvalho-Ribeiro S., Guiomar N., Pinto-Correia T., Urban population looking for rural landscapes: Different appreciation patterns identified in Southern Europe. Landusepol, 2016, 53, 44-55 http://dx.doi.org/10.1016/j.landusepol.2015.09.02510.1016/j.landusepol.2015.09.025Suche in Google Scholar
[37] Campelo M.B., Nogueira R.M., Comparing webshare services to assess mountain bike use in protected areas. Jort, 2016, 15, 82-88, https://doi.org/10.1016/j.jort.2016.08.00110.1016/j.jort.2016.08.001Suche in Google Scholar
[38] Norman P., Pickering C.M., Using volunteered geographic information to assess park visitation: Comparing three on-line platforms. Apgeog, 2017, 89,163-172, https://doi.org/10.1016/j.apgeog.2017.11.00110.1016/j.apgeog.2017.11.001Suche in Google Scholar
[39] Wikiloc, 2019. https://www.wikiloc.comSuche in Google Scholar
[40] Zielstra D., Hochmair H.H., Positional accuracy analysis of Flickr and Panoramio images for selected world regions. Journal of Spatial Science, 2013, 58, 2, 251-273, https://doi.org/10.1080/14498596.2013.80133110.1080/14498596.2013.801331Suche in Google Scholar
[41] Silverman B., Density estimation for statistics and data analysis. Chapman and Hall, New York, 1986.Suche in Google Scholar
[42] CREAF. Land cover map of Catalonia, 2013. https://www.creaf.uab.es/mcsc/usa/index.htmSuche in Google Scholar
[43] Generalitat de Catalunya: Pla de Gestió del Parc Natural del Delta de l’Ebre, 2017 http://parcsnaturals.gencat.cat/ca/delta-ebreSuche in Google Scholar
[44] Tripadvisor. 2019. https://www.tripadvisor.comSuche in Google Scholar
[45] D’Antonio A., Monz Ch., Newman P., Lawson S., Taff D., Enhancing the utility of visitor impact assessment in parks and protected areas: A combined social-ecological approach. Jenvman, 2013, 124, 72-81, https://doi.org/10.1016/j.jenvman.2013.03.03610.1016/j.jenvman.2013.03.036Suche in Google Scholar PubMed
[46] Svobodova K., Sklenicka P., Vojar J., How does the representation rate of features in a landscape affect visual preferences? A case study from a post-mining landscape. International Journal of Mining, Reclamation and Environment, 2015, 29, 4, 266-276, DOI: 10.1080/17480930.2013.87325810.1080/17480930.2013.873258Suche in Google Scholar
[47] Sayadi S., González-Roa M. C., Calatrava-Requena J., Public preferences for landscape features: The case of agricultural landscape in mountainous Mediterranean areas. Landsusepol, 2009, 26, 2, 334-344, doi:10.1016/j.landusepol.2008.04.00310.1016/j.landusepol.2008.04.003Suche in Google Scholar
[48] van Zanten B., Verburg P.H., Koetse M.J., van Beukering P.J.H., Preferences for European agrarian landscapes: A meta-analysis of case studies. Landurbanplan, 2014, 132, 89-101, http://dx.doi.org/10.1016/j.landurbplan.2014.08.01210.1016/j.landurbplan.2014.08.012Suche in Google Scholar
[49] Tempesta T., The perception of agrarian historical landscapes: A study of the Veneto plain in Italy. Landurbanplan, 2010, 97, 258-272, doi:10.1016/j.landurbplan.2010.06.01010.1016/j.landurbplan.2010.06.010Suche in Google Scholar
[50] MacKay K.J., Couldwell C.M., Using Visitor-Employed Photography to Investigate Destination Image. Journal of Travel Research, 2004, 42, 390-396, DOI: 10.1177/004728750426303510.1177/0047287504263035Suche in Google Scholar
[51] Taylor J.G., Czarnowski K.J., Sexton N.R., Flick S., The Importance of Water to Rocky Mountain National Park Visitors: An Adaptation of Visitor-Employed Photography to Natural Resources Management. Journal of Applied Recreation Research, 1995, 20(1): 61-85, https://doi.org/10.1177/004728750426303510.1177/0047287504263035Suche in Google Scholar
[52] Kitchin R., Big Data and human geography: opportunities, challenges and risks. Dialogues in Human Geography, 2013, 3, 3, 262-267, https://doi.org/10.1177/204382061351338810.1177/2043820613513388Suche in Google Scholar
© 2019 A. Àvila Callau et al., published by De Gruyter
This work is licensed under the Creative Commons Attribution 4.0 Public License.
Artikel in diesem Heft
- Regular Articles
- 2D Seismic Interpretation of the Meyal Area, Northern Potwar Deform Zone, Potwar Basin, Pakistan
- A new method of lithologic identification and distribution characteristics of fine - grained sediments: A case study in southwest of Ordos Basin, China
- Modified Gompertz sigmoidal model removing fine-ending of grain-size distribution
- Diagenesis and its influence on reservoir quality and oil-water relative permeability: A case study in the Yanchang Formation Chang 8 tight sandstone oil reservoir, Ordos Basin, China
- Evaluation of AHRS algorithms for Foot-Mounted Inertial-based Indoor Navigation Systems
- Identification and evaluation of land use vulnerability in a coal mining area under the coupled human-environment
- Hydrocarbon Generation Potential of Chia Gara Formation in Three Selected Wells, Northern Iraq
- Source Analysis of Silicon and Uranium in uranium-rich shale in the Xiuwu Basin, Southern China
- Lithologic heterogeneity of lacustrine shale and its geological significance for shale hydrocarbon-a case study of Zhangjiatan Shale
- Characterization of soil permeability in the former Lake Texcoco, Mexico
- Detrital zircon trace elements from the Mesozoic Jiyuan Basin, central China and its implication on tectonic transition of the Qinling Orogenic Belt
- Turkey OpenStreetMap Dataset - Spatial Analysis of Development and Growth Proxies
- Morphological Changes of the Lower Ping and Chao Phraya Rivers, North and Central Thailand: Flood and Coastal Equilibrium Analyses
- Landscape Transformations in Rapidly Developing Peri-urban Areas of Accra, Ghana: Results of 30 years
- Division of shale sequences and prediction of the favorable shale gas intervals: an example of the Lower Cambrian of Yangtze Region in Xiuwu Basin
- Fractal characteristics of nanopores in lacustrine shales of the Triassic Yanchang Formation, Ordos Basin, NW China
- Selected components of geological structures and numerical modelling of slope stability
- Spatial data quality and uncertainty publication patterns and trends by bibliometric analysis
- Application of microstructure classification for the assessment of the variability of geological-engineering and pore space properties in clay soils
- Shear failure modes and AE characteristics of sandstone and marble fractures
- Ice Age theory: a correspondence between Milutin Milanković and Vojislav Mišković
- Are Serbian tourists worried? The effect of psychological factors on tourists’ behavior based on the perceived risk
- Real-Time Map Matching: A New Algorithm Integrating Spatio-Temporal Proximity and Improved Weighted Circle
- Characteristics and hysteresis of saturated-unsaturated seepage of soil landslides in the Three Gorges Reservoir Area, China
- Petrographical and geophysical investigation of the Ecca Group between Fort Beaufort and Grahamstown, in the Eastern Cape Province, South Africa
- Ecological risk assessment of geohazards in Natural World Heritage Sites: an empirical analysis of Bogda, Tianshan
- Integrated Subsurface Temperature Modeling beneath Mt. Lawu and Mt. Muriah in The Northeast Java Basin, Indonesia
- Go social for your own safety! Review of social networks use on natural disasters – case studies from worldwide
- Forestry Aridity Index in Vojvodina, North Serbia
- Natural Disasters vs Hotel Industry Resilience: An Exploratory Study among Hotel Managers from Europe
- Using Monarch Butterfly Optimization to Solve the Emergency Vehicle Routing Problem with Relief Materials in Sudden Disasters
- Potential influence of meteorological variables on forest fire risk in Serbia during the period 2000-2017
- Controlling factors on the geochemistry of Al-Shuaiba and Al-Mejarma coastal lagoons, Red Sea, Saudi Arabia
- The Influence of Kaolinite - Illite toward mechanical properties of Claystone
- Two critical books in the history of loess investigation: ‘Charakteristik der Felsarten’ by Karl Caesar von Leonhard and ‘Principles of Geology’ by Charles Lyell
- The Mechanism and Control Technology of Strong Strata Behavior in Extra-Thick Coal Seam Mining Influenced by Overlying Coal Pillar
- Shared Aerial Drone Videos — Prospects and Problems for Volunteered Geographic Information Research
- Stable isotopes of C and H in methane fermentation of agriculture substrates at different temperature conditions
- Prediction of Compression and Swelling Index Parameters of Quaternary Sediments from Index Tests at Mersin District
- Detection of old scattered windthrow using low cost resources. The case of Storm Xynthia in the Vosges Mountains, 28 February 2010
- Remediation of Copper and Zinc from wastewater by modified clay in Asir region southwest of Saudi Arabia
- Sedimentary facies of Paleogene lacustrine dolomicrite and implications for petroleum reservoirs in the southern Qianjiang Depression, China
- Correlation between ore particle flow pattern and velocity field through multiple drawpoints under the influence of a flexible barrier
- Atmospheric refractivity estimation from AIS signal power using the quantum-behaved particle swarm optimization algorithm
- A geophysical and hydro physico-chemical study of the contaminant impact of a solid waste landfill (swl) in King Williams’ Town, Eastern Cape, South Africa
- Landscape characterization using photographs from crowdsourced platforms: content analysis of social media photographs
- A Study on Transient Electromagnetic Interpretation Method Based on the Seismic Wave Impedance Inversion Model
- Stratigraphy of Architectural Elements of a Buried Monogenetic Volcanic System
- Variable secondary porosity modeling of carbonate rocks based on μ-CT images
- Traditional versus modern settlement on torrential alluvial fans considering the danger of debris flows: a case study of the Upper Sava Valley (NW Slovenia)
- The Influence of Gangue Particle size and Gangue Feeding Rate on Safety and Service Life of the Suspended Buffer’s Spring
- Research on the Transition Section Length of the Mixed Workface Using Gangue Backfilling Method and Caving Method
- Rainfall erosivity and extreme precipitation in the Pannonian basin
- Structure of the Sediment and Crust in the Northeast North China Craton from Improved Sequential H-k Stacking Method
- Planning Activities Improvements Responding Local Interests Change through Participatory Approach
- GIS-based landslide susceptibility mapping using bivariate statistical methods in North-western Tunisia
- Uncertainty based multi-step seismic analysis for near-surface imaging
- Deformation monitoring and prediction for residential areas in the Panji mining area based on an InSAR time series analysis and the GM-SVR model
- Statistical and expert-based landslide susceptibility modeling on a national scale applied to North Macedonia
- Natural hazards and their impact on rural settlements in NE Romania – A cartographical approach
- Rock fracture initiation and propagation by mechanical and hydraulic impact
- Influence of Rapid Transit on Accessibility Pattern and Economic Linkage at Urban Agglomeration Scale in China
- Near Infrared Spectroscopic Study of Trioctahedral Chlorites and Its Remote Sensing Application
- Problems with collapsible soils: Particle types and inter-particle bonding
- Unification of data from various seismic catalogues to study seismic activity in the Carpathians Mountain arc
- Quality assessment of DEM derived from topographic maps for geomorphometric purposes
- Remote Sensing Monitoring of Soil Moisture in the Daliuta Coal Mine Based on SPOT 5/6 and Worldview-2
- Utilizing Maximum Entropy Spectral Analysis (MESA) to identify Milankovitch cycles in Lower Member of Miocene Zhujiang Formation in north slope of Baiyun Sag, Pearl River Mouth Basin, South China Sea
- Stability Analysis of a Slurry Trench in Cohesive-Frictional Soils
- Integrating Landsat 7 and 8 data to improve basalt formation classification: A case study at Buon Ma Thuot region, Central Highland, Vietnam
- Assessment of the hydrocarbon potentiality of the Late Jurassic formations of NW Iraq: A case study based on TOC and Rock-Eval pyrolysis in selected oil-wells
- Rare earth element geochemistry of sediments from the southern Okinawa Trough since 3 ka: Implications for river-sea processes and sediment source
- Effect of gas adsorption-induced pore radius and effective stress on shale gas permeability in slip flow: New Insights
- Development of the Narva-Jõesuu beach, mineral composition of beach deposits and destruction of the pier, southeastern coast of the Gulf of Finland
- Selecting fracturing interval for the exploitation of tight oil reservoirs from logs: a case study
- A comprehensive scheme for lithological mapping using Sentinel-2A and ASTER GDEM in weathered and vegetated coastal zone, Southern China
- Sedimentary model of K-Successions Sandstones in H21 Area of Huizhou Depression, Pearl River Mouth Basin, South China Sea
- A non-uniform dip slip formula to calculate the coseismic deformation: Case study of Tohoku Mw9.0 Earthquake
- Decision trees in environmental justice research — a case study on the floods of 2001 and 2010 in Hungary
- The Impacts of Climate Change on Maximum Daily Discharge in the Payab Jamash Watershed, Iran
- Mass tourism in protected areas – underestimated threat? Polish National Parks case study
- Decadal variations of total organic carbon production in the inner-shelf of the South China Sea and East China Sea
- Hydrogeothermal potentials of Rogozna mountain and possibility of their valorization
- Postglacial talus slope development imaged by the ERT method: comparison of slopes from SW Spitsbergen, Norway and Tatra Mountains, Poland
- Seismotectonics of Malatya Fault, Eastern Turkey
- Investigating of soil features and landslide risk in Western-Atakent (İstanbul) using resistivity, MASW, Microtremor and boreholes methods
- Assessment of Aquifer Vulnerability Using Integrated Geophysical Approach in Weathered Terrains of South China
- An integrated analysis of mineralogical and microstructural characteristics and petrophysical properties of carbonate rocks in the lower Indus Basin, Pakistan
- Applicability of Hydrological Models for Flash Flood Simulation in Small Catchments of Hilly Area in China
- Heterogeneity analysis of shale reservoir based on multi-stage pumping data