Effect of chloride concentration on the corrosion resistance of pure Zn metal in a 0.0626 M H2SO4 solution
-
Roland Tolulope Loto


Abstract
The aftermath of Cl− anion concentration reactions on the corrosion resistance of pure Zn metal in 0.0625 M H2SO4 was examined by potentiodynamic polarization, optical representations, scanning electron image analysis, energy dispersive X-ray (EDX) spectroscopy, open-circuit potential analysis, X-ray diffractometry, weight loss method and X-ray fluorescence. The results show that the degradation of Zn increased with an increase in the chloride concentration from 4.089 and 0.218 mm/year to 10.085 and 4.015 mm/year (polarization and weight loss). The corrosion potential at 0.0625 M H2SO4 to 0.0625 M H2SO4/0.5% NaCl concentration displayed minimal variation (−1.535 to −1.519 V), whereas a significant shift was observed for the plots at 0.0625 M H2SO4/1% NaCl and 0.0625 M H2SO4/2% NaCl (−1.384 and −0.932 V). The weight loss plot at all Cl− anion concentrations displayed an ordered decrease in the corrosion rate analogous to exposure times. The scanning electron microscopic images of Zn in 0.0625 M H2SO4/2% NaCl solution showed significant deterioration and corrosion pits. The image at 0.0625 M H2SO4 solution revealed limited localized and general surface deterioration, while the corresponding EDX data depict the presence of S. The Zn open-circuit potential plot from a 0.0625 M H2SO4 solution was relatively electropositive compared to the plot from a 0.0625 M H2SO4/2% NaCl solution. Both plots exhibited limited reactive-inert transition properties and attained relative thermodynamic equilibrium after 600 s of exposure with final corrosion potentials of −0.91 and −0.97 V at 7,200 s. Zn was the only crystallographic phase identified on its surface before corrosion, whereas ZnS, ZnFes, ZnMnS, ZnMnFeS, and ZnMg4 corrosion products were identified after corrosion.
1 Introduction
Ferrous alloys such as stainless steels, carbon steels, tool steels, low-grade alloys, etc., are the most applicable materials currently in use worldwide coupled with ongoing research to improve their engineering properties for optimal application in astringent environments [1,2,3,4,5,6]. However, they are prone to corrosion leading to economic and financial loss in a variety of industries [7,8,9]. Protection of steel parts, structures, columns, fittings, pipes and components is of utmost economic importance [10,11]. One of the most cost-effective, versatile, resilient and proven methods for the protection of steel is by Zn coatings. Zn offers significant cost-effective protection against metallic corrosion in atmospheric environments through cold-dip galvanizing, hot-dip galvanizing, galvannealing, electro-galvanizing, continuous-line galvanizing, zinc plating and spraying, mechanical plating and zinc-pigment paints [12]. Zn is the fourth most utilized metal globally with about 50% of Zn production applied in Zn galvanizing processes [13]. It represents the 23rd most available material in the earth’s encrustation at 0.013%. The most common application of Zn is its usage as an anti-corrosion coating [14,15]. Other applications include white pigmentation in paints, catalyst in rubber production, manufacture of protective agents for rubber polymers and plastics, production of photocopying materials [16,17], propellant in model rockets [18], and corrosion protection for roofing sheets and petrochemical infrastructure [19,20]. The exceptional corrosion resistance of Zn is due to the evolution of a barrier coating that stifles further corrosion of the Zn surface by its exposure to atmospheric elements such as fog, rain, gases, dew, soot, snow, humidity and reactive dust. The reaction of Zn with O2 results in the formation of a thin, corrosion-resistant oxide layer that further reacts with moisture leading to the formation of zinc hydroxide and, subsequently, resilient and chemically stable zinc carbonate after reacting with CO2 [21]. Zn corrosion is influenced by the environment in which it is applied [22,23]. Salt composition within marine conditions significantly influences Zn corrosion [24]. Nevertheless, coatings of Zn have been applied for generations to protect steel from corrosion with some coatings still very effective after a century. Zn and metallic parts coated with Zn exhibits substantially extended operational lifespan compared to some other alloys exposed to the atmosphere.
2 Experimental methods
2.1 Materials and preparation
Square-shaped Zn sheets with surface proportions of 100 mm × 100 mm × 50 mm (length, breadth and thickness) were split into seven work samples with dimensions of 1 cm × 2 cm using a manual hand tool for weight loss measurement, potentiostatic analysis and open-circuit potential evaluation. Elemental analysis of the Zn work piece was performed with a PhenomWorld high-resolution electron microscope at the Covenant University Central Instrumentation Research Facility, Ota, Ogun State, Nigeria. The energy dispersive X-ray (EDX) microanalysis, represented in Figure 1, shows the Zn spectrum image with wt% compositions of 100% metallic Zn. Cu cables were affixed to Zn workpieces with soft solder before being enmeshed pre-solidified acrylic paste. The exterior area of the Zn workpiece was graded with SiC sheets (60–1,500 grits), brightened with a 3 µm diamond mixture and washed with de-mineralized H2O and dimethyl ketone. And 0.0625 M H2SO4 solution was concocted from standard class H2SO4 acid solution. The recrystallized NaCl at 0.0625, 0.125, 0.25, 0.5 and 1% was added to the acid solution. The electrochemical and weight measuring instruments were checked for any likelihood of systematic anomalies. The performance of both instruments is limited by their precision and accuracy. Instrument calibration, hardware test and test for reproducibility of consistent results were done for the instruments.

EDS spectrum for Zn workpieces.
2.2 Potentiodynamic polarization and open-circuit potential evaluation
Corrosion kinetics was evaluated by potentiodynamic polarization while corrosion thermodynamics was determined by open-circuit potential evaluation. Both tests were done at 308 K (ambient temperature) by adopting a Digi-Ivy 2311 potentiostatic apparatus. The apparatus, which consists of a triple cord electrode (Zn workpiece electrode, Ag/AgCl threshold electrode and Pt cord counter electrode), was networked to a laptop computer. Polarization data lines were drawn at a plot progression of 0.0015 V/s initiating at −1.55 to +1.1 V. The corrosion potential, C p (V), and the corrosion current density, C j (A/cm2), values were acquired by Tafel computation. The corrosion rate, C r (mm/year), is quantified from the following numerical values:
where E w is the equivalent weight (g) of Zn, 0.00327 is the corrosion constant, and D is the density (g/cm3). The polarization resistance, P rt (Ω), is determined from the numerical formula:
where B a and B c are anodic and cathodic Tafel slopes (V/dec).
2.3 Weight loss measurement
The Zn workpieces were placed in 200 mL of a 0.0625 M H2SO4 solution at NaCl concentrations of 0.0625, 0.125, 0.25, 0.5, 1 and 2% for 168 h of exposure. The weight measurement of Zn was done once in 24 h. The corrosion rate, C RT (mm/year), is calculated as:
where W L is the weight loss (g), D is the density (g/cm3), t is the time (h), A is the exposed surface area of the Zn workpiece (cm2) and 87.6 is a constant for the corrosion rate.
2.4 Scanning electron microscopy (SEM), EDX and optical microscopy analysis
The Zn workpieces were suspended for 240 h in the acid-chloride solution. SEM images of Zn were obtained using a PhenomWorld scanning electron microscope prior to and following the corrosion test. Optical illustrations of Zn workpieces prior to and following the weight loss test at specific NaCl concentrations in the acid media were obtained and studied with an Omax trinocular metallurgical microscope and USB digital microscope after weight loss evaluation.
2.5 X-ray diffractometry (XRD) and X-ray fluorescence (XRF)
XRD data and the information on the component phases, compounds, impurities, precipitates, etc., on Zn workpieces from weight loss tests at a specific NaCl concentration, were obtained after scanning with a Rigaku D/Max-lllC X-ray diffractometer at a sweep rate of 2°/min within 2–50° at ambient temperature with a Cu K-alpha radiation established at 40 kV and 20 mA in 2θ. The diffraction results (correlation magnitude) received were compared to threshold results obtained from the mineral powder diffraction folder (ICDD) containing the threshold information of over 3,000 minerals. The composition of the Zn surface and its corroded specimens was evaluated using a Lab-X3500 Benchtop XRF Analyser with detection limits at ppm to 100%. The Lab-X 3500 instruments are fitted with Oxford Instruments Analytical Software Package, ASP3500, and pre-defined calibrations.
3 Results and discussion
3.1 Potentiodynamic polarization and optical microscopy characterization
Potentiodynamic polarization plots produced from the Zn reaction in 0.0625 M H2SO4, 0.0625 M H2SO4/0.0625% NaCl, 0.0625 M H2SO4/0.125% NaCl, 0.0625 M H2SO4/0.25% NaCl, 0.0625 M H2SO4/0.5% NaCl, 0.0625 M H2SO4/1% NaCl and 0.0625 M H2SO4/2% NaCl solutions are represented in Figure 2. Table 1 shows the potentiodynamic data retrieved from the plots. Figure 3a–d shows the optical images of the Zn surface after the polarization test. The plots at 0.0625 M H2SO4 to 0.0625 M H2SO4/0.5% NaCl concentrations displayed minimal variation in corrosion potentials, i.e., from −1.535 to −1.519 V compared to the plots at 0.0625 M H2SO4/1% NaCl and 0.0625 M H2SO4/2% NaCl solutions exhibiting corrosion potential values of −1.384 and −0.932 V. This variation is due to the effect of the Cl− anion concentration within the electrolyte, which influenced the redox reaction behavior of Zn. Zn corrodes relatively slower at a low Cl− anion concentration due to the evolution of a protective oxide on its surface [25]. The Cl− anions within the acid electrolyte diffuse through the protective oxide film, causing corrosion of Zn [26,27]. Zn corrosion in acid chloride solutions occurs through two processes [28]. The cathodic half-cell is the reduction of O2 and evolution of H2 gas:

A potentiodynamic polarization plot of Zn in a 0.0625 M H2SO4 to 0.0625 M H2SO4/2% NaCl solution.
Potentiodynamic polarization data for Zn corrosion in a 0.0625 M H2SO4/2% NaCl solution
| Sample | NaCl concentration (%) | Corrosion rate, C R (mm/year) | Corrosion current, I (A) | Corrosion current density, J (A/cm2) | Corrosion potential, C P (V) | Polarization resistance, R p (Ω) | Cathodic Tafel slope, B c (V/dec) | Anodic Tafel slope, B a (V/dec) |
|---|---|---|---|---|---|---|---|---|
| A | 0 | 4.089 | 3.48 × 10⁻⁴ | 2.74 × 10⁻⁴ | −1.535 | 73.76 | −4.399 | 8.414 |
| B | 0.0625 | 4.118 | 3.51 × 10⁻⁴ | 2.76 × 10⁻⁴ | −1.547 | 73.44 | −5.984 | 1.221 |
| C | 0.125 | 4.127 | 3.52 × 10⁻⁴ | 2.77 × 10⁻⁴ | −1.547 | 73.08 | −4.546 | 15.810 |
| D | 0.25 | 5.259 | 4.48 × 10⁻⁴ | 3.53 × 10⁻⁴ | −1.540 | 61.60 | −4.627 | 15.400 |
| E | 0.5 | 6.515 | 5.55 × 10⁻⁴ | 4.37 × 10⁻⁴ | −1.519 | 48.54 | −2.568 | 14.020 |
| F | 1 | 7.398 | 6.30 × 10⁻⁴ | 4.96 × 10⁻⁴ | −1.384 | 39.70 | −3.334 | 13.250 |
| G | 2 | 10.085 | 8.59 × 10⁻⁴ | 6.77 × 10⁻⁴ | −0.932 | 29.90 | −4.495 | 11.860 |

Optical representations of Zn surfaces: (a) preceding corrosion, (b) following corrosion in 0.0625 M H2SO4, (c) following corrosion in 0.0625 M H2SO4/0.0625% NaCl and (d) following corrosion in 0.0625 M H2SO4/2% NaCl.
The corresponding anodic half-cell reaction is the oxidation of Zn:
Zn2+ reacts with H+ ions and SO4 2− ions according to the following equation:
The Zn2+ and 2OH− ions react to produce Zn(OH)2 [29]:
The Cl− anions transport to anodic sites resulting in the formation of Zn5(OH)8Cl2:
The polarization plots at 0.0625 M H2SO4 to 0.0625 MH2SO4/0.125% NaCl concentrations displayed a cathodic potential shift due to the collapse of the inert oxide [30,31], whereas from 0.0625 M H2SO4/0.25% NaCl to 0.0625 M H2SO4/2% NaCl concentrations, the corrosion potential shift was anodic. Beyond a 0.0625 M H2SO4/0.125% NaCl concentration, the reaction effect of Cl− anions on the Zn surface in the H2SO4 solution surpassed the ZnO on the Zn surface leading to its deterioration. The optical images in Figure 3b depict general surface deterioration due to the reaction effect of SO4 2− anions within the electrolyte compared with Figure 3a. In the presence of a low Cl− anion concentration, the competitive adsorption/reaction of Cl− and SO4 2− anion results in a superficial general surface deterioration at a magnification of ×10 and visible localized deterioration of Zn surface at a magnification of ×100. At a 2% Cl− anion concentration, the extent of Zn surface deterioration is very severe (Figure 3d). Table 1 shows a progressive increase in the Zn corrosion rate values. The corrosion reactions occur at the metal–solution interface within the acid chloride solution [32]. The corrosion rates vary from 4.089 mm/year in a 0.0625 M H2SO4 solution to 10.085 mm/year in a 0.0625 M H2SO4/2% NaCl concentration. At 0.0625 M H2SO4 to 0.0625 M H2SO4/0.125% NaCl concentrations, the variation in the corrosion rate is minimal due to the effective protection of the Zn surface within the electrolyte by ZnO. However, at a 0.0625 M H2SO4/0.25% NaCl concentration, the corrosion rate of Zn significantly increases to 5.259 mm/year, indicating the threshold Cl− anion concentration for accelerated corrosion. This observation continued till a 0.0625 M H2SO4/2% NaCl concentration. The polarization plots from 0.0625 M H2SO4/0.25% NaCl to 0.0625 M H2SO4/2% NaCl show a cathodic potential shift in agreement with an increase in the Zn corrosion rate analogous to the Cl− anion concentration. This occurred with an increase in the anodic/cathodic Tafel plots.
3.2 Open-circuit potential and XRF analysis
The open-circuit potential plots for Zn corrosion in 0.0625 M H2SO4, 0.0625 M H2SO4/0.0625% NaCl and 0.0625 M H2SO4/2% NaCl solutions are presented in Figure 4. Table 2 depicts the XRF results retrieved from the analysis of Zn surfaces prior to corrosion and following corrosion in the solutions mentioned earlier. The Zn plot in a 0.0625 M H2SO4 solution exhibited the most electropositive data plots indicating higher resistance to surface oxidation. The plot initiated at −0.95 V (0 s) moderately increased to −0.92 V at 800.01 s of exposure due to the initial corrosion of the Zn surface before the onset of protective oxide formation. Beyond 800.01 s, the plot showed relative stability before culminating at −0.91 V (7,200 ns). Though the plot configuration indicates significant active/passive transition behavior on the Zn surface during exposure as the protective oxide on Zn continues to grow. The XRF data in Table 2 show that Fe2O, CaO, SiO2, Al2O and ZnO oxides exhibit the highest concentration among the oxides on the Zn surface before corrosion compared to the other oxides. The concentrations of these oxides (excluding ZnO) decreased in the acid and acid chloride electrolytes when compared to the values obtained for as-received Zn. Simultaneously, the concentration of ZnO significantly increased due to the redox reaction effect of the corrosive anions in H2SO4 and H2SO4/NaCl solutions. In the presence of these corrosive species, ZnO is formed on the Zn surface. These oxides influenced the semi-conductor properties of Zn surfaces before and during the corrosion reaction processes, and hence, invariably the corrosion resistance of Zn and its thermodynamic properties. The Zn plot at 0.0625 M H2SO4/2% NaCl solution depicts the most electronegative plot configuration due to the combined reaction effect of Cl− and SO4 2− anions in the electrolyte. The plot initiated at −1 V sharply increases to −0.97 V at 494.4 s. Beyond this point on the plot, the relative thermodynamic stability of the Zn surface was attained compared to the Zn plot at 0.00625 M H2SO4. The plot eventually culminated at −0.96 V at 7,200 s of exposure. The corrosion potential values of the plots align with the results obtained from potentiodynamic polarization where an increase in the Cl− anion concentration leads to the breakdown of the protective oxide on the Zn surface and exposure of the substrate metal to corrosion.

An open-circuit potential plot for Zn corrosion in 0.0625 M H2SO4, 0.0625 M H2SO4/0.0625% NaCl and 0.0625 M H2SO4/2% NaCl solutions.
XRF analysis data on the concentration of oxides on Zn surfaces
| Oxides | As received | 0.0625 M H2SO4 | 0.0625 M H2SO4/0.0625% NaCl | 0.0625 M H2SO4/2% NaCl | ||||
|---|---|---|---|---|---|---|---|---|
| Counts per second | % Conc. of oxides | Counts per second | % Conc. of oxides | Counts per second | % Conc. of oxides | Counts per second | % Conc. of oxides | |
| Fe2O | 8,378 | 3.03 | 6,315 | 0.292 | 1,526 | 0.268 | 6,201 | 0.292 |
| TiO2 | 2,116 | 0.94 | 1,435 | 0.064 | 687 | 0.023 | 1,426 | 0.063 |
| CaO | 1,830 | 3.31 | 1,300 | 0.296 | 665 | 0.254 | 1,256 | 0.293 |
| K2O | 791 | 0.5 | 590 | 0.025 | 297 | 0.148 | 595 | 0.024 |
| SiO2 | 394 | 65.87 | 418 | 6.581 | 410 | 6.582 | 504 | 6.566 |
| ZnO | 175 | 0.6 | 204 | 92.8 | 180 | 90.4 | 336 | 91.2 |
| Al2O | 171 | 3.21 | 166 | 0.316 | 145 | 0.298 | 264 | 0.303 |
| MgO | 54 | 0.46 | 41 | 0.046 | 24 | 0.046 | 53 | 0.046 |
3.3 SEM, EDX and weight loss analysis
The weight loss data of Zn corrosion at a specific Cl− anion concentration are presented in Figure 5. Table 3 indicates the weight loss data at 168 h of examination. SEM images (mag. ×2,000 and ×3,000) of Zn before corrosion, after corrosion in a 0.0625 M H2SO4 solution and after corrosion in a 0.00625 M H2SO4/2% NaCl solution are shown in Figure 6a–c. Table 4 shows the EDX data for the SEM images. The weight loss data plots show that the Zn corrosion behavior at a specific Cl− anion concentration depicts a similar plot configuration throughout the exposure hours signifying similar redox reaction processes of Zn in the acid electrolyte. However, the corrosion rates increased with an increase in the Cl− anion concentration. It is also observed that the corrosion rate of Zn at all concentrations generally decreased after 48 h of exposure to 168 h. At 0% Cl− anion concentration, the corrosion rate initiated at 0.218 mm/year progressively increased to 2.381 mm/year (48 h) before terminating at 1.562 mm/year (168 h). The corresponding SEM image in Figure 6b shows extensive but limited surface deterioration compared to Figure 6a, which shows the bulk Zn morphology before corrosion. The corresponding EDX data in Table 4 show 100% wt concentration of Zn on the surface. The presence of S in Figure 6b shows that SO4 2− anions are accountable for the deterioration of Zn surfaces. Second, the presence of O (atomic concentration of 48.96% and wt concentration of 22.03%) within the same figure was detected at significant concentrations simultaneously with a decreased Zn concentration. This is probably due to the formation of ZnO during or after immersion in a 0.0625 M H2SO4 solution. The addition of Cl− anions to the acid electrolyte at 0.0625, 0.125 and 0.25% concentrations (weight loss analysis) marginally increased the corrosion rate of Zn from initial values of 0.425, 1.805 and 2.336 mm/year at 24 h to 1.670, 1.700 and 1.798 mm/year at 168 h of exposure. However, at 0.5 to 1% Cl− anion concentrations, a substantial increase in the corrosion rate of Zn was observed due to the presence of excess Cl− anions in the acid electrolyte. At a 2% Cl− anion concentration, the corrosion rate of Zn significantly increased between 4.376 mm/y at 24 h and 4.015 mm/year at 168 h. Figure 6c shows a visible degraded Zn morphology due to the electrochemical action of SO4 2− and Cl− anions. The corresponding EDX data (Table 4) show a significant presence of S, Cl and O, which are actively involved in the redox electrochemical reactions taking place on Zn surfaces.

A corrosion rate plot for Zn corrosion in 0.00625 M H2SO4 to 0.0625 M H2SO4/2% NaCl solution.
Weight loss data for Zn corrosion in a 0.0625 M H2SO4 solution at 0.0625–2% NaCl concentration at 168 h of exposure
| NaCl concentration (%) | Weight loss, W L (g) | Corrosion rate, C RT (mm/year) |
|---|---|---|
| 0 | 0.196 | 1.562 |
| 0.0625 | 0.209 | 1.670 |
| 0.125 | 0.213 | 1.700 |
| 0.25 | 0.225 | 1.798 |
| 0.5 | 0.239 | 1.906 |
| 1 | 0.249 | 1.990 |
| 2 | 0.503 | 4.015 |

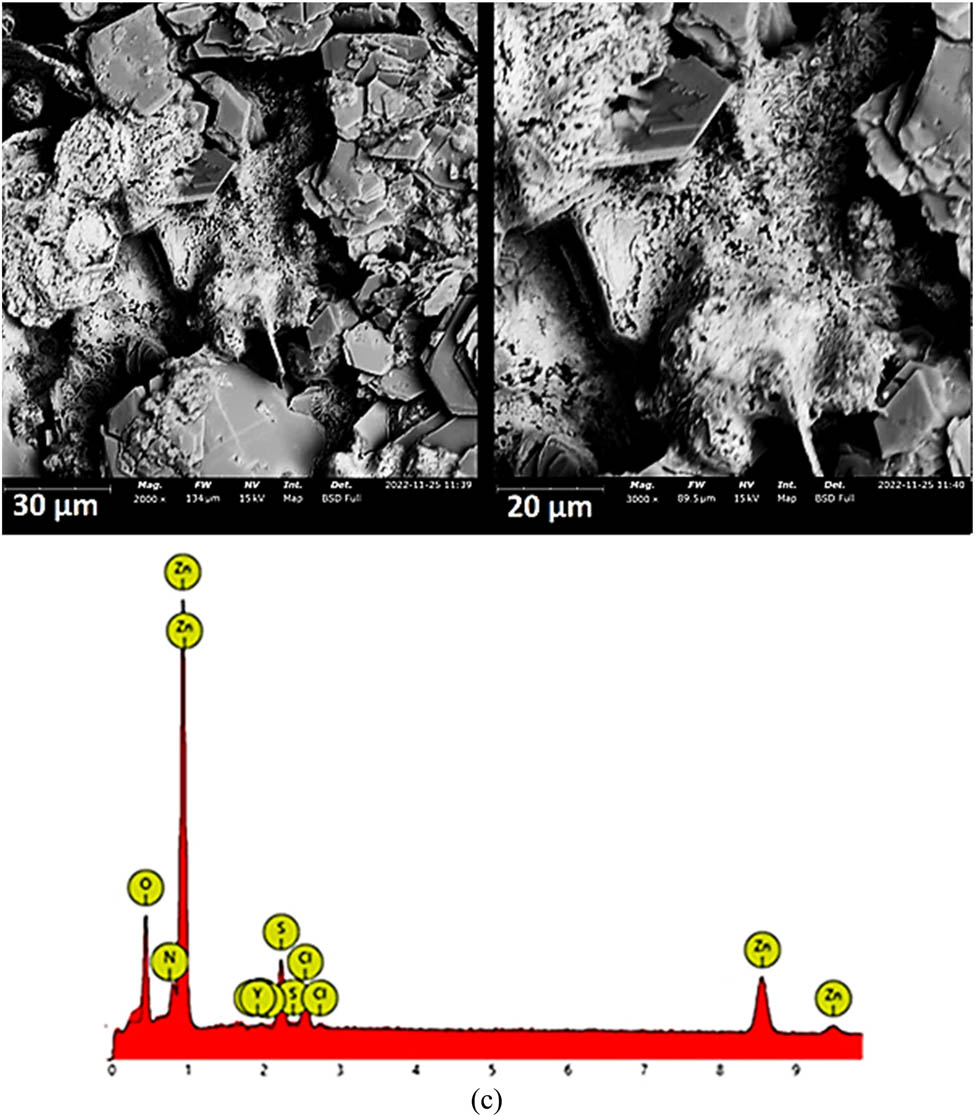
SEM images and EDX data for Zn: (a) preceding corrosion test, (b) following corrosion in 0.0625 M H2SO4 solution and (c) following corrosion in a 0.0625 M H2SO4/2% NaCl solution.
EDX data for Zn preceding the corrosion test, following corrosion in 0.0625 M H2SO4 solution and following corrosion in a 0.0625 M H2SO4/2% NaCl solution
| Zn | Zn in 0.0625 M H2SO4 | Zn in 0.0625 M H2SO4/2% NaCl | ||||||
|---|---|---|---|---|---|---|---|---|
| Element symbol | Atomic conc. | Weight conc. | Element symbol | Atomic conc. | Weight conc. | Element symbol | Atomic conc. | Weight conc. |
| Zn | 100 | 100 | O | 51.66 | 22.93 | Zn | 90.19 | 97.02 |
| Zn | 38.24 | 66.98 | O | 8.47 | 2.23 | |||
| S | 8.81 | 7.94 | Cl | 0.68 | 0.40 | |||
| N | 0.60 | 1.21 | S | 0.66 | 0.35 | |||
| Zr | 0.48 | 0.95 | ||||||
3.4 XRD
XRD of Zn after application of electrochemical techniques in the acid chloride electrolyte prior to corrosion, following corrosion in 0.0625 M H2SO4, and following corrosion in 0.0625 M H2SO4/2% NaCl solution was performed, and the results are shown in Figure 7–c. The figures also depict the corresponding optical images of the Zn surface at magnifications of ×5 and ×20. The diffraction peaks shown in Figure 7a (Zn(002), Zn(100), Zn(101), Zn(102), Zn(103), Zn(110), Zn(112), Zn(200) and Zn(201)) generally indicate the presence of a pure Zn metal and its crystalline nature [33,34]. The corresponding peaks occurred at 2Ɵ = 30.3°, 34.5°, 35.8°, 46.5°, 55.5°, 63.2°, 66.3°, 68.6°, 70.2° and 73.3° for Zn before the corrosion test. The highest peaks in these figures occurred at 30.3°, 34.5° and 35.8°, which match the Zn (100), Zn (101) and Zn (002) phases, respectively [35]. Most corrosion products on Zn surfaces are crystalline, and insoluble and tend to add to the corrosion resistance of the Zn H2SO4 solution [36]. The peak data in Figure 7b at 2Ɵ = 38.5°, 40.4°, 42.6°, 50.4°, 57.1°, 64.5°, 65.6°, 66.3° and 73.5° generally indicate the presence of ZnS, ZnFeS and ZnMnS. The peak data of Figure 7c (2Ɵ = 26.5°, 30.4°, 35.6°, 36.4°, 40.1°, 42.3°, 47.4°, 50.2°, 55.3°, 63.4°, 66.4°, 67.2° and 67.3°) show the presence of ZnS, ZnFeS and ZnMnS, ZnMg4 and ZnMnFeS phases compared to the presence of impurities detected with EDX and XRF analysis.

XRD peaks for Zn: (a) preceding corrosion, (b) following corrosion in a 0.0625 M H2SO4 solution and (c) following corrosion in a 0.0625 M H2SO4/2% NaCl solution.
4 Conclusion
Zn exhibited intermediate resistance to corrosion in a 0.0625 M H2SO4 solution and within it at low Cl− anion concentrations where the reactive/inert transition behavior of the corrosion polarization plots was marginal. A higher Cl− anion concentration above 0.5% results in a significant anodic corrosion potential shift and extensive localized and general morphological deterioration of the metal. Variation in the Cl− anion concentration has limited influence on the corrosion properties of Zn analogous to exposure times, despite an increase in the corrosion rate. EDX analysis before corrosion indicates 100% Zn content, wt%. Although, the exposure to H2SO4 captures the presence of S while Cl was captured in the presence of Cl− anions. However, the presence of other impurity elements in trace concentrations was discovered after the partial destruction of the Zn substrate metal. The open-circuit potential plots of Zn in the acid chloride solution indicate limited thermodynamic instability on Zn surfaces. However, the Cl− anion concentration dictates the potential shifts of the plots. Crystallographic phases and compounds on Zn were significantly influenced by the electrochemical action of Cl− and SO4 2− anions.
Acknowledgement
The author appreciates the financial contribution and support of Covenant University toward the success of the research.
-
Conflict of interest: The author states no conflict of interest.
References
[1] Serosh E, Bernd H, Volker S. A review of the development and application of microalloyed medium carbon steels. Steel Res. 1987;58(8):369–76.10.1002/srin.198700233Search in Google Scholar
[2] Han D, Xinjun S. Deformation induced ferrite transformation in low carbon steels. Curr Opin Solid State Mater Sci. 2005;9(6):269–76.10.1016/j.cossms.2006.02.014Search in Google Scholar
[3] Deepak D, Kateřina L, Thomas B. Carbon steel corrosion: A review of key surface properties and characterization methods. RSC Adv. 2017;7:4580–610.10.1039/C6RA25094GSearch in Google Scholar
[4] Siddiqui RA, Hussein AA. Hydrogen embrittlement in 0.31% carbon steel used for petrochemical applications. J Mater Process Technol. 2005;170(1–2):430–5.10.1016/j.jmatprotec.2005.05.024Search in Google Scholar
[5] Edmonds DV, Cochrane RC. The effect of alloying on the resistance of carbon steel for oilfield applications to CO2 corrosion. Mater Res. 2005;8(4):377–85. 10.1590/S1516-14392005000400004.Search in Google Scholar
[6] Akpanyung KV, Loto RT, Fajobi MA. An overview of Ammonium Chloride (NH4Cl) corrosion in the refining unit. J Phys Conf Ser. 2019;1378(2):022089. 10.1088/1742-6596/1378/2/022089.Search in Google Scholar
[7] Faisal M, Gusai A, Erin VI, Keller MW, Shirazi S, Roberts KP. Mechanistic modeling of erosion–corrosion for carbon steel. Trends Oil Gas Corros Res Technol. 2017;749–63. 10.1016/B978-0-08-101105-8.00031-0.Search in Google Scholar
[8] Cai J, Sun L, Ma H, Xiaogang L. Corrosion characteristics of Q690qE high-strength bridge steel in simulated coastal–industrial environment and its influence on mechanical and corrosion fatigue behaviors. Constr Build Mater. 2022;341:127830. 10.1016/j.conbuildmat.2022.127830.Search in Google Scholar
[9] Zhang W, Yang S, Wen-Tong G, Qiang H, Lujun Z. Corrosion behavior of the low alloy weathering steels coupled with stainless steel in simulated open atmosphere. Mater Chem Phys. 2022;288:126409. 10.1016/j.matchemphys.2022.126409.Search in Google Scholar
[10] Loto RT. Pitting corrosion evaluation and inhibition of stainless steels: A review. J Mats Env Sci. 2015;6(10):2750–62.Search in Google Scholar
[11] Loto RT. Anti-corrosion performance of the synergistic properties of benzenecarbonitrile and 5-bromovanillin on 1018 carbon steel in HCl environment. Sci Rep. 2017;7(1):17555.10.1038/s41598-017-17867-0Search in Google Scholar PubMed PubMed Central
[12] Ping L, Min D. Effect of chloride ion content on pitting corrosion of dispersion-strengthened-high-strength steel. Corros Commun. 2022;7:23–34. 10.1016/j.corcom.2022.03.005.Search in Google Scholar
[13] Kuklík V, Kudláček J. List of selected zinc coating technologies. Hot-dip galvanizing of steel structures. Amsterdam: Elsevier; 2016. p. 1–5. 10.1016/C2014-0-03512-5.Search in Google Scholar
[14] Zhang XG. Corrosion of zinc and zinc alloys. In ASM HandBook, corrosion: Materials. Ohio: ASM International; vol. 13B, 2005. 10.31399/asm.hb.v13b.a0003830.Search in Google Scholar
[15] Zinc Statistics and Information, National minerals information center. https://www.usgs.gov/centers/national-minerals-information-center/zinc-statistics-and-information. Retrieved November 3, 2022.Search in Google Scholar
[16] Greenwood NN, Earnshaw A. Chemistry of the elements. 2nd edn. Oxford: Butterworth-Heinemann; 1997.Search in Google Scholar
[17] Emsley J. “Zinc”. Nature’s building blocks: An A-Z guide to the elements. Oxford, England: Oxford University Press; 2001. p. 499–50.Search in Google Scholar
[18] Zhang ZJ. Corrosion and electrochemistry of zinc. New York: Springer; 1996. p. 93.Search in Google Scholar
[19] American conference of governmental industrial hygienists - Documentation of the TLVs and BEIs. 7th edn. Cincinnati: ACGIH Worldwide; 2020.Search in Google Scholar
[20] Veleva L, Meraz E, Acosta M. Zinc precipitation runoff from galvanized steel in humid tropical climate. Corros Eng Sci Technol. 2010;45(1):76–83. 10.1179/174327809X457030.Search in Google Scholar
[21] Veleva L, Kane RD. Atmospheric corrosion. In: Covino BS, Jr., Cramer SD, (editors.). ASTM Handbook, Vol. 13A, Ohio: ASM International Materials Park; 2003. p. 196–209.Search in Google Scholar
[22] Porter FC. Corrosion resistance of zinc and zinc alloys. Boca Raton: CRC Press; 1994. p. 121.10.1201/9781482293524Search in Google Scholar
[23] Deepti J, Shubhra P, Arunava A, Shrivastava R, Sassi W, Saroj KP, et al. Effect of exposure time on corrosion behavior of zinc-alloy in simulated body fluid solution: Electrochemical and surface investigation. J Mater Res Technol. 2021;10:738–51. 10.1016/j.jmrt.2020.12.050.Search in Google Scholar
[24] Wallinder O, Leygraf C. A critical review on corrosion and runoff from zinc and zinc-based alloys in atmospheric environments. Corrosion. 2017;73(9):1060–77. 10.5006/2458.Search in Google Scholar
[25] Rakel L, Jan‐Erik S, Lars‐Gunnar J. The atmospheric corrosion of zinc in the presence of NaCl. The influence of carbon dioxide and temperature. J Electrochem Soc. 2000;147(5). 10.1149/1.1393429.Search in Google Scholar
[26] Zhang X. Corrosion and electrochemistry of Zinc. New York: Springer Science + Business Media. 1996. p. 481.10.1007/978-1-4757-9877-7_4Search in Google Scholar
[27] Neufeld A, Cole I, Bond A, Furman S. The initiation mechanism of corrosion of zinc by sodium chloride particle deposition. Corros Sci. 2002;3:555–72.10.1016/S0010-938X(01)00056-7Search in Google Scholar
[28] Farrow LA, Graedel TE, Leygraf C. GILDES model studies of aqueous chemistry. II. The corrosion of zinc in gaseous exposure chambers. Corros Sci. 1996;38(12):2181–99.10.1016/S0010-938X(96)00081-9Search in Google Scholar
[29] Mouanga M, Ricq L, Douglade G, Douglade J, Berçot P. Influence of coumarin on zinc electrodeposition. Surf Coat Technol. 2006;201:762–7.10.1016/j.surfcoat.2005.12.036Search in Google Scholar
[30] Qing Q, Chuanwei Y, Ye, Wan Y, Cao C. Effects of NaCl and SO2 on the initial atmospheric corrosion of zinc. Corros Sci. 2002;44(12):2789–803.10.1016/S0010-938X(02)00076-8Search in Google Scholar
[31] Roh B, Macdonald DD. The passivity of titanium—part III: characterization of the anodic oxide film. J Solid State Electrochem. 2019;23:2001–8. 10.1007/s10008-019-04255-z.Search in Google Scholar
[32] Zhang L, Duan Y, Gao R, Yang J, Wei K, Tang D, et al. The effect of potential on surface characteristic and corrosion resistance of anodic oxide film formed on commercial pure titanium at the potentiodynamic-aging mode. Materials (Basel). 2019;12(3):370. 10.3390/ma12030370.Search in Google Scholar PubMed PubMed Central
[33] Leygraf C. Atmospheric corrosion. Encyclopedia of Electrochemistry. New York: Plenum Press; 2007.Search in Google Scholar
[34] Yuanyuan C, Shixiang L, Wenguo X, Huidong W, Juan W. Fabrication of superhydrophobic Au–Zn alloy surface on a zinc substrate for roll-down, selfcleaning and anti-corrosion properties. J Mater Chem A. 2015;3:16774.10.1039/C5TA03979GSearch in Google Scholar
[35] Shams A, Zhanga Y, Khan F. Electrochemical behaviour and analysis of Zn and Zn–Ni alloy anti-corrosive coatings deposited from citrate baths. RSC Adv. 2018;8:28861–73.10.1039/C8RA04650FSearch in Google Scholar PubMed PubMed Central
[36] Zhang XG. Corrosion and electrochemistry of zinc. New York: Plenum Press; 1996.10.1007/978-1-4757-9877-7Search in Google Scholar
© 2023 the author(s), published by De Gruyter
This work is licensed under the Creative Commons Attribution 4.0 International License.
Articles in the same Issue
- Regular Articles
- Design optimization of a 4-bar exoskeleton with natural trajectories using unique gait-based synthesis approach
- Technical review of supervised machine learning studies and potential implementation to identify herbal plant dataset
- Effect of ECAP die angle and route type on the experimental evolution, crystallographic texture, and mechanical properties of pure magnesium
- Design and characteristics of two-dimensional piezoelectric nanogenerators
- Hybrid and cognitive digital twins for the process industry
- Discharge predicted in compound channels using adaptive neuro-fuzzy inference system (ANFIS)
- Human factors in aviation: Fatigue management in ramp workers
- LLDPE matrix with LDPE and UV stabilizer additive to evaluate the interface adhesion impact on the thermal and mechanical degradation
- Dislocated time sequences – deep neural network for broken bearing diagnosis
- Estimation method of corrosion current density of RC elements
- A computational iterative design method for bend-twist deformation in composite ship propeller blades for thrusters
- Compressive forces influence on the vibrations of double beams
- Research on dynamical properties of a three-wheeled electric vehicle from the point of view of driving safety
- Risk management based on the best value approach and its application in conditions of the Czech Republic
- Effect of openings on simply supported reinforced concrete skew slabs using finite element method
- Experimental and simulation study on a rooftop vertical-axis wind turbine
- Rehabilitation of overload-damaged reinforced concrete columns using ultra-high-performance fiber-reinforced concrete
- Performance of a horizontal well in a bounded anisotropic reservoir: Part II: Performance analysis of well length and reservoir geometry
- Effect of chloride concentration on the corrosion resistance of pure Zn metal in a 0.0626 M H2SO4 solution
- Numerical and experimental analysis of the heat transfer process in a railway disc brake tested on a dynamometer stand
- Design parameters and mechanical efficiency of jet wind turbine under high wind speed conditions
- Architectural modeling of data warehouse and analytic business intelligence for Bedstead manufacturers
- Influence of nano chromium addition on the corrosion and erosion–corrosion behavior of cupronickel 70/30 alloy in seawater
- Evaluating hydraulic parameters in clays based on in situ tests
- Optimization of railway entry and exit transition curves
- Daily load curve prediction for Jordan based on statistical techniques
- Review Articles
- A review of rutting in asphalt concrete pavement
- Powered education based on Metaverse: Pre- and post-COVID comprehensive review
- A review of safety test methods for new car assessment program in Southeast Asian countries
- Communication
- StarCrete: A starch-based biocomposite for off-world construction
- Special Issue: Transport 2022 - Part I
- Analysis and assessment of the human factor as a cause of occurrence of selected railway accidents and incidents
- Testing the way of driving a vehicle in real road conditions
- Research of dynamic phenomena in a model engine stand
- Testing the relationship between the technical condition of motorcycle shock absorbers determined on the diagnostic line and their characteristics
- Retrospective analysis of the data concerning inspections of vehicles with adaptive devices
- Analysis of the operating parameters of electric, hybrid, and conventional vehicles on different types of roads
- Special Issue: 49th KKBN - Part II
- Influence of a thin dielectric layer on resonance frequencies of square SRR metasurface operating in THz band
- Influence of the presence of a nitrided layer on changes in the ultrasonic wave parameters
- Special Issue: ICRTEEC - 2021 - Part III
- Reverse droop control strategy with virtual resistance for low-voltage microgrid with multiple distributed generation sources
- Special Issue: AESMT-2 - Part II
- Waste ceramic as partial replacement for sand in integral waterproof concrete: The durability against sulfate attack of certain properties
- Assessment of Manning coefficient for Dujila Canal, Wasit/-Iraq
- Special Issue: AESMT-3 - Part I
- Modulation and performance of synchronous demodulation for speech signal detection and dialect intelligibility
- Seismic evaluation cylindrical concrete shells
- Investigating the role of different stabilizers of PVCs by using a torque rheometer
- Investigation of high-turbidity tap water problem in Najaf governorate/middle of Iraq
- Experimental and numerical evaluation of tire rubber powder effectiveness for reducing seepage rate in earth dams
- Enhancement of air conditioning system using direct evaporative cooling: Experimental and theoretical investigation
- Assessment for behavior of axially loaded reinforced concrete columns strengthened by different patterns of steel-framed jacket
- Novel graph for an appropriate cross section and length for cantilever RC beams
- Discharge coefficient and energy dissipation on stepped weir
- Numerical study of the fluid flow and heat transfer in a finned heat sink using Ansys Icepak
- Integration of numerical models to simulate 2D hydrodynamic/water quality model of contaminant concentration in Shatt Al-Arab River with WRDB calibration tools
- Study of the behavior of reactive powder concrete RC deep beams by strengthening shear using near-surface mounted CFRP bars
- The nonlinear analysis of reactive powder concrete effectiveness in shear for reinforced concrete deep beams
- Activated carbon from sugarcane as an efficient adsorbent for phenol from petroleum refinery wastewater: Equilibrium, kinetic, and thermodynamic study
- Structural behavior of concrete filled double-skin PVC tubular columns confined by plain PVC sockets
- Probabilistic derivation of droplet velocity using quadrature method of moments
- A study of characteristics of man-made lightweight aggregate and lightweight concrete made from expanded polystyrene (eps) and cement mortar
- Effect of waste materials on soil properties
- Experimental investigation of electrode wear assessment in the EDM process using image processing technique
- Punching shear of reinforced concrete slabs bonded with reactive powder after exposure to fire
- Deep learning model for intrusion detection system utilizing convolution neural network
- Improvement of CBR of gypsum subgrade soil by cement kiln dust and granulated blast-furnace slag
- Investigation of effect lengths and angles of the control devices below the hydraulic structure
- Finite element analysis for built-up steel beam with extended plate connected by bolts
- Finite element analysis and retrofit of the existing reinforced concrete columns in Iraqi schools by using CFRP as confining technique
- Performing laboratory study of the behavior of reactive powder concrete on the shear of RC deep beams by the drilling core test
- Special Issue: AESMT-4 - Part I
- Depletion zones of groundwater resources in the Southwest Desert of Iraq
- A case study of T-beams with hybrid section shear characteristics of reactive powder concrete
- Feasibility studies and their effects on the success or failure of investment projects. “Najaf governorate as a model”
- Optimizing and coordinating the location of raw material suitable for cement manufacturing in Wasit Governorate, Iraq
- Effect of the 40-PPI copper foam layer height on the solar cooker performance
- Identification and investigation of corrosion behavior of electroless composite coating on steel substrate
- Improvement in the California bearing ratio of subbase soil by recycled asphalt pavement and cement
- Some properties of thermal insulating cement mortar using Ponza aggregate
- Assessment of the impacts of land use/land cover change on water resources in the Diyala River, Iraq
- Effect of varied waste concrete ratios on the mechanical properties of polymer concrete
- Effect of adverse slope on performance of USBR II stilling basin
- Shear capacity of reinforced concrete beams with recycled steel fibers
- Extracting oil from oil shale using internal distillation (in situ retorting)
- Influence of recycling waste hardened mortar and ceramic rubbish on the properties of flowable fill material
- Rehabilitation of reinforced concrete deep beams by near-surface-mounted steel reinforcement
- Impact of waste materials (glass powder and silica fume) on features of high-strength concrete
- Studying pandemic effects and mitigation measures on management of construction projects: Najaf City as a case study
- Design and implementation of a frequency reconfigurable antenna using PIN switch for sub-6 GHz applications
- Average monthly recharge, surface runoff, and actual evapotranspiration estimation using WetSpass-M model in Low Folded Zone, Iraq
- Simple function to find base pressure under triangular and trapezoidal footing with two eccentric loads
- Assessment of ALINEA method performance at different loop detector locations using field data and micro-simulation modeling via AIMSUN
- Special Issue: AESMT-5 - Part I
- Experimental and theoretical investigation of the structural behavior of reinforced glulam wooden members by NSM steel bars and shear reinforcement CFRP sheet
- Improving the fatigue life of composite by using multiwall carbon nanotubes
- A comparative study to solve fractional initial value problems in discrete domain
- Assessing strength properties of stabilized soils using dynamic cone penetrometer test
- Investigating traffic characteristics for merging sections in Iraq
- Enhancement of flexural behavior of hybrid flat slab by using SIFCON
- The main impacts of a managed aquifer recharge using AHP-weighted overlay analysis based on GIS in the eastern Wasit province, Iraq