Discharge predicted in compound channels using adaptive neuro-fuzzy inference system (ANFIS)
-
Noor I. Khattab
 and
Arwa A. Mala Obaida
and
Arwa A. Mala Obaida

Abstract
Some hydraulic structures and phenomena, including compound channels, must be studied in relation to open channel flow. Despite the fact that the primary channel and watersheds share a similar degree of roughness, estimating discharge in composite channels with mainstreams and flood plains has proved tricky. The flow discharge for a compound channel with different roughness in the primary and flood plain channels has been studied, and the results computed experimentally using horizontal division level have been compared with those predicted using dimensional analysis and an adaptive neuro-fuzzy inference system. The results show good agreement between experimental and numerical for discharge calculation according to root-mean-square error, MARE, R 2, SI, and Nash–Sutcliffe efficiency, with a percentage error not exceeding ±5%.
1 Introduction
Most waterways have irregular shapes and sections that do not resemble simple rectangular, trapezoidal, or triangle channels. These passages are filled with water during the full flood, causing water to cross into neighboring lands known as flood plains, and often they are filled with plants that obstruct the flow compared to the main channel. Zheleznyakov [1] conducted the first study of the complex channels that consist of a primary canal, as well as flood plains. Therefore, the friction resistance of the primary channel is less than that of the plains susceptible to flooding [2]. Despite the many methods of measuring discharge in the compound channels, it still gives unconvincing results because a large number of data are collected and applied to small- and large-sized laboratory channels [3]. Parsaie and Haghiabi [4] conducted a study employing mathematical approaches like principal component analysis to compute the discharge coefficient in side weir principal component analysis (PCA). The Froude number and the proportion of the elevation of the weir to the level of flowing upstream of the weir were shown to be among the most impactful parameters on the discharge coefficient. Relying on PCA was essential to prepare the optimum source using the neural-a-physical adaptive neuro-fuzzy inference system (ANFIS), in which five and four organic functions were used for the Froude number and the proportion of the flowing height to the weir. The researchers [5] investigated product shear stress in symmetrical compounded conduits of smooth and rocky flood plains. RF = random forest, random tree, tree pruning line reduction, and distinctive hybrid M5P were used. The findings revealed that the best estimate of RF was obtained when the number of inputs was six. When the number of input variables is four, it gives the best results compared to other models. Haghiabi et al. [6] conducted a study on the triangular zigzag weirs to find out the discharge coefficient using multi-layer neural networks multilayer perceptron (MLP) and ANFIS. Essential factors for the gamma test test are the ratio of the weir length edge to the main channel width, the percentage of one cycle duration to the breadth, and the balance of total water height in front of the weir to the weir height. In addition, the results showed that both MLP and ANFIS gave acceptable results and that the ANFIS model is considered the best. Bousmar [7] studied the model of exchange discharge using the one-dimensional approximation and the model of exchange discharge exchange discharge model (EDM). Use EDM to calculate the momentum transfer between the sub-channel sections estimated in proportion to the velocity gradient and exchange discharge through the interface. Two main types of exchange processes can be characterized: the first is turbulent exchange due to the development of the shear layer, and the second is geometric exchange due to the change of section. The study showed that using EDM gave good results for estimating the discharge. Under flood conditions, the flow velocity in the flood plain is less than that in the main channel, leading to a momentum transfer. Studies have proven that the variation in the flow depth in the main channel and the width of the main channel affect the coefficient of friction, while the slope of the bank sides does not affect the coefficient of friction, Cfa. The study of Moreta and Martin-vide [8] proved that it is necessary to know the effect of gradient velocity, roughness, and channel shape in estimating shear stress because it is complicated to find the gradient velocity without a detailed measurement. The Cfa does not have high accuracy when changing the channel shape and roughness. Huai et al. [9] reached the possibility of using the technique of artificial neural networks (ANNs) in estimating momentum transfers in the main channel and flood plains with the presence or absence of vegetation cover. Bonakdari et al. [10] estimated shear stress using genetic algorithms (ANN) and genetic programming (GP) with multiple linear regression (MLR). Their study showed that the genetic algorithm analysis method gives better results than the GP and MLR methods. The matrix principles were also used to predict the shear stress. In addition, one of the limitations that causes software weakness is the presence of data outside the learning values [11,12]. Computer programs have been widely used for comparison with other methods. ANNs, fuzzy logic (FL), and ANFIS have been used to overcome the weaknesses of individual models with high efficiency. Khosravi et al. [12] proved that although the hybrid models have higher prediction than individual ANNs and FLs, they suffer from the weakness of finding the best parameter for the FL and fuzzy networks model as well as the best weight in the organic analysis function. Naik et al. [13] studied numerical analysis depth – the rate of velocity distribution in composite channels and flood plains. Initially, 3D computer fluid dynamics was applied to establish a database under different conditions. The researcher used the technique of ANNs for training based on the backpropagation neural network to estimate the depth of the rate of velocity distribution in the stenosis segments. The investigation concentrated on the capacity of computer programs to correctly guess the complex flow phenomenon that occurs in the channels.
The present study relied on calculating the discharge for each main compound channel and flood plain from the experimental data and compared the results with theoretical equations and the results deduced from ANFIS.
2 Experimental setup
According to ref. [14] the experiments took place in the University of Mosul hydraulic laboratory at a 10 m length of the experimental flume (30 × 45 cm2 width and height, respectively; Figure 1). The experimental flume is modified to an unsymmetrical compound channel; the length of the compound flume is 6 m, and the primary flume is split into two sections (major channel 10 cm wide and flood plain 20 cm width), 3,660 cubic wooden pieces (1 × 1 × 1 cm3 dimensions), and cylindrical pieces of 1 cm diameter and 1 cm width were installed in the main and flood plain channels at a line distance 1 cm between (Figure 2). The experiments were conducted using cubic and cylindrical pieces in five different Manning roughness conditions by changing the distance between cubic pieces along the flood plain Nf (flood plain Manning roughness). In contrast, n b (the main channel Manning roughness) remains constant, so nine different Nf/n b were used, Table 1. Five different discharges were taken for all these cases as 45 experiments in each water depth were measured at three different places: the entrance, middle, and end of the composite conduit across the primary and flood channels using a point gauge with an accuracy of 0.1 mm, the velocity measurement was taken using a pitot tube in a different section of the main and flood channels. The discharge measurements were done by a standard sharp-crested weir (30 × 35 × 0.6 cm3 dimensions) installed at 85 cm from the channel entrance. Calibration was done before experiments using a volumetric method to calculate the actual discharge. The following equation is used to estimate discharge:
where Q a is actual discharge (L/s) and H w is the water depth above the standard weir (cm).
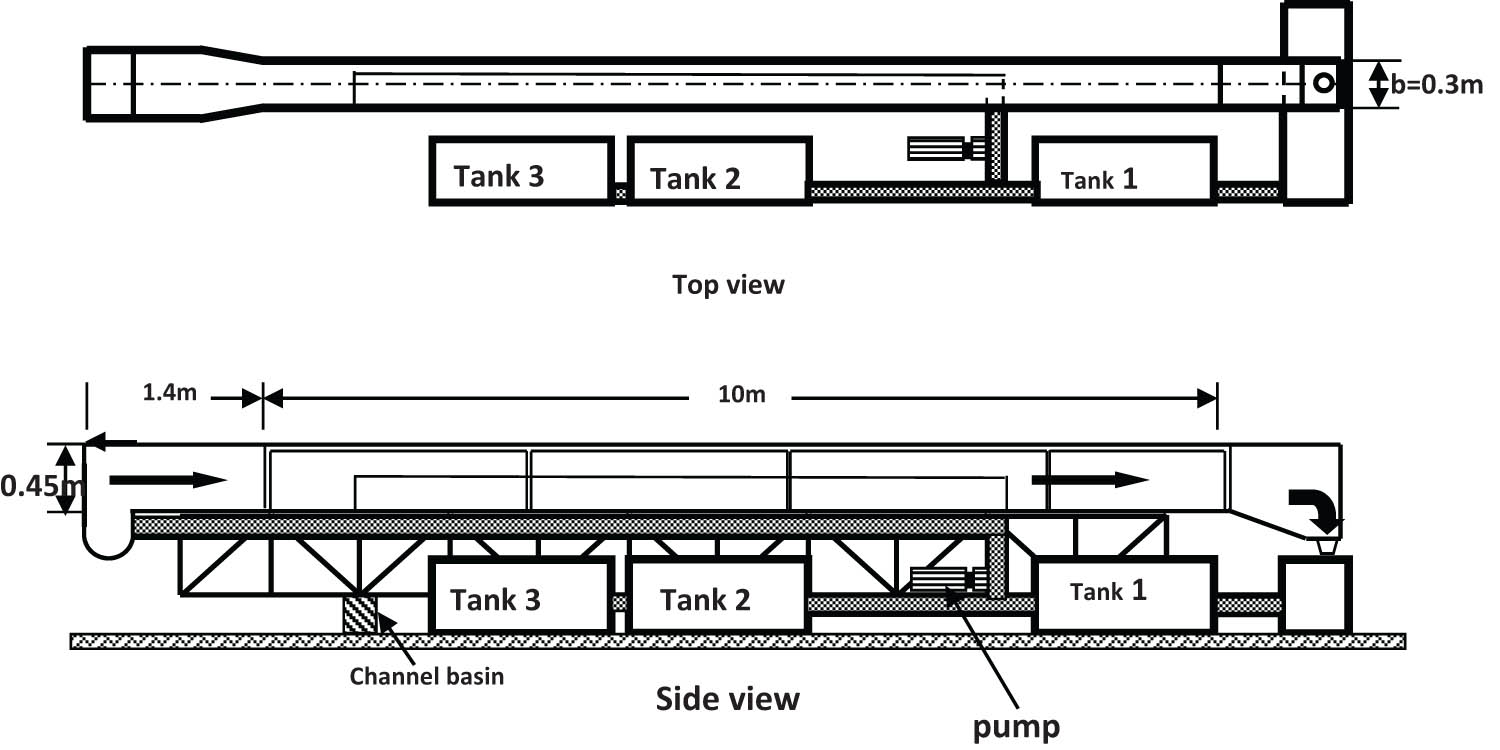
Laboratory flume sketch.
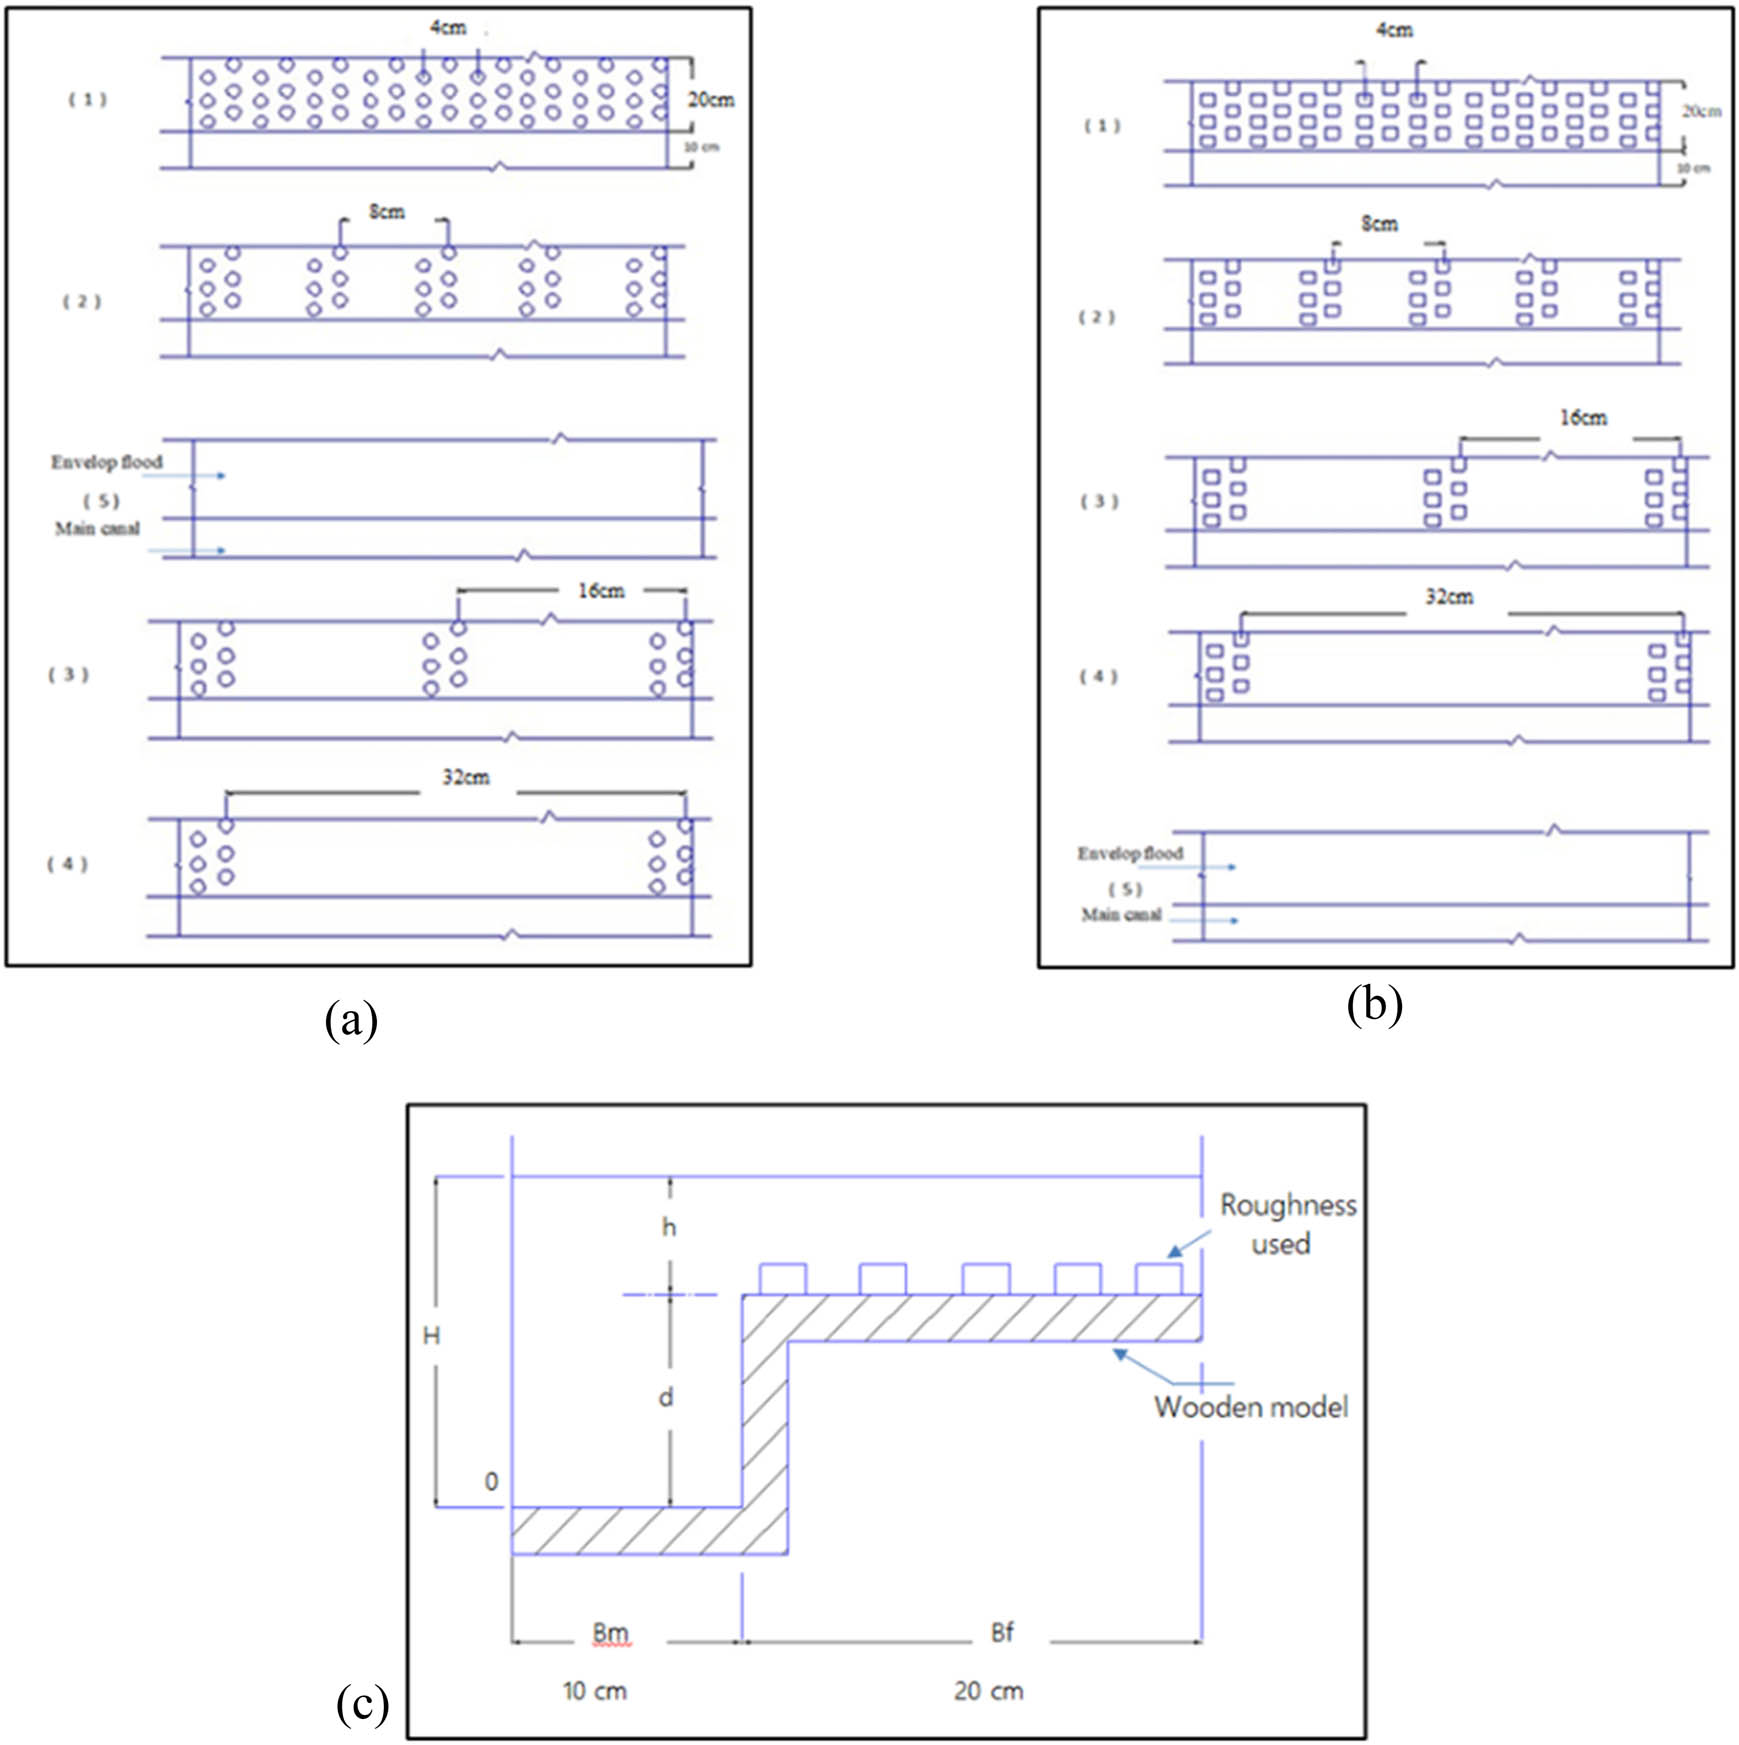
Laboratory flume roughness distribution, (a) using cylindrical pieces and (b) using cubic parts, and (c) channel cross-section clarifying roughness distribution in a flood plain.
Experimental data using ANFIS input
| B m (cm) | N m (s/m3) | N f/N m | h/H | Q c (L/s) |
|---|---|---|---|---|
| 10 | 0.018 | 1 | 0.2 | 5.68 |
| 10 | 0.018 | 1 | 0.23 | 6.38 |
| 10 | 0.018 | 1 | 0.28 | 8.37 |
| 10 | 0.018 | 1 | 0.33 | 10.28 |
| 10 | 0.018 | 1 | 0.37 | 12.53 |
| 10 | 0.018 | 1.2 | 0.2 | 5.18 |
| 10 | 0.018 | 1.2 | 0.23 | 5.93 |
| 10 | 0.018 | 1.2 | 0.28 | 7.24 |
| 10 | 0.018 | 1.2 | 0.33 | 8.98 |
| 10 | 0.018 | 1.2 | 0.37 | 10.96 |
| 10 | 0.018 | 1.22 | 0.2 | 5.11 |
| 10 | 0.018 | 1.22 | 0.23 | 5.85 |
| 10 | 0.018 | 1.22 | 0.28 | 7.15 |
| 10 | 0.018 | 1.22 | 0.33 | 8.76 |
| 10 | 0.018 | 1.22 | 0.37 | 10.67 |
| 10 | 0.018 | 1.28 | 0.2 | 4.99 |
| 10 | 0.018 | 1.28 | 0.23 | 5.67 |
| 10 | 0.018 | 1.28 | 0.28 | 6.96 |
| 10 | 0.018 | 1.28 | 0.33 | 8.63 |
| 10 | 0.018 | 1.28 | 0.37 | 10.2 |
| 10 | 0.018 | 1.35 | 0.2 | 4.88 |
| 10 | 0.018 | 1.35 | 0.23 | 5.52 |
| 10 | 0.018 | 1.35 | 0.28 | 6.72 |
| 10 | 0.018 | 1.35 | 0.33 | 8.38 |
| 10 | 0.018 | 1.35 | 0.37 | 9.89 |
| 10 | 0.018 | 1.355 | 0.2 | 4.98 |
| 10 | 0.018 | 1.355 | 0.23 | 5.67 |
| 10 | 0.018 | 1.355 | 0.28 | 6.91 |
| 10 | 0.018 | 1.355 | 0.33 | 8.54 |
| 10 | 0.018 | 1.355 | 0.37 | 10.3 |
| 10 | 0.018 | 1.45 | 0.2 | 4.91 |
| 10 | 0.018 | 1.45 | 0.23 | 5.48 |
| 10 | 0.018 | 1.45 | 0.28 | 6.552 |
| 10 | 0.018 | 1.45 | 0.33 | 8.15 |
| 10 | 0.018 | 1.45 | 0.37 | 9.82 |
| 10 | 0.018 | 1.5 | 0.2 | 4.83 |
| 10 | 0.018 | 1.5 | 0.23 | 5.41 |
| 10 | 0.018 | 1.5 | 0.28 | 6.41 |
| 10 | 0.018 | 1.5 | 0.33 | 7.91 |
| 10 | 0.018 | 1.5 | 0.37 | 9.58 |
| 10 | 0.018 | 1.74 | 0.2 | 4.52 |
| 10 | 0.018 | 1.74 | 0.23 | 5.12 |
| 10 | 0.018 | 1.74 | 0.28 | 5.96 |
| 10 | 0.018 | 1.74 | 0.33 | 7.19 |
| 10 | 0.018 | 1.74 | 0.37 | 8.63 |
3 Theoretical methodology
The flow in the rivers and compound channels is very complex because of the relative motion, mass, and energy between the primary flume and the flood stream. However, different from theoretically studying this phenomenon, there have not been purely mathematical analyses considering the additional losses resulting from this complex physical phenomenon. Therefore, attention turned to practical methods based on experimental observations to design composite channels.
The practical methods used to find the discharge in all complex channels were based on dividing the total section into homogeneous parts using imaginary levels in the contact areas of the details.
One of the most fundamental, accessible, and widely used imaginary division levels were the vertical (V), horizontal (H), diagonal (D), and zero (Z) division levels (Figure 3).

Laboratory flume with imaginary division levels.
The discharge of the composite channel is computed as follows:
where Q i is the discharge at section (i), A i is the area in paragraph (i), R i is the hydraulic radius at section (i), n i is the Manning roughness at section (i), S is the channel slope, m is the number of compound sections, and Q c is the compound discharge.
This study used the horizontal division (H) to calculate the theoretical discharge in a compound channel.
4 Horizontal division level (He)
The whole section is divided using the horizontal division plane (a–c), as shown in Figure 3, and the division plane does not enter the wet boundary of the main canal and flood plain:
where S is the channel bed slope;
5 Horizontal division level (Hi)
In this case, the horizontal division level (a–c) was included in the computation of the wet boundary of the main channel:
6 Manning roughness coefficient
In the compound channels, the Manning roughness coefficient of the flood envelope is usually more significant than the coefficient of the roughness of the main channel; it has been artificially roughed to obtain the Manning roughness coefficient of the flood envelope. In this study, wooden cubes were used in the first model and wooden discs in the second model. In the second model with the same method and by-passing discharges inside the main channel only whose bottom is rough with the same roughness conditions for the flood envelope bottom during the experiments and by measuring the release and depth, the Manning roughness coefficient was obtained by applying the [15] method that includes the following relationships:
where Q is the discharge pass through the canal (m3/s); R b is the hydraulic radius to the bottom (m); R w is the hydraulic radius for the main canal wall (m); n w is the Manning coefficient for the canal wall (0.011 s/m1/3); u is the average velocity of flow (m/s); D 1 is the theoretical depth (m); and n b is the Manning roughness coefficient for the bed (s/m1/3).
7 Dimensional analysis
The following variables affect the flow of water at the compound channel: Q
c is the compound flowrate (L3/T);
By using Buckingham’s theory as well as combining and neglecting some parameters because they are constant according to experimental results and the Reynolds number because of the turbulent flow, then equation (9) can be written as follows:
where h = H − d.
From equation (10) and using statistical programming SPSS, the following equation can result in a calculated discharge in the compound channel (MLR):
R 2 = 0.986.
8 Adaptive neuro-fuzzy inference systems (ANFIS):
Based on the input and output data, ANFIS is a potent modeling instrument for complicated systems. ANFIS is accomplished by optimally combining neural and fuzzy systems. This particular combo allows both numerical and intelligent methods to be employed. In fuzzy systems, many fuzzifications and profoundly changing algorithms with unique rules are investigated for each input parameter. There are three steps to consider when calculating the influence of FL on incoming data – one-by-one selection of every variable’s transfer function. A Gaussian function may be considered for each input variable at this step.
For example, fuzzy thinking is shown in Figure 4. A fuzzy system with three variable inputs and a single output was investigated. Consider a rule base that has three if-then rules that are ambiguous:

ANFIS with input and output layers for the calculation of Q c.
Rule 1: if x is A1 and y is B1 then f1 = p1x + q1y + r1
Rule 2: if x is A2 and y is B2 then f2 = p2x + q2y + r2
Rule 3: if x is A3 and y is B3 then f3 = p3x + q3y + r3
in which A1, A2, A3 and B1, B2, B3 are the membership functions for inputs x and y, respectively; p1, q1, r1, p2, q2, r2 and p3, q3, r3 are the parameters of the output function.
As shown in Figure 4, the ANFIS architecture is composed of four layers: in the first layer, all input variables are multiplied by a transfer function to provide the degree of organization; in the second layer, all stages of membership are standardized; in the third level, the sum of all calculated rules’ contributions; and in the fourth level, the overall contribution is added. An average weightedgrade membership [16,17,18,19,20,21].
9 Results and discussions
9.1 Data collection and preparation
To estimate minor discharges, a computer-based approach is utilized partial derivative (PD). A modular FL system was created, with a distinct FL engine built to identify each form of PD defect. The entry values are selected from a set of integrated variables and numerical moments that are routinely used to define phase-resolved PD patterns.
The parameters of the dimensional analysis (B m, N m, N f, N m, h, and H) are used as input for the FL model, and Q c is the output of the FL model (Figure 5).
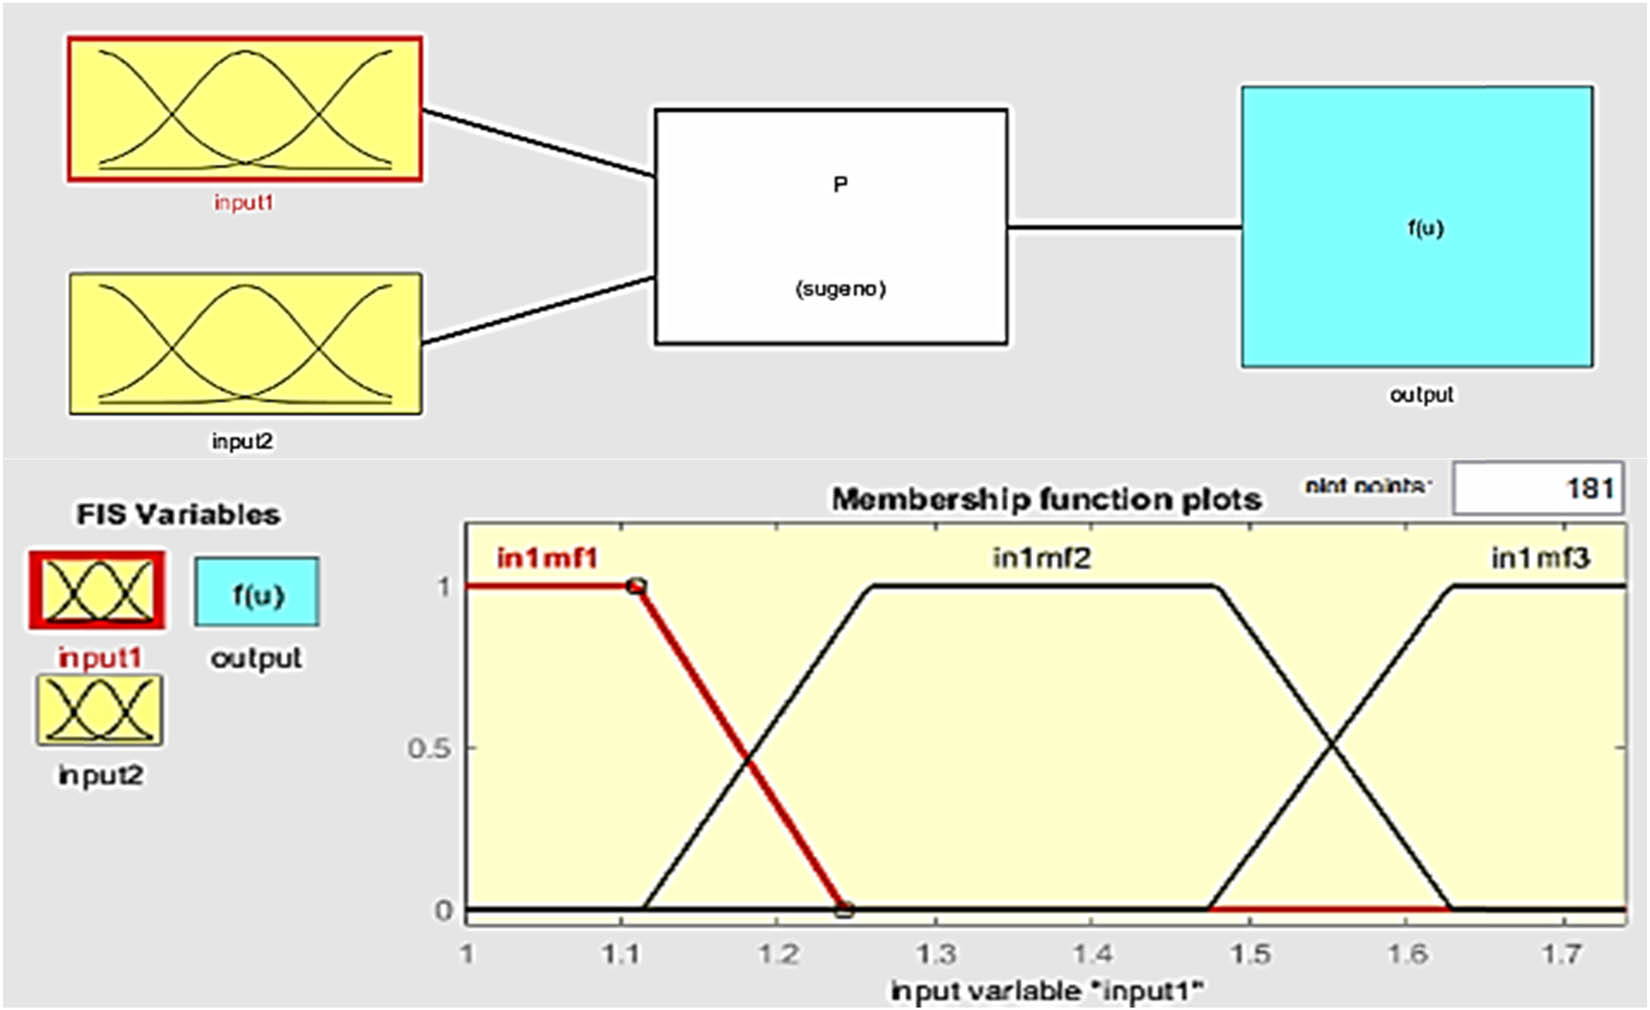
The input and output parameters in the ANFIS model.
The code for the toolbox is included in the MATLAB application. of FL with various FL architectures for model computation. The output results compared between experimental and training data for various iterations are shown in Figure 6.

The output results of the ANFIS model compared with experimental data.
The measure that evaluates recorded and computed Q c for all composite channel data investigated in this study demonstrates excellent agreement between the data and these findings after (15) iterations with R 2 = 0.99 (Figure 7).

The regression of observed and calculated discharge after 15 iterations in the ANFIS model.
10 Results indexes
The qualitative results of the available equations are also computed and characterized in terms of the coefficient of determination (R 2), root-mean-square error (RMSE), scatter index (SI), and mean absolute relative error (MARE). The determination coefficient is the fraction of the dependent variable’s variation that can be predicted from the independent factors. It typically runs from 0 to 1.
where
The RMSE is also used to assess the disparity between what a model predicts and what the modeled entity does. RMSE is a commonly used error-index metric that is defined as follows:
The SI is calculated by dividing the RMSE at each grid point by the average of the observations and then multiplying the result by 100. Regarding the mean remark, it provides the proportion of the RMSE difference or the percentage of anticipated error for the parameter and is defined as follows:
MARE is a loss function for machine learning regression problems that are often used to measure the accuracy of an estimated system’s prediction in statistics. Typically, precision is expressed as a ratio determined by the following formula:
The Nash–Sutcliffe efficiency correlation was used to evaluate the forecasting capability of hydrological studies. Compared to the computed data variance, the mathematically verified data variance indicates the number of response values (“noise”). It demonstrates how well the plot of actual data against predicted data aligns with the 1:1 axis. It is described as follows:
where E = 1 shows a perfect match between the predicted discharge coefficient and the data collected; E = 0 means that the model is as powerful as the normal of the available data; and – E0 denotes that the detected median value is superior to the model, indicating that the results are undesired.
The MLR from the dimensional analysis model and ANFIS predicted and the results calculated using imaginary division (horizontal divisions, He and Hi) results satisfactorily compared to the available discharge equations for the compound channel, Table 2.
Results realization for discharge calculated in different methods
| ANFIS | Dimensional analysis (MLR) | Hi | He | |
|---|---|---|---|---|
| RMSE | 0.0611 | 0.295 | 0.2090 | 0.5406 |
| MARE | 0.0045 | 0.0278 | 0.0104 | 0.0483 |
| SI | 0.0083 | 0.0403 | 0.0289 | 0.0692 |
| R (%) | 99.95 | 99.13 | 99.52 | 99.80 |
| R 2 (%) | 99.91 | 98.27 | 99.06 | 99.61 |
| NSE | 0.998 | 0.971 | 0.985 | 0.904 |
The qualitative performance of the present dimensional analysis equation MLR has a low RMSE (0.295), MARE (0.0278), SI (0.0403), a high Nash–Sutcliffe efficiency (NSE) and R 2 (0.971), and (98.27%), respectively. In contrast, the ANFIS model has the lowest RMSE (0.0611), MARE (0.0045), SI (0.0083), and highest NSE and R 2 (0.998), and (99.91%), respectively, which indicates that it has better performance as compared to other existing predictors.
Figure 8 demonstrates the relationship between discharge observed from data from experiments and that predicted using imaginary division, MLR, and ANFIS. From the figure, it is clear that the percent error does not exceed ±5%. Therefore, the ANFIS models are recommended for general use to predict the discharge of compound channel.

The comparison between discharge computed using different methods.
11 Conclusions
The discharge compound channel was predicted in this study using imaginary horizontal divisions He and Hi, MLR (from dimensional analysis), and the ANFIS approach and then compared using RMSE, MARE, SI, R 2, and NSE. In this investigation, the ANFIS approach yielded the highest results compared to others by 0.0611, 0.0045, 0.0083, 0.998, and 99.91%, respectively, with percentage error not exceeding ±5%, which indicates that it has better performance as compared to other existing predictors.
Notation list
- A i
-
the area in Section (i)
- B f
-
channel width in flood plain L
- B m
-
main channel width (L)
- D
-
depth of the main canal (L)
- D 1
-
theoretical depth (L)
- G
-
gravitational acceleration (L/T2)
- H
-
water depth above main channel (L)
- He
-
horizontal divisions, He and Hi
- Hi
-
horizontal divisions, He and Hi
- H w
-
Water depth above standard weir (L)
- M
-
the number of compound sections
- n b
-
channel bed Manning roughness (s/m3)
- N f
-
Manning roughness in flood channel (TL−1/3)
- N i
-
Manning roughness in section (i)
- N m
-
Manning roughness in the main channel (TL−1/3)
- N w
-
Manning coefficient for canal wall(0.011 T/L1/3)
- Q
-
discharge pass through the canal (L3/s)
- Q a
-
actual discharge (L/s)
- Q c
-
compound flow rate (L3/T)
- Q i
-
discharge at section (i)
- R b
-
hydraulic radius to bottom (L)
- R i
-
hydraulic radius at section (i)
- R w
-
hydraulic radius for the main canal wall (L)
- S
-
channel slope
- u
-
the average velocity of flow (L/T)
-
-
dynamic viscosity (M/LT)
-
-
water density (M/L3)
-
Conflict of interest: Authors state no conflict of interest.
References
[1] Zheleznyakov GV. Relative deficit of mean velocity of unstable river flow, kinematic effect in river beds with flood plains. 11th International Congress of the Association for Hydraulic Research, Leningrad, USSR; 1965.Search in Google Scholar
[2] Kelly McAtee PE, Leed A. Introduction to compound channel flow analysis for floodplains. USA: SunCam continuing education course; 2012.Search in Google Scholar
[3] Hosseini SM. Equations for discharge calculation in compound channels having homogeneous roughness. Iran J Sci Technol. 2004;28(B5):537–46.Search in Google Scholar
[4] Parsaie A, Haghiabi AH. Prediction of discharge coefficient of side weir using adaptive neuro-fuzzy inference system. Sustain Water Resour Manag. 2016;2(3):257–64.Search in Google Scholar
[5] Sheikh Khozani Z, Khosravi K, Torabi M, Mosavi A, Rezaei B, Rabczuk T. Shear stress distribution prediction in symmetric compound channels using data mining and machine learning models. Front Struct Civ Eng. 2020;14(5):1097–109.10.1007/s11709-020-0634-3Search in Google Scholar
[6] Haghiabi AH, Parsaie A, Ememgholizadeh S. Prediction of discharge coefficient of triangular labyrinth weirs using adaptive neuro-fuzzy inference system. Alex Eng J. 2018;57(3):1773–82.10.1016/j.aej.2017.05.005Search in Google Scholar
[7] Bousmar D. Flow modeling in compound channels. Unire de Genie Civil et Environnemental. Thesis presented for the degree of Doctor in Applied Sciences. Catholic University of Louvain, Belgium; 2002Search in Google Scholar
[8] Moreta & Martin-vide. Apparent friction coefficient in straight compound channels. Hydraulic, Maritime and Environmental Engineering Department, Technical University of Catalonia, Jordi Girona 1-3, D1, 08034, Barcelona, Spain; 2010. 10.1080/0022168100370404137.Search in Google Scholar
[9] Huai P, Xun H, Reilly KH, Wang Y, Ma W, Xi B. Physical activity and risk of hypertension a meta-analysis of prospective cohort studies. Hypertension. 2013;62:1021–6. 10.1161/HYPERTENSIONAHA.113.01965.Search in Google Scholar PubMed
[10] Bonakdari H, Zaji AH, Shamashirband S, Hashim R, Petkovic D. Sensitivity analysis of the discharge coefficient of modified triangular side weir by adaptive neuro-fuzzy methodology. Measurement. 2015;73:74–81. 10.1016/j.measurement.2015.05.021.Search in Google Scholar
[11] Mango LM, Melesse AM, McClain ME, Gann D, Setegn S. Land use and climate change impacts on the hydrology of the upper Mara River Basin, Kenya results of a modeling study to support better resource management. Hydrol Earth Syst Sci. 2011;15(7):2245–58. 10.5194/hess-15-2245-2011.Search in Google Scholar
[12] Khosravi K, Mao L, Kisi O, Yaseen ZM, Shahid S. Quantifying hourly suspended sediment load using data mining models: A case study of a glacierized Andean catchment in Chile. J Hydrol. 2018a;567:165–79. 10.1016/j.jhydrol.2018.10.015.Search in Google Scholar
[13] Naik B, Khatua KK, Wright N, Sleigh A, Singh P. Numerical modeling of converging compound channel flow. ISH J Hydraul Eng. 2018;24(3):285–97.10.1080/09715010.2017.1369180Search in Google Scholar
[14] Shatha A. Flow in an unsymmetrical compound channel. MSc thesis. Department of Dams and Water Resources Engineering, Iraq: College of Engineering, University of Mosul, 2000. p. 110.Search in Google Scholar
[15] Einstein HA. Formulas for the transportation of bed load. Trans Am Soc Civ Eng. 1942;107(1):561–77.10.1061/TACEAT.0005468Search in Google Scholar
[16] Azamathulla HM, Ghani AA, Zakaria NA. ANFIS-based approach to predicting scour location of the spillway. Proc Inst Civ Engineers-Water Manag. 2009;162(6):399–407.10.1680/wama.2009.162.6.399Search in Google Scholar
[17] Azamathulla HM, Deo MC, Deolalikar PB. Alternative neural networks to estimate the scour below spillways. Adv Eng Softw. 2008;39(8):689–98. 10.1016/j.advengsoft.2007.07.004.Search in Google Scholar
[18] Noori R, Deng Z, Kiaghadi A, Kachoosangi FT. How reliable are ANN, ANFIS, and SVM techniques for predicting longitudinal dispersion coefficient in natural rivers. J Hydraul Eng. 2015;142(1):04015039. 10.1061/(asce)hy.1943-7900.0001062.Search in Google Scholar
[19] Parsaie A, Haghiabi AH, Saneie M, Torabi H. Predication of discharge coefficient of cylindrical weir-gate using adaptive neuro-fuzzy inference systems (ANFIS), Frontiers Struct. Civ Eng. 2016;11:111–12. 10.1007/s11709-016-0354-x.Search in Google Scholar
[20] Parsaie A, Haghiabi AH. Prediction of side weir discharge coefficient using adaptive neuro-fuzzy inference system, Sustainable. Water Resour Manage. 2016;2(3):257–64. 10.1007/s40899-016-0055-6.Search in Google Scholar
[21] Parsaie A, Yonesi H, Najafian S. Prediction of flow discharge in compound open channels using adaptive neuro-fuzzy inference system method. Flow Meas Instrum. 2016;54:288–97. 10.1016/j.flowmeasinst.2016.08.013.Search in Google Scholar
© 2023 the author(s), published by De Gruyter
This work is licensed under the Creative Commons Attribution 4.0 International License.
Articles in the same Issue
- Regular Articles
- Design optimization of a 4-bar exoskeleton with natural trajectories using unique gait-based synthesis approach
- Technical review of supervised machine learning studies and potential implementation to identify herbal plant dataset
- Effect of ECAP die angle and route type on the experimental evolution, crystallographic texture, and mechanical properties of pure magnesium
- Design and characteristics of two-dimensional piezoelectric nanogenerators
- Hybrid and cognitive digital twins for the process industry
- Discharge predicted in compound channels using adaptive neuro-fuzzy inference system (ANFIS)
- Human factors in aviation: Fatigue management in ramp workers
- LLDPE matrix with LDPE and UV stabilizer additive to evaluate the interface adhesion impact on the thermal and mechanical degradation
- Dislocated time sequences – deep neural network for broken bearing diagnosis
- Estimation method of corrosion current density of RC elements
- A computational iterative design method for bend-twist deformation in composite ship propeller blades for thrusters
- Compressive forces influence on the vibrations of double beams
- Research on dynamical properties of a three-wheeled electric vehicle from the point of view of driving safety
- Risk management based on the best value approach and its application in conditions of the Czech Republic
- Effect of openings on simply supported reinforced concrete skew slabs using finite element method
- Experimental and simulation study on a rooftop vertical-axis wind turbine
- Rehabilitation of overload-damaged reinforced concrete columns using ultra-high-performance fiber-reinforced concrete
- Performance of a horizontal well in a bounded anisotropic reservoir: Part II: Performance analysis of well length and reservoir geometry
- Effect of chloride concentration on the corrosion resistance of pure Zn metal in a 0.0626 M H2SO4 solution
- Numerical and experimental analysis of the heat transfer process in a railway disc brake tested on a dynamometer stand
- Design parameters and mechanical efficiency of jet wind turbine under high wind speed conditions
- Architectural modeling of data warehouse and analytic business intelligence for Bedstead manufacturers
- Influence of nano chromium addition on the corrosion and erosion–corrosion behavior of cupronickel 70/30 alloy in seawater
- Evaluating hydraulic parameters in clays based on in situ tests
- Optimization of railway entry and exit transition curves
- Daily load curve prediction for Jordan based on statistical techniques
- Review Articles
- A review of rutting in asphalt concrete pavement
- Powered education based on Metaverse: Pre- and post-COVID comprehensive review
- A review of safety test methods for new car assessment program in Southeast Asian countries
- Communication
- StarCrete: A starch-based biocomposite for off-world construction
- Special Issue: Transport 2022 - Part I
- Analysis and assessment of the human factor as a cause of occurrence of selected railway accidents and incidents
- Testing the way of driving a vehicle in real road conditions
- Research of dynamic phenomena in a model engine stand
- Testing the relationship between the technical condition of motorcycle shock absorbers determined on the diagnostic line and their characteristics
- Retrospective analysis of the data concerning inspections of vehicles with adaptive devices
- Analysis of the operating parameters of electric, hybrid, and conventional vehicles on different types of roads
- Special Issue: 49th KKBN - Part II
- Influence of a thin dielectric layer on resonance frequencies of square SRR metasurface operating in THz band
- Influence of the presence of a nitrided layer on changes in the ultrasonic wave parameters
- Special Issue: ICRTEEC - 2021 - Part III
- Reverse droop control strategy with virtual resistance for low-voltage microgrid with multiple distributed generation sources
- Special Issue: AESMT-2 - Part II
- Waste ceramic as partial replacement for sand in integral waterproof concrete: The durability against sulfate attack of certain properties
- Assessment of Manning coefficient for Dujila Canal, Wasit/-Iraq
- Special Issue: AESMT-3 - Part I
- Modulation and performance of synchronous demodulation for speech signal detection and dialect intelligibility
- Seismic evaluation cylindrical concrete shells
- Investigating the role of different stabilizers of PVCs by using a torque rheometer
- Investigation of high-turbidity tap water problem in Najaf governorate/middle of Iraq
- Experimental and numerical evaluation of tire rubber powder effectiveness for reducing seepage rate in earth dams
- Enhancement of air conditioning system using direct evaporative cooling: Experimental and theoretical investigation
- Assessment for behavior of axially loaded reinforced concrete columns strengthened by different patterns of steel-framed jacket
- Novel graph for an appropriate cross section and length for cantilever RC beams
- Discharge coefficient and energy dissipation on stepped weir
- Numerical study of the fluid flow and heat transfer in a finned heat sink using Ansys Icepak
- Integration of numerical models to simulate 2D hydrodynamic/water quality model of contaminant concentration in Shatt Al-Arab River with WRDB calibration tools
- Study of the behavior of reactive powder concrete RC deep beams by strengthening shear using near-surface mounted CFRP bars
- The nonlinear analysis of reactive powder concrete effectiveness in shear for reinforced concrete deep beams
- Activated carbon from sugarcane as an efficient adsorbent for phenol from petroleum refinery wastewater: Equilibrium, kinetic, and thermodynamic study
- Structural behavior of concrete filled double-skin PVC tubular columns confined by plain PVC sockets
- Probabilistic derivation of droplet velocity using quadrature method of moments
- A study of characteristics of man-made lightweight aggregate and lightweight concrete made from expanded polystyrene (eps) and cement mortar
- Effect of waste materials on soil properties
- Experimental investigation of electrode wear assessment in the EDM process using image processing technique
- Punching shear of reinforced concrete slabs bonded with reactive powder after exposure to fire
- Deep learning model for intrusion detection system utilizing convolution neural network
- Improvement of CBR of gypsum subgrade soil by cement kiln dust and granulated blast-furnace slag
- Investigation of effect lengths and angles of the control devices below the hydraulic structure
- Finite element analysis for built-up steel beam with extended plate connected by bolts
- Finite element analysis and retrofit of the existing reinforced concrete columns in Iraqi schools by using CFRP as confining technique
- Performing laboratory study of the behavior of reactive powder concrete on the shear of RC deep beams by the drilling core test
- Special Issue: AESMT-4 - Part I
- Depletion zones of groundwater resources in the Southwest Desert of Iraq
- A case study of T-beams with hybrid section shear characteristics of reactive powder concrete
- Feasibility studies and their effects on the success or failure of investment projects. “Najaf governorate as a model”
- Optimizing and coordinating the location of raw material suitable for cement manufacturing in Wasit Governorate, Iraq
- Effect of the 40-PPI copper foam layer height on the solar cooker performance
- Identification and investigation of corrosion behavior of electroless composite coating on steel substrate
- Improvement in the California bearing ratio of subbase soil by recycled asphalt pavement and cement
- Some properties of thermal insulating cement mortar using Ponza aggregate
- Assessment of the impacts of land use/land cover change on water resources in the Diyala River, Iraq
- Effect of varied waste concrete ratios on the mechanical properties of polymer concrete
- Effect of adverse slope on performance of USBR II stilling basin
- Shear capacity of reinforced concrete beams with recycled steel fibers
- Extracting oil from oil shale using internal distillation (in situ retorting)
- Influence of recycling waste hardened mortar and ceramic rubbish on the properties of flowable fill material
- Rehabilitation of reinforced concrete deep beams by near-surface-mounted steel reinforcement
- Impact of waste materials (glass powder and silica fume) on features of high-strength concrete
- Studying pandemic effects and mitigation measures on management of construction projects: Najaf City as a case study
- Design and implementation of a frequency reconfigurable antenna using PIN switch for sub-6 GHz applications
- Average monthly recharge, surface runoff, and actual evapotranspiration estimation using WetSpass-M model in Low Folded Zone, Iraq
- Simple function to find base pressure under triangular and trapezoidal footing with two eccentric loads
- Assessment of ALINEA method performance at different loop detector locations using field data and micro-simulation modeling via AIMSUN
- Special Issue: AESMT-5 - Part I
- Experimental and theoretical investigation of the structural behavior of reinforced glulam wooden members by NSM steel bars and shear reinforcement CFRP sheet
- Improving the fatigue life of composite by using multiwall carbon nanotubes
- A comparative study to solve fractional initial value problems in discrete domain
- Assessing strength properties of stabilized soils using dynamic cone penetrometer test
- Investigating traffic characteristics for merging sections in Iraq
- Enhancement of flexural behavior of hybrid flat slab by using SIFCON
- The main impacts of a managed aquifer recharge using AHP-weighted overlay analysis based on GIS in the eastern Wasit province, Iraq