Comparison of milk consumption habits across two European countries: Pilot study in Portugal and France
-
Raquel P. F. Guiné
 ,
Sofia G. Florença
,
Sofia G. Florença

Abstract
Humans have been consuming milk obtained from domesticated animals since ancient times. Milk is a very complete food with important nutrients that can support life. However, the patterns of consumption of milk have been shifting. On one hand, due to the increase in the number of people with intolerances (to lactose, for example), and on the other hand, due to some trend to avoid foods from animal origin owing to specific conviction (like animal welfare, for example). In this context, this study focused on the milk consumption patterns in two different European Countries and the evaluation of possible differences. The object of study was milk obtained from animal sources, namely, cows, and no other derived fermented dairy products were included. For the development of the study, a questionnaire survey was applied to a sample of 542 participants from both countries using the Internet. The results showed that a high percentage of participants in both countries consume milk regularly, and the usual amount varies between 125 and 250 mL per day. For those who do not consume milk, the most relevant reason pointed out in both countries was because they do not feel the need to consume it. While in France, a high percentage also do not consume because they do not like milk, and in Portugal, a high percentage do not consume milk due to lactose intolerance. The most consumed is semi-skimmed milk, and preferences are towards consuming plain milk or consuming it with chocolate. Significant differences were found in the consumption of white brands, which are preferred in France, while in Portugal, consumers prefer commercial brands, as well as the preferred package, tetra packs for the Portuguese, while the French prefer plastic bottles. In conclusion, although the results showed some similar trends among the participants from both countries, some differences were also identified that can be used to better plan public policies in both countries.
1 Introduction
Milk constitutes a basic beverage of recognised importance in nutrition from birth to old age due to, among other factors, its richness in calcium, which is an essential mineral at all ages [1]. The recommended average daily intake of calcium is 800 mg/day, and a 250 mL cup of milk provides more than 35% of this recommended value, corresponding to 281 mg, although this is an average value, since for each age group, there are specific recommendations for the daily dosages of calcium. According to Ross et al. [2], adults aged 19–50 should consume 1,000 mg of calcium/day and people over 50 between 1,000 and 1,200 mg Ca/day. It is also relevant to consider pregnant and lactating women, who should consume between 1,000 and 1,300 mg of calcium per day [2].
In addition to being rich in calcium, milk contains proteins that help with muscle growth and improve the functioning of the nervous system. Milk is rich in vitamins of the B-complex and helps to control high blood pressure as it is rich in amino acids with anti-hypertensive properties. Milk has an important role in heart health, as indicated in the study by Gauntt et al. [3]. Also, the study by Shi et al. [4] revealed that the consumption of semi-skimmed milk is associated with a protective effect against hypertension.
Milk consumption has been decreasing in Portugal since there is more demand for vegetable drinks, which has caused disagreement among several specialists. In a study carried out by Cirilo et al. [5], the nutritional composition of vegetable beverages and cow’s milk was compared, and it was concluded that, from a nutritional point of view, vegetable beverages based on legumes, mainly soy, with adequate protein content and generally enriched with calcium, vitamin D, and vitamin B12 could be considered nutritional substitutes for ultra high temperature (UHT) cow milk. Other vegetable drinks, to be reliable nutritional substitutes for milk, will need to be fortified with calcium, vitamins D, and B12, in addition to adequate protein content [5]. The study by Anjos et al. [6] showed that in Portugal, nearly 60% of the female participants in a survey about plant-based beverages consumed these types of drinks, mostly among the population segments of young adults and adults up to 50 years old.
In a study on the sociodemographic influence and lifestyle factors on the consumption of dairy products in Portugal and Brazil, it was found that, in both countries, the consumption of dairy products was very low. Specifically, half of the participants do not consume semi-skimmed milk, but the number of consumers increases for chocolate-flavoured and fortified kinds of milk [7]. Although there are no such studies focusing on the differences between Portugal and France in the consumption of dairy products, and milk in particular, there are factors that influence dietary patterns in general between these two countries. While Portugal stands on the Iberian Peninsula and has dietary influences of the Atlantic Diet and the Mediterranean Diet (MD), it is one of the initial subscribers of the request for recognition of the cultural importance of this Diet. In 2013, the MD was inscribed on the Representative List of the Intangible Cultural Heritage of Humanity of the UN, following an application subscribed by seven Mediterranean countries (Croatia, Cyprus, Greece, Italy, Morocco, Portugal, and Spain) [8]. However, France does not have this influence, and the French people do not consume foods traditional of the MD with such regularity, like for example, olive oil used as the primary source of fat. Also, there are lifestyle characteristics that are quite different between Portuguese and French participants, and the lifestyles are unequivocally associated with dietary patterns.
One of the most recognised health benefits associated with the consumption of dairy products is the prevention of osteoporosis; due to the richness in calcium and vitamin D, many studies have demonstrated the role of milk in mitigating the effects of this age-related disease [9,10,11,12]. Wang et al. [13] described the role of calcium from fresh milk in ameliorating postmenopausal osteoporosis in a rat model through a gut microbiota role on bone metabolism. Ebeling [14] discussed the role of vitamin D in osteoporosis prevention and treatment by action of the active vitamin D metabolite, 1,25(OH)2D, on the intestine. However, the presence of vitamin D and calcium in milk are not the only elements associated with osteoporosis prevention and bone health. Zhang et al. [15] identified milk-derived peptides with a role in promoting calcium absorption and bone formation, thus improving bone microstructure in osteoporotic rats. Based on these results, they postulate that these milk constituents can have an impact on combating osteoporosis. Yun et al. [12] reported the role of dietary cow milk-derived exosomes as a prophylaxis to prevent the onset of osteoporosis based on an osteoporosis-induced mouse model, suggesting this as a promising alternative strategy to manage age-related bone complications. As such, milk is confirmed as having a composition beneficial to promote bone health and prevent osteoporosis.
However, it is important that the individuals are aware of the health benefits associated with regular milk consumption at all phases of life, from childhood up to elderhood. A study by Bréjon et al. [16] investigated the knowledge related to milk in two European countries and reported differences between Portuguese and French participants in what concerns their knowledge about milk composition and nutritive value as well as the effects of milk on human health, confirming that different environments (social, political, and educational) influence people’s knowledge.
Because milk has important beneficial effects on the human body, its consumption is recommended, and knowing its consumption habits is a relevant research issue. Therefore, the main objective of this work was to determine the consumption habits and preferences towards milk in a sample of Portuguese and French consumers and to identify possible differences among participants according to country.
2 Materials and methods
2.1 Research design and data collection
This is a transversal descriptive study based on a questionnaire survey. The instrument used to collect information consisted of four parts: the first one was destined to collect sociodemographic and anthropometric characteristics; the second one was to assess milk consumption habits; the third part was to investigate preferences in purchasing and consuming milk; and the last part aimed to assess the knowledge of the participants about the composition and benefits of milk. Appendix A presents the full version of the questionnaire used in the study in English Language. The questionnaire was translated into Portuguese and French to be disseminated among participants from these two countries. This article focuses on the data obtained in parts one, two, and three of the questionnaire.
The research targeted individuals over 18 years of age residing in Portugal and France. So, the inclusion criteria for the participants were being aged 18 years or over, with no upper limit for age, residing in Portugal or France, having the ability to read, understand, and reply to the questions, and having different sociodemographic characteristics, as to obtain people from different sociodemographic groups in terms of age, gender, level of education, professional status, or dimension of the household. Nevertheless, the equal representativeness of participants across sociodemographic groups was not guaranteed because recruitment was made using a non-probabilistic sample since snowball methodology was used to invite participants and a convenience sample was obtained. Data collection was carried out between September 2020 and May 2021, by dissemination on social networks and using email. Also, a request was given soliciting that each participant could disseminate the invitation to other potential participants further, using a snowball procedure. The sample consisted of 542 participants, of which 332 were French and 210 were Portuguese.
The anonymisation of the participants’ data was guaranteed, as well as other ethical issues to obey international standards for studies with human participants. All participants answered the questionnaire only after having given their informed consent.
-
Informed consent: Informed consent was obtained from all participants.
-
Ethical approval: The study was approved by the Ethics Committee of the Polytechnic University of Viseu with reference No. 11/SUB/2020.
2.2 Data analysis
The data were analysed using basic descriptive statistics such as frequency, mean, and standard deviation. The independent samples T-test was used to compare means across groups of participants, such as country or consumers/non-consumers of milk. Contingency tables and the chi-square test were also used to analyse differences in qualitative variables among groups.
The software used for data analysis was SPSS (Version 28) from IBM Inc., and the level of significance considered was 5% (p < 0.05).
3 Results
3.1 Sociodemographic and anthropometric characteristics of the participants in the study
The age of the participants varied from a minimum of 18 years to a maximum of 89, and was on average 31.91 ± 14.50 years on the global set of participants, being higher for the Portuguese (33.80 ± 13.99 years) than for the French (30.71 ± 14.71 years). The independent samples T-test, confirmed that age was significantly different according to country (t = 2.431, p = 0.015).
The distribution of the participants according to gender was 356 women and 177 men, corresponding to about two-thirds of female participants in the global sample (65.7%). Also, in this case significant differences were encountered for the two countries (Chi-square test: χ 2 = 37.306, p < 0.001), with percentages of female participants equal to 81.0% and 56.0% for Portugal and France, respectively.
The level of education of the participants was generally high, with 67.2% of participants having university studies, and the differences between countries were significant (Chi-square test: χ 2 = 45.764, p < 0.001), being the percentage of participants with university studies higher in the French sample (78.0%) than in the Portuguese sample (50.0%).
With respect to professional status, and considering the whole sample, 1.1% were domestic, 3.5% were retired, 5.2% were unemployed, 7.0% were chief, 9.8% were working students, 29.0% were students, 44.5% were employed. Significant differences were found between countries (Chi-square test: χ 2 = 77.056, p < 0.001). Higher discrepancies were observed for the percentage of students (19.5% in Portuguese and 34.9% in French participants) and those employed (62.9% in Portuguese and 32.8% in French participants).
The dimension of the household was found to be mostly one or two persons (44.2% of the participants), with 22.5% of the households having three persons and 33.0% having four or more members. Significant differences were found between the Portuguese and the French groups of participants (Chi-square test: χ 2 = 47.173, p < 0.001). In Portugal, there were much fewer households of only one person (6.7%) than in France (29.8%). On the other hand, in Portugal, the percentages of larger families were higher: 29.5% of households with three persons and 41.0% of households with four or plus persons, while in France, these percentages were 18.1% and 28.0%, respectively.
Table 1 presents the anthropometric characteristics of the participants in the study (weight, height, and body mass index [BMI]). The weight varied between 41 and 145 kg, with a mean value of 68.39 ± 15.53 kg for the global sample. The mean value for weight was higher for the French sample (69.11 ± 16.74 kg) when compared to the Portuguese (67.25 ± 13.34 kg), but these differences were not significant (T-test for independent samples: t = −1.360, p = 0.174). For the global sample, the height varied between 1.48 and 2.00 m, with a mean value of 1.68 ± 0.10 m. The height was higher for French participants than for the Portuguese (1.71 ± 0.10 and 1.65 ± 0.09 m, respectively), with a significant difference (T-test: t = −6.850, p < 0.001). The BMI varied from a minimum of 15.43 to a maximum of 48.33 kg/m2, being on average 23.90 ± 4.49 kg/m2 for the global sample. Once again, the difference between the Portuguese and the French participants was significant (T-test: t = 2.563, p = 0.005), with a higher mean value for Portuguese participants (24.52 ± 4.21 kg/m2) than for the French (23.51 ± 4.63 kg/m2).
Anthropometric characteristics of the participants
| Variable | Sample | N | Minimum | Maximum | Mean value ± SD 1 |
|---|---|---|---|---|---|
| Weight (kg) | Global | 541 | 41.0 | 145.0 | 68.4 ± 15.5 |
| Portugal | 210 | 42.0 | 107.0 | 67.3 ± 13.3 | |
| France2 | 331 | 41.0 | 145.0 | 69.1 ± 16.7 | |
| Height (m) | Global | 541 | 1.5 | 2.0 | 1.7 ± 0.1 |
| Portugal | 210 | 1.5 | 1.9 | 1.7 ± 0.1 | |
| France2 | 331 | 1.5 | 2.0 | 1.7 ± 0.1 | |
| BMI2 (kg/m2) | Global | 541 | 15.4 | 48.3 | 23.9 ± 4.5 |
| Portugal | 210 | 17.8 | 39.6 | 24.5 ± 4.2 | |
| France2 | 331 | 15.4 | 48.3 | 23.5 ± 4.6 |
1SD = Standard deviation; 2BMI = Body mass index (= weight/height^2). 2One of the French participants did not report weight and height, and thus, the value of N was lower in relation to the number of French participants, which was 322.
Figure 1 presents the distribution of the participants by the classes of BMI, according to the classification of the World Health Organisation [17]. The results indicate that in Portugal, the percentages of people with overweight and obesity are higher (22 and 12%, respectively) as compared with the participants from France (17% overweight and 9% obesity). In contrast, higher percentages of normal-weight participants were found in France (68%) than in Portugal (64%).
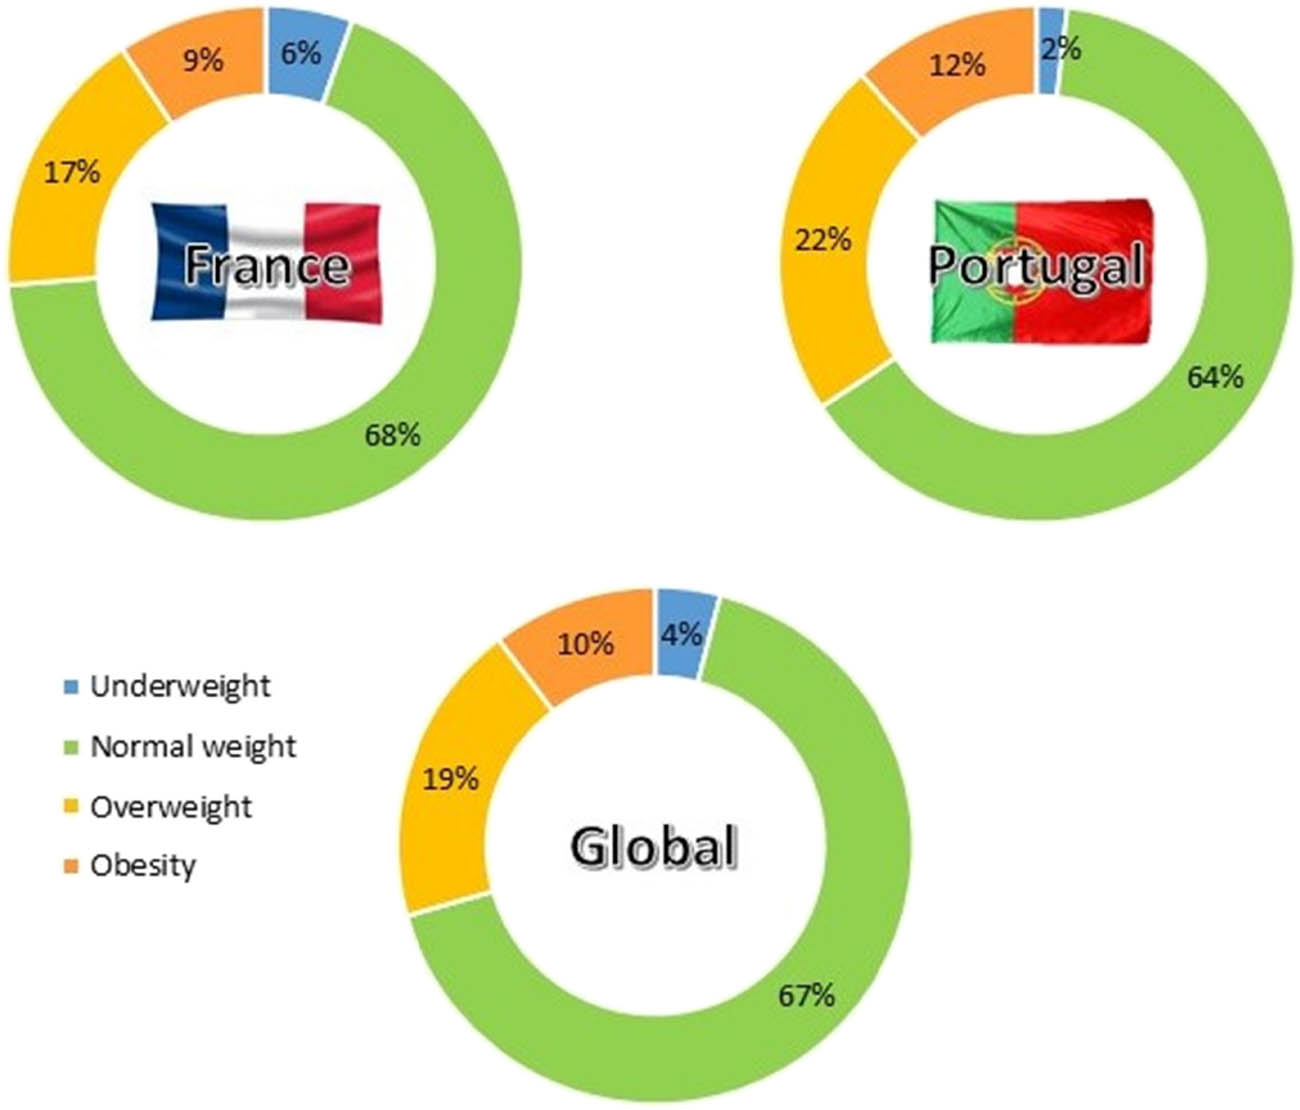
Distribution of the participants according to BMI (Classes of BMI: Underweight = BMI < 18.5 kg/m2, normal weight = 18.5 ≤ BMI < 25.0 kg/m2, overweight = 25.0 ≤ BMI < 30.0 kg/m2, and obesity = BMI ≥ 30.0 kg/m2).
3.2 Consumption habits
The results in Table 2 refer to consumption habits regarding milk. In both countries, the percentage of the population that consumes milk is high, about two-thirds (70.3% in global, 68.1% in Portugal, and 71.7% in France). Also, the amount consumed is similar in both countries, varying from 125 to 250 mL per day, without significant differences between countries. However, significant differences were found in the number of persons that consumed milk in the households of the participants, with a higher percentage for the Portuguese (48.3%) than the French (36.6%), saying that all household members consumed milk. Also, significant differences were found in the frequency of consumption, with a higher percentage of Portuguese people consuming once or twice per day (37.1% against 19.3% of the French). In both countries, people usually consume milk for breakfast.
Milk consumption habits according to the country
| Question | Answering options | Global sample (%) | Portuguese sample (%) | French sample (%) |
|---|---|---|---|---|
| Milk intake (n = 542) | Yes | 70.3 | 68.1 | 71.7 |
| No | 29.7 | 31.9 | 28.3 | |
| Chi-square test: χ 2 = 0.795, p = 0.373 | ||||
| Members of the household who consume milk (n = 381) | All | 40.9 | 48.3 | 36.6 |
| Only me | 18.4 | 6.3 | 25.6 | |
| Two people | 20.2 | 19.6 | 20.6 | |
| Three people | 12.6 | 19.6 | 8.4 | |
| Four or more people | 7.9 | 6.3 | 8.8 | |
| Chi-square test: χ 2 = 30.793, p < 0.001 | ||||
| Frequency of milk consumption (n = 381) | More than twice/day | 6.3 | 8.4 | 5.0 |
| 1−2 times/day | 26.0 | 37.1 | 19.3 | |
| Once/day | 25.2 | 25.9 | 24.8 | |
| 4−6 times/week | 9.7 | 7.0 | 11.3 | |
| 1−3 times/week | 16.8 | 15.4 | 17.6 | |
| Less than once/week | 16.0 | 6.3 | 21.8 | |
| Chi-square test: χ 2 = 27.960, p < 0.001 | ||||
| Daily amount of milk consumed (n = 381) | 125 mL (half cup) | 34.4 | 27.3 | 38.7 |
| 250 mL (one cup) | 38.3 | 46.2 | 33.6 | |
| 375 mL (1½ cups) | 17.3 | 17.5 | 17.2 | |
| Over 375 mL | 10.0 | 9.1 | 10.5 | |
| Chi-square test: χ 2 = 7.214, p = 0.065 | ||||
| Meals where milk is consumed* | Breakfast (n = 316) | 58.2 | 63.3 | 55.0 |
| Tea (n = 119) | 21.9 | 21.4 | 22.2 | |
| Before going to sleep (n = 55) | 10.1 | 15.2 | 6.9 | |
| Others (n = 32) | 5.9 | 1.0 | 9.0 | |
*Participants could select more than one option.
Table 3 presents the comparison of the sociodemographic characteristics between the participants who consume milk and those who do not. The results show that there were significant differences between milk consumers and non-milk consumers in terms of age and gender. No significant differences were encountered in all other sociodemographic variables. Regarding age, the results showed that the average age of the milk-consuming participants was lower, meaning that more young participants are milk consumers than older participants. As for gender, it was observed that there was a higher tendency for male participants to consume milk when compared with female participants.
Sociodemographic characteristics of the participants according to whether they are milk consumers or not
| Sociodemographic characteristics | Milk consumers (n = 381) | Non-milk consumers (n = 161) |
|---|---|---|
| Age (mead ± SD) | 31.0 ± 13.7 | 34.1 ± 16.0 |
| T- test for independent samples: | t = 2.109, p = 0.036 | |
| Gender | ||
| Female | 62.2% | 73.9% |
| Male | 36.7% | 23.0% |
| Other | 1.1% | 3.1% |
| Chi-square test: | χ 2 = 11.808, p = 0.003 | |
| Education level | ||
| Competed university studies | 33.3% | 31.7% |
| Under-university studies | 66.7% | 68.3% |
| Chi-square test: | χ 2 = 0.141, p = 0.708 | |
| Professional status | ||
| Unemployed | 5.8% | 3.7% |
| Student | 30.7% | 24.8% |
| Working student | 9.7% | 9.9% |
| Employed | 43.1% | 47.8% |
| Retired | 3.1% | 4.3% |
| Domestic | 0.8% | 1.9% |
| Entrepreneur | 6.8% | 7.5% |
| Chi-square test: | χ 2 = 4.561, p = 0.601 | |
| Household | ||
| Alone | 19.2% | 24.8% |
| Two persons | 21.8% | 28.0% |
| Three persons | 23.6% | 19.9% |
| Four persons or more | 35.4% | 27.3% |
| Chi-square test: | χ 2 = 6.532, p = 0.088 | |
Table 4 shows the results for milk consumption according to BMI, and it is visible that no significant associations were found between these variables (p = 0.767, p = 0.509, and p = 0.054, respectively, for consuming milk or not, for frequency of consumption, and for the amount of milk consumed). These results indicate that the consumption habits regarding milk do not significantly influence BMI. Nevertheless, it is worth mentioning that in relation to the amount of milk consumed daily, a trend is observed for an inverse relation between an increased amount and a reduced incidence of overweight or obesity, with a p-value very close to the limit of significance considered. As such, it does not appear that a higher consumption of milk contributes to increased body fat.
Milk consumption habits according to BMI
| Question | Answering options | Underweight (%) | Normal weight (%) | Overweight (%) | Obesity (%) |
|---|---|---|---|---|---|
| Milk intake (n = 542) | Yes | 31.8 | 30.0 | 26.3 | 33.9 |
| No | 68.2 | 70.0 | 73.8 | 66.1 | |
| Chi-square test: χ 2 = 1.140, p = 0.767 | |||||
| Frequency of milk consumption (n = 381) | More than twice/day | 20.0 | 5.6 | 7.9 | 2.7 |
| 1−2 times/day | 20.0 | 27.0 | 23.7 | 24.3 | |
| Once/day | 33.3 | 22.2 | 34.2 | 24.3 | |
| 4−6 times/week | 6.7 | 10.7 | 7.9 | 8.1 | |
| 1−3 times/week | 6.7 | 17.1 | 15.8 | 21.6 | |
| Less than once/week | 13.3 | 17.5 | 10.5 | 18.9 | |
| Chi-square test: χ 2 = 14.224, p = 0.509 | |||||
| Daily amount of milk consumed (n = 381) | 125 mL (half cup) | 20.0 | 34.5 | 30.3 | 48.6 |
| 250 mL (one cup) | 26.7 | 37.7 | 46.1 | 32.4 | |
| 375 mL (1½ cups) | 20.0 | 19.0 | 13.2 | 13.5 | |
| Over 375 mL | 33.3 | 8.7 | 10.5 | 5.4 | |
| Chi-square test: χ 2 = 16.693, p = 0.054 | |||||
According to the results presented in Figure 2, some participants who do not consume milk indicated their reasons as being highly related to not feeling the need to consume it (similar percentages in both countries – 27.7% for French and 22.4% for Portuguese participants). However, while for the French, a high percentage do not consume because they do not like it (33.05) compared with Portuguese (17.9%), a contradictory trend was observed for lactose intolerance, as being a reason for not consuming milk with much higher expression in Portugal (29.9%) than in France (7.4%). For those who have lactose intolerance, vegetable drinks appear to be a viable alternative, as indicated by 17.0% of the French participants and by 28.4% of the Portuguese.

Reasons why participants do not consume milk (n = 161).
3.3 Consumption and buying preferences
Table 5 presents the types of milk consumed, showing a high incidence of consumption of semi-skimmed milk in both countries and, most especially, in France (57.4% and 37.6% for French and Portuguese participants, respectively). Skimmed or whole kinds of milk, and those with chocolate flavour, aromatised, or even milk without lactose, are less consumed options in both countries.
Types of milk consumed
| Type1 | Global sample (n = 542) (% Yes) | Portuguese sample (n = 210) (% Yes) | French sample (n = 332) (% Yes) |
|---|---|---|---|
| Skimmed milk | 14.1 | 21.9 | 14.1 |
| Skimmed milk lactose free | 5.3 | 11.4 | 1.5 |
| Skimmed milk enriched | 1.1 | 2.9 | 0.0 |
| Skimmed milk chocolate flavour | 2.9 | 4.3 | 2.1 |
| Skimmed milk chocolate flavour lactose free | 0.9 | 2.4 | 0.0 |
| Skimmed milk aromatised (e.g.: strawberry, vanilla, …) | 0.4 | 0.5 | 0.3 |
| Semi-skimmed milk | 49.7 | 37.6 | 57.4 |
| Semi-skimmed milk lactose free | 5.0 | 7.6 | 3.3 |
| Semi-skimmed milk enriched | 0.0 | 0.0 | 0.0 |
| Semi-skimmed milk chocolate flavour | 7.4 | 7.1 | 7.5 |
| Semi-skimmed milk chocolate flavour lactose free | 1.3 | 1.0 | 1.5 |
| Semi-skimmed milk aromatised (e.g.: strawberry, vanilla, …) | 0.4 | 0.5 | 0.3 |
| Whole milk | 14.0 | 2.4 | 21.3 |
| Whole milk lactose free | 0.7 | 0.5 | 0.9 |
| Whole milk enriched | 0.2 | 0.5 | 0.0 |
| Whole milk chocolate flavour | 2.2 | 1.0 | 3.0 |
| Whole milk chocolate flavour lactose free | 0.9 | 0.0 | 1.5 |
| Whole milk aromatised (e.g.: strawberry, vanilla, …) | 0.0 | 0.0 | 0.0 |
1Participants could select more than one option.
Also, skimmed milk is consumed by important fractions of both samples (21.9% for Portuguese and 14.1% for French consumers), and whole milk is especially consumed by the French (21.3%) as compared with the Portuguese (2.4%).
Figure 3 shows the milk consumption preferences for the participants from both countries and also for the global sample. The participants from Portugal prefer consuming the milk with coffee, followed by plain milk and third, chocolate flavoured milk. For the French participants, the trend is highly different, with chocolate flavoured milk appearing as the first preference, followed by plain milk and third, milk with coffee.

Milk consumption preferences (n = 542 global, n = 332 for France, and n = 210 for Portugal).
Table 6 shows the buying preferences and habits of the Portuguese and French participants in the study. Statistically significant differences were observed regarding the preference for brand, with the Portuguese preferring commercial brands (72.0%) over white label brands, and an opposite result was found for the French, who prefer white label brands (52.1%). Also, significant differences were found for the preferred type of package, with a higher percentage of Portuguese preferring tetra pack (78.3% against 55.9% of the French) and a higher percentage of French preferring plastic bottles (38.7% against 17.5% of the Portuguese).
Buying preferences and habits
| Question | Answering options | Global sample (%) | Portuguese sample (%) | French sample (%) |
|---|---|---|---|---|
| Milk brand | Commercial brand | 57.0 | 72.0 | 47.9 |
| White label | 43.0 | 28.0 | 52.1 | |
| Chi-square test: χ 2 = 21.213, p < 0.001 | ||||
| Type of package | Tetra pack type | 64.3 | 78.3 | 55.9 |
| Plastic bottle | 30.7 | 17.5 | 38.7 | |
| Glass bottle | 5.0 | 4.2 | 5.5 | |
| Chi-square test: χ 2 = 20.322, p < 0.001 | ||||
| Reading the labels before deciding to buy milk | Yes | 53.9 | 51.4 | 55.5 |
| No | 46.1 | 48.6 | 44.5 | |
| Chi-square test: χ 2 = 0.588, p = 0.443 | ||||
| Number of packs of milk (containing 6 L) needed to satisfy household needs in one week | Less than one pack of 6 L | 58.0 | 40.6 | 68.5 |
| One pack of 6 L | 26.8 | 36.4 | 21.0 | |
| Two packs of 6 L | 13.6 | 20.3 | 9.7 | |
| Three or more packs of 6 L | 1.6 | 2.8 | 0.8 | |
| Chi-square test: χ 2 = 29.427, p < 0.001 | ||||
| Ideal quantity of milk per package | 0.5 L | 18.6 | 16.1 | 20.2 |
| 1 L | 44.1 | 56.6 | 36.6 | |
| 1.5 L | 14.7 | 15.4 | 14.3 | |
| 2 L | 13.9 | 8.4 | 17.2 | |
| 3 or more L | 8.7 | 3.5 | 11.8 | |
| Chi-square test: χ 2 = 21.112, p < 0.001 | ||||
| Who does the shopping for the household* | Myself | 54.3 | 56.2 | 53.2 |
| My mother | 26.7 | 27.6 | 26.1 | |
| My father | 10.7 | 11.4 | 10.2 | |
| My brother/sister | 2.4 | 3.3 | 1.8 | |
| Other family members | 7.6 | 10.0 | 6.0 | |
| Other persons | 2.2 | 1.4 | 2.7 | |
| Influence of people from the household in milk buying choices* | Nobody | 38.1 | 31.9 | 42.0 |
| All of them | 7.2 | 13.3 | 3.3 | |
| My children | 5.3 | 6.7 | 4.5 | |
| My parents | 4.6 | 6.2 | 3.6 | |
| My grandchildren | 0.2 | 0.5 | 0.0 | |
| Others | 3.9 | 1.9 | 5.1 | |
*Participants could select more than one option.
In both countries, nearly half of the participants did not read the label when purchasing milk (48.6% of the Portuguese and 44.5% of the French).
The milk consumption per household is significantly higher for the Portuguese than for the French participants (36.4% of the Portuguese replied that one pack of 6 L satisfied their weekly needs, while for 68.5% of the French, less than one pack of 6 L is enough). Most people in both countries consider that 1 L is the ideal amount of milk per package, and the majority of the respondents do the shopping themselves and say that nobody influences their choice when purchasing milk.
Figure 4 presents the most influencing factors that determine the buying of milk. Price and quality are on top of the list for consumers from both countries, but particularly for the Portuguese, who attribute to quality the highest relevance (51.9%) followed by price (44.3%).

Major factors influencing milk purchase.
4 Discussion
The age of the participants in the study was, on average, around 32 years, which indicates a high percentage of young participants, namely, young adults, considering that only people aged 18 years or more were recruited to participate in the study. Also, the educational level was high for the majority of the participants, two-thirds of whom had university studies, which is indicative of a young and highly literate sample in general. This might be related to the recruitment method used, which was a snowball invitation starting among university communities, thus including typically young adults with a university graduation. According to Leighton et al. [18], snowball recruitment of survey participants constitutes an effective recruitment method through social media. Armoogum et al. [19] evaluated individuals with respect to sampling, nonresponse, and quality of the participants engaging in surveys and highlighted that the rates of response have been continuously declining for some decades in a high number of countries. The utilisation of close contacts to disseminate the survey through email and social media is a useful starting point to obtain the desired number of participants, although it has some limitations, namely, uneven group representativeness.
There were more female participants than males, in a ratio of 2 to 1, which is a trend observed usually when convenient samples are used in survey studies. This might be due to a higher disposition of female participants to respond to this type of invitation when compared to men, and more specifically, when the topic is related to food or drink. Similar gender percentages have been found for studies made through questionnaire surveys about knowledge regarding food safety and food handling practices [20], the impact of sugar-sweetened beverages taxation [21], or exploring food and beverage pairing among different countries [22].
The households of the participants were constituted by one or two persons in the majority of cases, nearly half, with one-third having four or more members. The households are variable across time and cultures as well as across social statuses or economic availability. Typically, in Europe, the households are small, with up to four members, accounting for two parents and two children. This is intimately linked with demographics and with economic or life limitations, namely, considering both parents working status. This is a problem across Europe, as highlighted in the Euronews report [23], according to which, in 2022, the number of live births in the European Union reached its lowest level since 1960. The number of live births from women in France was 1.79, while in Portugal, it was 1.43, with an average in the EU of 1.46 births/women.
The results indicated similarities between the two countries in relation to the percentage of people who consume milk regularly, about two-thirds, as well as about the consumed amount, variable between 125 and 250 mL per day, and regarding the moment of consumption, mostly at breakfast. In the study by Guiné et al. [24] investigating the breakfast habits among participants from Brazil and Portugal, it was observed that a high percentage of participants from both countries consumed milk at breakfast (77% in Brazil and 79% in Portugal). Contrarily, the study by Reeves et al. [25], investigating the breakfast habits in UK sample, did not point out milk as typically included in the participants’ breakfast.
Regarding the reasons for not consuming milk, some participants indicated not liking milk, others did not feel the need to consume it, and some participants did not consume it due to lactose intolerance, and replaced it with vegetable-based beverages. However, from a nutritional point of view, not all vegetable drinks are reliable substitutes for milk. Vegetable drinks based on legumes, mainly soy, with adequate protein content and generally enriched with calcium, vitamin D, and vitamin B12, can be considered nutritional substitutes for UHT cow milk. Other vegetable drinks, to be reliable nutritional substitutes for milk, will need to be fortified with calcium, vitamin, D and vitamin B12, in addition to adequate protein content [5]. Nevertheless, these plant-based beverages as an alternative to milk have gained space in the food systems, and new developments have been achieved to improve their nutritional and functional properties. One such approach was to improve plant-based fermented drinks through probiotics yeasts and antioxidant components [26]. A review by Sharma et al. [27] evidences some key challenges related to functional plant-based drinks.
The most consumed type of milk in both countries was semi-skimmed milk. In fact, this type of milk associates the reduction in fat, thus contributing to a healthier diet, while also not totally eliminating it and thus preserving the fat-soluble vitamins present in milk, vitamins A and D. These vitamins are relevant for the health and wellbeing of individuals, and most particularly vitamin D, which, associated with calcium, has a pivotal role on bone health at all age phases [28,29,30,31]. A study by Shi et al. [4] revealed that the consumption of semi-skimmed milk is associated with a protective effect against hypertension. Skimmed milk contains only trace amounts of fat, which can be helpful for some people, especially if they want to control their body weight or lose weight, but on the other hand, removing the fat compromises the presence of fat-soluble vitamins, particularly vitamins A and D, being vitamin D particularly relevant to help in the metabolism of calcium [32,33].
In a study on the sociodemographic influence and lifestyle factors on the consumption of dairy products in Portugal and Brazil, it was found that, in both countries, the consumption of dairy products was below the recommended and, regarding semi-skimmed milk, half of the participants do not consume it, but the number of consumers increases for chocolate flavoured and fortified kinds of milk [7].
Consumer preferences were focused not only on plain milk but also on milk with coffee and chocolate-flavoured milk. While the Portuguese prefer milk with coffee, the French prefer chocolate-flavoured milk. The study by Guiné et al. [24] also confirmed a preference among the Portuguese to consume milk with coffee over milk with chocolate, and this was also evidenced for the Brazilian consumers. Although Portugal and France are among the top ten European countries in terms of coffee consumption in 2024, Portugal occupies the ninth position with 4.0 kg per capita annually, while France is in tenth position with 3.4 kg per capita annually [34].
Differences were encountered in the preference for brand, with the Portuguese preferring commercial brands and the French preferring white-label products. These white label products are sold by retailers with their own branding and logo but the products themselves are manufactured by a third party. White-label products, despite their similar quality, tend to be cheaper due to lower product development and marketing costs [35].
The preferred type of package was also different among Portuguese and French participants. While a higher percentage of Portuguese prefer tetra packs, a higher percentage of French prefer plastic bottles. The environmental impact of these packages is different, with full plastic bottles being more detrimental than the packages composed of card and only a thin plastic film. The reduction in plastic food packages is a priority, especially when it comes to single use plastics, due to the risks to human health and for the ecosystems [36,37,38,39].
Most people in both countries consider that 1 L is the ideal amount of milk per package. According to the results obtained in a study characterising the milk consumption in the municipality of Palmeira das Missões, in Brazil [40], the tetra pack type of package was also the most preferred. In this study, results similar to those of the present study were also obtained in relation to the ideal amount of milk per package.
In both countries, nearly half of the participants do not read the label when purchasing milk. The information contained in the labels is highly relevant, containing not only nutritional information but also details about the product. Not reading the label is very common among shoppers, and those who read the labels are better informed about healthy food choices [41].
Quality and price are on top of the list for the most influencing factors that determine the buying of milk among consumers from both countries. This is corroborated by another study by Mallmann et al. [40], according to which the most influential factor determining the purchase of milk is quality, followed by price.
5 Conclusion
This study compared the milk consumption patterns and preferences across Portugal and France. The results showed that in both countries, a high percentage of participants consume milk (more than two-thirds) and that most people consume between 125 and 250 mL of milk per day, with no significant differences found between countries. On the other hand, significant differences were encountered in the frequency of consumption, with a significantly higher percentage of Portuguese than French consuming milk once or twice per day. For those who do not consume milk, not liking or not feeling the need to consume are the most relevant justifications pointed out, as well as intolerances, with a higher incidence of lactose intolerance among the Portuguese as compared with the French. Also, vegetable drinks have been identified as alternatives to animal milk consumption. The results further showed that semi-skimmed milk is by far the most consumed in both countries, and preferences are towards consuming plain milk as well as milk with chocolate. Buying preferences indicated significant differences regarding the brand, with many more French preferring the white label brands as compared to the Portuguese, who in turn prefer the tetra pack type of package while the French prefer plastic bottles. Finally, it was observed that the most influencing factors when purchasing milk are, by far, the price and quality, with similar trends in both countries.
These results indicate that, despite some trend to reduce milk consumption due to negative perceptions about its health effects, consumers in both countries are adhering to milk as a staple food. Furthermore, in Portugal, this adherence is stronger, showing a preference for products of animal origin, including dairy products and milk in particular.
Considering the results of the study, the research team recognises that focusing on other dairy products, such as yoghurt, cheese, and butter, might also be a very promising line of study in the near future and that comparing other countries would also be beneficial to understand regional asynchronies in the food consumption patterns.
Acknowledgements
This work was originated through ERASMUS students interchange and in the ambit of the Curricular Unit of Project within the course on Food Quality and Nutrition of Agrarian School of the Polytechnic University of Viseu. Additionally, the work was supported by the FCT – Foundation for Science and Technology, I.P. Furthermore, we would like to thank the CERNAS (doi: 0.54499/UIDB/00681/2020), UICISA:E (doi: 10.54499/UIDB/00742/2020) and CI&DEI (doi: 10.54499/UIDB/05507/2020) Research Centres and the Polytechnic University of Viseu for their support.
-
Funding information: We received funding from the FCT – Foundation for Science and Technology (Portugal) through projects Refs. UIDB/00681/2020, UIDB/00742/2020 and UIDB/05507/2020. The APC was funded by FCT through projects Refs. UIDB/00681/2020, UIDB/00742/2020 and UIDB/05507/2020.
-
Author contributions: All authors accepted the responsibility for the content of the manuscript and consented to its submission, reviewed all the results, and approved the final version of the manuscript. Conceptualisation: R.P.F.G.; methodology: R.P.F.G.; software: R.P.F.G.; investigation: M.B., and R.P.F.G.; validation: R.P.F.G., and S.G.F.; formal analysis: R.P.F.G., and S.G.F.; resources: R.P.F.G., A.F., and M.F.; data curation: R.P.F.G.; writing – original draft preparation: R.P.F.G., and S.G.F.; writing – review and editing: R.P.F.G., S.G.F., J.C.G., M.J.B., and C.A.C.; visualisation: R.P.F.G.; supervision: R.P.F.G.; project administration: R.P.F.G.; funding acquisition: M.F., R.P.F.G., A.F., and J.C.G.
-
Conflict of interest: Authors state no conflict of interest.
-
Data availability statement: All data generated or analysed during this study are reported in this published article.
Questionnaire about milk consumption habits
In this appendix is given the survey with all questions as they were presented to the participants in the study.
Part I – Sociodemographic data
Age: _____ years
Gender: Female ( ) Male ( ) Other ( )
Weight: ______ kg
Height: ______ m
Level of education:
No school education ( ) Basic School ( ) Secondary School ( ) Technical/Professional course ( )
University degree or higher ( )
Professional status:
Unemployed ( ) Student ( ) Working student ( )
Employed ( ) Retired ( ) Domestic ( ) Entrepreneur ( )
Dimension of the household:
Live alone ( ) Two people ( ) Three people ( ) Four or more people ( )
Part II – Data relative to the consumption of bovine milk
Do you consume bovine milk? Yes ( ) No ( )
If you answered “No” in the previous question, indicate the motive why you do not consume cow milk. If you replied “Yes,” please ignore this question.
I do not like ( ) I do not feel the need ( ) I have intolerances ( )
I consume milk from other animal(s) ( ) I consume vegetable beverages ( )
My family does not consume ( )Other: _________________
In your household how many people consume milk?
All ( ) Just me ( ) Two people ( ) Three people ( )
Four or more people ( )
How frequently do you consume milk?
More than twice per day ( ) One or two times per day ( )
Once per day ( ) Four to six times per week ( )
One to three times per week ( ) Less than once per week ( )
What is the approximate quantity you consume per day?
Half cup – 125 mL ( ) One cup – 250 mL ( )
One cup and a half – 375 mL ( ) Over 375 mL ( )
At what meals do you usually consume milk? (You may choose more than one option)
Breakfast ( ) Tea ( ) Before going to bed ( )
Other: _________________
Part III – Preferences related to consumption and purchase
What type(s) of milk do you consume? (You may choose more than one option)
Type of milk Simple Without lactose Enriched Chocolate flavour Chocolate flavour without lactose With aromas (vanilla, strawberry, …) Whole fat Semi-skimmed Skimmed How do you like to consume the milk? (You may choose more than one option)
Simple ( ) with powdered chocolate ( ) With sugar ( )
With coffee ( ) With barley powder ( ) In milkshakes ( )
Other: __________________
What type of milk brand do you prefer?
Commercial brand ( ) White label ( )
What type of package do you prefer?
Tetra pack type ( ) Plastic bottle ( ) Glass bottle ( )
How many packs of milk (containing 6 L) you need to buy to satisfy your household needs in one week?
Less than 1 pack of 6 L ( ) One pack of 6 L ( )
Two packs of 6 L ( ) Three or more packs of 6 L ( )
What would be the ideal quantity of milk per package for your household?
0.5 L ( ) 1 L ( ) 1.5 L ( ) 2 L ( )
3 or more L ( )
Who does the shopping for your household? (You may choose more than one option)
Myself ( ) My mother ( ) My father ( ) My brother/sister ( )
Other family members ( ) Other persons ( )
In case you replied “Myself” in the previous question, is there anyone in your household who influences your choices when buying milk? (You may choose more than one option)
Nobody ( ) All of them ( ) My children ( ) My parents ( )
My grandchildren ( ) Others ( )
Do you usually read the labels before deciding to purchase?
Yes ( ) No ( )
What is the determining factor when buying milk? (You may choose more than one option)
Price ( ) Quality ( ) Brand ( ) Package ( ) Other: ___________
Parte IV – Knowledge about composition and benefits of milk
On a scale from 1–5, rate your answer to the following statements:
Scale: totally disagree (1), disagree (2), indifferent (3), agree (4), totally agree (5)
| Statement | 1 | 2 | 3 | 4 | 5 |
|---|---|---|---|---|---|
| 1. Milk is a food with high nutritional value | |||||
| 2. Milk contains proteins, carbohydrates, lipids, vitamins, minerals, and water | |||||
| 3. Milk provides proteins of high biological value as they contain essential amino acids | |||||
| 4. The main proteins in milk are caseins and whey proteins | |||||
| 5. Lactose is the main sugar in milk | |||||
| 6. Lactose is directly absorbed by the body without needing enzymes | |||||
| 7. Whole milk has a fat content typically over 3.5% | |||||
| 8. Semi-skimmed milk has a fat content of around 1% | |||||
| 9. Skimmed milk has a maximum fat content of 0.5% | |||||
| 10. The main vitamins in milk are vitamins B2, B12, and A | |||||
| 11. Vitamin A is naturally present in milk fat | |||||
| 12. Skimmed milk has very small amounts of vitamin A | |||||
| 13. Milk is a good source of calcium and iodine | |||||
| 14. Milk provides minerals like potassium, zinc, phosphorus, and magnesium | |||||
| 15. Calcium is fundamental for the good formation of bones and teeth | |||||
| 16. Calcium-fortified milk is a great choice to meet daily calcium requirements for those who do not consume dairy products or other calcium-rich products | |||||
| 17. Vitamin D favours the body’s absorption of calcium | |||||
| 18. Children, as they are in a phase of growth of bone and dental formation, need to ingest calcium, as well as vitamin A, B complex vitamins, and some minerals that are present in milk | |||||
| 19. Around the age of 30, the bone mass peak is reached, and therefore there is no problem if you stop consuming milk | |||||
| 20. Women, during menopause, tend to lose calcium and, consequently, bone mass | |||||
| 21. Pregnant and breastfeeding women should consume specific amounts of calcium per day. At this stage, the need for B vitamins also increases | |||||
| 22. The elderly should increase their intake of micronutrients such as B vitamins, calcium, and iron. A great source of these micronutrients is milk | |||||
| 23. The intake of milk is advised at all stages of life |
References
[1] Muniz LC, Madruga SW, Araújo CL. Consumption of dairy products by adults and the elderly in the south of Brazil: A population-based study. Ciênc Saúde Coletiva. 2013;18:3515–22. 10.1590/S1413-81232013001200008.Search in Google Scholar
[2] Ross AC, Abrams SA, Aloia JF, Brannon PM, Clinton SK, Durazo-Arvizu RA, et al. IOM report sets new dietary intake levels for calcium and vitamin D to maintain health and avoid risks associated with excess. Washington, USA: The National Academies of Sciences Engineering Medicine; 2010.Search in Google Scholar
[3] Gauntt J, Tucker A, Dolan K, Gajarski R, Krawczeski CD. Increasing the percentage of neonates consuming human milk in a pediatric cardiothoracic intensive care unit: A quality improvement initiative. J Pediatr. 2023;258:113441. 10.1016/j.jpeds.2023.113441.Search in Google Scholar PubMed
[4] Shi Z, Zhao Z, Zhu P, An C, Zhang K. Types of milk consumed and risk of essential hypertension: A 2-sample Mendelian randomisation analysis. J Dairy Sci. 2023;106:4516–23. 10.3168/jds.2022-22392.Search in Google Scholar PubMed
[5] Cirilo GMD, Olivieri CMR, Martins MCT. Bebidas vegetais alternativas ao leite: Comparação nutricional com leite de vaca. Life Style. 2020;7:15–25. 10.19141/2237-3756.lifestyle.v7.n1.p15-25.Search in Google Scholar
[6] Anjos O, Pires PCP, Gonçalves J, Estevinho LM, Mendonça AG, Guiné RPF. Plant-based beverages: Consumption habits, perception and knowledge on a sample of Portuguese citizens. Foods. 2024;13:3235. 10.3390/foods13203235.Search in Google Scholar PubMed PubMed Central
[7] Guiné RPF, Florença SG, Carpes S, Anjos O. Study of the influence of sociodemographic and lifestyle factors on consumption of dairy products: Preliminary study in Portugal and Brazil. Foods. 2020;9:1775. 10.3390/foods9121775.Search in Google Scholar PubMed PubMed Central
[8] Papageorgiou M, Zinoviadour KG, Guiné RPF. Mediterranean habits and patterns of consumption; interrelation with sustainability aspects. In: Betoret N, Betoret E, editors. Resources, strategies and potentialities for food system sustainability in the Mediterranean area, Vol. Chap. 8. Valencia, Spain: CEMAS/FAO; 2022. p. 132–52.Search in Google Scholar
[9] Fardellone P, Séjourné A, Blain H, Cortet B, Thomas T. Osteoporosis: Is milk a kindness or a curse? Jt Bone Spine. 2017;84:275–81. 10.1016/j.jbspin.2016.06.006.Search in Google Scholar PubMed
[10] Fatchiyah F, Setiawan B, Suharjono S, Noor Z. The anti-osteoporosis effects of CSN1S2 protein of goat milk and yoghurt on a complete Freund’s adjuvant-induced rheumatoid arthritis model in rats. Biomarkers Genomic Med. 2015;7:139–46. 10.1016/j.bgm.2015.10.001.Search in Google Scholar
[11] Matía-Martín P, Torrego-Ellacuría M, Larrad-Sainz A, Fernández-Pérez C, Cuesta-Triana F, Rubio-Herrera MÁ. Effects of milk and dairy products on the prevention of osteoporosis and osteoporotic fractures in Europeans and non-Hispanic whites from North America: A systematic review and updated meta-analysis. Adv Nutr. 2019;10:S120–43. 10.1093/advances/nmy097.Search in Google Scholar PubMed PubMed Central
[12] Yun B, Maburutse BE, Kang M, Park MR, Park DJ, Kim Y, et al. Short communication: Dietary bovine milk-derived exosomes improve bone health in an osteoporosis-induced mouse model. J Dairy Sci. 2020;103:7752–60. 10.3168/jds.2019-17501.Search in Google Scholar PubMed
[13] Wang Q, Liu B, Li X, Zhao J, Zhang Z, Qiao W, et al. Calcium-fortified fresh milk ameliorates postmenopausal osteoporosis via regulation of bone metabolism and gut microbiota in ovariectomised rats. Food Sci Hum Wellness. 2024;13:1258–70. 10.26599/FSHW.2022.9250105.Search in Google Scholar
[14] Ebeling PR. Chapter 70 - Vitamin D and osteoporosis. In Hewison M, Bouillon R, Giovannucci E, Goltzman D, Meyer M, Welsh J, editors. Feldman and pike’s vitamin D. 5th edn. Academic Press; 2024. p. 411–33. 10.1016/B978-0-323-91338-6.00020-3.Search in Google Scholar
[15] Zhang Y, Niu Y, Fu C, Zhu L, Wang H, Yi Y, et al. Preparation, identification and screening of anti-osteoporosis milk-derived peptides: Intervention effects in osteoporosis rats. Food Biosci. 2024;62:105120. 10.1016/j.fbio.2024.105120.Search in Google Scholar
[16] Bréjon M, Tavares F, Florença SG, Gonçalves JC, Barroca MJ, Guiné RPF. Knowledge about consumption of milk: Study involving consumers from two European countries – France and Portugal. Open Agric. 2024;9:e2022036. 10.1515/opag-2022-0362.Search in Google Scholar
[17] Ferrão AC, Guiné RPF, Correia PMR. Study of consumer acceptance about the possible commercialisation of a cheese with berries. Curr Nutr Food Sci. 2019;15:185–95.10.2174/1573401313666170707103933Search in Google Scholar
[18] Leighton K, Kardong-Edgren S, Schneidereith T, Foisy-Doll C. Using social media and snowball sampling as an alternative recruitment strategy for research. ClSimul Nurs. 2021;55:37–42. 10.1016/j.ecns.2021.03.006.Search in Google Scholar
[19] Armoogum J, Wittwer R, Madre J-L, Gopal Y. Sampling, nonresponse, and quality in travel surveys. Transp Res Procedia. 2024;76:638–43. 10.1016/j.trpro.2023.12.085.Search in Google Scholar
[20] Lazou T, Georgiadis M, Pentieva K, McKevitt A, Iossifidou E. Food safety knowledge and food-handling practices of Greek university students: A questionnaire-based survey. Food Control. 2012;28:400–11. 10.1016/j.foodcont.2012.05.027.Search in Google Scholar
[21] Wang J, Wei Y, Galizzi MM, Kwan HS, Zee BCY, Fung H, et al. Evaluating the impact of sugar-sweetened beverages tax on overweight, obesity, and type 2 diabetes in an affluent Asian setting: A willingness-to-pay survey and simulation analysis. Prev Med. 2024;184:107994. 10.1016/j.ypmed.2024.107994.Search in Google Scholar PubMed
[22] Arellano-Covarrubias A, Varela P, Escalona-Buendía HB, Gómez-Corona C, Galmarini M. Exploring food and beverage pairing from a cross-cultural projective mapping. Food Res Int. 2024;189:114515. 10.1016/j.foodres.2024.114515.Search in Google Scholar PubMed
[23] Yanatma. Europe’s fertility crisis: Which countries are having the most and fewest babies? | Euronews 2024. https://www.euronews.com/health/2024/09/28/europes-fertility-crisis-which-european-country-is-having-the-fewest-babies (accessed October 23, 2024).Search in Google Scholar
[24] Guiné RPF, Gonçalves C, Carpes ST, Vieira VL, Florença SG, Gonçalves JC, et al. Breakfast habits and knowledge: Study involving participants from Brazil and Portugal. Open Agric. 2023;8:20220150. 10.1515/opag-2022-0150.Search in Google Scholar
[25] Reeves S, Halsey LG, McMeel Y, Huber JW. Breakfast habits, beliefs and measures of health and wellbeing in a nationally representative UK sample. Appetite. 2013;60:51–7. 10.1016/j.appet.2012.09.024.Search in Google Scholar PubMed
[26] Agarbati A, Canonico L, Ciani M, Morresi C, Damiani E, Bacchetti T, et al. Functional potential of a new plant-based fermented beverage: Benefits through non-conventional probiotic yeasts and antioxidant properties. Int J Food Microbiol. 2024;424:110857. 10.1016/j.ijfoodmicro.2024.110857.Search in Google Scholar PubMed
[27] Sharma N, Yeasmen N, Dubé L, Orsat V. A review on current scenario and key challenges of plant-based functional beverages. Food Biosci. 2024;60:104320. 10.1016/j.fbio.2024.104320.Search in Google Scholar
[28] Menon AS, Kotwal N. Vitamin D supplement in elderly: How vital is it for bone health? Med J Armed Forces India. 2024;9(4):89–95. 10.1016/j.mjafi.2024.04.008.Search in Google Scholar
[29] Bouftas F, DeVries C. Vitamin D and pediatric bone health: Important information and considerations for the pediatric orthopaedic surgeon. J Pediatr Orthop Soc North Am. 2024;7:100042. 10.1016/j.jposna.2024.100042.Search in Google Scholar
[30] Khadilkar A, Oza C, Antani M, Shah N, Lohiya N, Khadilkar V, et al. Effect of calcium and vitamin D supplementation (dairy vs. pharmacological) on bone health of underprivileged Indian children and youth with type-1 diabetes: A randomized controlled trial. J Clin Densitometry. 2024;27:101468. 10.1016/j.jocd.2024.101468.Search in Google Scholar PubMed
[31] Stevens CM, Bhusal K, Levine SN, Dhawan R, Jain SK. The association of vitamin C and vitamin D status on bone mineral density and VCAM-1 levels in female diabetic subjects: Is combined supplementation with vitamin C and vitamin D potentially more successful in improving bone health than supplementation with vitamin D alone? Hum Nutr Metab. 2023;34:200221. 10.1016/j.hnm.2023.200221.Search in Google Scholar
[32] Cline J. Calcium and vitamin D metabolism, deficiency, and excess. Top Companion Anim Med. 2012;27:159–64. 10.1053/j.tcam.2012.09.004.Search in Google Scholar PubMed
[33] Hamdy RC. Bone health, calcium, vitamin D metabolism, and gastro-intestinal diseases. J Clin Densitometry. 2020;23:153–4. 10.1016/j.jocd.2020.03.001.Search in Google Scholar PubMed
[34] Top 10 countries that consume coffee in Europe – International Supermarket News 2024. https://internationalsupermarketnews.com/archives/14728 (accessed October 23, 2024).Search in Google Scholar
[35] QL2. White label vs. Private label: What’s the difference? | QL2 - Right price every time 2021. https://ql2.com/blog/white-label-vs-private-label-whats-the-difference/ (accessed October 23, 2024).Search in Google Scholar
[36] Gündoğdu S, Bour A, Köşker AR, Walther BA, Napierska D, Mihai F-C, et al. Review of microplastics and chemical risk posed by plastic packaging on the marine environment to inform the Global Plastics Treaty. Sci Total Environ. 2024;946:174000. 10.1016/j.scitotenv.2024.174000.Search in Google Scholar PubMed
[37] Miao S, Wang X, Zhu Q, Liao C, Jiang G. Migration patterns of organophosphate esters from plastic food packaging simulants to foods: Donors, behaviours, and influencing factors. Sci Total Environ. 2024;954:176272. 10.1016/j.scitotenv.2024.176272.Search in Google Scholar PubMed
[38] Meng W, Chen Q, Zhang Y, Sun H, Li J, Sun H, et al. Tracking chemical feature releases from plastic food packaging to humans. J Hazard Mater. 2024;480:135897. 10.1016/j.jhazmat.2024.135897.Search in Google Scholar PubMed
[39] Ceballos-Santos S, de Sousa DB, García PG, Laso J, Margallo M, Aldaco R. Exploring the environmental impacts of plastic packaging: A comprehensive life cycle analysis for seafood distribution crates. Sci Total Environ. 2024;951:175452. 10.1016/j.scitotenv.2024.175452.Search in Google Scholar PubMed
[40] Mallmann E, Cavalheiro M, Mello P, Magro D, Miritz LD, Coronel DA. Caracterização do consume de leite no município de Palmeira das Missões. Rev Sociais e Humanas. 2012;25:295–308.10.5902/231717583280Search in Google Scholar
[41] Ljubičić M, Sarić MM, Rumbak I, Barić IC, Sarić A, Komes D, et al. Is better knowledge about health benefits of dietary fiber related to food labels reading habits? A Croatian overview. Foods. 2022;11:2347. 10.3390/foods11152347.Search in Google Scholar PubMed PubMed Central
© 2025 the author(s), published by De Gruyter
This work is licensed under the Creative Commons Attribution 4.0 International License.
Articles in the same Issue
- Research Articles
- Optimization of sustainable corn–cattle integration in Gorontalo Province using goal programming
- Competitiveness of Indonesia’s nutmeg in global market
- Toward sustainable bioproducts from lignocellulosic biomass: Influence of chemical pretreatments on liquefied walnut shells
- Efficacy of Betaproteobacteria-based insecticides for managing whitefly, Bemisia tabaci (Hemiptera: Aleyrodidae), on cucumber plants
- Assessment of nutrition status of pineapple plants during ratoon season using diagnosis and recommendation integrated system
- Nutritional value and consumer assessment of 12 avocado crosses between cvs. Hass × Pionero
- The lacked access to beef in the low-income region: An evidence from the eastern part of Indonesia
- Comparison of milk consumption habits across two European countries: Pilot study in Portugal and France
- Antioxidant responses of black glutinous rice to drought and salinity stresses at different growth stages
- Differential efficacy of salicylic acid-induced resistance against bacterial blight caused by Xanthomonas oryzae pv. oryzae in rice genotypes
- Yield and vegetation index of different maize varieties and nitrogen doses under normal irrigation
- Urbanization and forecast possibilities of land use changes by 2050: New evidence in Ho Chi Minh city, Vietnam
- Organizational-economic efficiency of raspberry farming – case study of Kosovo
- Application of nitrogen-fixing purple non-sulfur bacteria in improving nitrogen uptake, growth, and yield of rice grown on extremely saline soil under greenhouse conditions
- Digital motivation, knowledge, and skills: Pathways to adaptive millennial farmers
- Investigation of biological characteristics of fruit development and physiological disorders of Musang King durian (Durio zibethinus Murr.)
- Enhancing rice yield and farmer welfare: Overcoming barriers to IPB 3S rice adoption in Indonesia
- Simulation model to realize soybean self-sufficiency and food security in Indonesia: A system dynamic approach
- Gender, empowerment, and rural sustainable development: A case study of crab business integration
- Metagenomic and metabolomic analyses of bacterial communities in short mackerel (Rastrelliger brachysoma) under storage conditions and inoculation of the histamine-producing bacterium
- Fostering women’s engagement in good agricultural practices within oil palm smallholdings: Evaluating the role of partnerships
- Increasing nitrogen use efficiency by reducing ammonia and nitrate losses from tomato production in Kabul, Afghanistan
- Physiological activities and yield of yacon potato are affected by soil water availability
- Vulnerability context due to COVID-19 and El Nino: Case study of poultry farming in South Sulawesi, Indonesia
- Wheat freshness recognition leveraging Gramian angular field and attention-augmented resnet
- Suggestions for promoting SOC storage within the carbon farming framework: Analyzing the INFOSOLO database
- Optimization of hot foam applications for thermal weed control in perennial crops and open-field vegetables
- Toxicity evaluation of metsulfuron-methyl, nicosulfuron, and methoxyfenozide as pesticides in Indonesia
- Fermentation parameters and nutritional value of silages from fodder mallow (Malva verticillata L.), white sweet clover (Melilotus albus Medik.), and their mixtures
- Five models and ten predictors for energy costs on farms in the European Union
- Effect of silvopastoral systems with integrated forest species from the Peruvian tropics on the soil chemical properties
- Transforming food systems in Semarang City, Indonesia: A short food supply chain model
- Understanding farmers’ behavior toward risk management practices and financial access: Evidence from chili farms in West Java, Indonesia
- Optimization of mixed botanical insecticides from Azadirachta indica and Calophyllum soulattri against Spodoptera frugiperda using response surface methodology
- Mapping socio-economic vulnerability and conflict in oil palm cultivation: A case study from West Papua, Indonesia
- Exploring rice consumption patterns and carbohydrate source diversification among the Indonesian community in Hungary
- Determinants of rice consumer lexicographic preferences in South Sulawesi Province, Indonesia
- Effect on growth and meat quality of weaned piglets and finishing pigs when hops (Humulus lupulus) are added to their rations
- Healthy motivations for food consumption in 16 countries
- The agriculture specialization through the lens of PESTLE analysis
- Combined application of chitosan-boron and chitosan-silicon nano-fertilizers with soybean protein hydrolysate to enhance rice growth and yield
- Stability and adaptability analyses to identify suitable high-yielding maize hybrids using PBSTAT-GE
- Phosphate-solubilizing bacteria-mediated rock phosphate utilization with poultry manure enhances soil nutrient dynamics and maize growth in semi-arid soil
- Factors impacting on purchasing decision of organic food in developing countries: A systematic review
- Influence of flowering plants in maize crop on the interaction network of Tetragonula laeviceps colonies
- Bacillus subtilis 34 and water-retaining polymer reduce Meloidogyne javanica damage in tomato plants under water stress
- Vachellia tortilis leaf meal improves antioxidant activity and colour stability of broiler meat
- Evaluating the competitiveness of leading coffee-producing nations: A comparative advantage analysis across coffee product categories
- Application of Lactiplantibacillus plantarum LP5 in vacuum-packaged cooked ham as a bioprotective culture
- Evaluation of tomato hybrid lines adapted to lowland
- South African commercial livestock farmers’ adaptation and coping strategies for agricultural drought
- Spatial analysis of desertification-sensitive areas in arid conditions based on modified MEDALUS approach and geospatial techniques
- Meta-analysis of the effect garlic (Allium sativum) on productive performance, egg quality, and lipid profiles in laying quails
- Optimizing carrageenan–citric acid synergy in mango gummies using response surface methodology
- The strategic role of agricultural vocational training in sustainable local food systems
- Review Articles
- Reference dietary patterns in Portugal: Mediterranean diet vs Atlantic diet
- Evaluating the nutritional, therapeutic, and economic potential of Tetragonia decumbens Mill.: A promising wild leafy vegetable for bio-saline agriculture in South Africa
- A review on apple cultivation in Morocco: Current situation and future prospects
- Quercus acorns as a component of human dietary patterns
- CRISPR/Cas-based detection systems – emerging tools for plant pathology
- Short Communications
- An analysis of consumer behavior regarding green product purchases in Semarang, Indonesia: The use of SEM-PLS and the AIDA model
- Effect of NaOH concentration on production of Na-CMC derived from pineapple waste collected from local society