Earthquake building damage classification based on full suite of Sentinel-1 features
-
Xiaoran Lv
 ,
Lifu Zheng
,
Lifu Zheng

Abstract
This study investigates the capabilities of the proposed approach that fully utilizes the intensity, phase, and polarimetry features of Sentinel-1 for multi-class and binary classification of building damage, aiming to address the limitations of existing studies, which typically only utilize partial Sentinel-1 features or integrate them with an ancillary dataset for building damage classification. Using the Puerto Rico earthquake and Turkey earthquake as case studies, multi-class classification achieved F1 score of 0.50/0.58, an overall accuracy of 0.52/0.60, and receiver operating characteristic – area under the ROC curve (AUC) value of 0.59/0.69, respectively. For binary classification under varying proportions of collapsed buildings and no damaged buildings, overall accuracy ranged from 0.631 to 0.813 and F1 score from 0.630 to 0.806 across the two earthquakes. The performance for both classification tasks is comparable to previous studies that employed other synthetic aperture radar data or integrated one or two Sentinel-1 features with ancillary dataset, and the performance is better than that of studies using only one or two Sentinel-1 features for the destroyed vs undamaged classification. These quantitative comparisons highlight that our proposed approach, which solely rely on Sentinel-1, exploiting all features of Sentinel-1 data and using a readily applied machine learning model, is suitable for the timely, rapid, and microregion-level building damage detection in the local region after the earthquake.
1 Introduction
Earthquakes are among the most catastrophic and unpredictable disasters that cause serious economic losses and casualties [1]. Rapid relief and accurate assessment of economic losses after earthquakes are highly important, especially for urban areas [2]. The degree and spatial distribution of building damage are crucial information for rescue operations and damage assessment.
On-site surveys are a typical method for assessing the spatial distribution and damage level of building damage. However, conducting comprehensive field surveys across entire affected areas immediately after an earthquake is challenging. This difficulty conflicts with the critical golden 48-h window [3] for rescuing individuals trapped in the collapsed buildings. Furthermore, disrupted transportation and communication systems impede the on-site survey. In addition, field investigators face significant danger from aftershocks or secondary disasters.
Remote sensing (RS) technology can provide data with wide spatial coverage and non-contact observation capabilities [4]. It also enables the acquisition of data across various electromagnetic spectrum, such as optical, synthetic aperture radar (SAR) data. As a result, RS serves as an effective and efficient data source for building damage classification following earthquakes.
RS-based approaches for building damage classification can be divided into two categories [5,6,7]: change detection and post-earthquake data-only detection. Change detection methods utilize both the pre- and post-earthquake data, while the post-earthquake data-only detection relies exclusively on post-earthquake data.
Post-earthquake data-only detection, which utilizes only post-earthquake RS data, encompasses relatively fewer approaches [6]. Based on the electromagnetic spectrum used, these methods can be categorized into three types: those utilizing high-resolution optical data, those utilizing SAR data, and those fusing optical with SAR data. For optical data-based methods, they can be further categorized into visual interpretation [8,9], texture-based algorithms [4,10], and algorithms integrating spectral and textural features [11,12]. For SAR data-based methods, classifications include polarimetry feature-based algorithms [13,14,15,16,17,18], texture feature-based algorithms [19,20,21], and algorithms combining multiple features [22,23].
Change detection, utilizing both pre- and post-earthquake data, encompasses significantly more diverse approaches than post-earthquake data-only detection. Although numerous, these methods can be categorized into four types. The first one is optical data-based algorithms, which can be further classified into visual interpretation (which is laborious but widely used) [24,25], image enhancement techniques (e.g. change highlighting via image subtraction) [26,27,28], post-classification comparison (often adopting deep learning) [29,30,31], and other methods, such as using building roofs [32] or 3D geometric changes [33] as indicators for damage extraction. Additionally, LiDAR [34,35], a vertical optical data, is also employed for damaged building classification. The secondary SAR data-based algorithms, which can be further classified into approaches utilizing intensity information [36,37], phase information [38,39], polarimetry information [40,41], and integrated methods employing part or all of above information types [42,43,44]. The third category, integrating optical and SAR data, [45,46], combines the complementary advantages of optical and SAR data. The fourth category includes methods fusing the RS data with ancillary datasets, such as peak ground acceleration (PGA), building inventories [46,47].
Compared with post-earthquake data-only detection, change detection adopts pre-earthquake data, providing significantly richer information to support building damage classification and is consequently more widely used. Moreover, while optical data offer ease of interpretation and typically feature sub-meter resolution, they are passive remote sensing data and thus highly dependent on favorable weather conditions (e.g. no clouds, no rain). Conversely, SAR data can be acquired regardless of nighttime or harsh weather conditions [48]. Consequently, SAR data is considered more flexible for building damage classification, particularly during the critical early phase following the earthquake.
As described above, SAR-based change detection methods use intensity, phase, and polarimetry features. For intensity-based change detection, common approaches involve calculating intensity differences, correlation coefficients, or texture disparities between pre- and post-earthquake data to assess building damage. For instance, Matsuoka et al. [9,49] applied this method to the 1995 Kobe earthquake using C-band and L-band SAR data, respectively. Cui et al. [50] utilized intensity data to quantify damaged building distributions in the 2010 Yushu earthquake. Kim et al. [37] employed novel textural features to detect damaged buildings in the 2016 Kumamoto earthquake. For phase-based change detection, the core principle involves calculating the difference or ratio between pre-seismic coherence and the co-seismic coherence. Ito et al. [38,51] applied the ratio of pre- and co-seismic coherence to detect damaged buildings following the 1995 Kobe and 1999 Kocaeli earthquakes. Sharma et al. [52] employed the difference between pre- and co-seismic coherence for building damage classification after the 2015 Nepal earthquake. To mitigate interference from factors such as spatial baseline variations and background noise, researchers have utilized histogram-matched pre-seismic coherence time series alongside co-seismic coherence. Liu et al. [39] utilized coherence time series to identify damaged buildings after the 2022 Afghanistan earthquake. Yang et al. [53] combined coherence time series with an artificial neural network (ANN) algorithm to detect damaged buildings following the 2023 Turkey earthquake. For polarimetry-based change detection, methods can be categorized into two groups according to polarization mode. In the dual-polarization mode, only one primary polarization decomposition technique, H-alpha decomposition, is typically applied. Consequently, studies often employ intensity, textures, or coherence across different polarizations. For example, Karimzadeh and Mastuoka [40] used dual-polarized SAR intensity combined with coherence data to generate the binary damage map for the 2016 Amatrice earthquake. Oxoli et al. [44] adopted coherence under different polarizations to assess the building damage in the 2016 Central Italy earthquake. In the full-polarization mode, the technique provides richer information for analyzing building backscattering mechanisms. Studies focus on developing polarimetry decomposition algorithms and examining the relationship between polarimetry indices (e.g. average scattering angle, volume scattering) with building damage states (intact vs damaged), as these indices are sensitive to the physical properties, geometry structures, and orientation of buildings. For instance, Yamaguchi [54] used three polarimetry indices to construct the pre- and co-earthquake RGB composites, demonstrating that the spectral difference could identify damaged buildings. Chen et al. [41] calculated the ratio of dominant double-bounce scattering to the standard deviation of polarization orientation angle differences to map damaged buildings in the 2011 Tohoku earthquake.
However, acquiring full-polarization SAR data in a timely manner remains challenging, particularly for undeveloped regions, as most such datasets are neither freely available nor inexpensive. Consequently, numerous building damage classification studies continue to focus on dual-polarization SAR data, combining intensity, coherence, and/or polarimetry features. Sentinel-1, a twin-satellite constellation launched by the European Space Agency (ESA), provides freely accessible C-band dual-polarization SAR data. Its revisit time are 12 days for a single satellite and 6 days for the constellation. Therefore, despite its medium spatial resolution (approximately 10m for GRD products and 5 m × 20 m for the SLC products), Sentinel-1 enables the acquisition of timely and cost-free data, especially for the pre-earthquake data. This underscores the crucial importance of fully exploring the achievable accuracy and diverse application scenarios of Sentinel-1 SAR data for building damage classification. For example, Akhmadiya et al. [42] employed texture features from two polarimetric modes and phase information of Sentinel-1 to classify damaged vs intact buildings using a maximum likelihood algorithm for the 2016 Italy earthquake. Aimaiti et al. [45] utilized Sentinel-1 intensity data and Sentinel-2 texture features to perform binary classification via threshold analysis in the Ukraine region. Sandhini Putri et al. [46] integrated Sentinel-1 intensity and texture features with Sentinel-2 spectral data to classify building damage into medium, severe, and collapse categories using a random forest (RF) algorithm for the 2018 Lombok earthquake. Liu et al. [55] applied Sentinel-1 phase data for binary classification in the 2023 Turkey earthquake. Rao et al. [47] combined Sentinel-1 phase data, building inventories, and PGA to conduct binary and multi-class classification via RF algorithm across five earthquake-affected regions. Liu et al. [39] used Sentinel-1 phase data to distinguish damaged from intact buildings in the 2022 Afghanistan earthquake, and Yang et al. [53] employed an ANN algorithm with Sentinel-1 phase data for binary classification in the 2023 Turkey earthquake. Du et al. [56] used surface deformation derived from the Sentinel-1 SLC data to calculate the direction of earthquake parameter for detecting damaged buildings in the 2023 Turkey earthquake.
However, the existing studies (Table 1) primarily utilize only one or two features derived from Sentinel-1 data or fusing some of the features with ancillary data. Furthermore, most focus on assessing Sentinel-1’s performance for binary building damage classification. Relatively few studies have deeply explored the potential of building damage classification solely relying on Sentinel-1 data, particularly for multi-class classification, by exploiting its intensity, phase, and polarimetry features.
Previous building damage classification studies based on Sentinel-1
| Methods | Data used | Classification type | References |
|---|---|---|---|
| Decision-tree | Sentinel-1 polarimetry | Multi-class | [57] |
| Discriminant analysis | Sentinel-1 phase and LiDAR | [58] | |
| Random Forest | Sentinel-1 phase, Alos-2 phase, Sentinel-2 | [59] | |
| Random Forest | Sentinel-1 intensity, polarimetry and Sentinel-2 | [46] | |
| Discriminant analysis | Sentinel-1 intensity and phase | Binary class | [40] |
| RGB Visualization | Sentinel-1 phase and polarimetry | [60] | |
| Decision-tree | Sentinel-1 polarimetry | [57] | |
| Multivariate alteration detection (MAD) and naive Bayes (NB) | Sentinel-1 phase and intensity | [61] | |
| Discriminant analysis | Sentinel-1 phase and intensity | [62] | |
| Maximum Likelihood and Mahalanobis | Sentinel-1 polarimetry and phase | [42] | |
| Discriminant analysis | Sentinel-1 intensity and Sentinel-2 | [45] | |
| Discriminant analysis | Sentinel-1 phase | [39] | |
| Recurrent Neural Network (RNN) | Sentinel-1 phase | [53] |
Therefore, this study aims to explore the classification capabilities of integrating all suite of Sentinel-1 features (intensity, polarimetry, and phase) for multi-class and binary classification of building damage. This approach seeks to address the limitations of existing studies in unleashing the potential of Sentinel-1 data, which typically only combines one or two Sentinel-1 features or integrates them with ancillary data (e.g., optical data, PGA, or high spatial resolution data) to perform building damage classification. Secondly, this study constructs distinct binary classification scenarios to explore the optimal binary classification grouping approach for building damage severity levels tailored to Sentinel-1 data. Finally, this study further investigates whether the pre-trained model for destroyed vs undamaged classification generated by the proposed approach supports the cross-region classification. Two earthquake-affected regions with detailed on-site multi-class damaged buildings classifications data were selected as study areas, and the RF algorithms were employed for the analysis.
2 Methods
2.1 Study area
2.1.1 The 2020 Puerto Rico earthquake
The Mw 6.4 Puerto Rico earthquake occurred on 7 January 2020. The epicenter was located at the southwest coast, and the focal mechanism indicates that the earthquake ruptured a normal fault. The economic loss and casualties caused by the earthquake are comparable to those of the 1918 San Fermin Mw7.1 earthquake [47]. Field investigations [63] were carried out by the Federal Emergency Management Agency (FEMA) from 12 January to 15 January 2020. The survey indicated that about 335 buildings were damaged, including 77 completely destroyed buildings. The damaged buildings were mainly distributed in five provinces, namely Guanica, Yauco, Guayanilla, Penuelas, and Ponce. Therefore, buildings in these regions were considered for the multi-class classification in this study (Figure 1a).
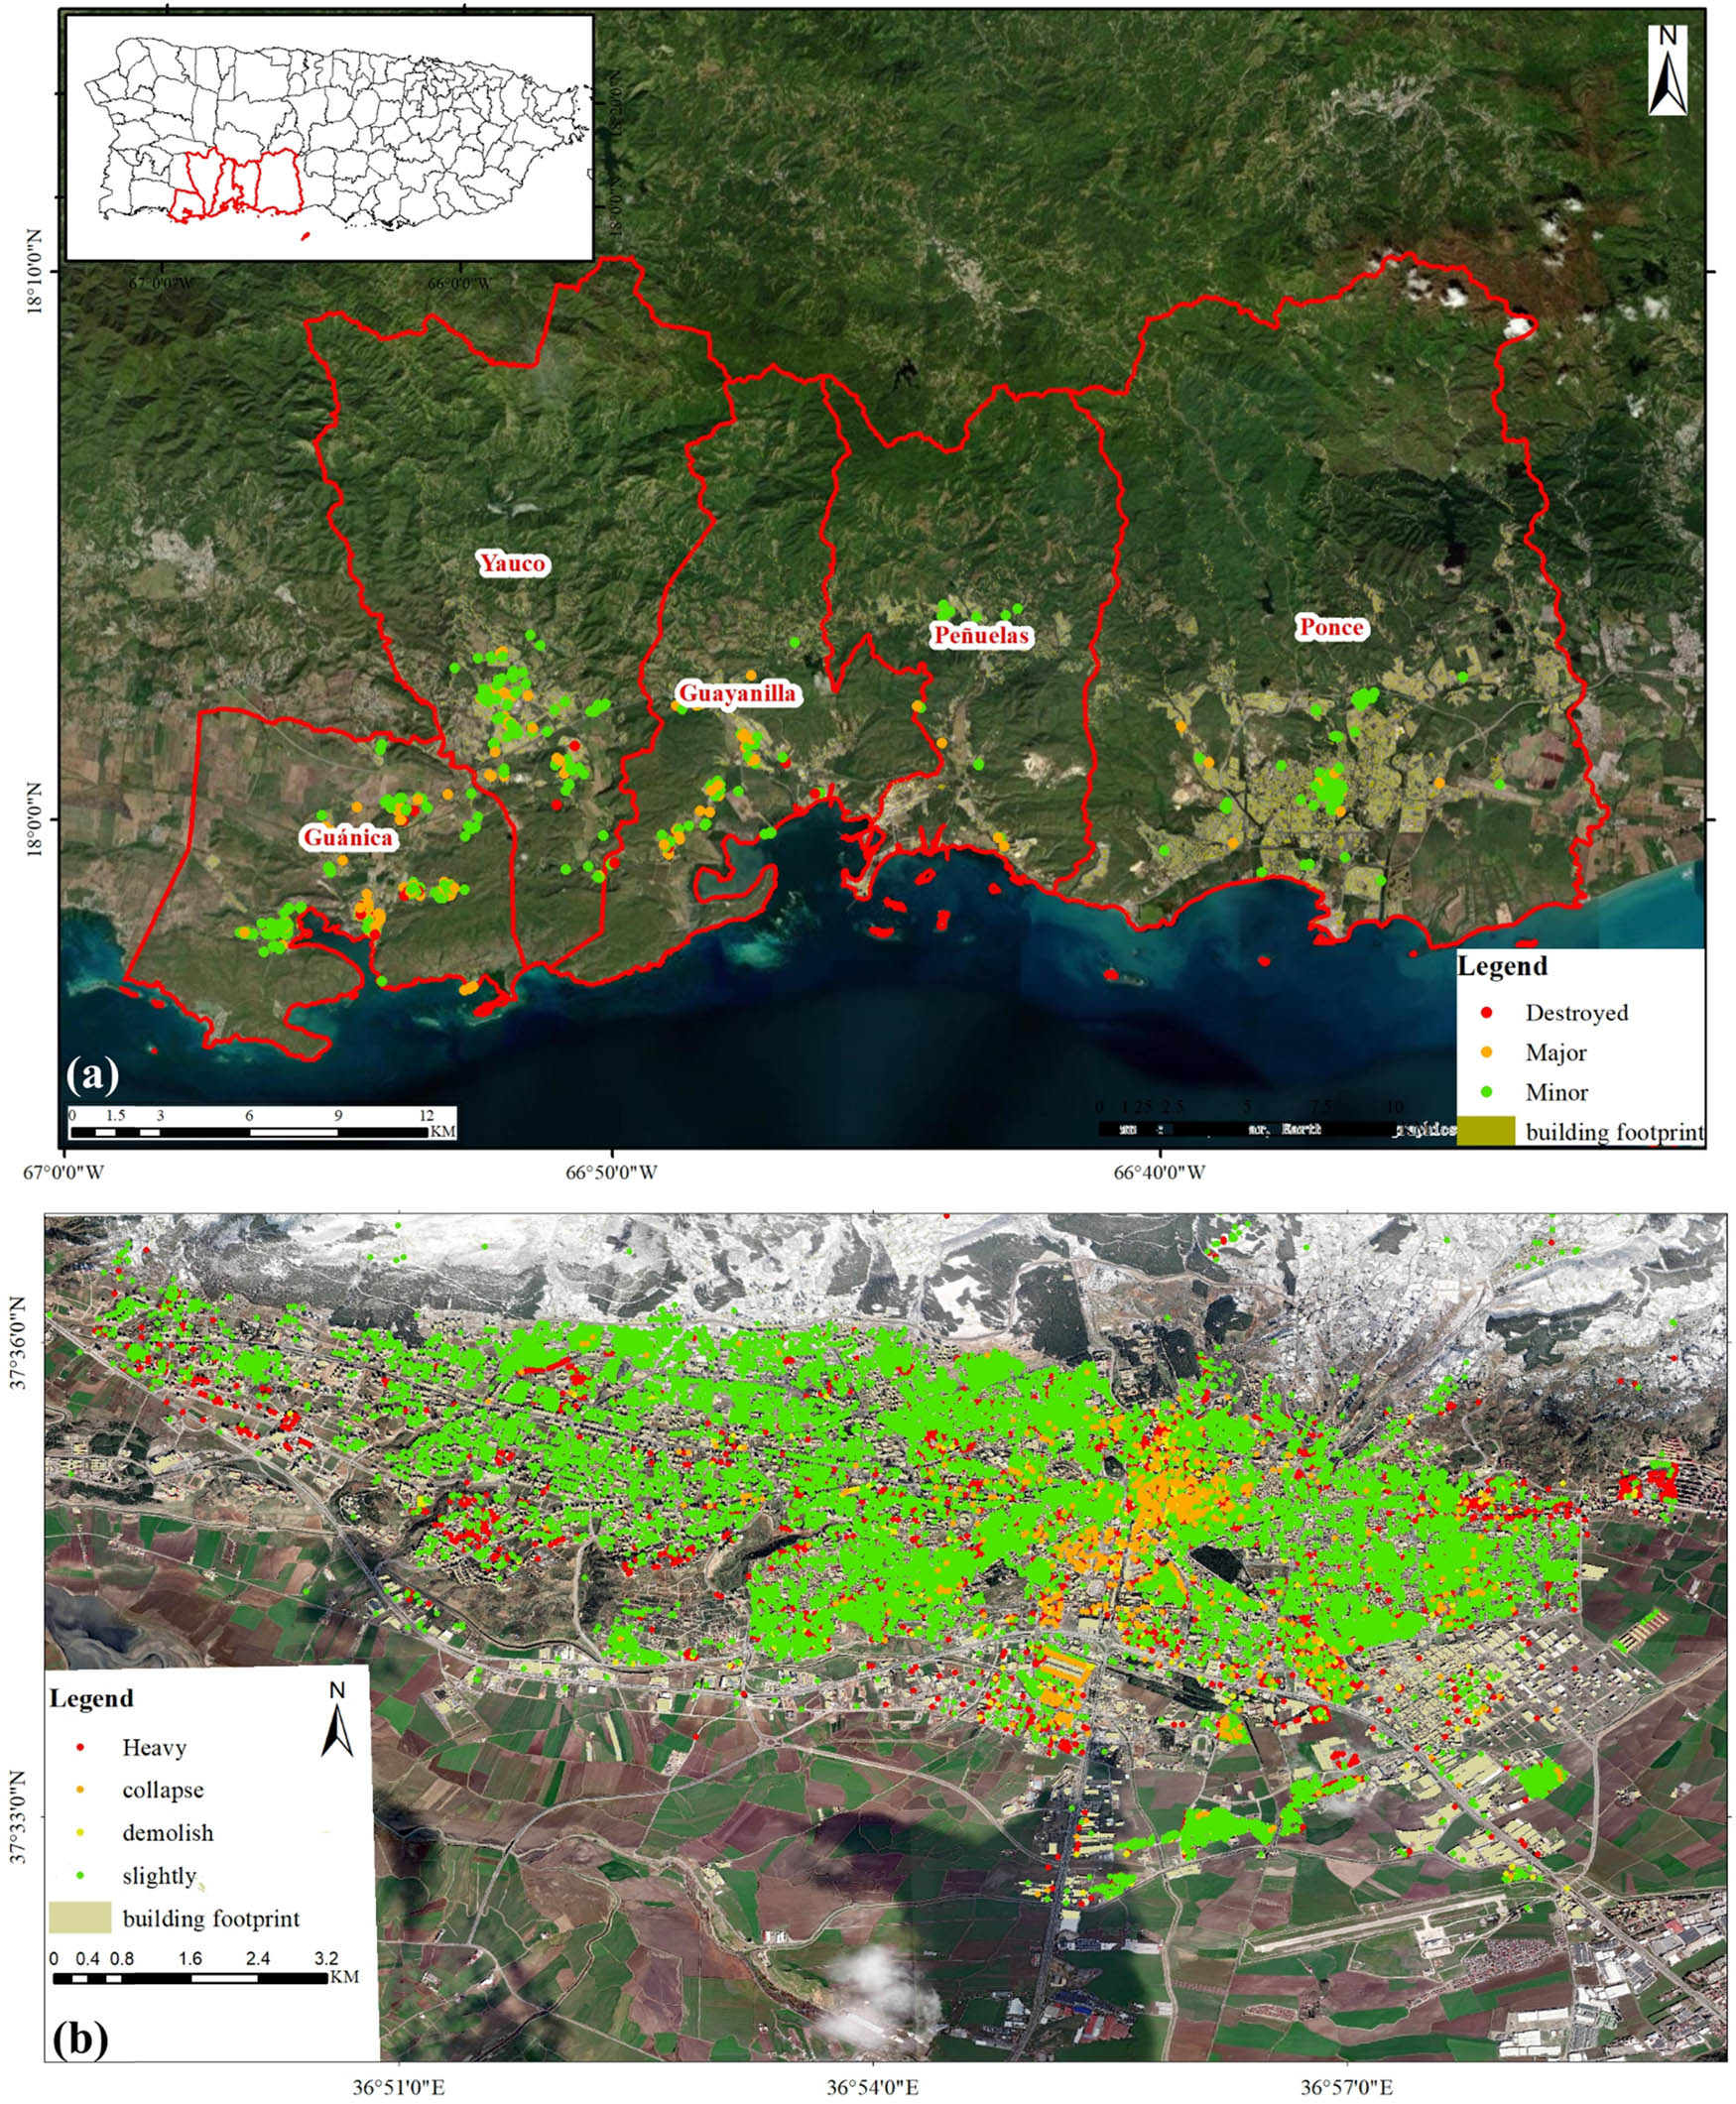
Study area and the building damage field survey results. (a), study area and field survey results for the Puerto Rico earthquake, and (b), study area and field survey results for the Turkey earthquake. The red polygons in (a) indicate the administration boundaries of the Guanica, Yauco, Guayanilla, Penuelas, and Ponce provinces.
2.1.2 The 2023 Turkey earthquake
The Mw 7.8 and the Mw 7.5 strike-slip earthquakes occurred on 6 February 2023 in Turkey. They caused serious casualties and economic losses, affecting about 44,000 people and resulting in a loss of about $34 billion. More than 160,000 buildings, including 520,000 apartments, collapsed partially or entirely [53]. These earthquakes almost destroyed the whole Kahramanmaras city, which was one of the worst-hit areas in Turkey. Thus, we selected Kahramanmaras city for research in this study (Figure 1b).
2.2 Data and the preprocessing
2.2.1 SAR intensity and the gray-level co-occurrence matrix (GLCM)
We used the Sentinel-1 ground range detected at high resolution (GRDH) of ascending data, which contain the dual-polarized (VV and VH) information in this study (Table 2). The intensity and the GLCM metrics (Table 3) were calculated using SNAP software [64] based on the pre-event and post-event images. In total, we obtained four intensity images and forty GLCM index images. Then, the log ratio [45] of intensity before and after the event was calculated as the final intensity index. Finally, 42 features were obtained.
Sentinel-1 ascending data used in this study
| Data | Date | Earthquake |
|---|---|---|
| Sentinel-1 IW GRDH | 20200104, 20200116 | Puerto Rico |
| 20230128, 20230209 | Turkey | |
| Sentinel-1 IW SLC | 20190109-20200116 (30) | Puerto Rico |
| 20220202-20230221 (32) | Turkey |
Features used for damage level classification
| Feature | Note |
|---|---|
| GLCM Mean | Texture feature (VV/VH) |
| GLCM Correlation | |
| GLCM Variance | |
| Contrast | |
| Dissimilarity | |
| Energy | |
| Entropy | |
| Angular Second Moment (ASM) | |
| Homogeneity | |
| Maximum Probability (MAX) | |
| Intensity log ratio | Intensity feature (VV/VH) |
| Coherence differences | Coherence feature |
2.2.2 Coherence differences calculation
Coherence is a byproduct of interferogram generation [65], which represents the similarity of two repeat-pass SAR signals. Higher coherence indicates smaller changes between two images, and the precise definition of the coherence is given by,
where, the
We used a 1-year pre-earthquake [39] and one closest post-earthquake Sentinel-1 ascending SLC IW images (Table 2) to calculate the coherence differences. The coherence stack was calculated using the JPL/Caltech ISCE stack processor [66,67] and MintPy [68]. We used the histogram matching [39,69] and one standard deviation [39,70] value to remove the spatial baselines' influence and the background effects, respectively. Coherence differences were then calculated by subtracting coseismic coherence from the closest preseismic coherence. Finally, the coherence differences were resampled to the 10 m × 10 m pixel spacing as the GRDH data. The standard deviation [39,71] of the 1-year pre-earthquake coherence stack was not used to mask out unstable regions because this index could not satisfactorily distinguish between the unstable (such as vegetation) and stable (such as buildings) regions for the medium-solution Sentinel-1 data.
2.2.3 Field survey data
After the Puerto Rico earthquake, the FEMA Hazus program [63] carried out the field survey from 12 January 2020 to 15 January 2020. They identified a total of 775 buildings with three levels of damage, namely destroyed, major, and minor (Table 4). However, they did not provide a clear definition of each damage type. In this study, the destroyed type was combined with the major type as one category termed “serious damage”, the minor type was renamed as “slight damage”, and the no damage type was labeled as “undamage.”
Statistics characteristics of damaged buildings
| Damage type | Number |
|---|---|
| Puerto Rico earthquake | |
| Destroyed | 41 |
| Major | 178 |
| Minor | 396 |
| Turkey earthquake | |
| Collapse | 583 |
| Need to be demolished | 372 |
| Heavily damage | 2,480 |
| Slightly damage | 9,823 |
After the Turkey earthquake, Yazilim and Cizenler [72] conducted a field survey and investigated a total of 200,000 buildings. Four types of building damage were established, namely collapsed, need to be demolished, heavily damaged and slightly damaged. According to their data, damaged buildings in Kahramanmaras city were counted and shown in Table 4. Yazilim defined the “collapsed buildings” as buildings in ruins, “need to be demolished” buildings as buildings that are partially collapsed, “heavily damaged” buildings as buildings experiencing concrete construction and structure destroyed, and “slightly damaged” buildings as buildings that were generally repairable. In addition, in order to compare our multi-class classification results with other studies, we adopt Yu’s (59) and Yang’s (53) method and grouped the collapsed buildings, need to be demolished buildings, and heavily damaged buildings as “serious damage” [53,59]. The other two types are the “slight damage” and “undamage,” respectively.
2.2.4 Building footprint data
For the Puerto Rico earthquake, we utilized building footprint data obtained from the OpenStreetMap (OSM), and 72,416 buildings were identified in the study area. For the Turkey earthquake, we used building footprint data extracted from Xu’s et al. [73] work, which contains more building vectors than the OSM. They obtained building footprints based on the Sentinel-2 Normalized Difference Built-up Index. Then, the building vector of Kahramanmaras was extracted (36,676 buildings).
The building vector data were used as the mask to extract the corresponding coherence differences, intensity ratio, and GLCM metrics. For instance, with a multi-grid in one building footprint, the average value was calculated as the final property. Finally, 43 features (Table 3) were obtained for each building vector.
2.3 Methods
In this study, a supervised machine learning algorithm was employed to evaluate the potential of the medium-resolution Sentinel-1 SAR data in the prediction of building damage types. Considering that the dataset has a medium size and the dataset is actually in tabular form with each row representing a build unit, the RF algorithm [47,59,74] was applied for the classification.
Hyperparameters [75,76], which directly affect the generalization and complexity of the model, cannot be learned during the training phase. Thus, the hyperparameter tuning process must be set prior to the training process. Probst et al. [76] provided a detailed overview of hyperparameter tuning strategies for RF and pointed out that the main hyperparameters of RF are the number of trees in the forest, the node size, the number of features sampled when looking for the best split for a node, and the samples used by each tree. In this study, the optimal values of these hyperparameters were determined using the Bayes method [77] offered in the Python software package hyperopt, and the RF classifier provided by the Python software package scikit-learn was used.
A unique feature of the damaged building dataset is the heavy imbalance [47,59], which implies that the vast majority of buildings are undamaged. This imbalance also exists in the dataset of different damage types. The imbalance tends to encourage the trained model to classify most buildings in the test dataset into the undamaged category. Therefore, we also applied the imblearn module from scikit-learn to randomly undersample the majority, such as the “undamaged.” Then, we randomly selected 80% of the dataset as the training dataset and used the remaining 20% as the testing dataset.
We selected the precision, recall, F1 score, overall accuracy, and ROC (receiver operating characteristic)-AUC (area under the ROC curve) metrics as the evaluation metrics to determine the optimum classification model. Additionally, a modified F1 score (79–81), which is the summed average of the three categories’ F1 scores, was calculated as follows:
Among them,
3 Results
3.1 Multi-class classification
3.1.1 Puerto Rico earthquake
The ROC–AUC histogram of the 100 experiments is shown in Figure 2a–d. The peak ROC–AUC was 0.58, 0.59, and 0.66 for the “serious damage,” “slight damage,” and “undamage” categories, respectively. The peak value of the average ROC-AUC was 0.59. Based on the truth data, the confusion matrix and evaluation metrics are shown in Figure 3a and Table 5, respectively. For the three categories, the recall was 0.64, 0.51, and 0.43, and the F1 score was 0.44, 0.52, and 0.53, respectively. The overall accuracy and
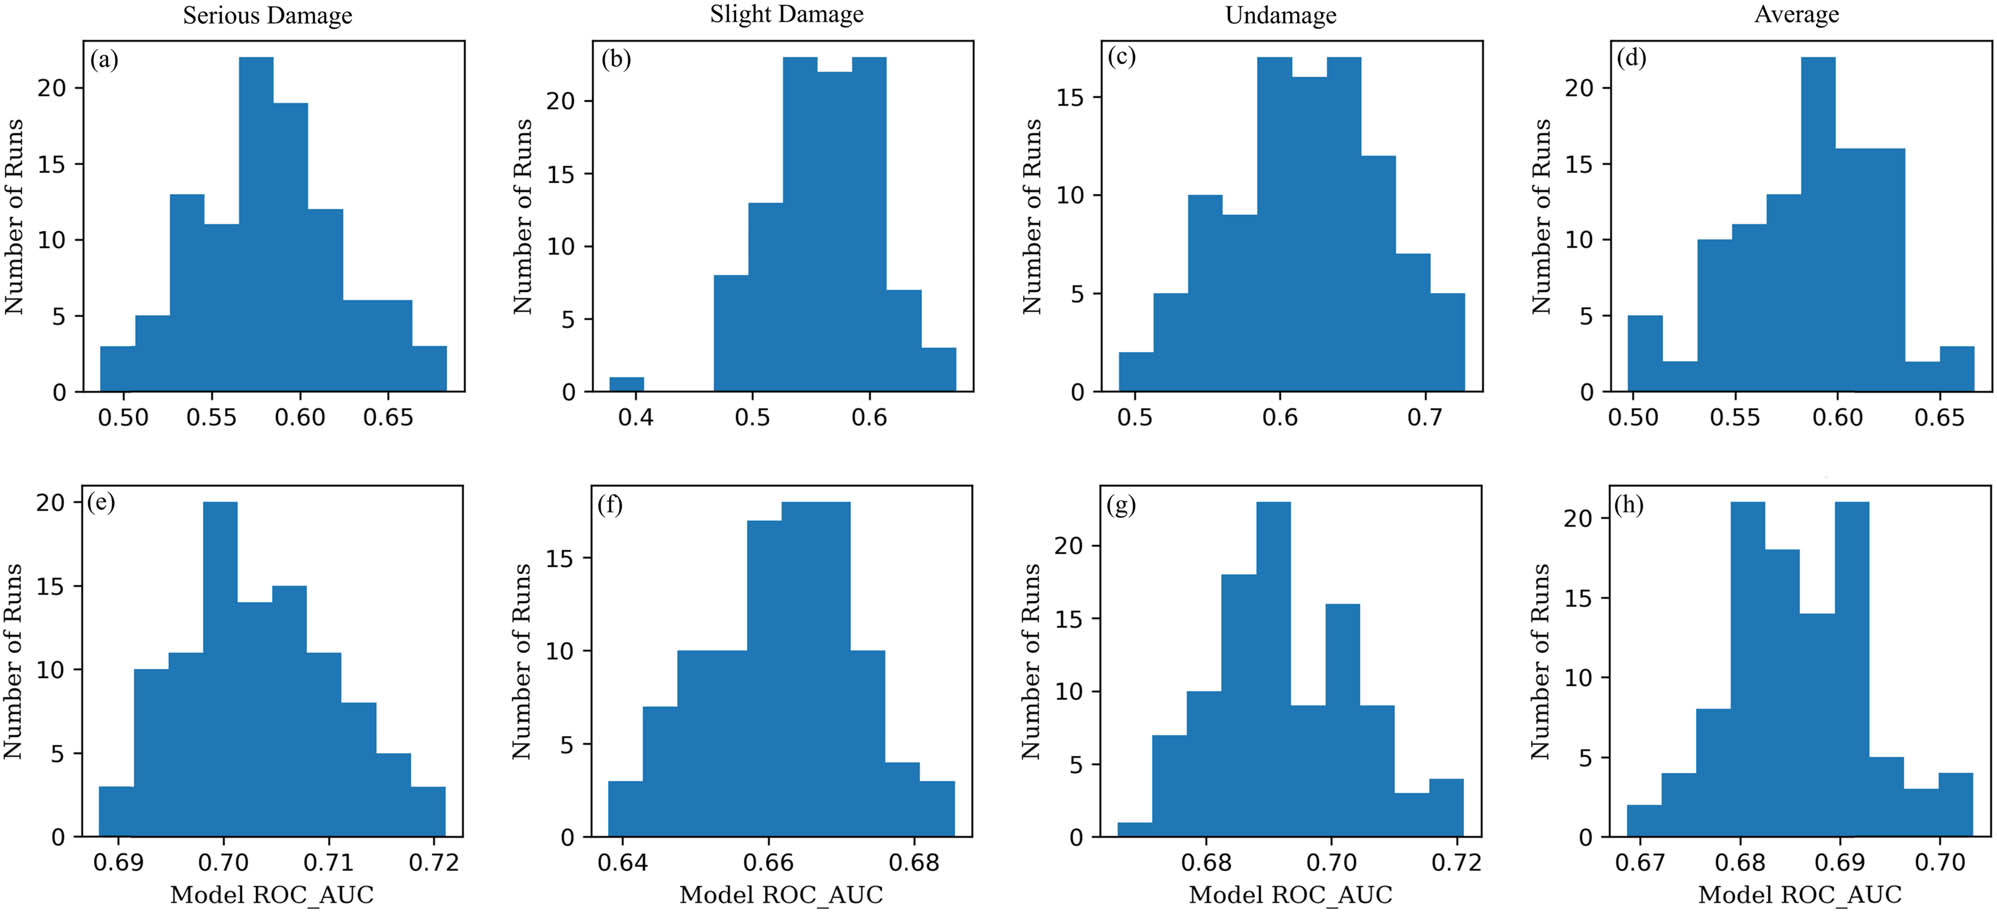
Model performance through the ROC-AUC index for the two earthquakes. We conducted 100 multi-class classification experiments to quantitatively evaluate the effectiveness of our method. The ROC-AUC histogram of each damage type was calculated. Then, the histogram of the average ROC–AUC value for all damage types is calculated. (a)–(d) The histograms for the Puerto Rico earthquake, and (e)–(h) the histograms for the Turkey earthquake. For the Puerto Rico earthquake, the peak ROC–AUC was 0.58, 0.59, and 0.66 for the serious damage, slight damage, and undamaged categories, respectively. The peak value of the average ROC–AUC was 0.59. For the Turkey earthquake, the peak ROC-AUC was 0.69, 0.67, and 0.69 for the serious damage, slight damage, and undamaged categories, respectively. The peak value of the average ROC–AUC was 0.69.
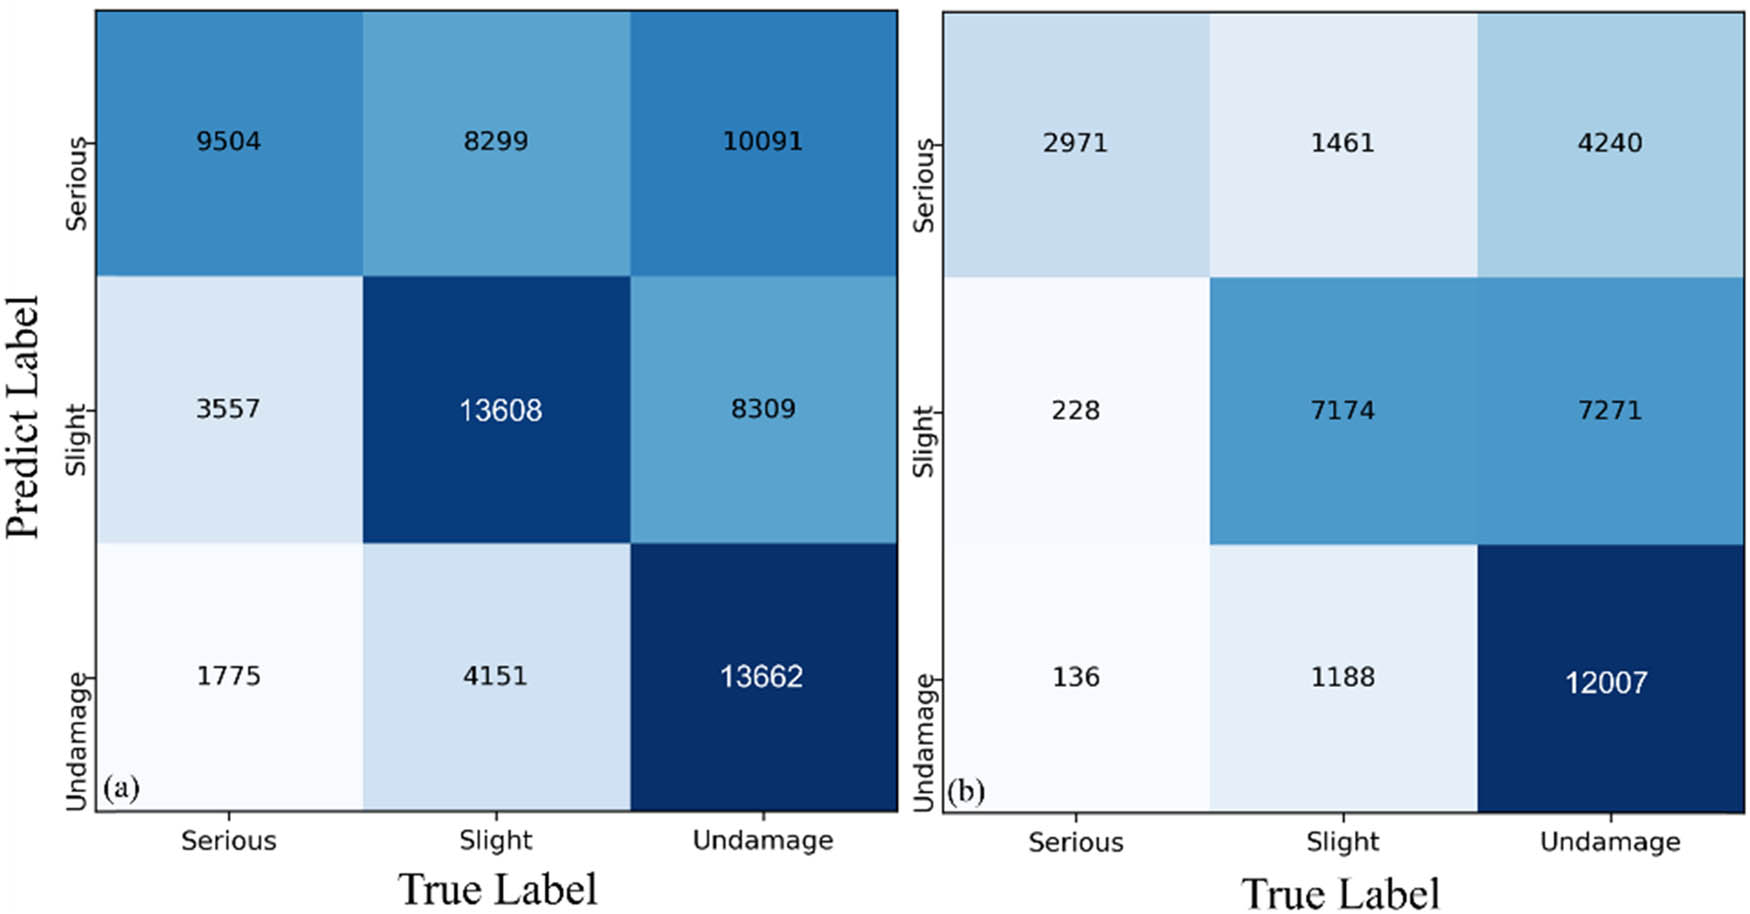
Confusion matrix of multi-class classification for the two earthquakes. We conducted 100 multi-class classification experiments. And we used the mode of 100 classification results for each building footprint as the final category. (a) Confusion matrix for the Puerto Rico earthquake, and (b) confusion matrix for the Turkey earthquake.
Performance metrics of the multi-class classification for Puerto Rico earthquake
| Precision | Recall | F1 score |
|
Overall accuracy | |
|---|---|---|---|---|---|
| Serious damage | 0.34 | 0.64 | 0.44 | 0.50 | 0.52 |
| Slight damage | 0.52 | 0.51 | 0.52 | ||
| Undamage | 0.70 | 0.43 | 0.53 |
3.1.2 Turkey earthquake
The ROC–AUC histogram of the 100 experiments and evaluation metrics is shown in Figure 2e–h. The peak ROC-AUC was 0.69, 0.67, and 0.69 for the “serious damage,” “slight damage” and “undamage” categories, respectively. The peak value of the average ROC-AUC was 0.69. The confusion matrix and evaluation metrics for the three categories are shown in Figure 3b and Table 6, respectively. The recall was 0.89, 0.73, and 0.51, and the F1 score was 0.50, 0.59, and 0.65, respectively. The overall accuracy and
Performance metrics of the multi-class classification for Turkey earthquake
| Precision | Recall | F1 score |
|
Overall accuracy | |
|---|---|---|---|---|---|
| Serious damage | 0.34 | 0.89 | 0.50 | 0.58 | 0.60 |
| Slight damage | 0.49 | 0.73 | 0.59 | ||
| Undamage | 0.90 | 0.51 | 0.65 |
3.2 Binary classification
In addition to multi-class classification, we also evaluated our approach for binary classification. Four scenarios for Puerto Rico and six for the Turkey earthquake were established (Table 7), each involving different proportions of collapsed/destroyed and no damaged buildings.
Scenarios for binary classification
| Scenario | Definition of “damage” type | Definition of “undamage” type |
|---|---|---|
| Puerto Rico earthquake | ||
| ScenarioP1 | Destroyed and major damaged buildings | No damaged buildings |
| ScenarioP2 | Destroyed buildings | |
| ScenarioP3 | Destroyed and major damaged buildings | Minor and no damaged buildings |
| ScenarioP4 | Destroyed buildings | |
| Turkey earthquake | ||
| ScenarioT1 | Collapsed, need to be demolished, and heavily damaged buildings | No damaged buildings |
| ScenarioT2 | Collapsed, need to be demolished buildings | |
| ScenarioT3 | Collapsed buildings | |
| ScenarioT4 | Collapsed, need to be demolished, and heavily damaged buildings | Slightly and no damaged buildings |
| ScenarioT5 | Collapsed, need to be demolished buildings | |
| ScenarioT6 | Collapsed buildings | |
The performance metrics for binary classification under various scenarios in the Puerto Rico and Turkey earthquakes are detailed in Table 8. Our approach achieved superior performance in binary classification compared to multi-class classification. The overall accuracy ranged from 0.631 to 0.813, and the F1 score from 0.630 to 0.806 across the two earthquakes. For both earthquakes, a higher proportion of collapsed/destroyed buildings generally corresponded to better performance, given the “undamage” building type.
Performance metrics of binary classification
| ROC–AUC | Precision | Recall | F1 score | Overall accuracy | |
|---|---|---|---|---|---|
| Puerto Rico earthquake | |||||
| ScenarioP1 | 0.725 | 0.648 | 0.648 | 0.630 | 0.631 |
| ScenarioP2 | 0.873 | 0.688 | 0.718 | 0.676 | 0.687 |
| ScenarioP3 | 0.722 | 0.707 | 0.708 | 0.695 | 0.696 |
| ScenarioP4 | 0.891 | 0.812 | 0.864 | 0.806 | 0.813 |
| Turkey earthquake | |||||
| ScenarioT1 | 0.744 | 0.665 | 0.661 | 0.658 | 0.659 |
| ScenarioT2 | 0.816 | 0.717 | 0.716 | 0.717 | 0.718 |
| ScenarioT3 | 0.854 | 0.787 | 0.782 | 0.772 | 0.771 |
| ScenarioT4 | 0.701 | 0.663 | 0.657 | 0.653 | 0.655 |
| ScenarioT5 | 0.802 | 0.764 | 0.761 | 0.761 | 0.762 |
| ScenarioT6 | 0.814 | 0.767 | 0.759 | 0.754 | 0.755 |
4 Discussion
4.1 Comparison with other studies
4.1.1 Multi-class classification performance comparison
To evaluate our approach’s performance, we compared performance metrics with existing studies (Table 9, Figure 4a), focusing on
Performance metrics for multi-class classification in previous studies
| Data | Method | Classes | Precision | References |
|---|---|---|---|---|
| Street block-unit | ||||
| Airborne PolSAR | Discriminant Analysis | Slight, Median, Serious | Overall accuracy: 0.79, Kappa coefficient: 0.68 | [81] |
| RadarSat-2 | Discriminant Analysis | Slight, Moderate, Serious | Overall accuracy: 0.73 | [82] |
| Radarsat-2/ALOS-1 | Discriminant Analysis | Slight, Moderate, Serious | Overall accuracy: 0.73/0.83 | [83] |
| Airborne SAR | Discriminant Analysis | Slight, Moderate, Serious | Overall accuracy: 0.85 | [22] |
| Radarsat-2 | Discriminant threshold | Slight, Moderate destroy |
|
[84] |
| pixel-block unit | ||||
| Sentinel-1 polarimetry | Decision-tree classifier | No damage, Minor, Major destroyed | Overall accuracy: 0.52 | [57] |
| Sentinel-1 and LiDAR | Change detection | No damage, Minor, Major destroyed | overall accuracy: 0.63 | [58] |
| ENVISAT | PCA change detection | No damage, Moderate destroyed | Overall accuracy: 0.65 | [85] |
| AIAR DMP, PGA and Building inventors | Random forest | No damage, Slight, Moderate, Substantial, Very heavy destruction |
|
[47] |
| No damage, Slight, Intermediate, Heavy, Partial collapse, Total collapse |
|
|||
| No damage, Slight, Moderate, Heavy |
|
|||
| No damage, Slight moderate, Heavy |
|
|||
| Sentinel-1, Alos-2, and Sentinel-2 | Random forest Classifier | No damage, Slight, Serious | ROC-AUC: 0.68 | [59] |
| Sentinel-1 and Sentinel-2 | Random forest | Moderate, Severe destory | Overall accuracy: 0.62 | [46] |
| Individual building level | ||||
| CASMAR | Random forest | Slight, Moderate, Serious | Overall accuracy: 0.82 | [87] |
| xBD | Deep learning, Encoder-Decoder backbones | No damage, Minor damage, Major damage |
|
[88] |
| xBD | Deep learning, Cross-directional fusion model | No damage, Minor damage, Major damage |
|
[89] |
| xBD | Deep learning | No damage, Minor, Major destroyed |
|
[78] |
| Optical images | Deep learning | No damage, Minor, Major destroyed | Precision: 0.80, Accuracy: 0.86,
|
[90] |
| xBD | Deep learning bitemporal attention trans former module | No damage, Minor, Major destroyed |
|
[91] |
| xBD | Deep learning: transformers | No damage, Minor, Major destroyed |
|
[92] |
| xBD | Deep learning | No damage, Major destroyed |
|
[93] |
| Optical images | Deep learning | No damage, Light, Heavy collapse | Overall accuracy: 0.64 | [94] |
| xBD | Deep learning | No damage, Minor, Major destroyed | Pixel-based
|
[79] |
| Optical images | Deep learning: CNN | No damage, Minor, Moderate, Severe destroyed | Accuracy: 0.80 | [95] |
| xBD | Deep learning: Transformer learning | No damage, Minor, Major destroyed |
|
[80] |
| xBD | Deep learning: ResNet | No damage, Minor, Major destroyed |
|
[96] |
| xBD | Deep learning: semi-Siamese network | No damage, Minor, Major destroyed |
|
[97] |
| xBD | U-Net | No damage, Minor, Major destroyed |
|
[98] |
| LiDAR | Deep learning: FCSNN | Slight, Moderate, Substantial to heavy, Very heavy destruction | Accuracy: 0.42,
|
[35] |
| LiDAR | Mechanic learning | No damage, Moderately, Highly destroyed | Overall accuracy: 0.60 | [86] |

Performance metrics comparison between this study and other studies (a) for multi-class classification and (b) for binary classification. For both multi-class and binary classification tasks, while the performance metrics of our work is lower compared to those using optical data, our results exhibit close similarity to those of numerous studies relying on SAR data. For multi-class classification, when compared to pixel-block unit-level SAR studies, our model’s performance is comparable. The previous studies report an
Comparison results with other studies, adopting diverse datasets and operating at different analytical levels, indicates that while making full use of the intensity, phase, and polarimetry features of medium-resolution Sentinel-1 data does not achieve the highest precision in the building damage multi-class classification compared to optical images, its performance is nearly equivalent to researches using other commercial SAR data or fusing Sentinel-1 with ancillary datasets. This suggests that following an earthquake, freely available large-area Sentinel-1 SAR data can be used effectively and efficiently to conduct a coarse-grained multi-class classification of building damage. This approach is particularly valuable for bad-weather conditions or undeveloped regions, where it serves as a critical first-response tool.
4.1.2 Binary classification performance comparison
This study further compares the binary classification performance metrics with those of other studies (Table 10, Figure 4b). Analogous to the multi-class classification results, studies employing optical data generally exhibit a higher F1 score or overall accuracy compared to those utilizing SAR data. The optical data-based studies report an F1 score ranging from 0.69 to 0.90 and overall accuracy from 0.84 to 0.90. When comparing our binary classification outcomes with prior studies using SAR data, our study demonstrates comparable performance. The overall accuracy in these studies ranges from 0.58 to 0.86, with Kim et al.’s study [37] reporting an F1 score of 0.80. In our research, the overall accuracy for these two earthquakes under different scenarios ranges from 0.631 to 0.813, and the F1 score ranges from 0.630 to 0.806. For destroyed vs undamaged classification, the overall accuracy of our approach is higher than that of [42,45,62] using only one or two Sentinel-1 features. And for scenario T1, our AUC (0.744) is comparable to that of Yang et al.’s [53] result (0.761) using RNN to dig phase information. Finally, our F1 score is remarkably close to that of Kim’s study, and our overall accuracy falls within the range reported by other studies.
Performance metrics for binary classification in previous studies
| Data | Method | Building damage type | Precision | References |
|---|---|---|---|---|
| ALOS-2 | SVM | (1) Damaged: Destroyed, severely damaged | Overall accuracy: 0.80, Kappa: 0.61 | [99] |
| (2) Undamaged: No damage | ||||
| Sentinel-1/Alos-2 | Discriminant analysis | (1) Damaged: Destruction | Accuracy: 0.84/0.76 | [40] |
| (2) Undamaged: Slight damage, Moderate damage, Heavy damage, Very heavy damage | ||||
| TerraSAR-X | Random forest | (1) Damaged: Destruction | Overall accuracy: 0.72 | [100] |
| 2) Undamaged: Slight damage, Moderate damage, Extensive damage | ||||
| TerraSAR-X | Discriminant analysis | (1) Damaged: Collapse | Overall accuracy: 0.74 | [101] |
| (2) Undamaged: Negligible damage, Moderate damage, Severe damage | ||||
| Capella SAR | Machine learning | (1) Damaged: Collapse | Overall accuracy: 0.72 | [19] |
| (2) Undamaged: No damage, Minor damage, Moderate damage | ||||
| Kompsat-5 | Discriminant analysis | (1) Damaged | F1: 0.80 | [37] |
| (2) Undamaged, No damage | ||||
| Sentinel-1 | Earthquake damage visualization (EDV) technique | (1) Damaged: Severely damaged, Collapse | Overall accuracy: 0.85 | [60] |
| (2) Undamaged, No damage | ||||
| Sentinel-1 | Decision-tree classifier | (1) Damaged: Very heavy damage destruction | Overall accuracy: 0.71 | [57] |
| (2) Undamaged: Negligible to slight damage, Moderate damage, Substantial to heavy damage | ||||
| Sentinel-1 | Multivariate alteration detection (MAD) and naive Bayes (NB) | (1) Damaged: Damaged destroyed | Overall accuracy: 0.67 | [61] |
| (2) Undamaged: Intact, Slightly damaged | ||||
| Sentinel-1 | Discriminant analysis | (1) Damaged | Overall accuracy: 0.68 | [62] |
| (2) Undamaged | ||||
| ALOS2 | Random forest | (1) Damaged: Destruction | Overall accuracy: 0.86 | [102] |
| (2) Undamaged: Negligible to slight damage, Moderate damage, Substantial to heavy damage, Very heavy damage | ||||
| PALSAR-2 | Discriminant analysis | (1) Damaged | Kappa: 0.69 | [103] |
| (2) Undamaged | ||||
| Sentinel-1 | Discriminant analysis | (1) Damaged: Destroyed | Overall accuracy: 0.77 | [42] |
| (2) Undamaged: No damage | ||||
| Sentinel-1 and Sentinel-2 | Discriminant analysis | (1) Damaged: Destroyed | Accuracy: 0.58 | [45] |
| (2) Undamaged | ||||
| Sentinel-1 | Coherence time series | (1) Damaged | CI: 0.8 | [39] |
| (2) Undamaged | ||||
| Sentinel-1 | RNN | (1) Damaged: Need to be demolished, Heavily damaged, Collapsed | AUC: 0.76 | [53] |
| (2) Undamaged: Slightly damaged, No damaged | ||||
| xBD | Machine learning | (1) Damaged: Severe damage destroyed | AUC: 0.83 | [104] |
| (2) Undamaged: No damage | ||||
| Optical and SAR | Mechanical learning | (1) Damaged | Overall accuracy: 0.9 | [105] |
| (2) Undamaged | ||||
| xBD | UNET | (1) Damaged: Destroyed | F1: 0.83, Overall accuracy: 0.84 | [106] |
| (2) Undamaged: No damage | ||||
| xBD | CNN | (1) Damaged: Destroyed, Major damaged | F1: 0.71 | [107] |
| (2) Undamaged: No damage, Minor damage | ||||
| xBD | Deep learning | (1) Damaged: Destroyed | Overall accuracy: 0.95, F1: 0.90 | [108] |
| (2) Undamaged: No damage | ||||
| GF1 and Google Earth images | CNN | (1) Damaged: Destroyed | F1: 0.69, Overall accuracy: 0.84, Precision: 0.58, IoU: 0.522 | [109] |
| (2) Undamaged: No damage | ||||
| xBD | SVM | (1) Damaged: Destroyed, Major damaged | Overall accuracy: 0.97 | [110] |
| (2) Undamaged: No damage, Minor damaged | ||||
| LiDAR | SVM | (1) Damaged: Debris | Overall accuracy: 0.91 | [34] |
| (2) Undamaged: Intact | ||||
| LiDAR | FCSNN | (1) Damaged: Collapsed | Accuracy: 0.87, F1: 0.79, Precision: 0.78, Recall: 0.80 | [35] |
| (2) Undamaged: Intact | ||||
| (1) Damaged: Collapse | Accuracy: 0.95, F1: 0.54, Precision: 0.70, Recall: 0.43 | |||
| (2) Undamaged: Non-collapsed |
The comparison analysis demonstrates that fully utilizing Sentinel-1’s intensity, phase, and polarimetry features achieves performance comparable to other research studies, reaffirming that freely available Sentinel-1 SAR data constitute a valuable resource for post-earthquake building damage classification, particularly for the collapsed buildings.
4.2 Performance constraints in building damage classification
Building upon the aforementioned analysis, two key conclusions can be drawn. First, while the performance metrics of our work is lower compared to those using optical data, our results exhibit close similarity to those of numerous studies relying on SAR data. Second, the performance of multi-class classification shows a relatively more pronounced decline when contrasted with that of binary classification.
The significant disparity in spatial resolution between optical and SAR data represents a primary factor contributing to the poorer performance of SAR data in building damage classification. Sub-meter optical data enables individual building-level damage detection [108–110], as it not only accentuates the geometric, textural, and spectral features of each building, but also provides sufficient pixels within each building footprint for detailed analysis. In contrast, the medium spatial resolution (10 m) of Sentinel-1 data often results in mixed pixels rather than pure building-only pixels [46,47,53]. Consequently, in this pixel-oriented [67] building damage classification study, substantial variations in damage levels among buildings or the variations in surface objects within a single pixel hinder the RF classifier’s ability to effectively learn the characteristics of each damage level, leading to relatively lower classification metrics.
The dataset employed for RF classifier was produced using building footprint data sourced from prior studies and OSM. As illustrated in Figure 5a–c, a subset of these footprints exhibited positional inaccuracies, encompassing regions with mixed surface objects rather than strictly corresponding to the building. This spatial misalignment was exacerbated by the medium resolution of Sentinel-1 data, which predominantly yielded mixed pixels containing heterogeneous surface objects rather than pure building-only pixels [46]. Moreover, the field survey data provided by FEMA Hazus [63] and Yazilim and Cizenler [72] are point vectors, with some points showing inconsistency with the building footprint data or even deviating from actual building positions (Figure 5d–f). This inconsistency introduces labeling errors where damaged buildings may be misclassified as undamaged and vice versa, thereby degrading the quality of the dataset.
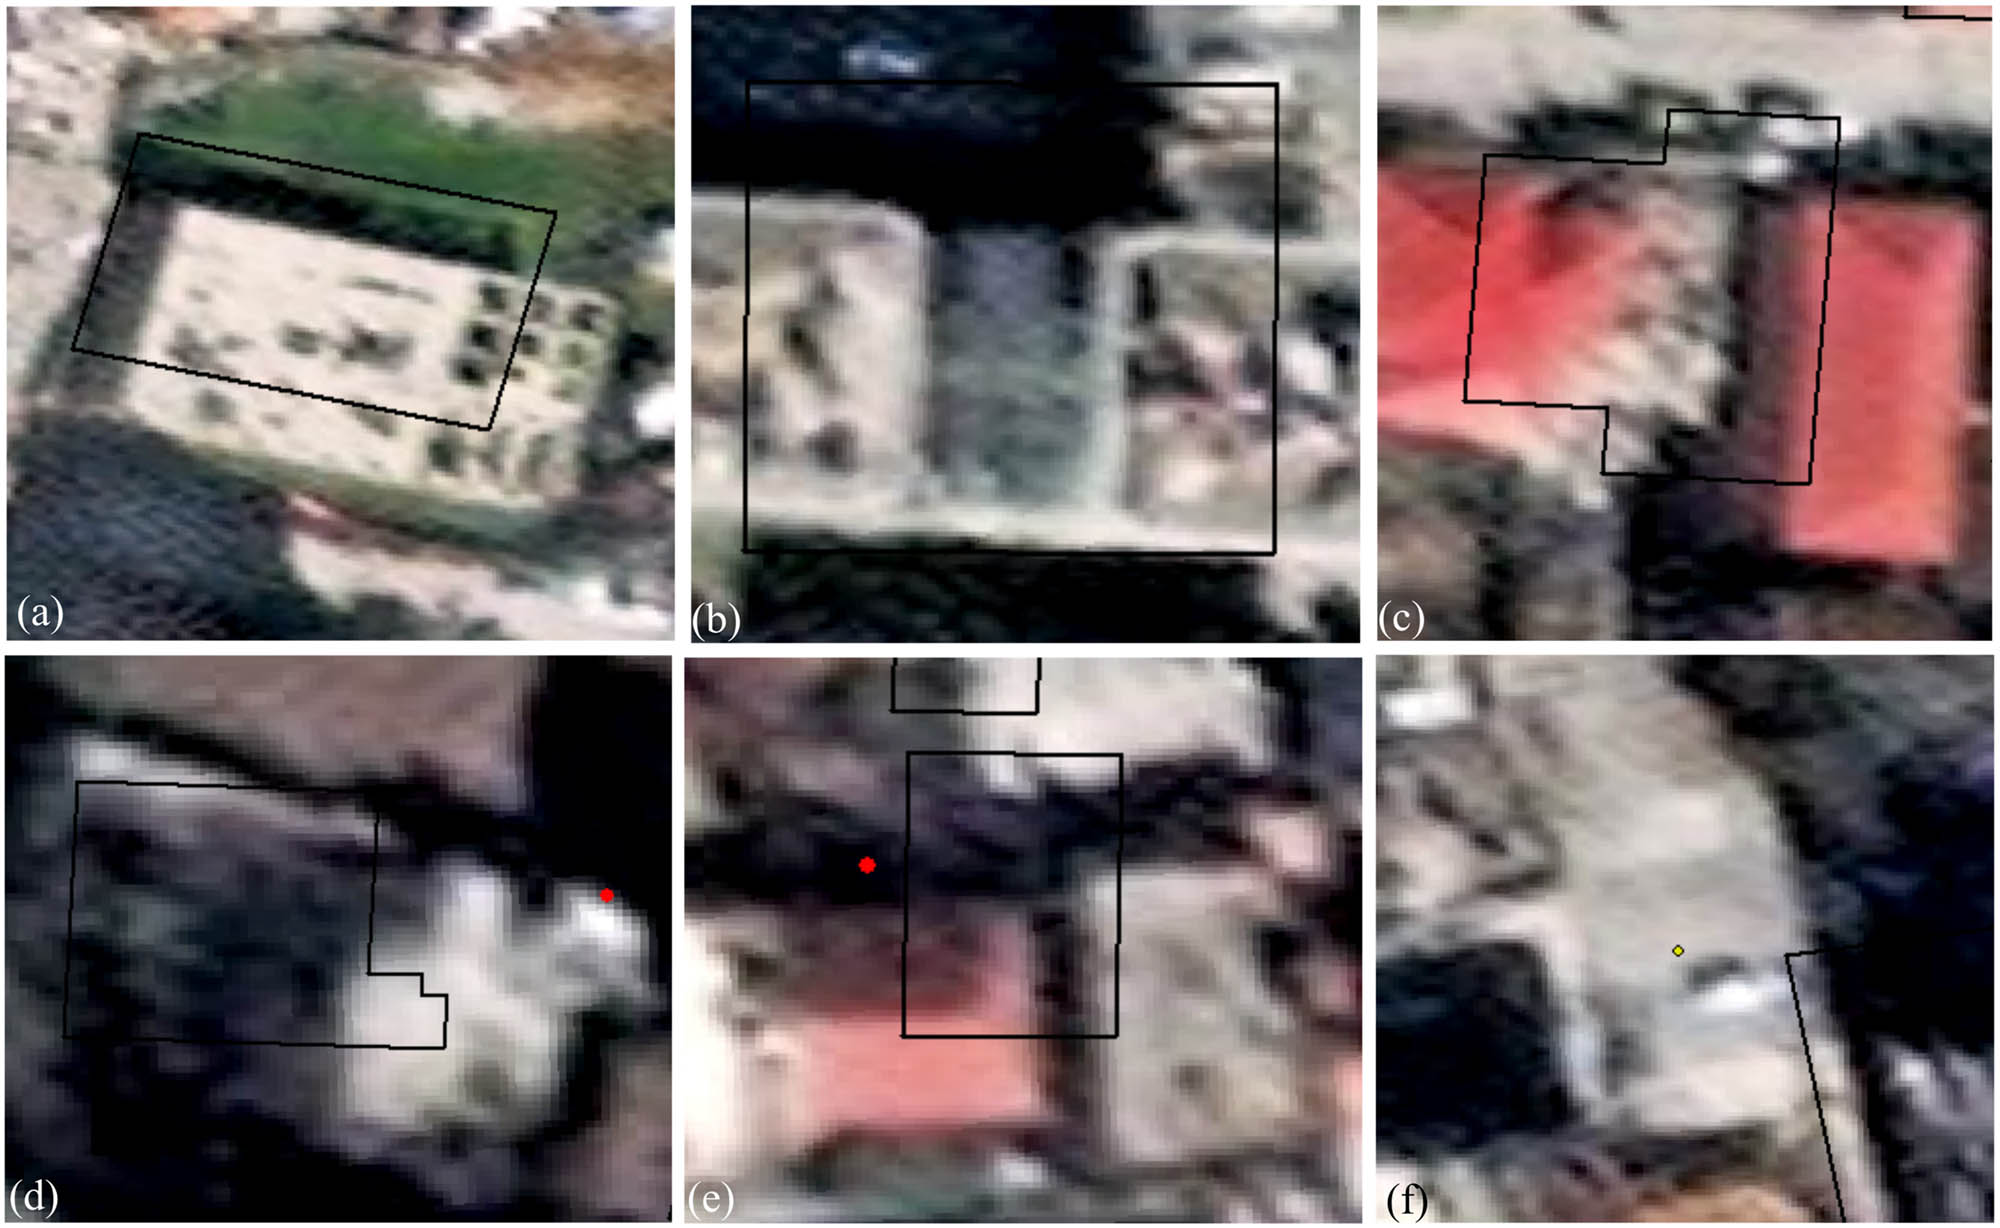
Spatial inconsistency between the building footprint, field survey points, and actual building position. (a)–(c) The spatial inconsistency between the building footprint and actual building position, and (d)–(f) the spatial inconsistency between the field survey points and actual building position. The black polygons are the building footprints, and the points are the field survey locations.
Like most studies [19,39,47,53,59], field survey data serves as the reference for constructing the datasets used by the RF classifier. The damage levels assigned to each survey point/polygon are also used as the labels for the machine learning datasets. These field surveys typically employ the widely used EMS-98 (European Macroseismic Scale 1998) damage scales [111], which ranges from “negligible to slight damage” to “destruction”. Dell’Acqua and Gamba [112] and Cotrufo et al. [86] proposed building damage scales adapted from EMS-98 specifically for high-resolution optical data. However, a comparable building damage scale tailored to SAR data remains lacking [47]. Consequently, similar to previous studies, we adopt the building damage scale used in the field survey data. This approach introduces potential errors because the field survey scales are not well-aligned with the information derivable from SAR data. For example, buildings labeled “to be demolished” in Yazilim’s field survey [72] might correspond to buildings that remain standing despite the first floor collapse. Identifying such buildings using SAR intensity or texture features can be challenging. Furthermore, buildings experiencing severe damage to the internal walls or columns without visible external damage or collapse may be classified as “serious damage” in a field survey. These buildings, however, are highly likely to be classified as “undamage” in SAR images. Thus, this discrepancy also contributes to the relatively poor performance observed in the multi-class classification. It also explained why the higher percentages of collapsed buildings in the dataset (Table 7) correlate with improved performance metrics (Table 8) in binary classification.
4.3 Limitations and outlook
Our focus is on evaluating the feasibility and accuracy of the medium-resolution Sentinel-1 SAR data for building damage classification, utilizing its full suite of features (intensity, phase, and polarimetry). Although the performance metrics of this study do not match the performance of optical data-based approaches, our results demonstrate accuracy comparable to numerous studies fusing Sentinel-1 with other data sources. These indicate that freely available Sentinel-1 data can provide an effective and efficient means for timely building damage classification, particularly in undeveloped regions or under conditions where optical data are unavailable.
With the continuous development of building damage classification methods, scholars expect that pre-trained models constructed in a certain region can be directly applied to other regions. The key to achieving this goal lies in continuously enriching the damaged building sample library. xBD [113] is the first building damage classification dataset to date, and the dataset samples are produced using high spatial resolution optical imagery. Since in high spatial resolution optical imagery, different damage levels, especially collapsed buildings, have basically the same features, a pre-trained model based on this dataset can be well applied to new disaster areas. However, there is currently no building damage classification dataset based on SAR imagery. In this study, we attempted to extract collapsed buildings in Turkey using a pre-trained model (collapse vs no damage) obtained from the Puerto Rico dataset and vice versa, but the detection results were not good (Table 11). Then, for collapsed buildings in Turkey and Puerto Rico, three combinations of randomly selected features used by RF classifier were compared (Figure 6). The figures illustrate the distinct feature distribution of collapsed buildings between the two regions for these selected features. The primary cause is attributed to mixed pixels resulting from Sentinel-1's medium spatial resolution, with secondary factors including disparities in surface characteristics (e.g., building density, vegetation density) across the two seismic areas. Therefore, our method makes it relatively difficult to provide a highly robust pre-trained model for other regions. Our approach is more suitable for using Sentinel-1 data with high spatial coverage and machine learning algorithms to complete the extraction of damaged buildings in the entire earthquake area after obtaining early-stage field survey data, providing initial information for emergency rescue and other work, and providing a reference for subsequent fine-scale assessment of building damage using high spatial resolution optical imagery or commercial SAR satellites. It should also be noted that the proposed method is better suited for detecting extensive collapsed buildings, and damage occurred in dense building regions rather than individual smaller buildings.
Performance metrics for cross-region classification
| Object | Pre-trained | |
|---|---|---|
| Puerto Rico | Turkey | |
| Turkey | F1 score: 0.43 | |
| Overall accuracy: 0.53 | ||
| Puerto Rico | F1 score: 0.33 | |
| Overall accuracy: 0.51 | ||
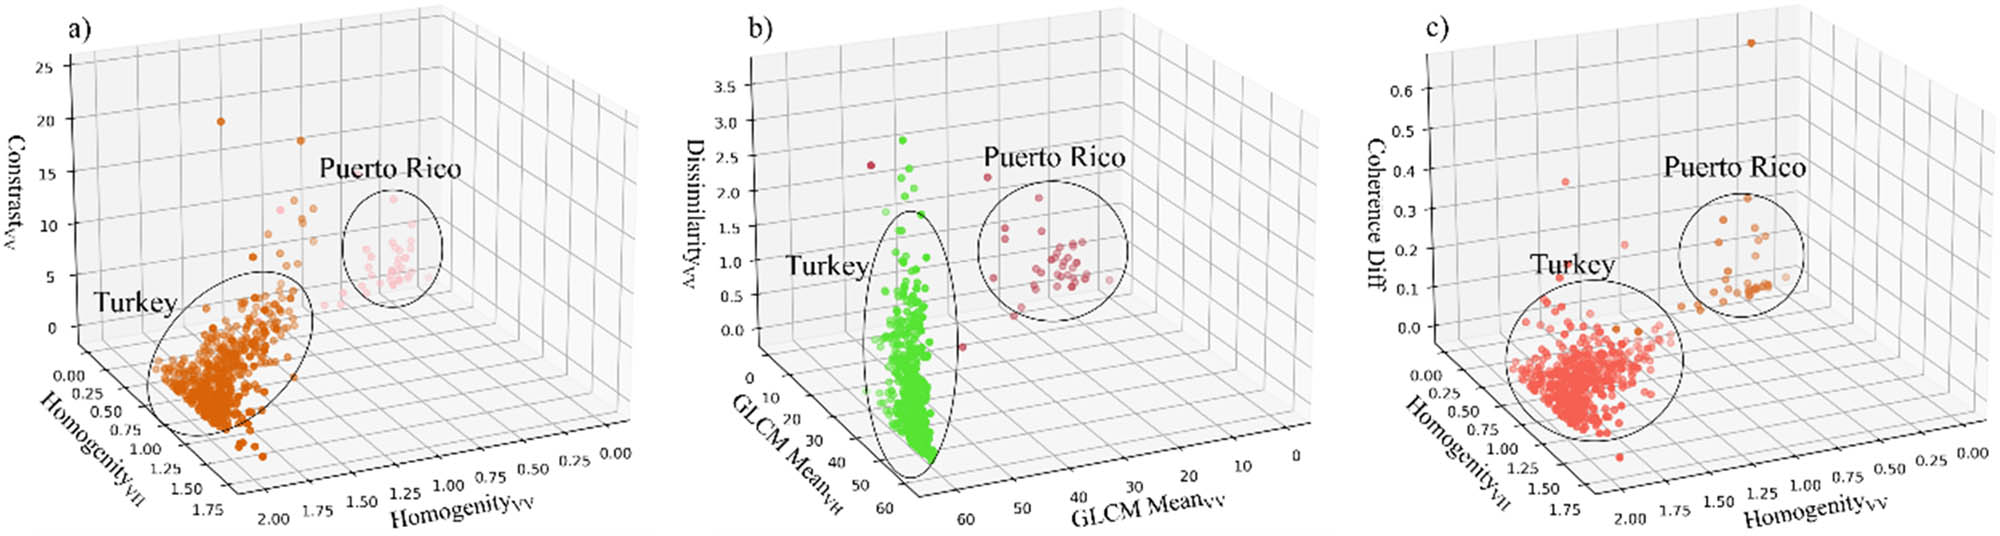
Distribution of three randomly selected features: (a) and (b) for post-earthquake features and (c) for pre-earthquake features. The figures illustrate the distinct feature distribution of collapsed buildings between the two regions for these selected features.
In this study, we only used the ascending data in the study areas. Different line-of-sight direction observation can obtain additional features of buildings. In the future, descending data can be combined to investigate how the performance of our approach can be improved. Moreover, our approach employs pixel-oriented analysis [59], which not only reduces computational time to meet the timeliness requirements of the emergency response but also imposes no strict hardware demands on computing devices. In the future, the image-oriented machine learning method, such as U-net, can replace the RF classifier to explore whether the performance could be improved.
5 Conclusion
This study presents a new approach solely relying on Sentinel-1 data, exploiting all features of it and using a readily applied machine learning model to develop a rapid, microregion-level building damage classification. Taking the earthquake-affected regions of Puerto Rico and Turkey as examples, this study investigates the capabilities of the proposed approach that fully utilizes the intensity, phase, and polarimetry features of Sentinel-1 for multi-class and binary classification of building damage. Thereby aims to address the limitations of existing studies, which typically only utilize partial Sentinel-1 features or integrate them with an ancillary dataset for building damage classification. The key conclusions are as follows:
For multi-class classification, the proposed approach achieved
For binary classification, we evaluated different scenarios characterized by different proportions of collapsed buildings and no damage buildings, respectively. The overall accuracy and F1 score for the two earthquakes across these scenarios ranged from 0.631 to 0.813 and 0.630 to 0.806, respectively. These metrics are also comparable to the previous methods (overall accuracy ranging from 0.58 to 0.86), and for the destroyed vs undamaged classification, the performance of our approach is higher than that of studies using only one or two Sentinel-1 features. Moreover, the binary classification performance under different scenarios indicated that our approach can achieve the highest metrics for destroyed vs undamaged classification.
The result of transferring a pre-trained model across the two earthquake-affected regions is suboptimal. This indicates that medium spatial resolution data is more suitable for the timely building damage detection in the local region after the earthquake. Additionally, high spatial resolution SAR data are necessary in the future to construct the microwave-“xBD” database.
Acknowledgments
We would like to thank the anonymous reviewers for their helpful suggestions, which improved the quality of this manuscript. We also would like to thank the ESA for collecting the Copernicus Sentinel-1 data (https://scihub.copernicus.eu/) and to Yanchen Yang for the assistance in the Turkey validation data collection.
-
Funding information: This research was funded by the Sciences and Technology Funds of Beijing Earthquake Agency, grant number BJMS-2025005, and the Scientific Research Funds of the Institute of Engineering Mechanics, China Earthquake Administration, grant numbers 2020EEEVL305 and 2022QJGJ04.
-
Author contributions: Xiaoran Lv developed the model code, processed the data, and wrote the original draft. Guichun Luo did the supervision. Lifu Zheng prepared the manuscript with contributions from all co-authors.
-
Conflict of interest: The authors declare no conflicts of interest.
References
[1] Li J, Huang X, Hu Y, Zhang Z, Zhang X, Zhang S, et al. Fusion of optical daily and night-time light remote sensing images for collapsed building detection: A case in Turkey Mw 7.8 earthquake. Geomat Inf Sci Wuhan Univ. 2023;48(10):1706–14.Search in Google Scholar
[2] An LQ, Zhang JF, Ricardo M, Zhang L. A review and prospective research of earthquake damage assessment and remote sensing. Natl Remote Sens Bull. 2024;28(4):860–84.Search in Google Scholar
[3] Karimzadeh S, Miyajima M, Hassanzadeh R, Amiraslanzadeh R, Kamel B. A GIS-based seismic hazard, building vulnerability and human loss assessment for the earthquake scenario in Tabriz. Soil Dyn Earthq Eng. 2014;66:263–80.10.1016/j.soildyn.2014.06.026Search in Google Scholar
[4] Yamazaki M, Matsuoka M. Remote sensing technologies in post-disaster damage assessment. J Earthq Tsunami. 2007;1(3):193–210.10.1142/S1793431107000122Search in Google Scholar
[5] Dong L, Shan J. A comprehensive review of earthquake-induced building damage detection with remote sensing techniques. ISPRS J Photogramm Remote Sens. 2013;84:85–99.10.1016/j.isprsjprs.2013.06.011Search in Google Scholar
[6] Ge P, Gokon H, Meguro K. A review on synthetic aperture radar-based building damage assessment in disasters. Remote Sens Environ. 2020;240:111693.10.1016/j.rse.2020.111693Search in Google Scholar
[7] Xu Y. A comprehensive review of CNN-based methods for earthquake-induced building damage detection using remote sensing imagery. Comput Fraud Secur. 2025;663–79.10.52710/cfs.385Search in Google Scholar
[8] Ogawa N. Photo-interpretation of building damage due to earthquakes using aerial photographs. Proceedings of the 12th World Conference on Earthquake Engineering (12 WCEE), Auckland, New Zealand, 2000.Search in Google Scholar
[9] Kouchi K, Matsuoka M, Kohiyama M, Muraoka N. Damage detection from high-resolution satellite images for the 2003 Boumerdes, Algeria earthquake. Asia Conference on Earthquake Engineering, Manila, Philippines, 2004.Search in Google Scholar
[10] Ishii M, Goto T, Sugiyama T, Saji H, Abe K. Detection of earthquake damaged areas from aerial photographs by using color and edge information. The 5th Asian Conference on Computer Visio, Melbourne, Australia, 2002.Search in Google Scholar
[11] Abdi G, Esfandiari M, Jabari S, eds. Building damage detection in post-event high-resolution imagery using deep transfer learning. 2021 IEEE International Geoscience and Remote Sensing Symposium IGARSS; 2021.10.1109/IGARSS47720.2021.9553720Search in Google Scholar
[12] Li X, Yang W, Ao T, Li H, Chen W. An improved approach of information extraction for earthquake-damaged buildings using high-resolution imagery. J Earthq Tsunami. 2011;5(4):389–99.10.1142/S1793431111001157Search in Google Scholar
[13] Li X, Guo H, Zhang L, Chen X, Liang L. A new approach to collapsed building extraction using RADARSAT-2 polarimetric SAR imagery. IEEE Geosci Remote Sens Lett. 2012;9(4):677–81.10.1109/LGRS.2011.2178392Search in Google Scholar
[14] Zhai W, Huang C. Fast building damage mapping using a single post-earthquake PolSAR image: a case study of the 2010 Yushu earthquake. Earth Planets Space. 2016;68:86.10.1186/s40623-016-0469-2Search in Google Scholar
[15] Shan LI, Fengli ZH, Shiying WE, Na LI, Yun SH. SAR image visual optimization and building damage assessment based on polarimetric decomposition combination. J Univ Chin Acad Sci. 2020;37(6):750–9.Search in Google Scholar
[16] Zhai W, Jingfa Z, Xiulai X, Jinghan W, Haoran Z, Xinxin Y, et al. Damaged building extraction from post-earthquake PolSAR data based on the Fourier transform. Remote Sens Lett. 2021;12(6):594–603.10.1080/2150704X.2021.1906975Search in Google Scholar
[17] Chen Q, Nie Y, Li L, Liu X. Buildings damage assessment using texture features of polarization decomposition components. J Remote Sens. 2017;21(6):955–65.10.11834/jrs.20176414Search in Google Scholar
[18] Du Y, Gong L, Li Q, Zhan S, Zhang J. Earthquake induced building damage assessment on SAR multi-texture feature fusion. Remote Sens Technol Appl. 2021;36(4):865–72.Search in Google Scholar
[19] Macchiarulo V, Giardina G, Milillo P, Aktas Y, Whitworth M. Integrating post-event very high resolution SAR imagery and machine learning for building-level earthquake damage assessment. Bull Earthq Eng. 2024;1–27. 10.1007/s10518-024-01877-1.Search in Google Scholar
[20] Zhai W, Shen HF, Huang CL. Collapsed buildings extraction from the PolSAR image based on the analysis of texture feature. Remote Sens Technol Appl. 2016;31(5):975–82.Search in Google Scholar
[21] Gokon H, Meguro K. Building damage assessment using intensity SAR data with different incidence angles and longtime interval. J Disaster Res. 2019;14(3):456–65.Search in Google Scholar
[22] Zhai W, Huang C, Pei W. Building damage assessment based on the fusion of multiple texture features using a single post-earthquake PolSAR image. Remote Sens. 2019;11(8):897.10.3390/rs11080897Search in Google Scholar
[23] Bai Y, Gao C, Singh S, Koch M, Adriano B, Mas E, et al. A framework of rapid regional tsunami damage recognition from post-event TerraSAR-X imagery using deep neural networks. IEEE Geosci Remote Sens Lett. 2018;15(1):43–7.10.1109/LGRS.2017.2772349Search in Google Scholar
[24] Adams B, Mansouri B, Huyck C. Streamlining post-earthquake data collection and damage assessment for the 2003 Bam, Iran, earthquake using VIEWS™ (visualizing impacts of earthquakes with satellites). Earthq Spectra. 2005;21(1_suppl):213–8.10.1193/1.2098588Search in Google Scholar
[25] Yano Y, Matsuoka M. Visual damage interpretation of buildings in Bam city using QuickBird images following the 2003 Bam, Iran, Earthquake. Earthq Spectra. 2005;21(S1):S329–S336.10.1193/1.2101807Search in Google Scholar
[26] Yusuf Y, Matsuoka M. Damage assessment after 2001 Gujarat earthquake using Landsat7 satellite images. J Indian Soc Remote Sens. 2001;29:17–22.10.1007/BF02989909Search in Google Scholar
[27] Rathje E, Crawford M, Woo K, Neuenschwander A. Damage patterns from satellite images of the 2003 Bam, Iran, earthquake. Earthq Spectra. 2005;21(1_suppl):295–307.10.1193/1.2101047Search in Google Scholar
[28] Miura H, Midorikawa S, Soh H. Texture analysis of high-resolution satellite images for damage detection in the 2010 Haiti earthquake. J Jpn Assoc Earthq Eng. 2012;12(6):2–20.10.5610/jaee.12.6_2Search in Google Scholar
[29] Chini M, Cinti F, Stramondo S. Co-seismic surface effects from very high resolution panchromatic images: The case of the 2005 Kashmir (Pakistan) earthquake. Nat Hazards Earth Syst Sci. 2011;11:931–43.10.5194/nhess-11-931-2011Search in Google Scholar
[30] Xie Z, Zhou Z, He X, Fu Y, Gu J, Zhang J. Methodology for object-level change detection in post-earthquake building damage assessment based on remote sensing images: OCD-BDA. Remote Sens. 2024;16(22):4263.10.3390/rs16224263Search in Google Scholar
[31] Qiao W, Li S, Qi W, Quan W, Shiyang T, Li Z. Revolutionizing building damage detection: A novel weakly supervised approach using high-resolution remote sensing images. Int J Digital Earth. 2024;17(1):2298245.10.1080/17538947.2023.2298245Search in Google Scholar
[32] Chesnel AL, Binet R, Wald L, eds. Object oriented assessment of damage due to natural disaster using very high resolution images. 2007 IEEE International Geoscience and Remote Sensing Symposium; 2007.10.1109/IGARSS.2007.4423655Search in Google Scholar
[33] Tong X, Hong Z, Liu S, Zhang X, Xie H, Li Z, et al. Building-damage detection using pre- and post-seismic high-resolution satellite stereo imagery: A case study of the May 2008 Wenchuan earthquake. ISPRS J Photogramm Remote Sens. 2012;68:13–27.10.1016/j.isprsjprs.2011.12.004Search in Google Scholar
[34] Rastiveis H, Eslamizade F, Hosseini-Zirdoo E. Building damage assessment after earthquake using post-event lidar data. Int Arch Photogramm Remote Sens Spat Inf Sci. 2015;40:595–600.10.5194/isprsarchives-XL-1-W5-595-2015Search in Google Scholar
[35] Ramadhan MML, Jati G, Jatmiko W. Building damage assessment using feature concatenated Siamese neural network. IEEE Access. 2024;12:19100–16.10.1109/ACCESS.2024.3361287Search in Google Scholar
[36] Matsuoka M. Use of SAR imagery for monitoring areas damaged due to the 2006 Mid Java, Indonesia earthquake. 4th International Workshop on Remote Sensing for Post-Disaster Response, Cambridge, UK, 2006.Search in Google Scholar
[37] Kim M, Park S-E, Lee S-J. Detection of damaged buildings using temporal SAR data with different observation modes. Remote Sens. 2023;15:308.10.3390/rs15020308Search in Google Scholar
[38] Ito Y, Hosokawa M, Matsuoka M, eds. A degree estimation model of earthquake damage using temporal coherence ratio. IGARSS 2003 2003 IEEE International Geoscience and Remote Sensing Symposium Proceedings (IEEE Cat No03CH37477); 2003.Search in Google Scholar
[39] Liu H, Song C, Li Z, Liu Z, Ta L, Zhang X, et al. A new method for the identification of earthquake-damaged buildings using Sentinel-1 multitemporal coherence optimized by homogeneous SAR pixels and histogram matching. IEEE J Sel Top Appl Earth Obs Remote Sens. 2024;17:7124–43.10.1109/JSTARS.2024.3377218Search in Google Scholar
[40] Karimzadeh S, Mastuoka M. Building damage assessment using multisensor dual-polarized synthetic aperture radar data for the 2016 M 6.2 Amatrice Earthquake, Italy. Remote Sens. 2017;9(4):330.10.3390/rs9040330Search in Google Scholar
[41] Chen SW, Wang XS, Sato M. Urban damage level mapping based on scattering mechanism investigation using fully polarimetric SAR data for the 3.11 East Japan earthquake. IEEE Trans Geosci Remote Sens. 2016;54(12):6919–29.10.1109/TGRS.2016.2588325Search in Google Scholar
[42] Akhmadiya A, Nabiyev N, Moldamurat K, Dyussekeyev K, Atanov S. Use of Sentinel-1 dual polarization multi-temporal data with gray level co-occurrence matrix textural parameters for building damage assessment. Pattern Recognit Image Anal. 2021;31(2):240–50.10.1134/S1054661821020036Search in Google Scholar
[43] Xuedong Z, Wenxi L, Shuguang H. Urban change detection in TerraSAR image using the difference method and SAR coherence coefficient. J Eng Sci Technol Rev. 2018;11:18–23.10.25103/jestr.113.03Search in Google Scholar
[44] Oxoli D, Boccardo P, Brovelli MA, Molinari ME, Guarnieri AM. Coherent change detecting for repeated-pass interferometric SAR images: an application to earthquake damage assessment on buildings. In The International Archives of the Photogrammetry, Remote Sensing and Spatial Information Sciences. Istanbul, Turkey: 2018. p. 383–8.10.5194/isprs-archives-XLII-3-W4-383-2018Search in Google Scholar
[45] Aimaiti Y, Sanon C, Koch M, Baise LG, Moaveni B. War related building damage assessment in Kyiv, Ukraine, Using Sentinel-1 Radar and Sentinel-2 optical images. Remote Sens. 2022;14(24):6239.10.3390/rs14246239Search in Google Scholar
[46] Sandhini Putri AF, Widyatmanti W, Umarhadi DA. Sentinel-1 and Sentinel-2 data fusion to distinguish building damage level of the 2018 Lombok Earthquake. Remote Sens Appl: Soc Environ. 2022;26:100724.10.1016/j.rsase.2022.100724Search in Google Scholar
[47] Rao A, Jung J, Silva V, Molinario G, Yun SH. Earthquake building damage detection based on synthetic-aperture-radar imagery and machine learning. Nat Hazards Earth Syst Sci. 2023;23(2):789–807.10.5194/nhess-23-789-2023Search in Google Scholar
[48] Wang C, Zhang H, Wu F, Zhang B, Tang Y, Wu H, et al. Disaster phenomena of Wenchuan earthquake in high resolution airborne synthetic aperture radar images. J Appl Remote Sens. 2009;3(1):031690.10.1117/1.3154558Search in Google Scholar
[49] Matsuoka M, Nojima N. Building damage estimation by integration of seismic intensity information and satellite L-band SAR imagery. Remote Sens. 2010;2(9):2111–26.10.3390/rs2092111Search in Google Scholar
[50] Cui L, Wang X, Dou A, Ding X, High Resolution SAR. Imaging employing geometric features for extracting seismic damage of buildings. ISPRS - Int Arch Photogramm Remote Sens Spat Inf Sci. 2018;42:239–44.10.5194/isprs-archives-XLII-3-239-2018Search in Google Scholar
[51] Ito Y, Hosokawa M, eds. Damage estimation model using temporal coherence ratio. IEEE International Geoscience and Remote Sensing Symposium; 2002.Search in Google Scholar
[52] Sharma RC, Tateishi R, Hara K, Nguyen HT, Gharechelou S, Nguyen LV. Earthquake damage visualization (EDV) technique for the rapid detection of earthquake-induced damages using SAR data. Sensors. 2017;17(2):235.10.3390/s17020235Search in Google Scholar PubMed PubMed Central
[53] Yang Y, Xie C, Tian B, Guo Y, Zhu Y, Yang Y, et al. Large-scale building damage assessment based on recurrent neural networks using SAR coherence time series: A case study of 2023 Turkey–Syria earthquake. Earthq Spectra. 2024;40(4):2285–305.10.1177/87552930241262761Search in Google Scholar
[54] Yamaguchi Y. Disaster monitoring by fully polarimetric SAR data acquired With ALOS-PALSAR. Proc IEEE. 2012;100(10):2851–60.10.1109/JPROC.2012.2195469Search in Google Scholar
[55] Liu Z, Han B, Liu H, Li Z, Neng Y, Chen B, et al. Discussion of the seismogenic fault of the 2023 herat earthquake sequence and its building damage assessment constrained by Radar Interferometry. Geomat Inf Sci Wuhan Univ. 2023;48(11):722–33.Search in Google Scholar
[56] Du Y-N, Feng D-C, Wu G. InSAR-based rapid damage assessment of urban building portfolios following the 2023 Turkey earthquake. Int J Disaster Risk Reduct. 2024;103:104317.10.1016/j.ijdrr.2024.104317Search in Google Scholar
[57] Ferrentino E, Ferdinando N, Christian B, Laura G, Alessandra M, Migliaccio M. Multi-polarization C-band SAR imagery to quantify damage levels due to the Central Italy earthquake. Int J Remote Sens. 2021;42(15):5969–84.10.1080/01431161.2021.1933247Search in Google Scholar
[58] Saganeiti L, Amato F, Nolè G, Vona M, Murgante B. Early estimation of ground displacements and building damage after seismic events using SAR and LiDAR data: The case of the Amatrice earthquake in central Italy, on 24th August 2016. Int J Disaster Risk Reduct. 2020;51:101924.10.1016/j.ijdrr.2020.101924Search in Google Scholar
[59] Yu X, Hu X, Song Y, Xu S, Li X, Song X, et al. Intelligent assessment of building damage of 2023 Turkey-Syria Earthquake by multiple remote sensing approaches. NPJ Nat Hazards. 2024;1(1):3.10.1038/s44304-024-00003-0Search in Google Scholar
[60] Sun X, Chen X, Yang L, Wang W, Zhou X, Wang L, et al. Using InSAR and PolSAR to assess ground displacement and building damage after a seismic event: Case study of the 2021 Baicheng earthquake. Remote Sens. 2022;14(13):3009.10.3390/rs14133009Search in Google Scholar
[61] Karimzadeh S, Matsuoka M. A preliminary damage assessment using dual path synthetic aperture radar analysis for the M 6.4 Petrinja Earthquake (2020), Croatia. Remote Sens. 2021;13(12):2267.10.3390/rs13122267Search in Google Scholar
[62] ElGharbawi T, Zarzoura F. Damage detection using SAR coherence statistical analysis, application to Beirut, Lebanon. ISPRS J Photogramm Remote Sens. 2021;173:1–9.10.1016/j.isprsjprs.2021.01.001Search in Google Scholar
[63] Center FGR. Puerto Rico Mw 6.4 Earthquake preliminary damage assessments dashboard, federal emergency management agency. In: Center FGR, editor. Washington, USA: The Federal Emergency Management Agency (FEMA); 2020.Search in Google Scholar
[64] Filipponi F. Sentinel-1 GRD preprocessing workflow. Proceedings. 2019;18(1):11.10.3390/ECRS-3-06201Search in Google Scholar
[65] Touzi R, Lopes A, Bruniquel J, Vachon PW. Coherence estimation for SAR imagery. IEEE Trans Geosci Remote Sens. 1999;37(1):135–49.10.1109/36.739146Search in Google Scholar
[66] Fattahi H, Agram P, Simons M. A network-based enhanced spectral diversity approach for TOPS time-series analysis. IEEE Trans Geosci Remote Sens. 2017;55(2):777–86.10.1109/TGRS.2016.2614925Search in Google Scholar
[67] Rosen PA, Gurrola E, Sacco GF, Zebker H, eds. The InSAR scientific computing environment. EUSAR 2012; 9th European Conference on Synthetic Aperture Radar; 2012.Search in Google Scholar
[68] Yunjun Z, Fattahi H, Amelung F. Small baseline InSAR time series analysis: Unwrapping error correction and noise reduction. Comput Geosci. 2019;133:104331.10.1016/j.cageo.2019.104331Search in Google Scholar
[69] Lu C-H, Ni C-F, Chang C-P, Yen J-Y, Chuang RY. Coherence difference analysis of Sentinel-1 SAR interferogram to identify earthquake-induced disasters in Urban Areas. Remote Sens. 2018;10(8):1318.10.3390/rs10081318Search in Google Scholar
[70] Ishitsuka K, Tsuji T, Matsuoka T. Detection and mapping of soil liquefaction in the 2011 Tohoku earthquake using SAR interferometry. Earth, Planets Space. 2012;64(12):1267–76.10.5047/eps.2012.11.002Search in Google Scholar
[71] Olen S, Bookhagen B. Mapping damage-affected areas after natural hazard events using Sentinel-1 coherence time series. Remote Sens. 2018;10(8):1272.10.3390/rs10081272Search in Google Scholar
[72] Yazilim G. Cizenler Y. 2023 Turkey earthquakes building damage assessment map. 2023. Available at: https://www.designsafe-ci.org/data/browser/public/designsafe.storage.published/prj-3824v2/#details-942732811040452115-242ac11b-0001-012 (accessed 20 February 2023).Search in Google Scholar
[73] Xu S, Zhao X, Dimasaka J, Noh H. M7.8 2023 Turkey EQ building damage (Last Updated Mar. 9, 2023) building damage map in Turkey derived from damage proxy maps. Abailable at: https://www.arcgis.com/home/item.html?id=86941dbff14e450bbe3f89897373c59a. (accessed 18 March 2023).Search in Google Scholar
[74] Roeslin S, Ma Q, Juárez-Garcia H, Gómez-Bernal A, Wicker J, Wotherspoon L. A machine learning damage prediction model for the 2017 Puebla-Morelos, Mexico, earthquake. Earthq Spectra. 2020;36(2_suppl):314–39.10.1177/8755293020936714Search in Google Scholar
[75] Schratz P, Muenchow J, Iturritxa E, Richter J, Brenning A. Hyperparameter tuning and performance assessment of statistical and machine-learning algorithms using spatial data. Ecol Model. 2019;406:109–20.10.1016/j.ecolmodel.2019.06.002Search in Google Scholar
[76] Probst P, Wright MN, Boulesteix A-L. Hyperparameters and tuning strategies for random forest. Wiley Interdiscip Reviews: Data Min Knowl Discovery. 2019;9(3):e1301.10.1002/widm.1301Search in Google Scholar
[77] Malkomes G, Garnett R. Bayesian optimization for automated model. 30th Conference on Neural Information Processing Systems; Barcelona Spain; 2016. p. 41–7.Search in Google Scholar
[78] Gupta R, Shah M. RescueNet: Joint building segmentation and damage assessment from satellite imagery. 2020 25th International Conference on Pattern Recognition (ICPR), Milan, Italy, 2021. p. 4405–11.10.1109/ICPR48806.2021.9412295Search in Google Scholar
[79] Zheng Z, Zhong Y, Wang J, Ma A, Zhang L. Building damage assessment for rapid disaster response with a deep object-based semantic change detection framework: From natural disasters to man-made disasters. Remote Sens Environ. 2021;265:112636.10.1016/j.rse.2021.112636Search in Google Scholar
[80] Wang Z, Zhang F, Wu C. A method of disaster-damaged buidling sample library construction based on transfer learning. Int Arch Photogramm Remote Sens Spat Inf Sci. 2022;48:65–71.10.5194/isprs-archives-XLVIII-3-W1-2022-65-2022Search in Google Scholar
[81] Zhao L, Jie Y, Pingxiang L, Liangpei Z, Lei S, Lang F. Damage assessment in urban areas using post-earthquake airborne PolSAR imagery. Int J Remote Sens. 2013;34(24):8952–66.10.1080/01431161.2013.860566Search in Google Scholar
[82] Li L, Liu X, Chen Q, Yang S. Building damage assessment from PolSAR data using texture parameters of statistical model. Comput Geosci. 2018;113:115–26.10.1016/j.cageo.2018.01.018Search in Google Scholar
[83] Chen Q, Yang H, Li L, Liu X. A novel statistical texture feature for SAR building damage assessment in different polarization modes. IEEE J Sel Top Appl Earth Obs Remote Sens. 2020;13:154–65.10.1109/JSTARS.2019.2954292Search in Google Scholar
[84] Liu Y, Li L, Chen Q, Shu M, Zhang Z, Liu X, eds. Building damage assessment of compact polarimetric SAR using statistical model texture parameter. 2017 SAR in Big Data Era: Models, Methods and Applications (BIGSARDATA); 2017.10.1109/BIGSARDATA.2017.8124923Search in Google Scholar
[85] Li Q, Lixia G, Zhang J. A correlation change detection method integrating PCA and multi- texture features of SAR image for building damage detection. Eur J Remote Sens. 2019;52(1):435–47.10.1080/22797254.2019.1630322Search in Google Scholar
[86] Cotrufo S, Constantin S, Fabio GT, Boccardo P. Building damage assessment scale tailored to remote sensing vertical imagery. Eur J Remote Sens. 2018;51(1):991–1005.10.1080/22797254.2018.1527662Search in Google Scholar
[87] Sun W, Shi L, Yang J, Li P. Building collapse assessment in urban areas using texture information from postevent SAR data. IEEE J Sel Top Appl Earth Obs Remote Sens. 2016;9(8):3792–808.10.1109/JSTARS.2016.2580610Search in Google Scholar
[88] Khvedchenya E, Gabruseva T. Fully convolutional Siamese neural networks for buildings damage assessment from satellite images; 2021. arXiv preprint arXiv:2111.00508.Search in Google Scholar
[89] Shen Y, Zhu S, Yang T, Chen C. Cross-directional feature fusion network for building damage assessment from satellite imagery; 2020. arXiv preprint arXiv:2010.14014.Search in Google Scholar
[90] May S, Dupuis A, Lagrange A, De Vieilleville F, Fernandez-Martin C. Building damage assessment with deep learning. Int Arch Photogramm Remote Sens Spat Inf Sci. 2022;43:1133–8.10.5194/isprs-archives-XLIII-B3-2022-1133-2022Search in Google Scholar
[91] Lu W, Wei L, Nguyen M. Bitemporal attention transformer for building change detection and building damage assessment. IEEE J Sel Top Appl Earth Obs Remote Sens. 2024;17:4917–35.10.1109/JSTARS.2024.3354310Search in Google Scholar
[92] Kaur N, Lee C-C, Mostafavi A, Mahdavi-Amiri A. Large-scale building damage assessment using a novel hierarchical transformer architecture on satellite images. Comput Civ Infrastruct Eng. 2023;38(15):2072–91.10.1111/mice.12981Search in Google Scholar
[93] Braik AM, Koliou M. Automated building damage assessment and large-scale mapping by integrating satellite imagery, GIS, and deep learning. Comput Civ Infrastruct Eng. 2024;39(15):2389–404.10.1111/mice.13197Search in Google Scholar
[94] Lin Q, Ci T, Wang L, Mondal SK, Yin H, Wang Y. Transfer learning for improving seismic building damage assessment. Remote Sens. 2022;14(1):201.10.3390/rs14010201Search in Google Scholar
[95] Cheng C-S, Behzadan AH, Noshadravan A. Deep learning for post-hurricane aerial damage assessment of buildings. Comput Civ Infrastruct Eng. 2021;36(6):695–710.10.1111/mice.12658Search in Google Scholar
[96] Ma Y, Zhou F, Wen G, Gen H, Huang R, Liu G, et al. Assessment of building and eletrical facilities damaged by flood and earthquake from satellite imagery. Int Arch Photogramm Remote Sens Spat Inf Sci. 2022;46:133–40.10.5194/isprs-archives-XLVI-3-W1-2022-133-2022Search in Google Scholar
[97] Bai Y, Hu J, Su J, Liu X, Liu H, He X, et al. Pyramid pooling module-based semi-siamese network: A benchmark model for assessing building damage from xBD satellite imagery datasets. Remote Sens. 2020;12(24):4055.10.3390/rs12244055Search in Google Scholar
[98] Deng L, Wang Y. Post-disaster building damage assessment based on improved U-Net. Sci Rep. 2022;12(1):15862.10.1038/s41598-022-20114-wSearch in Google Scholar PubMed PubMed Central
[99] Bai Y, Adriano B, Mas E, Gokon H, Koshimura S. Object-based building damage assessment methodology using only post event ALOS-2/PALSAR-2 dual polarimetric SAR intensity images. J Disaster Res. 2017;12:259–71.10.20965/jdr.2017.p0259Search in Google Scholar
[100] Ge P, Gokon H, Meguro K. Building damage assessment using intensity SAR data with different incidence angles and longtime interval. 2019;14:456–65.10.20965/jdr.2019.p0456Search in Google Scholar
[101] Miura H, Midorikawa S, Matsuoka M. Building damage assessment using high-resolution satellite SAR images of the 2010 Haiti earthquake. Earthq Spectra. 2015;32:150324070149002.10.1193/033014EQS042MSearch in Google Scholar
[102] Hajeb M, Karimzadeh S, Fallahi A. Seismic damage assessment in Sarpole-Zahab town (Iran) using synthetic aperture radar (SAR) images and texture analysis. Nat Hazards. 2020;103(1):347–66.10.1007/s11069-020-03991-0Search in Google Scholar
[103] Park S-E, Jung YT. Detection of earthquake-induced building damages using polarimetric SAR data. Remote Sens. 2020;12(1):137.10.3390/rs12010137Search in Google Scholar
[104] Xu J, Lu W, Li Z, Khaitan P, Zaytseva V. Building damage detection in satellite imagery using convolutional neural networks; 2019. arXiv preprint arXiv:1910.06444.Search in Google Scholar
[105] Brunner D, Lemoine G, Bruzzone L. Earthquake damage assessment of buildings using VHR optical and SAR imagery. IEEE Trans Geosci Remote Sens. 2010;48(5):2403–20.10.1109/TGRS.2009.2038274Search in Google Scholar
[106] Ahmadi SA, Mohammadzadeh A, Yokoya N, Ghorbanian A. BD-SKUNet: Selective-kernel UNets for building damage assessment in high-resolution satellite images. Remote Sens. 2024;16(1):182.10.3390/rs16010182Search in Google Scholar
[107] Bouchard I, Rancourt M-È, Aloise D, Kalaitzis F. On transfer learning for building damage assessment from satellite imagery in emergency contexts. Remote Sens. 2022;14(11):2532.10.3390/rs14112532Search in Google Scholar
[108] Calantropio A, Chiabrando F, Codastefano M, Bourke E. Deep learning for automatic building damage assessment: application in post-disaster scenarios using UAV data. ISPRS Ann Photogramm Remote Sens Spat Inf Sci. 2021;1:113–20.10.5194/isprs-annals-V-1-2021-113-2021Search in Google Scholar
[109] Qing Y, Ming D, Wen Q, Weng Q, Xu L, Chen Y, et al. Operational earthquake-induced building damage assessment using CNN-based direct remote sensing change detection on superpixel level. Int J Appl Earth Obs Geoinf. 2022;112:102899.10.1016/j.jag.2022.102899Search in Google Scholar
[110] Wang Y, Cui L, Zhang C, Chen W, Xu Y, Zhang Q. A two-stage seismic damage assessment method for small, dense, and imbalanced buildings in remote sensing images. Remote Sens. 2022;14(4):1012.10.3390/rs14041012Search in Google Scholar
[111] Grünthal G. European macroseismic scale 1998 (EMS-98). Luxembourg: Conseil de l Europe; 1998.Search in Google Scholar
[112] Dell'Acqua F, Gamba P. Remote sensing and earthquake damage assessment: Experiences, limits, and perspectives. Proc IEEE. 2012;100(10):2876–90.10.1109/JPROC.2012.2196404Search in Google Scholar
[113] Gupta R, Hosfelt R, Sajeev S, Patel N, Goodman B, Doshi J, et al. xBD: A dataset for assessing building damage from satellite imagery. arXiv; 2019. arXiv preprint arXiv:1911.09296.Search in Google Scholar
© 2025 the author(s), published by De Gruyter
This work is licensed under the Creative Commons Attribution 4.0 International License.
Articles in the same Issue
- Research Articles
- Seismic response and damage model analysis of rocky slopes with weak interlayers
- Multi-scenario simulation and eco-environmental effect analysis of “Production–Living–Ecological space” based on PLUS model: A case study of Anyang City
- Remote sensing estimation of chlorophyll content in rape leaves in Weibei dryland region of China
- GIS-based frequency ratio and Shannon entropy modeling for landslide susceptibility mapping: A case study in Kundah Taluk, Nilgiris District, India
- Natural gas origin and accumulation of the Changxing–Feixianguan Formation in the Puguang area, China
- Spatial variations of shear-wave velocity anomaly derived from Love wave ambient noise seismic tomography along Lembang Fault (West Java, Indonesia)
- Evaluation of cumulative rainfall and rainfall event–duration threshold based on triggering and non-triggering rainfalls: Northern Thailand case
- Pixel and region-oriented classification of Sentinel-2 imagery to assess LULC dynamics and their climate impact in Nowshera, Pakistan
- The use of radar-optical remote sensing data and geographic information system–analytical hierarchy process–multicriteria decision analysis techniques for revealing groundwater recharge prospective zones in arid-semi arid lands
- Effect of pore throats on the reservoir quality of tight sandstone: A case study of the Yanchang Formation in the Zhidan area, Ordos Basin
- Hydroelectric simulation of the phreatic water response of mining cracked soil based on microbial solidification
- Spatial-temporal evolution of habitat quality in tropical monsoon climate region based on “pattern–process–quality” – a case study of Cambodia
- Early Permian to Middle Triassic Formation petroleum potentials of Sydney Basin, Australia: A geochemical analysis
- Micro-mechanism analysis of Zhongchuan loess liquefaction disaster induced by Jishishan M6.2 earthquake in 2023
- Prediction method of S-wave velocities in tight sandstone reservoirs – a case study of CO2 geological storage area in Ordos Basin
- Ecological restoration in valley area of semiarid region damaged by shallow buried coal seam mining
- Hydrocarbon-generating characteristics of Xujiahe coal-bearing source rocks in the continuous sedimentary environment of the Southwest Sichuan
- Hazard analysis of future surface displacements on active faults based on the recurrence interval of strong earthquakes
- Structural characterization of the Zalm district, West Saudi Arabia, using aeromagnetic data: An approach for gold mineral exploration
- Research on the variation in the Shields curve of silt initiation
- Reuse of agricultural drainage water and wastewater for crop irrigation in southeastern Algeria
- Assessing the effectiveness of utilizing low-cost inertial measurement unit sensors for producing as-built plans
- Analysis of the formation process of a natural fertilizer in the loess area
- Machine learning methods for landslide mapping studies: A comparative study of SVM and RF algorithms in the Oued Aoulai watershed (Morocco)
- Chemical dissolution and the source of salt efflorescence in weathering of sandstone cultural relics
- Molecular simulation of methane adsorption capacity in transitional shale – a case study of Longtan Formation shale in Southern Sichuan Basin, SW China
- Evolution characteristics of extreme maximum temperature events in Central China and adaptation strategies under different future warming scenarios
- Estimating Bowen ratio in local environment based on satellite imagery
- 3D fusion modeling of multi-scale geological structures based on subdivision-NURBS surfaces and stratigraphic sequence formalization
- Comparative analysis of machine learning algorithms in Google Earth Engine for urban land use dynamics in rapidly urbanizing South Asian cities
- Study on the mechanism of plant root influence on soil properties in expansive soil areas
- Simulation of seismic hazard parameters and earthquakes source mechanisms along the Red Sea rift, western Saudi Arabia
- Tectonics vs sedimentation in foredeep basins: A tale from the Oligo-Miocene Monte Falterona Formation (Northern Apennines, Italy)
- Investigation of landslide areas in Tokat-Almus road between Bakımlı-Almus by the PS-InSAR method (Türkiye)
- Predicting coastal variations in non-storm conditions with machine learning
- Cross-dimensional adaptivity research on a 3D earth observation data cube model
- Geochronology and geochemistry of late Paleozoic volcanic rocks in eastern Inner Mongolia and their geological significance
- Spatial and temporal evolution of land use and habitat quality in arid regions – a case of Northwest China
- Ground-penetrating radar imaging of subsurface karst features controlling water leakage across Wadi Namar dam, south Riyadh, Saudi Arabia
- Rayleigh wave dispersion inversion via modified sine cosine algorithm: Application to Hangzhou, China passive surface wave data
- Fractal insights into permeability control by pore structure in tight sandstone reservoirs, Heshui area, Ordos Basin
- Debris flow hazard characteristic and mitigation in Yusitong Gully, Hengduan Mountainous Region
- Research on community characteristics of vegetation restoration in hilly power engineering based on multi temporal remote sensing technology
- Identification of radial drainage networks based on topographic and geometric features
- Trace elements and melt inclusion in zircon within the Qunji porphyry Cu deposit: Application to the metallogenic potential of the reduced magma-hydrothermal system
- Pore, fracture characteristics and diagenetic evolution of medium-maturity marine shales from the Silurian Longmaxi Formation, NE Sichuan Basin, China
- Study of the earthquakes source parameters, site response, and path attenuation using P and S-waves spectral inversion, Aswan region, south Egypt
- Source of contamination and assessment of potential health risks of potentially toxic metal(loid)s in agricultural soil from Al Lith, Saudi Arabia
- Regional spatiotemporal evolution and influencing factors of rural construction areas in the Nanxi River Basin via GIS
- An efficient network for object detection in scale-imbalanced remote sensing images
- Effect of microscopic pore–throat structure heterogeneity on waterflooding seepage characteristics of tight sandstone reservoirs
- Environmental health risk assessment of Zn, Cd, Pb, Fe, and Co in coastal sediments of the southeastern Gulf of Aqaba
- A modified Hoek–Brown model considering softening effects and its applications
- Evaluation of engineering properties of soil for sustainable urban development
- The spatio-temporal characteristics and influencing factors of sustainable development in China’s provincial areas
- Application of a mixed additive and multiplicative random error model to generate DTM products from LiDAR data
- Gold vein mineralogy and oxygen isotopes of Wadi Abu Khusheiba, Jordan
- Prediction of surface deformation time series in closed mines based on LSTM and optimization algorithms
- 2D–3D Geological features collaborative identification of surrounding rock structural planes in hydraulic adit based on OC-AINet
- Spatiotemporal patterns and drivers of Chl-a in Chinese lakes between 1986 and 2023
- Land use classification through fusion of remote sensing images and multi-source data
- Nexus between renewable energy, technological innovation, and carbon dioxide emissions in Saudi Arabia
- Analysis of the spillover effects of green organic transformation on sustainable development in ethnic regions’ agriculture and animal husbandry
- Factors impacting spatial distribution of black and odorous water bodies in Hebei
- Large-scale shaking table tests on the liquefaction and deformation responses of an ultra-deep overburden
- Impacts of climate change and sea-level rise on the coastal geological environment of Quang Nam province, Vietnam
- Reservoir characterization and exploration potential of shale reservoir near denudation area: A case study of Ordovician–Silurian marine shale, China
- Seismic prediction of Permian volcanic rock reservoirs in Southwest Sichuan Basin
- Application of CBERS-04 IRS data to land surface temperature inversion: A case study based on Minqin arid area
- Geological characteristics and prospecting direction of Sanjiaoding gold mine in Saishiteng area
- Research on the deformation prediction model of surrounding rock based on SSA-VMD-GRU
- Geochronology, geochemical characteristics, and tectonic significance of the granites, Menghewula, Southern Great Xing’an range
- Hazard classification of active faults in Yunnan base on probabilistic seismic hazard assessment
- Characteristics analysis of hydrate reservoirs with different geological structures developed by vertical well depressurization
- Estimating the travel distance of channelized rock avalanches using genetic programming method
- Landscape preferences of hikers in Three Parallel Rivers Region and its adjacent regions by content analysis of user-generated photography
- New age constraints of the LGM onset in the Bohemian Forest – Central Europe
- Characteristics of geological evolution based on the multifractal singularity theory: A case study of Heyu granite and Mesozoic tectonics
- Soil water content and longitudinal microbiota distribution in disturbed areas of tower foundations of power transmission and transformation projects
- Oil accumulation process of the Kongdian reservoir in the deep subsag zone of the Cangdong Sag, Bohai Bay Basin, China
- Investigation of velocity profile in rock–ice avalanche by particle image velocimetry measurement
- Optimizing 3D seismic survey geometries using ray tracing and illumination modeling: A case study from Penobscot field
- Sedimentology of the Phra That and Pha Daeng Formations: A preliminary evaluation of geological CO2 storage potential in the Lampang Basin, Thailand
- Improved classification algorithm for hyperspectral remote sensing images based on the hybrid spectral network model
- Map analysis of soil erodibility rates and gully erosion sites in Anambra State, South Eastern Nigeria
- Identification and driving mechanism of land use conflict in China’s South-North transition zone: A case study of Huaihe River Basin
- Evaluation of the impact of land-use change on earthquake risk distribution in different periods: An empirical analysis from Sichuan Province
- A test site case study on the long-term behavior of geotextile tubes
- An experimental investigation into carbon dioxide flooding and rock dissolution in low-permeability reservoirs of the South China Sea
- Detection and semi-quantitative analysis of naphthenic acids in coal and gangue from mining areas in China
- Comparative effects of olivine and sand on KOH-treated clayey soil
- YOLO-MC: An algorithm for early forest fire recognition based on drone image
- Earthquake building damage classification based on full suite of Sentinel-1 features
- Potential landslide detection and influencing factors analysis in the upper Yellow River based on SBAS-InSAR technology
- Assessing green area changes in Najran City, Saudi Arabia (2013–2022) using hybrid deep learning techniques
- An advanced approach integrating methods to estimate hydraulic conductivity of different soil types supported by a machine learning model
- Hybrid methods for land use and land cover classification using remote sensing and combined spectral feature extraction: A case study of Najran City, KSA
- Streamlining digital elevation model construction from historical aerial photographs: The impact of reference elevation data on spatial accuracy
- Analysis of urban expansion patterns in the Yangtze River Delta based on the fusion impervious surfaces dataset
- A metaverse-based visual analysis approach for 3D reservoir models
- Late Quaternary record of 100 ka depositional cycles on the Larache shelf (NW Morocco)
- Integrated well-seismic analysis of sedimentary facies distribution: A case study from the Mesoproterozoic, Ordos Basin, China
- Study on the spatial equilibrium of cultural and tourism resources in Macao, China
- Urban road surface condition detecting and integrating based on the mobile sensing framework with multi-modal sensors
- Application of improved sine cosine algorithm with chaotic mapping and novel updating methods for joint inversion of resistivity and surface wave data
- The synergistic use of AHP and GIS to assess factors driving forest fire potential in a peat swamp forest in Thailand
- Dynamic response analysis and comprehensive evaluation of cement-improved aeolian sand roadbed
- Rock control on evolution of Khorat Cuesta, Khorat UNESCO Geopark, Northeastern Thailand
- Gradient response mechanism of carbon storage: Spatiotemporal analysis of economic-ecological dimensions based on hybrid machine learning
- Comparison of several seismic active earth pressure calculation methods for retaining structures
- Mantle dynamics and petrogenesis of Gomer basalts in the Northwestern Ethiopia: A geochemical perspective
- Study on ground deformation monitoring in Xiong’an New Area from 2021 to 2023 based on DS-InSAR
- Paleoenvironmental characteristics of continental shale and its significance to organic matter enrichment: Taking the fifth member of Xujiahe Formation in Tianfu area of Sichuan Basin as an example
- Equipping the integral approach with generalized least squares to reconstruct relict channel profile and its usage in the Shanxi Rift, northern China
- InSAR-driven landslide hazard assessment along highways in hilly regions: A case-based validation approach
- Attribution analysis of multi-temporal scale surface streamflow changes in the Ganjiang River based on a multi-temporal Budyko framework
- Maps analysis of Najran City, Saudi Arabia to enhance agricultural development using hybrid system of ANN and multi-CNN models
- Hybrid deep learning with a random forest system for sustainable agricultural land cover classification using DEM in Najran, Saudi Arabia
- Long-term evolution patterns of groundwater depth and lagged response to precipitation in a complex aquifer system: Insights from Huaibei Region, China
- Review Articles
- Humic substances influence on the distribution of dissolved iron in seawater: A review of electrochemical methods and other techniques
- Applications of physics-informed neural networks in geosciences: From basic seismology to comprehensive environmental studies
- Ore-controlling structures of granite-related uranium deposits in South China: A review
- Shallow geological structure features in Balikpapan Bay East Kalimantan Province – Indonesia
- A review on the tectonic affinity of microcontinents and evolution of the Proto-Tethys Ocean in Northeastern Tibet
- Special Issue: Natural Resources and Environmental Risks: Towards a Sustainable Future - Part II
- Depopulation in the Visok micro-region: Toward demographic and economic revitalization
- Special Issue: Geospatial and Environmental Dynamics - Part II
- Advancing urban sustainability: Applying GIS technologies to assess SDG indicators – a case study of Podgorica (Montenegro)
- Spatiotemporal and trend analysis of common cancers in men in Central Serbia (1999–2021)
- Minerals for the green agenda, implications, stalemates, and alternatives
- Spatiotemporal water quality analysis of Vrana Lake, Croatia
- Functional transformation of settlements in coal exploitation zones: A case study of the municipality of Stanari in Republic of Srpska (Bosnia and Herzegovina)
- Hypertension in AP Vojvodina (Northern Serbia): A spatio-temporal analysis of patients at the Institute for Cardiovascular Diseases of Vojvodina
- Regional patterns in cause-specific mortality in Montenegro, 1991–2019
- Spatio-temporal analysis of flood events using GIS and remote sensing-based approach in the Ukrina River Basin, Bosnia and Herzegovina
- Flash flood susceptibility mapping using LiDAR-Derived DEM and machine learning algorithms: Ljuboviđa case study, Serbia
- Geocultural heritage as a basis for geotourism development: Banjska Monastery, Zvečan (Serbia)
- Assessment of groundwater potential zones using GIS and AHP techniques – A case study of the zone of influence of Kolubara Mining Basin
- Impact of the agri-geographical transformation of rural settlements on the geospatial dynamics of soil erosion intensity in municipalities of Central Serbia
- Where faith meets geomorphology: The cultural and religious significance of geodiversity explored through geospatial technologies
- Applications of local climate zone classification in European cities: A review of in situ and mobile monitoring methods in urban climate studies
- Complex multivariate water quality impact assessment on Krivaja River
- Ionization hotspots near waterfalls in Eastern Serbia’s Stara Planina Mountain
- Shift in landscape use strategies during the transition from the Bronze age to Iron age in Northwest Serbia
- Assessing the geotourism potential of glacial lakes in Plav, Montenegro: A multi-criteria assessment by using the M-GAM model
- Flash flood potential index at national scale: Susceptibility assessment within catchments