Mantle dynamics and petrogenesis of Gomer basalts in the Northwestern Ethiopia: A geochemical perspective
-
Habtamu Wondem
 and
Demeke Wondem
and
Demeke Wondem

Abstract
This study investigates the petrological and geochemical characteristics of basalts from the Gomer area in the Northwestern Ethiopian Volcanic Province to explore their petrogenesis and mantle source characteristics. Traverse-based field mapping, petrographic investigation, and whole-rock geochemical analysis were conducted. The whole-rock geochemical analysis of basalts for major and trace elements was performed using inductively coupled plasma atomic emission spectrometry and inductively coupled plasma mass spectrometry, respectively. The Gomer area comprises different textured basalts, including vesicular, amygdaloidal, scoriaceous, massive basalt, and interbedded agglomerates. These basalts are primarily composed of minerals such as olivine, clinopyroxene, plagioclase, and opaque phases in varying proportions. They exhibit highly porphyritic to glomeroporphyritic textures with abundant phenocrysts of clinopyroxene and plagioclase and subordinate olivine set in an intergranular textured groundmass of the same mineral assemblage. Based on the proportion of phenocryst mineral assemblage, the studied samples are grouped as plagioclase-pyroxene phyric basalt and plagioclase phyric basalt. Geochemically, the analyzed samples are tholeiitic in composition, with hypersthene- and quartz-normative mineralogy. The Gomer basalts exhibit trace element characteristics and ratios (e.g., Zr/Nb = 12.4–19.8, La/Nb = 1.13–1.5) similar to E-MORB. Low (La/Yb) N ratios (2.19–3.85) and relatively flat HREE patterns [(Tb/Yb) N = 1.29–1.7 and (Dy/Yb) N = 1.27–1.57] indicate a high degree of partial melting of an E-MORB-type mantle in the spinel stability field. Overall, the petrogenesis of the Gomer basalts is primarily governed by fractional crystallization involving olivine, clinopyroxene, plagioclase, and occasional spinel, with minimal crustal interaction. The geochemical characteristics and trace element ratios support derivation from an E-MORB-type mantle source. These findings provide new insights into mantle heterogeneity in continental rifting settings and allow comparisons with other large igneous provinces, such as the Deccan Traps and Icelandic basalts.
1 Introduction
The volcanic formations of the Ethiopian plateau represent one of the most significant manifestations of continental flood basalt (CFB) events globally and are essential for understanding mantle processes and the geodynamic evolution of the East African Rift System. These volcanic rocks, traditionally referred to as the “Trap Series,” consist of voluminous flood basalts, minor rhyolites, and ignimbrites, later overlain by shield volcanoes mainly composed of porphyritic amygdaloidal olivine basalt [1,2,3,4]. The timing and spatial distribution of magmatism and uplift in the northwestern Ethiopian plateau have been widely attributed to the arrival of the Afar mantle plume at the base of the lithosphere around 30 Ma [5,6,7,8].
Earlier studies reported that Ethiopian plateau volcanism spanned from approximately 54–13 Ma [1,2,3]; however, more recent geochronological constraints suggest a revised onset. Numerous petrological and geochemical investigations have been carried out on volcanic rocks across the northwestern Ethiopian plateau to unravel their petrogenetic history and mantle source signatures [4,6,7,8,9,10]. These studies revealed that the basalts belong to multiple magma families – alkaline, transitional, and tholeiitic – formed via partial melting of both asthenospheric and lithospheric mantle domains [4,6,7,11,12]. Based on TiO2 concentration, the plateau basalts are further classified into three distinct magma types: low-Ti (LT, 1–2.6 wt%), high-Ti1 (HT1, 2.5–4.2 wt%), and high-Ti2 (HT2, 2.6–5 wt%) [4,6,7,12]. These types are spatially segregated rather than temporally and reflect variations in mantle source compositions and degrees of crustal contamination. LT basalts dominate the northwestern part of the province, while HT1 and HT2 basalts are more common to the east and south.
Despite regional advances, the Gomer region, located on the western margin of the Ethiopian plateau, remains unstudied mainly due to historical inaccessibility and logistical challenges. This lack of data presents a gap in understanding the spatial geochemical diversity of the plateau basalts, particularly in evaluating mantle heterogeneity and magmatic processes at localized scales. Understanding the petrology and geochemistry of basalts from underexplored areas like Gomer is critical for reconstructing mantle dynamics, deciphering the role of fractional crystallization and crustal contamination, and correlating these features with other flood basalt provinces globally. The E-MORB-like characteristics of Gomer basalts offer unique opportunities to compare them with well-documented igneous provinces such as the Deccan Traps and Icelandic basalts, enhancing our perspective on plume–lithosphere interactions and continental rifting.
This study addresses these knowledge gaps by analyzing newly acquired petrographic and geochemical data from Gomer. Specifically, it aims to (1) characterize the petrology and whole-rock geochemistry of Gomer basalts, (2) determine whether the basalts originated from an E-MORB-type mantle source and assess the role of fractional crystallization and crustal contamination, and (3) contextualize their evolution within the broader tectonic-magmatic framework of the Ethiopian plateau and comparable global volcanic provinces.
The volcanic formations of the Ethiopian plateau hold critical insights into the mantle dynamics and tectonic processes that have shaped the East African Rift system. However, despite significant research on the Ethiopian plateau’s volcanic regions, the Gomer area remains largely underexplored. This limited focus on Gomer’s basalts has left gaps in understanding the mantle source composition, petrogenesis, and specific tectonic influences within this area. The Gomer region’s inaccessibility has further hindered thorough petrographic and geochemical analyses, making representative sampling and detailed study particularly challenging.
Addressing these gaps is essential for several reasons. First, the Gomer basalts present an opportunity to assess mantle source characteristics in a specific volcanic context, contributing to a more nuanced understanding of mantle–crust interactions and potential crustal contamination. Secondly, studying Ti element variations within the basalt samples allows for a more precise classification of magma types and insights into fractional crystallization processes, which are crucial to understanding the depth and nature of melting processes within this region. Lastly, positioning the Gomer basalts within the broader Ethiopian tectonic framework will offer valuable insights into the role of rifting dynamics in the evolution of the Ethiopian plateau. The findings from this study are expected to significantly enhance knowledge on Ethiopian plateau volcanism, offering new insights into mantle dynamics, crustal interactions, and petrogenetic processes influencing the Gomer area.
2 Materials and methods
2.1 Location and accessibility
The study area, Gomer (Figure 1), is in the west Gojam Zone of Amhara National Regional State, about 565 km west of Addis Ababa, covering about 507.7 km2. The study area can be accessed using an asphalted road, which runs from Addis Ababa through Dejen, Debre-Markos, to Bure, and from Bure to Gomer using a gravel road.
![Figure 1
Location of the study areas: (a) geographical map of the northern eastern Africa and Arabia (NASA STRM30) showing the location of the three rifts (Main Ethiopian Rift [MER], Gulf of Aden, and Red Sea) together with the Ethiopian (NW plateau) and Somalian plateaus (SE plateau), surrounding the Afar depression. (b) Location and accessibility map of the study area with its drainage pattern.](/document/doi/10.1515/geo-2025-0816/asset/graphic/j_geo-2025-0816_fig_001.jpg)
Location of the study areas: (a) geographical map of the northern eastern Africa and Arabia (NASA STRM30) showing the location of the three rifts (Main Ethiopian Rift [MER], Gulf of Aden, and Red Sea) together with the Ethiopian (NW plateau) and Somalian plateaus (SE plateau), surrounding the Afar depression. (b) Location and accessibility map of the study area with its drainage pattern.
2.2 Methodology for geological mapping, petrographic analysis, and geochemical assessment
2.2.1 Geological field mapping and sample collection
The detailed geological field mapping of the study area was conducted based on ground traverses, which selected areas where one can get good stratigraphic sections (such as river or stream sections and road sections). Fieldwork activities involve describing and recognizing the rock types from the representative outcrops, collecting a representative fresh rock sample from each rock type, labeling rock samples, and recording their geographical coordinates. It also involved identifying, describing, and mapping geological structures observed in rocks. Photographs are taken from representative outcrops, which show a peculiar feature. Finally, all data collected from the field were compiled in the notebook, and a detailed geological map of the area was produced (Figure 2).

Geological map of the study area with representative sample location.
2.2.2 Petrographic sample preparation and analysis
With the purpose of petrographic studies, according to the variety of rock lithologies, 14 thin sections for representative rock samples were prepared at the mineralogy and petrographic laboratory of the Geological Survey of Ethiopia. The petrographic studies, including identifying mineral assemblages and their modal proportions, microstructure identification, textural description, and naming of rocks, were conducted at Bahir Dar University, at the Mineralogy and Petrology Laboratory of Earth Sciences. The representative samples’ modal analyses were performed using the point-counting method [13].
2.2.3 Geochemical analysis
This study employed advanced trace element geochemistry analysis techniques to uncover petrogenetic processes and mantle source variations, offering unprecedented insights into the less-explored Gomer volcanic region. Seven mafic samples from the Gomer area were selected based on their degree of freshness, minimal surface weathering, field accessibility, and textural characteristics to ensure representative whole-rock compositions. Both porphyritic and aphyric basalt samples were collected across different stratigraphic levels. In particular, care was taken with porphyritic samples such as KO-8, WO-1, GO-33, KO-22, WO-2, and KO-1, which contain abundant clinopyroxene (5–20%) and plagioclase (10–20%) phenocrysts, with minor olivine phenocrysts (<2%). To mitigate the risk of compositional bias from phenocryst accumulation, these samples were subsampled to exclude large phenocryst clusters, and approximately 0.7–0.99 kg of each sample was crushed, homogenized, and pulverized, prioritizing groundmass-dominated fragments.
First, samples were crushed to 70% less than 2 mm, riffled to split off 0.5 kg, and the splits were pulverized to 75 μm. Australian laboratory services subsequently sent the pulverized samples to Ireland to analyze major and trace element abundances. The major element and base-metal (Ag, Co, Cu, Ni, Pb, Sc, and Zn) abundances for samples were determined through inductively coupled plasma atomic emission spectrometry by using a whole-rock package and four acid digestion analytical procedures, respectively. The trace elements were analyzed by inductively coupled plasma mass spectrometry after a standard acid-digestion procedure using lithium borate fusion.
2.2.4 Quality control and data reliability
The international standards, replicates, and blanks were employed to control the quality of the analyzed geochemical results [14]. Analytical reproducibility and accuracy were estimated from repeated measurements of samples (replicates) and through the use of international rock standards, respectively [15]. Analyses utilized international standards such as SY-4, REE-1, MRGeo08, EMOG-17, OREAS 102a, and AMlS0304 [16,17]. Blanks were also included to identify and monitor potential sources of contamination in the laboratory, with total procedural blanks for all elements found to be negligible [18]. The accuracy and reproducibility of major oxides were predominantly estimated to be better than 3%, while trace element analyses were estimated to be accurate to within seven ppm [19]. The detection limits were varied during analysis for different elements. It was 0.01% for SiO2, TiO2, Al2O3, Fe2O3, MgO, CaO, MnO, Na2O, K2O, P2O5, Cr2O3; 1 ppm for Ni, Sc, V, Ba, Pb; 0.5 ppm for Zr and Sr; 0.05 ppm for Ta, Th, U, Lu, Pr, Tb; 0.1 ppm for Cs, Hf, Nb, Rb, Y, La, Ce, Eu, Dy, Er, Gd, Sm, Ho, La, Nd, Tm, Yb; and 5 ppm for Cr.
SY-4 is a widely used standard in geological laboratories, particularly valued for testing precision and accuracy in silicate analysis [20]. REE-1 is a rare earth element (REE) standard, essential for calibration in analyses where precise REE measurements are critical [21]. MRGeo08 functions as a multi-element geostandard, providing a reliable reference for various trace elements, while EMOG-17 is relevant in the geochemical characterization of igneous rocks, especially in studying basalts and other volcanic rocks [22]. OREAS 102a is a certified reference material for analyzing base metals and gold ores, making it commonly employed in mineral exploration studies [23,24,25]. AMIS0304 is a standard frequently used to verify the accuracy of analytical methods in metal and mineral assays, which is particularly applicable in mining geochemistry [26].
2.3 Geological setting
The Ethiopian Cenozoic volcanisms, plateau uplift, and the development of the Main Ethiopian and Afar rift systems have been attributed to the upwelling of the Afar mantle plume, impinging at the base of the Ethiopian lithosphere [9,12,27–29] with a potential link to the African superplume beneath Southern Africa [30,31]. The volcanism covers an area of greater than 600,000 km2 [2,32] and was generally dominated by up to 300,000 km3 of basaltic flood lavas with minor pyroclastic products and rhyolitic lava flows, mainly forming the Ethiopian plateau [3]. Most of these basalts and associated felsic rocks have erupted in a short time interval (<5 Ma), with the most significant eruption rates at about 31–29 Ma [5]. They are unconformably underlain by Mesozoic sedimentary sequences or Precambrian metamorphic rocks [33].
The overall volcanites of Ethiopia have been studied to be associated with the various stages of rift development of the East African Rift system [34] and subdivided into five significant provinces [35] based on lithological development, type of activity, age of effusion, and frequency of volcanic centers: (1) volcanites of the northern plateau; (2) volcanites of the southern plateau; (3) volcanites of the Somali plateau; (4) Afar volcanites; and (5) MER volcanites. The first three groups represent a significant part of the Ethiopian volcanites, collectively known as “Traps” [36]. Among these volcanoes, the fine-grained stratified flood Paleocene basalts represent the more significant portion. The Afar and MER volcanites are referred to as the Aden Series [36], related to Neocene continental fragmentation, and have a more limited extension.
The northwestern Ethiopian Plateau is extensively covered by Eocene-Miocene CFBs [37], which comprise the Ashenge and Aiba basaltic and Alaje rhyolitic formation with an estimated local thickness of 500–2,000 m [2]. The emplacement of these flood basalts and the associated ignimbrites were concomitant with the continental rifting of the Red Sea-Gulf of Aden (late Oligocene) but predates the development of the Main Ethiopian Rift (late Miocene) in association with the first appearance of the Afar plume head [5,9,38]. They erupt through fissures in the underlying metamorphic and sedimentary succession [2]. The plateau basalts are commonly tholeiitic to alkaline in composition [6,7,27], and they are spatially grouped rather than temporally based on their contrasting geochemical signatures into low-Ti (LT), high-Ti1 (HT1), and high-Ti2 (HT2) basalts [6,7,12]. The LT basalts are restricted to the northwestern part of the province, while the HT basalts are found in the eastern and southern parts of the northwestern plateau. However, the mineralogy and geochemistry of such plateau basalts are similar, and most rocks are described as aphyric to sparsely phyric and contain plagioclase and clinopyroxene phenocrysts with rare or without olivine [4].
The northwestern flood basalt eruption was followed by the development of several low-angle, less-voluminous, large shield volcanoes (e.g., Guna ∼10 Ma; Choke and Guguftu ∼23 Ma; [4] on the surface of the plateau from 30 Ma to ∼10 Ma, whose compositions and age match the underlying flood basalts with a thinner and less continuous lava flows than the underlying flood basalts [4]. They have a relief of about 1–2 km above the original plateau surface [4,39]. A systematic age variation is observed among shield volcanoes from the northwest plateau (Choke and Guguftu ∼22.4–23.3 Ma [4] and the south-east part of the northwest plateau (near Gebra Guracha) [39] to the southeastward direction in central Ethiopia (∼15–10 Ma) [40]. The shield volcanoes are bimodal in nature and contain sequences of alternating basalts, rhyolitic and trachytic lava flows, tuffs, and ignimbrites, particularly near their summits, dominated by transitional to Na-alkaline basalts [3]. During the Quaternary period, minor alkaline basaltic eruptions (with Scoria cones, tuff cones, tuff rings, and maars) have also occurred on the Ethiopian plateau, south and southwest of Tana Lake, which are considered to be related to the newly developed rifts and fractures (Tana rift) [41,42].
3 Results and discussion
3.1 Geology of the study area
The study area is part of the northwestern Ethiopian plateau and is dominated by differently textured basalts such as vesicular basalt, amygdaloidal basalt, and massive basalt with minor thinly bedded scoriaceous basalt, agglomerate, and slightly metamorphosed granitic rocks.
3.1.1 Basaltic unit
Basaltic rocks are exposed throughout the study area in many places, such as at hilltops, hillsides, along roads, and river cuts, with irregular distributions in thickness (Figure 3c). This rock unit covers a higher proportion of up to 420 km² and comprises vesicular basalt, amygdaloidal basalt, scoriaceous basalt, and massive basalt [43]. The rock unit is characterized by dark to light gray fresh colors and pink to pinkish gray weathered surface. This unit consists of many horizontally stratified massive basaltic flows of 1–2 m thickness and experienced an exfoliation type of weathering. At the study area’s northeastern and southeastern parts, this unit contains vesicles of variable size (about ∼10 cm) and shapes ranging from spherical to elongated. The vesicles are usually elongated in the N–S direction [44]. The amygdaloidal basalt is irregularly distributed and spattered in many places with small (∼12%) aerial coverage. It is primarily exposed in the study area’s central, northern, and northeastern parts (Figure 3a) and forms flat topography [42]. Sometimes, vesicles of basalts from many outcrops of the study area are filled with whitish secondary minerals, such as quartz, zeolites, calcite, and dolomite (Figure 3b). It has dark to gray fresh colors and a pink to light gray weathered surface. These secondary minerals are usually elongated in the N–S direction with variable sizes of about <2 cm, similar to their vesicles. In the southern part of the study area, meta granites unconformably underlie this rock unit and are conformably overlain by a scoriaceous basaltic unit. The lower part of this unit is marked by laterally continuous reddish color and thin (about 1.5 m thick) paleosol layers [45].
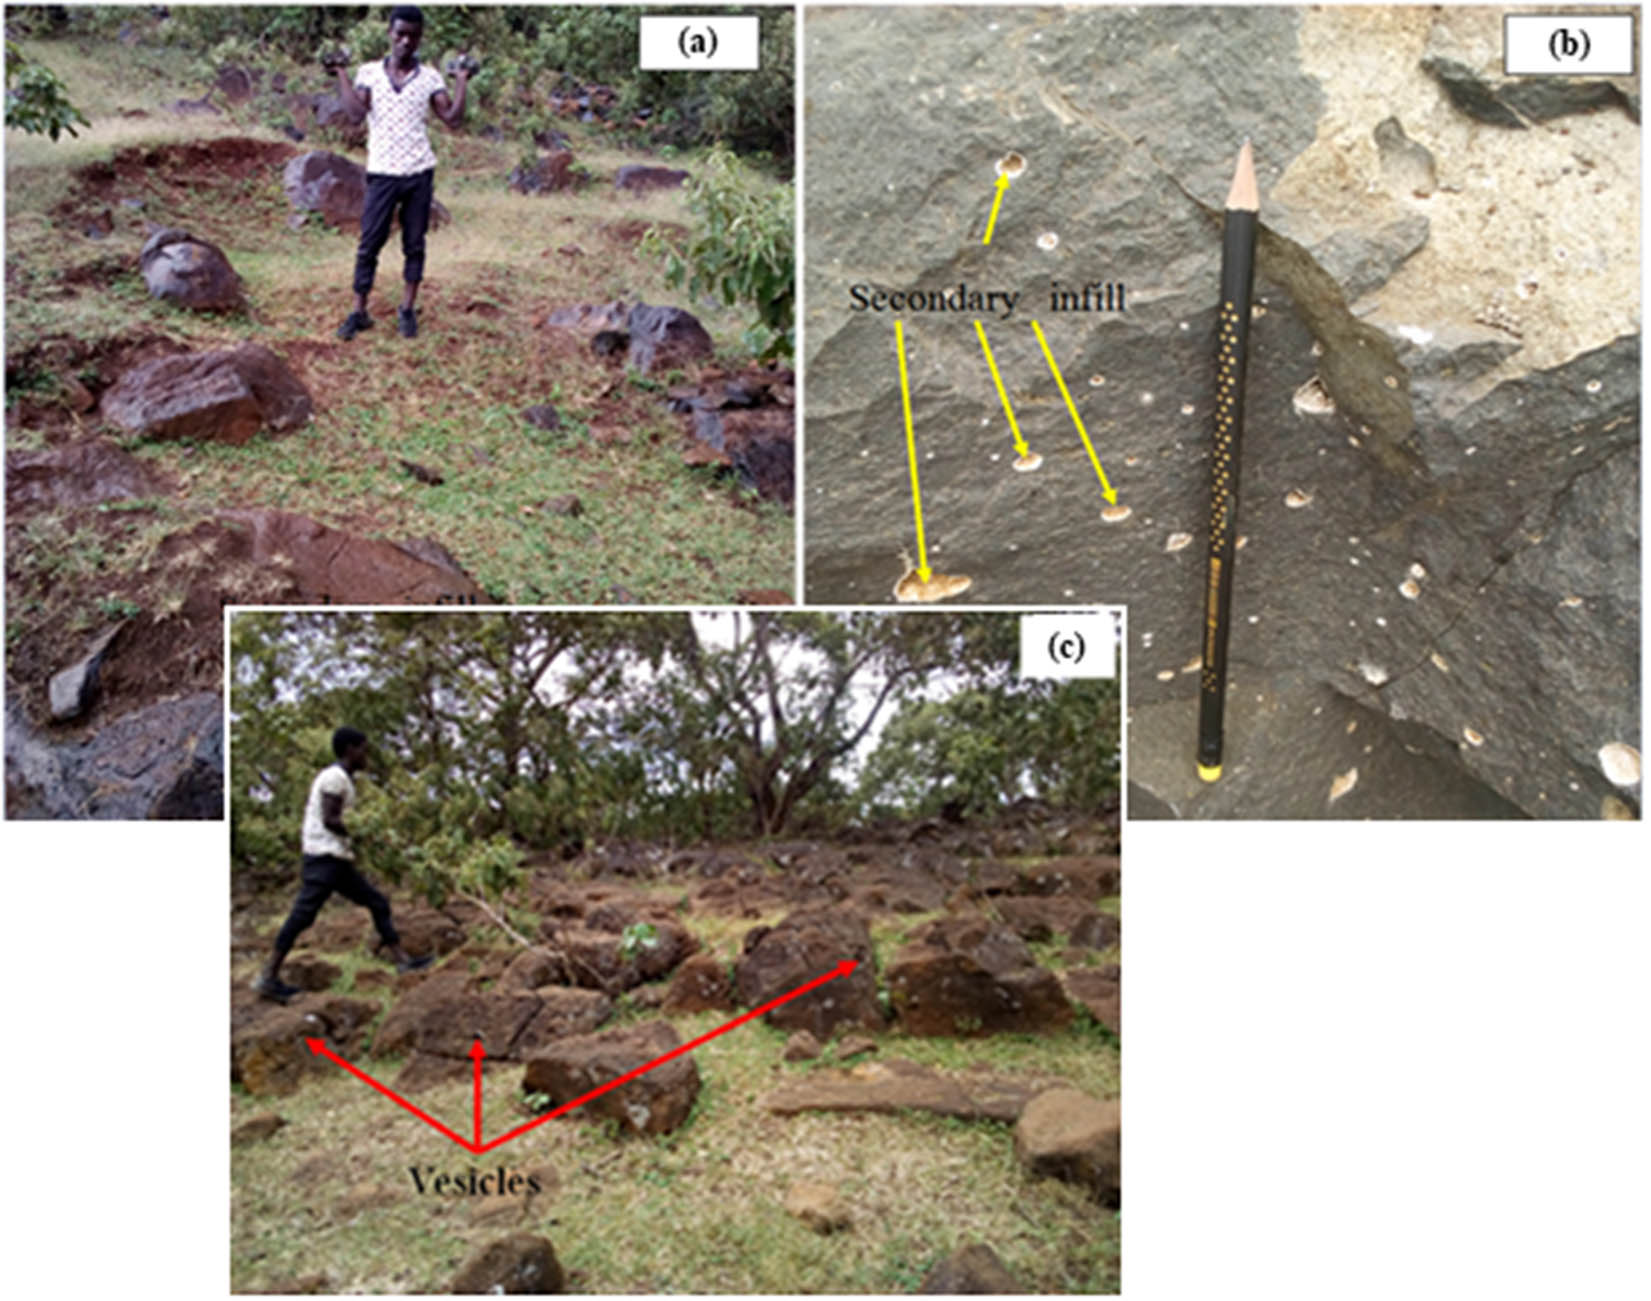
Field photographs of amygdaloidal basalt from different representative outcrops. (a) The amygdaloidal basalt from the hilltop, with minerals of quartz, zeolites, calcite, and dolomite infills. (b) The amygdaloidal basaltic unit from the quarry site has quartz, zeolites, calcite, and dolomite minerals in the fills. (c) Vesicular basalt from the hill top.
3.1.2 Scoriaceous basalt
This unit is rare, intercalated with thin layers of not more than 2 m with basaltic flows of the study area. It is also sparsely spattered on the surface of basaltic lavas (Figure 4a). It is small to map but mainly exposed in the south and northwestern parts of the study area along hillsides and quarries. The first episode of volcanism of the scoriaceous basalt is underlain by basement rock (meta-granite) as its boundary is marked by a 1.5 m-thick paleosol derived from a granitic rock unit (Figure 4b). This unit has deep gray to brown, weathered, and reddish fresh colors. Sometimes, vesicles are filled with white secondary minerals such as quartz, calcite, dolomite, and zeolites.
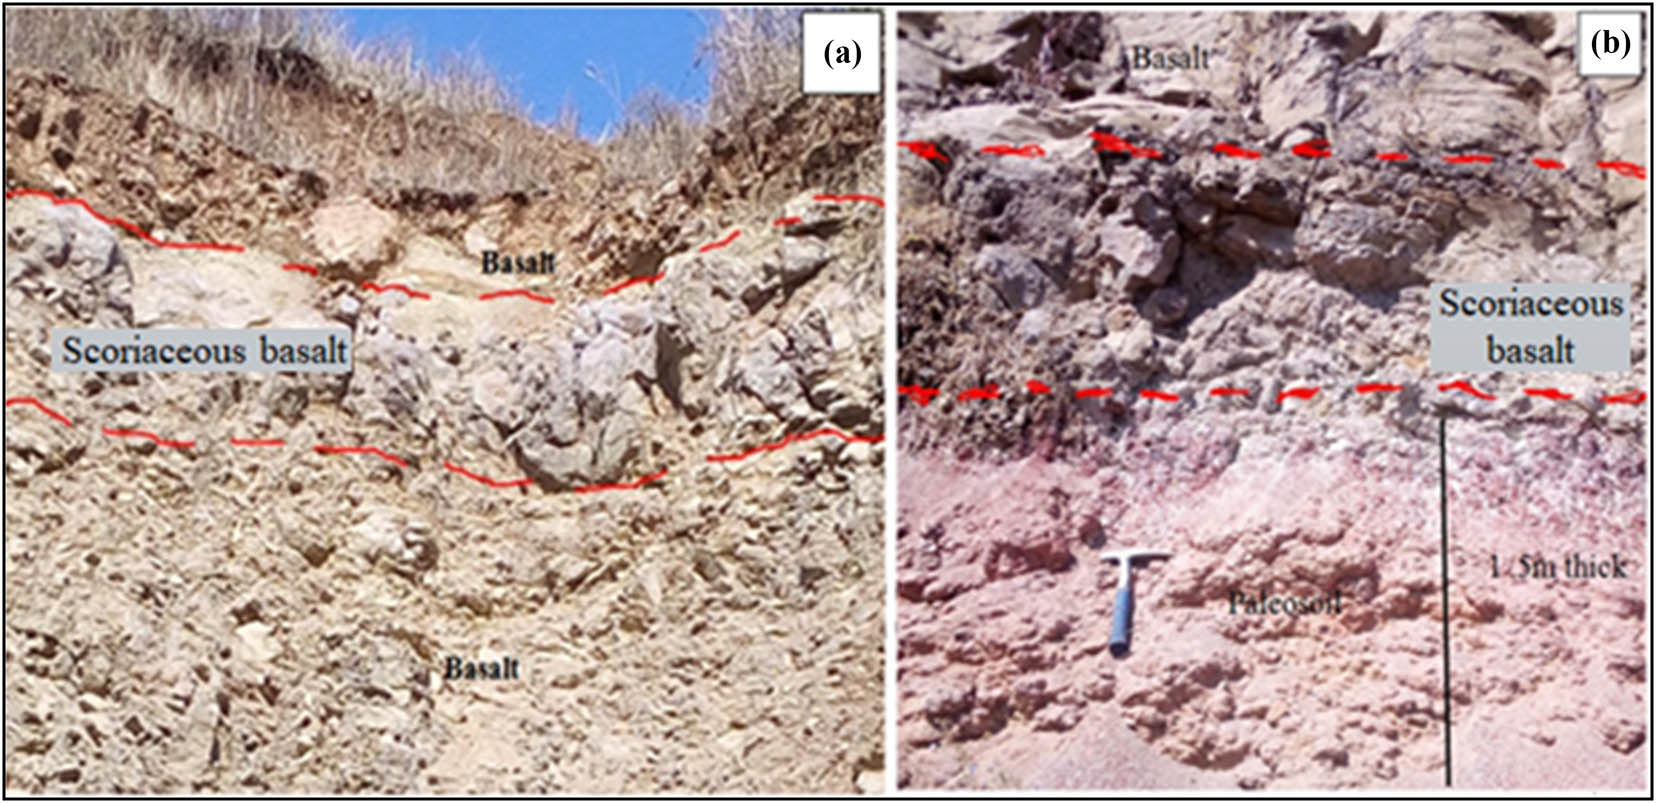
Field photographs of the scoria unit from different representative outcrops: (a) the scoria unit is sandwiched between the two massive stratified basaltic units. (b) The first episodic volcanism of the scoria unit is underlain by reddish-colored, about 1.5 m-thick paleosoil, and overlain by a massive stratified basaltic unit.
3.1.3 Agglomerate
This rock unit is exposed in scattered (patchy) form at road and stream cuts and is found mainly in the southern parts of the area between the two basaltic units (Figure 5a). It is overlain by a 35 m-thick, columnar-jointed dark gray aphanitic basalt and shows a sharp contact with this basaltic unit (Figure 5b). It has an average thickness of about 10 m with N–S orientation. Moreover, this rock unit is characterized by pinkish, reddish, greenish gray, and yellowish weathered colors and by the presence of subangular to subrounded pebbles, blocks, and bombs of scoria and basalt rock fragments in a fine ash and lapilli matrix. The clasts are commonly silicified, epidotized, unconsolidated, and poorly sorted.
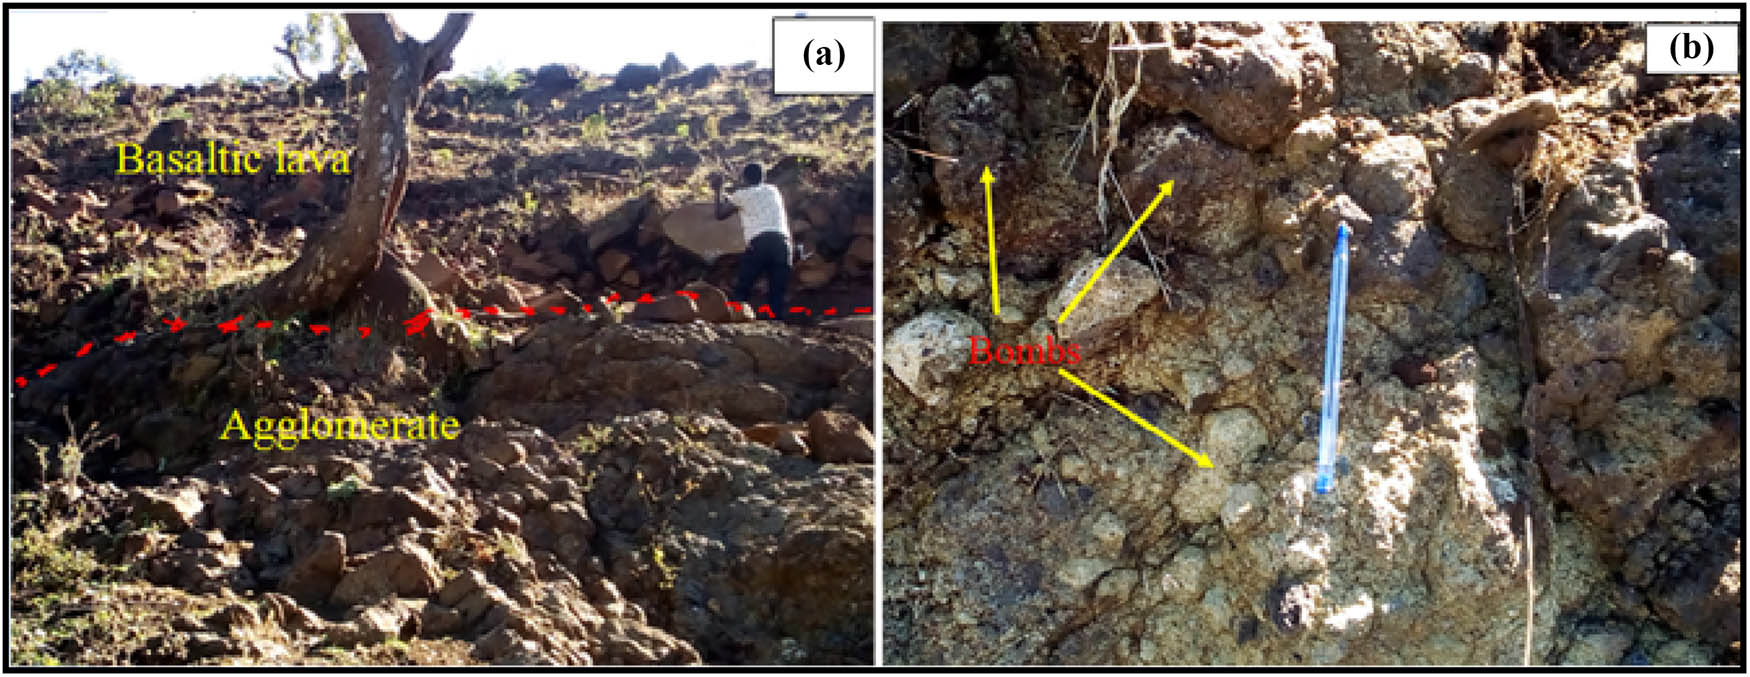
(a) Field photographs of agglomerate from different representative outcrops. (a) The agglomeratic unit from the hillside with fragments of volcanic rocks having different shapes ranging from sub-angular to sub-rounded pebbles, blocks, and bombs of scoria and basalt rock fragments within a fine ash and lapilli matrix; this is overlain by stratified basaltic lava. (b) The agglomeratic unit from a hilltop with different-sized and shaped clasts of volcanic rocks and basalts ranges from sub-angular to sub-rounded pebbles, blocks, and bombs of scoria and basalt rock fragments within a fine ash and lapilli matrix.
3.1.4 Meta-granites
Meta-granitic rocks are mainly exposed in the southern, southwestern, and southeastern parts (Figure 6a) of the study area, where intensive surface erosion was higher (stream cuts) and sometimes, at road cuts (Figure 6a and b). Outcrops of this rock unit are mostly found relatively at the lowest elevation, with a boulder-like appearance in association with non-metamorphosed, highly weathered (fragmented) volcanic rocks and soils of the area. The meta-granites are also overlain by scoriaceous basalt marked by a 1.5–4 m thick paleosol. The meta-granites are pinkish to gray, medium to extremely coarse-grained, and foliated rock. At places, the foliation of this unit is defined by a precise alignment of mafic (hornblende, biotite, and chlorite) and felsic (quartz and both feldspars) minerals in the N–S general direction. The association of foliation with this unit implies that this rock is part of the basement rock. These meta-granitic rocks are interpreted as part of the Precambrian basement exposed through erosional windows in the southern parts of the study area. Their spatial distribution at low elevations and the observation that they are unconformably overlain by scoriaceous basalts with paleosol development confirm that they represent the pre-volcanic basement complex, rather than intrusive bodies related to the Tertiary volcanism. The rock mainly comprises orthoclase feldspars, about ∼70%, with minor quartz, plagioclase feldspars, hornblende, muscovite, and biotite. Figure 7 shows the geological map of the study area.
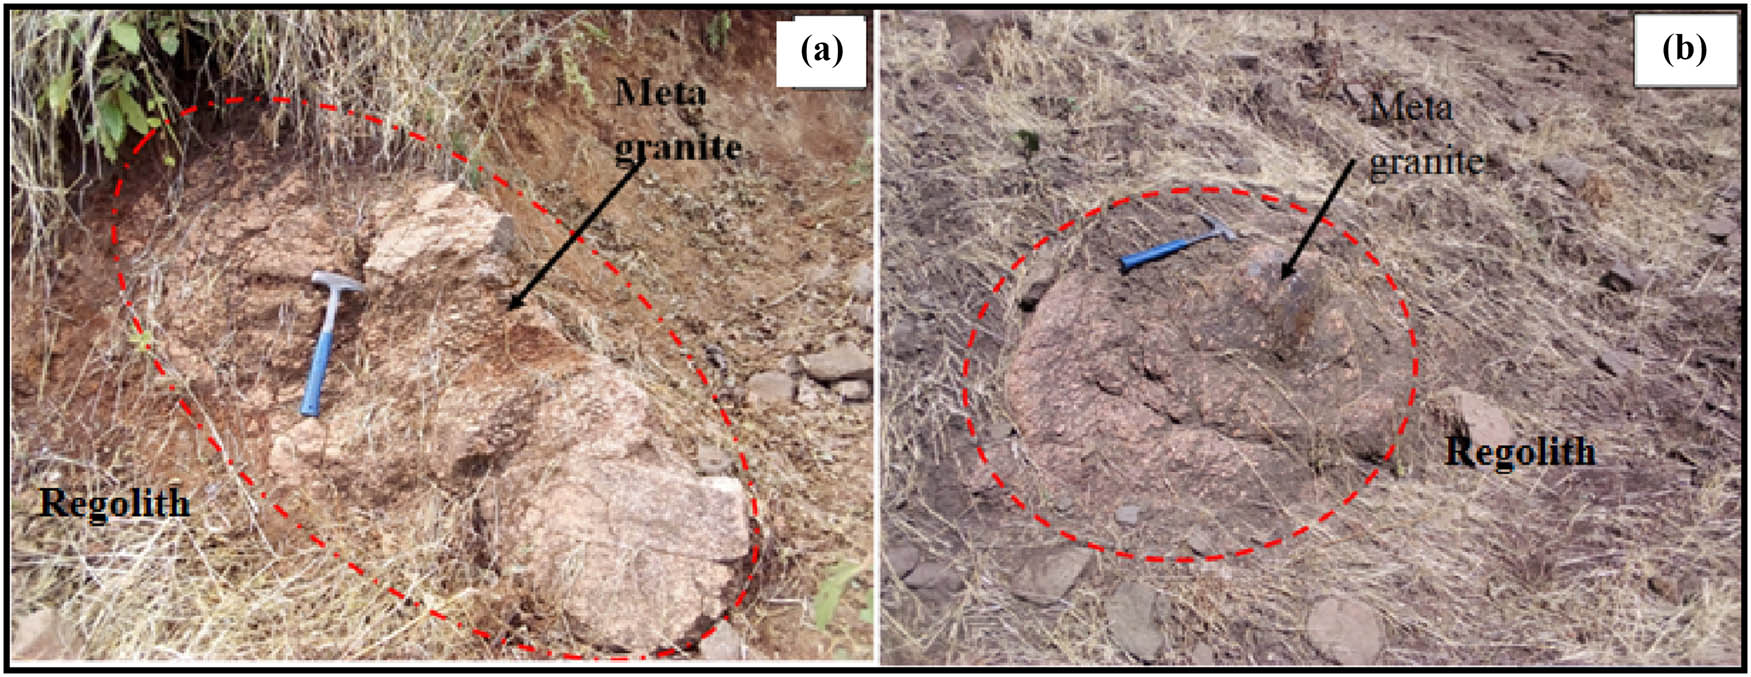
Field photographs of meta-granites (a and b) from different representative outcrops, surrounded by transported and residual regolith.

Geological map of the study area with representative sample location.
3.2 Petrography
Petrographically, all rock samples exhibit porphyritic texture with a highly variable phenocryst assemblage of olivine, clinopyroxene, and plagioclase. Plagioclase and pyroxene form the main phenocryst phases, and small amounts of Olivine phenocrysts are found in these rocks. Accordingly, two petro-types are recognized: Plagioclase-Pyroxene phyric basalt and plagioclase phyric basalt. Samples, such as SH-1, SH-2, SH-5, SH-8, SH-7, GO-1, and GO-3, only contain plagioclase (<10%) phenocrysts, while those KO-8, WO-1, GO-33, KO-22, WO-2, and KO-1 have abundant pyroxene (5–20%) and plagioclase phenocrysts (10–20%) and minor olivine phenocrysts (<2%).
3.2.1 Plagioclase-pyroxene phyric basalt
The plagioclase-pyroxene phyric samples mainly comprise olivine, clinopyroxene, and plagioclase minerals [46]. Samples also show highly porphyritic to glomeroporphyritic textures (Figure 8a) with abundant, euhedral to subhedral phenocrysts of clinopyroxene (1–3 mm) and plagioclase (2–4 mm) and subordinate anhedral olivine (1–2 mm) set in intergranular textured groundmass of the same mineral assemblage as the phenocrysts, with some Fe–Ti oxide (opaques) and glasses (Figure 8b) (Roex et al., [47]). The modal composition of the samples is 66–72% microcrystalline groundmass and 24–32% phenocrysts. The proportion of the phenocrysts is 65–74% plagioclase, 15–25% clinopyroxene, 1–3% olivine, and <1% Fe–Ti oxides. The groundmass is dominated by microcrystalline plagioclase, clinopyroxene, olivine, and Fe–Ti oxides (Figure 8c) [48]. Therefore, in general, the modal composition of this rock unit is dominated by plagioclase, followed by clinopyroxene and olivine. Plagioclase shows polysynthetic twinning. Besides the porphyritic to glomeroporphyritic textures, the clinopyroxene crystals included the anhedral olivine crystals (poikilitic texture) [49] (Figure 8d).
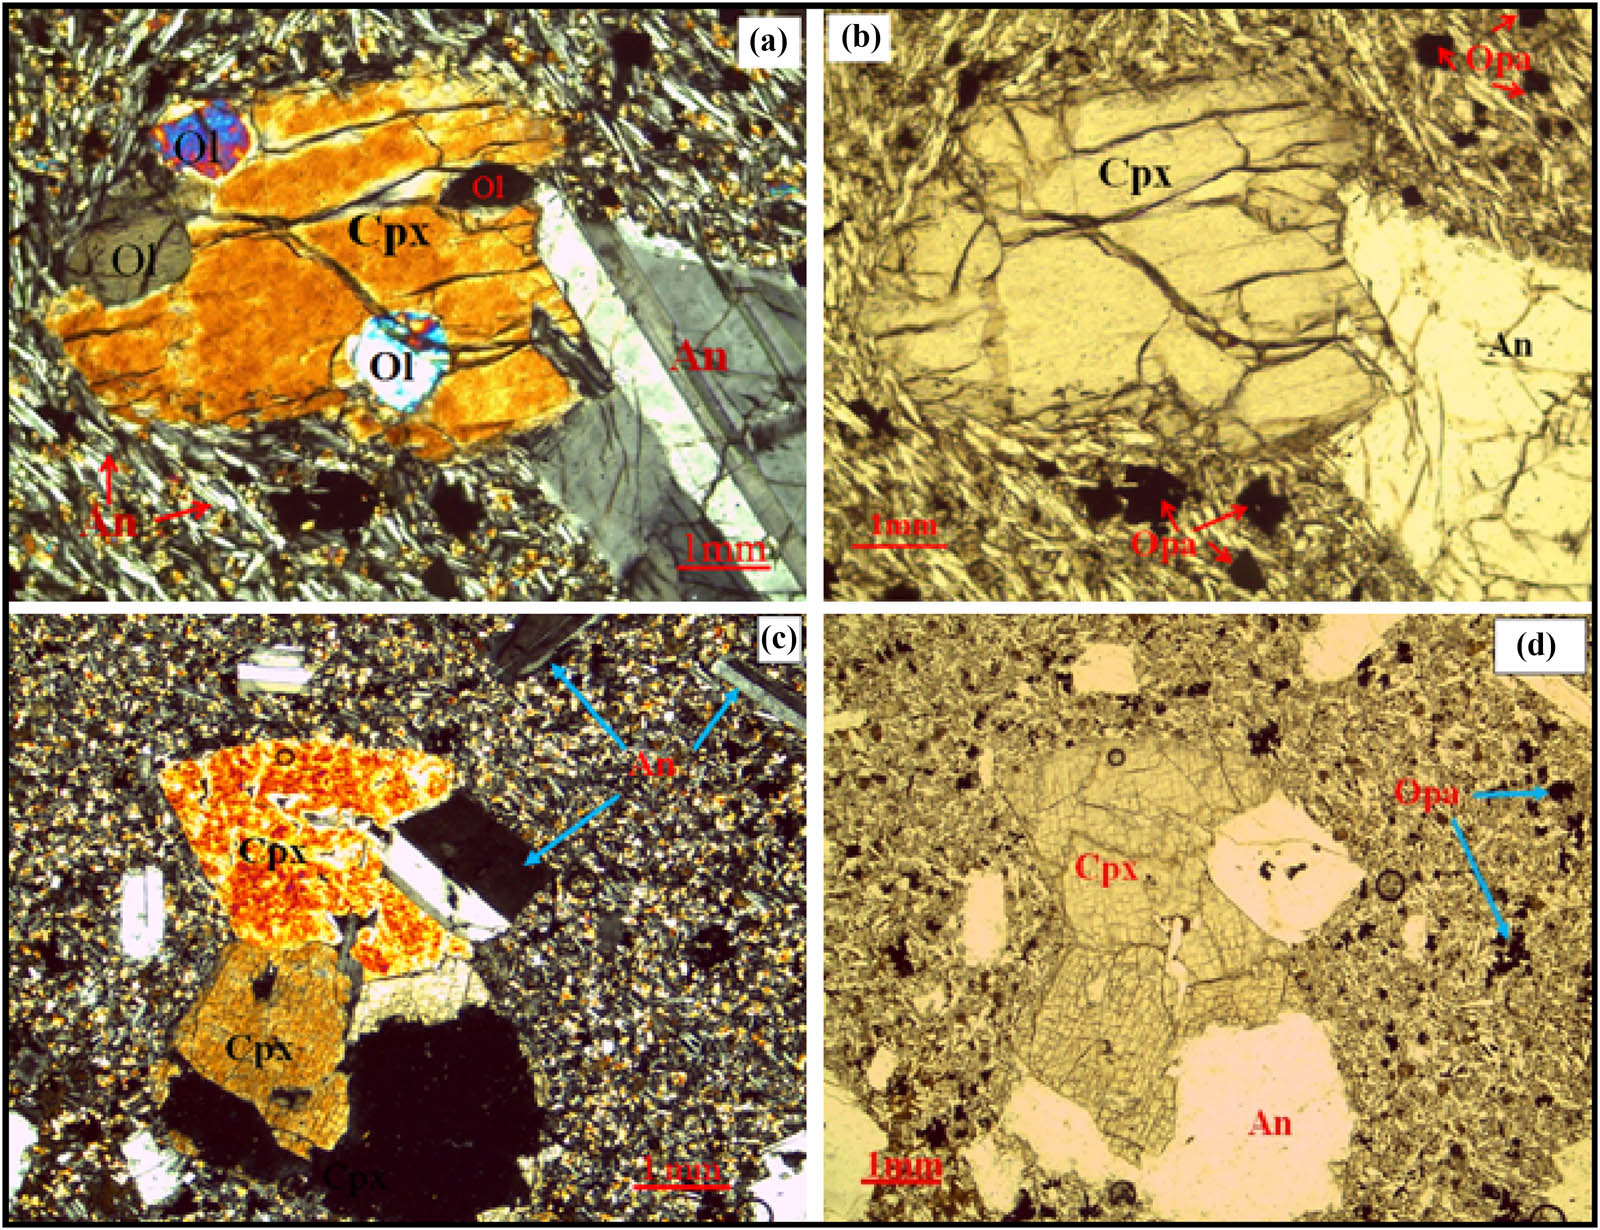
Microphotograph of plagioclase-pyroxene phyric basalt under optical microscope, at 4× magnifications, in cross-polarized light (XPL) (a and c) and Plane-polarized light (PPL) (b and d) views. The labels of the identified minerals are as follows: Ol, olivine; Cpx, clinopyroxene; An, anorthite; and Opa, opaques. (a) The clusters of plagioclase and clinopyroxene phenocrysts are embedded in a glassy groundmass of the same mineral as phenocryst with some olivine and opaque (probably Fe–Ti oxides); anhedral olivine crystals are included in the subhedral clinopyroxene; the subhedral to euhedral Anorthite shows a polysynthetic twinning and zoning. (b) A groundmass of opaques embedded in the plagioclase and clinopyroxene phenocrysts. (c) Glomerophyric textured phenocrysts of plagioclase and clinopyroxene are in contact with one another and are embedded in a glassy groundmass of the same mineral as phenocryst with some olivine and opaque (probably Fe–Ti oxides). (d) Ground mass of opaque (probably Fe–Ti oxides) embedded the glomerophyric textured phenocrysts of plagioclase and clinopyroxene crystals.
3.2.2 Plagioclase phyric basalt
The plagioclase phyric samples comprise clinopyroxene and plagioclase with very minor olivine minerals [50]. They show a highly porphyritic to glomeroporphyritic, locally trachytic texture with phenocrysts of euhedral to subhedral plagioclase (1–3 mm) and very subordinate, euhedral to anhedral clinopyroxene (1–2 mm) set in intergranular and interseptal textured groundmass of plagioclase laths (<0.5 mm), granular clinopyroxene (<0.5 mm), euhedral to subhedral opaque (Fe–Ti oxides) (<0.5 mm), and/or glasses (Figure 9a). The modal composition of the samples is 75–85% microcrystalline groundmass and 15–25% phenocrysts. The phenocryst phases mainly comprise plagioclase (∼90%) and clinopyroxene (∼7%) with minor Fe–Ti oxide microphenocrysts (Figure 9b). The groundmass is dominated by microcrystalline plagioclase, clinopyroxene, olivine, and Fe–Ti oxides (Figure 9c). Most plagioclase phenocrysts are elongated and randomly oriented, often showing a glomerophyric texture with clusters of plagioclase crystals (Figure 9d). Furthermore, the plagioclase phenocrysts show compositional zoning and fine-grained opaque phases within their crystals, indicating a resorption texture [51].
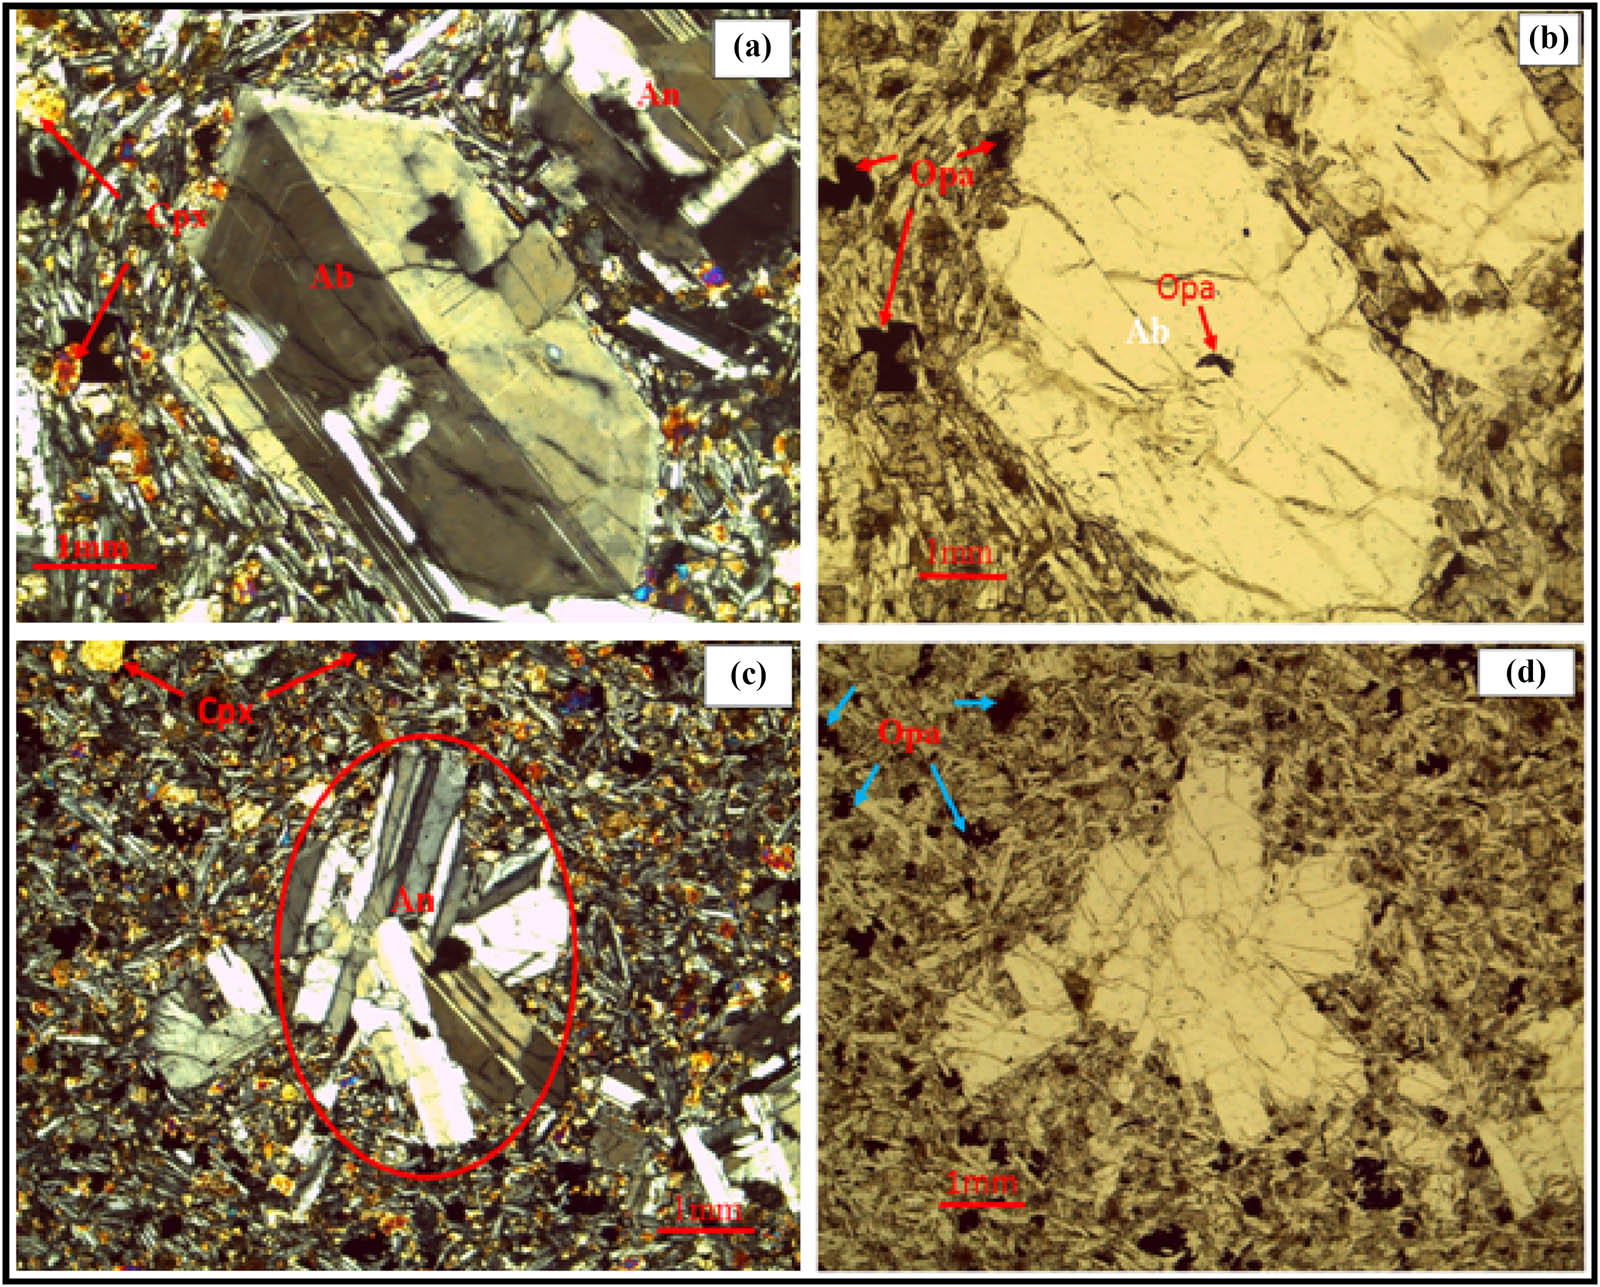
Microphotograph of plagioclase phyric basalt under an optical microscope, at 4× magnifications, in XPL (a and c) and PPL (b and d) views. The labels of the identified minerals are as follows: Ab, albite; An, anorthite; Cpx, clinopyroxene; and Opa, opaques. (a) Phenocrysts of plagioclase crystals are embedded in a glassy groundmass of the same mineral as phenocryst with clinopyroxene and some opaque (probably Fe–Ti oxides); the subhedral to euhedral anorthite shows a polysynthetic twinning and zoning. (b) The inclusion of opaque (Fe–Ti oxides) in albite phenocrysts (resorption texture). (c) Glomerophyric textured phenocrysts of plagioclases are in contact with each other and are embedded in a glassy groundmass of the same mineral as phenocryst with some clinopyroxene and opaque (probably Fe–Ti oxides) groundmass. (d) Ground mass of opaque (probably Fe–Ti oxides) with clinopyroxene has embedded the glomerophyric textured phenocrysts of plagioclase crystals.
3.3 Whole-rock geochemistry
The results of whole-rock major and trace elements and CIPW norm analyses for seven samples from Gomer basalts are presented in Table 1, reflecting their nature. These analyses are very important for interpreting geochemical and petrologic data trends. They can also be used to classify and name volcanic rocks that may have few identifiable minerals [52]. The whole-rock trace element geochemical data for the Gomer volcanic rock samples exhibit notable variations across several trace elements and ratios. Scandium (Sc) and vanadium (V) contents are relatively consistent, with V peaking in WO-1 at 480 ppm, while chromium (Cr) and cobalt (Co) display significant fluctuations, particularly with WO-1 showing a very low Cr concentration of 10 ppm compared to other samples.
Whole-rock major element (wt%), trace element (ppm) geochemical data, and CIPW norm of Gomer basalts
| Sample | SH-1 | SH-2 | SH-7 | WO-1 | GO-1 | KO-1 | SH-8 |
|---|---|---|---|---|---|---|---|
| Northing | 1,178,656 | 1,169,960 | 1,167,254 | 1,162,507 | 1,177,545 | 1,153,974 | 1,177,545 |
| Easting | 264,567 | 263,105 | 268,816 | 266,095 | 269,183 | 266,567 | 278,975 |
| SiO2 | 48.6 | 48.8 | 51.4 | 49.8 | 49.2 | 47 | 52 |
| TiO2 | 1.97 | 1.96 | 1.93 | 3.14 | 1.56 | 1.65 | 1.92 |
| Al2O3 | 15.3 | 15.4 | 15.75 | 13.55 | 17.7 | 16.6 | 15.75 |
| Fe2O3 | 12.55 | 12.55 | 11 | 15.35 | 9.72 | 11.75 | 10.7 |
| FeOt | 23.9 | 23.8 | 20.9 | 29.2 | 18.5 | 22.5 | 20.3 |
| MgO | 6.15 | 6.04 | 5.03 | 4.71 | 5.22 | 5.71 | 5 |
| CaO | 11.5 | 11.6 | 9.91 | 8.7 | 12.4 | 11.7 | 9.86 |
| Na2O | 2.51 | 2.58 | 2.92 | 3.09 | 2.4 | 2.47 | 2.92 |
| K2O | 0.37 | 0.4 | 0.83 | 1.03 | 0.26 | 0.42 | 0.84 |
| P2O5 | 0.17 | 0.17 | 0.19 | 0.49 | 0.13 | 0.15 | 0.19 |
| LOI | 1.15 | 0.9 | 0.73 | 0.1 | 0.61 | 1.23 | 0.67 |
| Total | 100.6 | 100.66 | 99.93 | 100.26 | 99.42 | 99.19 | 99.78 |
| CaO/Al2O3 | 0.75 | 0.75 | 0.63 | 0.64 | 0.7 | 0.7 | 0.63 |
| Sc | 32 | 32 | 27 | 30 | 30 | 32 | 27 |
| V | 358 | 335 | 362 | 480 | 291 | 369 | 361 |
| Cr | 110 | 120 | 70 | 10 | 60 | 60 | 80 |
| Co | 51 | 49 | 39 | 45 | 40 | 42 | 38 |
| Ni | 72 | 75 | 50 | 26 | 50 | 51 | 52 |
| Rb | 5.4 | 6.7 | 10.6 | 14.9 | 4 | 7 | 14.7 |
| Sr | 258 | 244 | 295 | 356 | 268 | 255 | 298 |
| Y | 27.5 | 25.6 | 26.2 | 38.5 | 18.3 | 21.9 | 26.4 |
| Zr | 104 | 97 | 128 | 219 | 81 | 100 | 133 |
| Nb | 8.1 | 7.8 | 8 | 15.9 | 4.2 | 6.2 | 8.4 |
| Cs | 0.06 | 0.08 | 0.06 | 0.21 | 0.07 | 0.06 | 0.18 |
| Ba | 80.2 | 77.5 | 293 | 292 | 79.9 | 88.8 | 315 |
| Hf | 3.3 | 3.1 | 3.7 | 5.4 | 2.2 | 2.6 | 3.7 |
| Ta | 0.4 | 0.5 | 0.3 | 0.8 | 0.3 | 0.2 | 0.5 |
| Pb | 7 | 4 | 7 | 9 | 2.1 | 2 | 6 |
| Th | 0.86 | 0.81 | 1.82 | 1.35 | 0.44 | 0.57 | 1.73 |
| U | 0.31 | 0.28 | 0.42 | 0.45 | 0.18 | 0.22 | 0.38 |
| La | 9.2 | 8.8 | 12.1 | 19.3 | 5.7 | 7.3 | 12.4 |
| Ce | 20.3 | 19.5 | 28.1 | 45.5 | 14 | 18 | 28.7 |
| Pr | 2.93 | 2.89 | 4.03 | 6.55 | 2.2 | 2.71 | 4.06 |
| Nd | 13.5 | 13.6 | 18.7 | 31.2 | 11 | 13.5 | 18.9 |
| Sm | 4.19 | 4.19 | 4.79 | 7.49 | 3.08 | 3.75 | 4.69 |
| Eu | 1.58 | 1.55 | 1.28 | 2.21 | 1.01 | 1.12 | 1.32 |
| Gd | 5.64 | 5.02 | 5.25 | 7.95 | 4 | 4.35 | 4.98 |
| Tb | 0.84 | 0.77 | 0.79 | 1.18 | 0.53 | 0.66 | 0.78 |
| Dy | 4.91 | 4.89 | 4.63 | 7.02 | 3.64 | 3.99 | 4.78 |
| Ho | 1.06 | 0.97 | 0.93 | 1.37 | 0.66 | 0.83 | 0.96 |
| Er | 2.75 | 2.5 | 2.85 | 4.22 | 2.08 | 2.4 | 3.06 |
| Tm | 0.34 | 0.34 | 0.35 | 0.55 | 0.27 | 0.36 | 0.34 |
| Yb | 2.25 | 2.09 | 2.44 | 3.69 | 1.87 | 2.06 | 2.31 |
| Lu | 0.31 | 0.31 | 0.32 | 0.48 | 0.24 | 0.25 | 0.33 |
| Ti/Y | 433.3 | 461.3 | 446.3 | 489.6 | 518.4 | 462.1 | 441 |
| Nb/Y | 0.295 | 0.305 | 0.305 | 0.413 | 0.224 | 0.283 | 0.318 |
| Nb/U | 26.13 | 27.86 | 19.05 | 35.33 | 22.78 | 28.18 | 22.11 |
| Ce/Pb | 2.9 | 4.88 | 4.01 | 5.06 | 14 | 9 | 4.78 |
| Eu/Eu* | 1.99 | 2.07 | 1.56 | 1.75 | 1.76 | 1.7 | 1.67 |
| Yb | 2.25 | 2.09 | 2.44 | 3.69 | 1.87 | 2.06 | 2.31 |
| Lu | 0.31 | 0.31 | 0.32 | 0.48 | 0.24 | 0.25 | 0.33 |
| Ti/Y | 433.3 | 461.3 | 446.3 | 489.6 | 518.4 | 462.1 | 441 |
| Nb/Y | 0.295 | 0.305 | 0.305 | 0.413 | 0.224 | 0.283 | 0.318 |
| Quartz | 5.036 | 4.778 | 7.552 | 7.916 | 5.505 | 3.451 | 7.929 |
| Orthoclase | 2.206 | 2.376 | 4.957 | 6.096 | 1.559 | 2.539 | 5.020 |
| Albite | 21.427 | 21.941 | 24.968 | 26.183 | 20.599 | 21.382 | 24.988 |
| Anorthite | 29.649 | 29.405 | 27.705 | 20.088 | 37.281 | 33.726 | 27.697 |
| Nepheline | 0.000 | 0.000 | 0.000 | 0.000 | 0.000 | 0.000 | 0.000 |
| Diopside | 15.465 | 15.923 | 10.842 | 6.986 | 14.590 | 14.613 | 10.707 |
| Wollastonite | 0.000 | 0.000 | 0.000 | 0.000 | 0.000 | 0.000 | 0.000 |
| Hypersthene | 8.287 | 7.741 | 7.636 | 8.511 | 6.426 | 7.777 | 7.633 |
| Olivine | 0.000 | 0.000 | 0.000 | 0.000 | 0.000 | 0.000 | 0.000 |
| Hematite | 12.662 | 12.614 | 11.117 | 15.373 | 9.860 | 12.021 | 10.822 |
| Titanite | 4.879 | 4.836 | 4.788 | 7.719 | 3.884 | 4.144 | 4.767 |
| Perovskite | 0.000 | 0.000 | 0.000 | 0.000 | 0.000 | 0.000 | 0.000 |
| Apatite | 0.406 | 0.405 | 0.455 | 1.162 | 0.312 | 0.363 | 0.455 |
| Sum | 100.018 | 100.018 | 100.019 | 100.035 | 100.015 | 100.016 | 100.019 |
FeOt = Fe2O3* 0.9 + Fe2O3 Eu/Eu* = Eu/Eu N/√Sm N*xGd N.
Key trace elements like rubidium (Rb), strontium (Sr), and yttrium (Y) show variability, with Rb highest in WO-1 and SH-8, and Sr highest in WO-1 at 356 ppm. Zirconium (Zr) ranges from 81 ppm in GO-1 to 219 ppm in WO-1, while niobium (Nb) content also varies, peaking in WO-1. Other elements, such as barium (Ba) and hafnium (Hf), show similar trends, with Ba reaching 315 ppm in SH-8. REEs like lanthanum (La) and cerium (Ce) are notably enriched in WO-1, showing higher concentrations in comparison to other samples. Europium (Eu) anomalies (Eu/Eu*) indicate slight to moderate depletion across samples, with ratios ranging from 1.56 to 2.07. Trace element ratios further reveal petrogenetic insights, with Nb/Y ratios ranging from 0.224 to 0.413, suggesting source characteristics and degree of partial melting. Nb/U and Ce/Pb ratios indicate variability in the source composition, with a high Ce/Pb in GO-1 pointing toward possible crustal influences. These variations collectively point to a complex petrogenetic history for the Gomer volcanic rocks, with notable fractional crystallization and mantle source characteristics.
3.3.1 Geochemical classification
In the total alkali (Na2O + K2O) vs silica (SiO2) diagram (Figure 10a) [53], all samples fall within the field of basalt and show sub-alkaline composition. In the Zr/TiO2 vs Nb/Y diagrams (Figure 10b) [54], samples are plotted in the subalkaline basalt field. The samples also fall in the field of tholeiitic series both in the FeOt/MgO vs SiO2 diagram (Figure 10c) [55], as well as in the (Na2O + K2O)–FeOt–MgO (AFM) ternary diagram (Figure 10d) [56]. Samples are hypersthene and quartz normative (quartz-tholeiites), consistent with the above classifications. These basalts’ tholeiitic and hypersthene–quartz normative character indicates derivation from a Fe-rich, moderately depleted mantle source under relatively dry conditions. This supports partial melting within the spinel stability field, characteristic of enriched intraplate settings such as those associated with early-stage continental rifting.
![Figure 10
(a) SiO2 vs (Na2O + K2O) (TAS) diagram (after Cox et al. [53]), the Gomer rock samples plotted within the basalt field (b): Zr/TiO2 vs Nb/Y diagram after Winchester and Floyd [54], the Gomer rock samples plotted within the subalkaline basalt field. (c) FeOt/MgO vs SiO2 variation diagram (after Miyashiro [55]), and (d) Na2O + K2O–FeOt–MgO ternary diagram (after Irvine and Baragar [56]), the Gomer rock samples plotted within the tholeiitic series field.](/document/doi/10.1515/geo-2025-0816/asset/graphic/j_geo-2025-0816_fig_010.jpg)
(a) SiO2 vs (Na2O + K2O) (TAS) diagram (after Cox et al. [53]), the Gomer rock samples plotted within the basalt field (b): Zr/TiO2 vs Nb/Y diagram after Winchester and Floyd [54], the Gomer rock samples plotted within the subalkaline basalt field. (c) FeOt/MgO vs SiO2 variation diagram (after Miyashiro [55]), and (d) Na2O + K2O–FeOt–MgO ternary diagram (after Irvine and Baragar [56]), the Gomer rock samples plotted within the tholeiitic series field.
The geochemical analysis of the Gomer volcanic rock samples shows a silica (SiO2) content range of 47–52 wt%, with major oxides including Fe2O₃, MgO, CaO, and Na2O. Notably, TiO2 varies between samples, peaking at 3.14 wt% in sample WO-1 and lowering to 1.56 wt% in sample GO-1. The CaO/Al2O3 ratio remains stable, ranging from 0.63 to 0.75. CIPW norm mineralogy highlights quartz, orthoclase, albite, and anorthite as dominant normative minerals, with higher quartz levels in SH-8 and increased anorthite in GO-1 and KO-1. Diopside and hypersthene are present, though olivine and wollastonite are absent in all samples. Minor components include consistent titanite and hematite across samples, while apatite is most concentrated in WO-1. These results point to a tholeiitic composition, with mineral variations suggesting fractional crystallization as a key factor in the petrogenesis of these rocks.
Pik et al. [6] classified the northwestern Ethiopian Plateau basalts into three distinct magma types based on their TiO2 abundances: low-Ti (LT), high-Ti1 (HT1), and high-Ti2 (HT2) basalts. The LT lavas display the lowest TiO2 contents (1–2.6 wt%) commonly found in CFB provinces. On the other hand, the two other lava groups (HT1 and HT2) have much higher TiO2 contents. The concentration of TiO2 content in HT1 magmas varies from 2.5 to 4.2 wt%, while in HT2, it ranges from 2.6 to 5 wt%. Similarly, Pik et al. [6] also suggested that the LT basalts have relatively low Ti/Y (288–437) and Nb/Y (0.1–0.41) values, whereas in the HT1 basalt, Ti/Y value ranges from 352 to 814 and Nb/Y from 0.52 to 1.1. The HT2 basalts are characterized by high values of Ti/Y and Nb/Y that range from 670 to 885 and 0.9 to 1.44, respectively. In the plots of Ti/Y vs Nb/Y, tholeiitic samples from the Gomer area fall in the LT field.
3.3.2 Variation diagram
Bivariate major oxide plots against MgO as a differentiation index are illustrated in Figure 11 [57], which recommends the use of MgO as a differentiation index in the variation diagrams when the range of SiO2 (43.1–51.7 wt%) contents between samples is small, and the rock series includes abundant mafic members. The basalt samples depict a continuous decrease in Na2O, K2O, and P2O5 contents with increasing MgO and an increase in TiO2 and CaO contents, while Al2O3 and FeOt show slope variations in their trends; from MgO values 4 to 5.5 wt%, Al2O3 shows positive correlation, while FeOt shows negative correlation. From MgO values 5.5–6.15 wt%, both oxides show the reverse events. The co-variations of FeOt and CaO with MgO in Gomer basalts confirm the suggestion of fractional crystallization of olivine, clinopyroxene ± spinel.
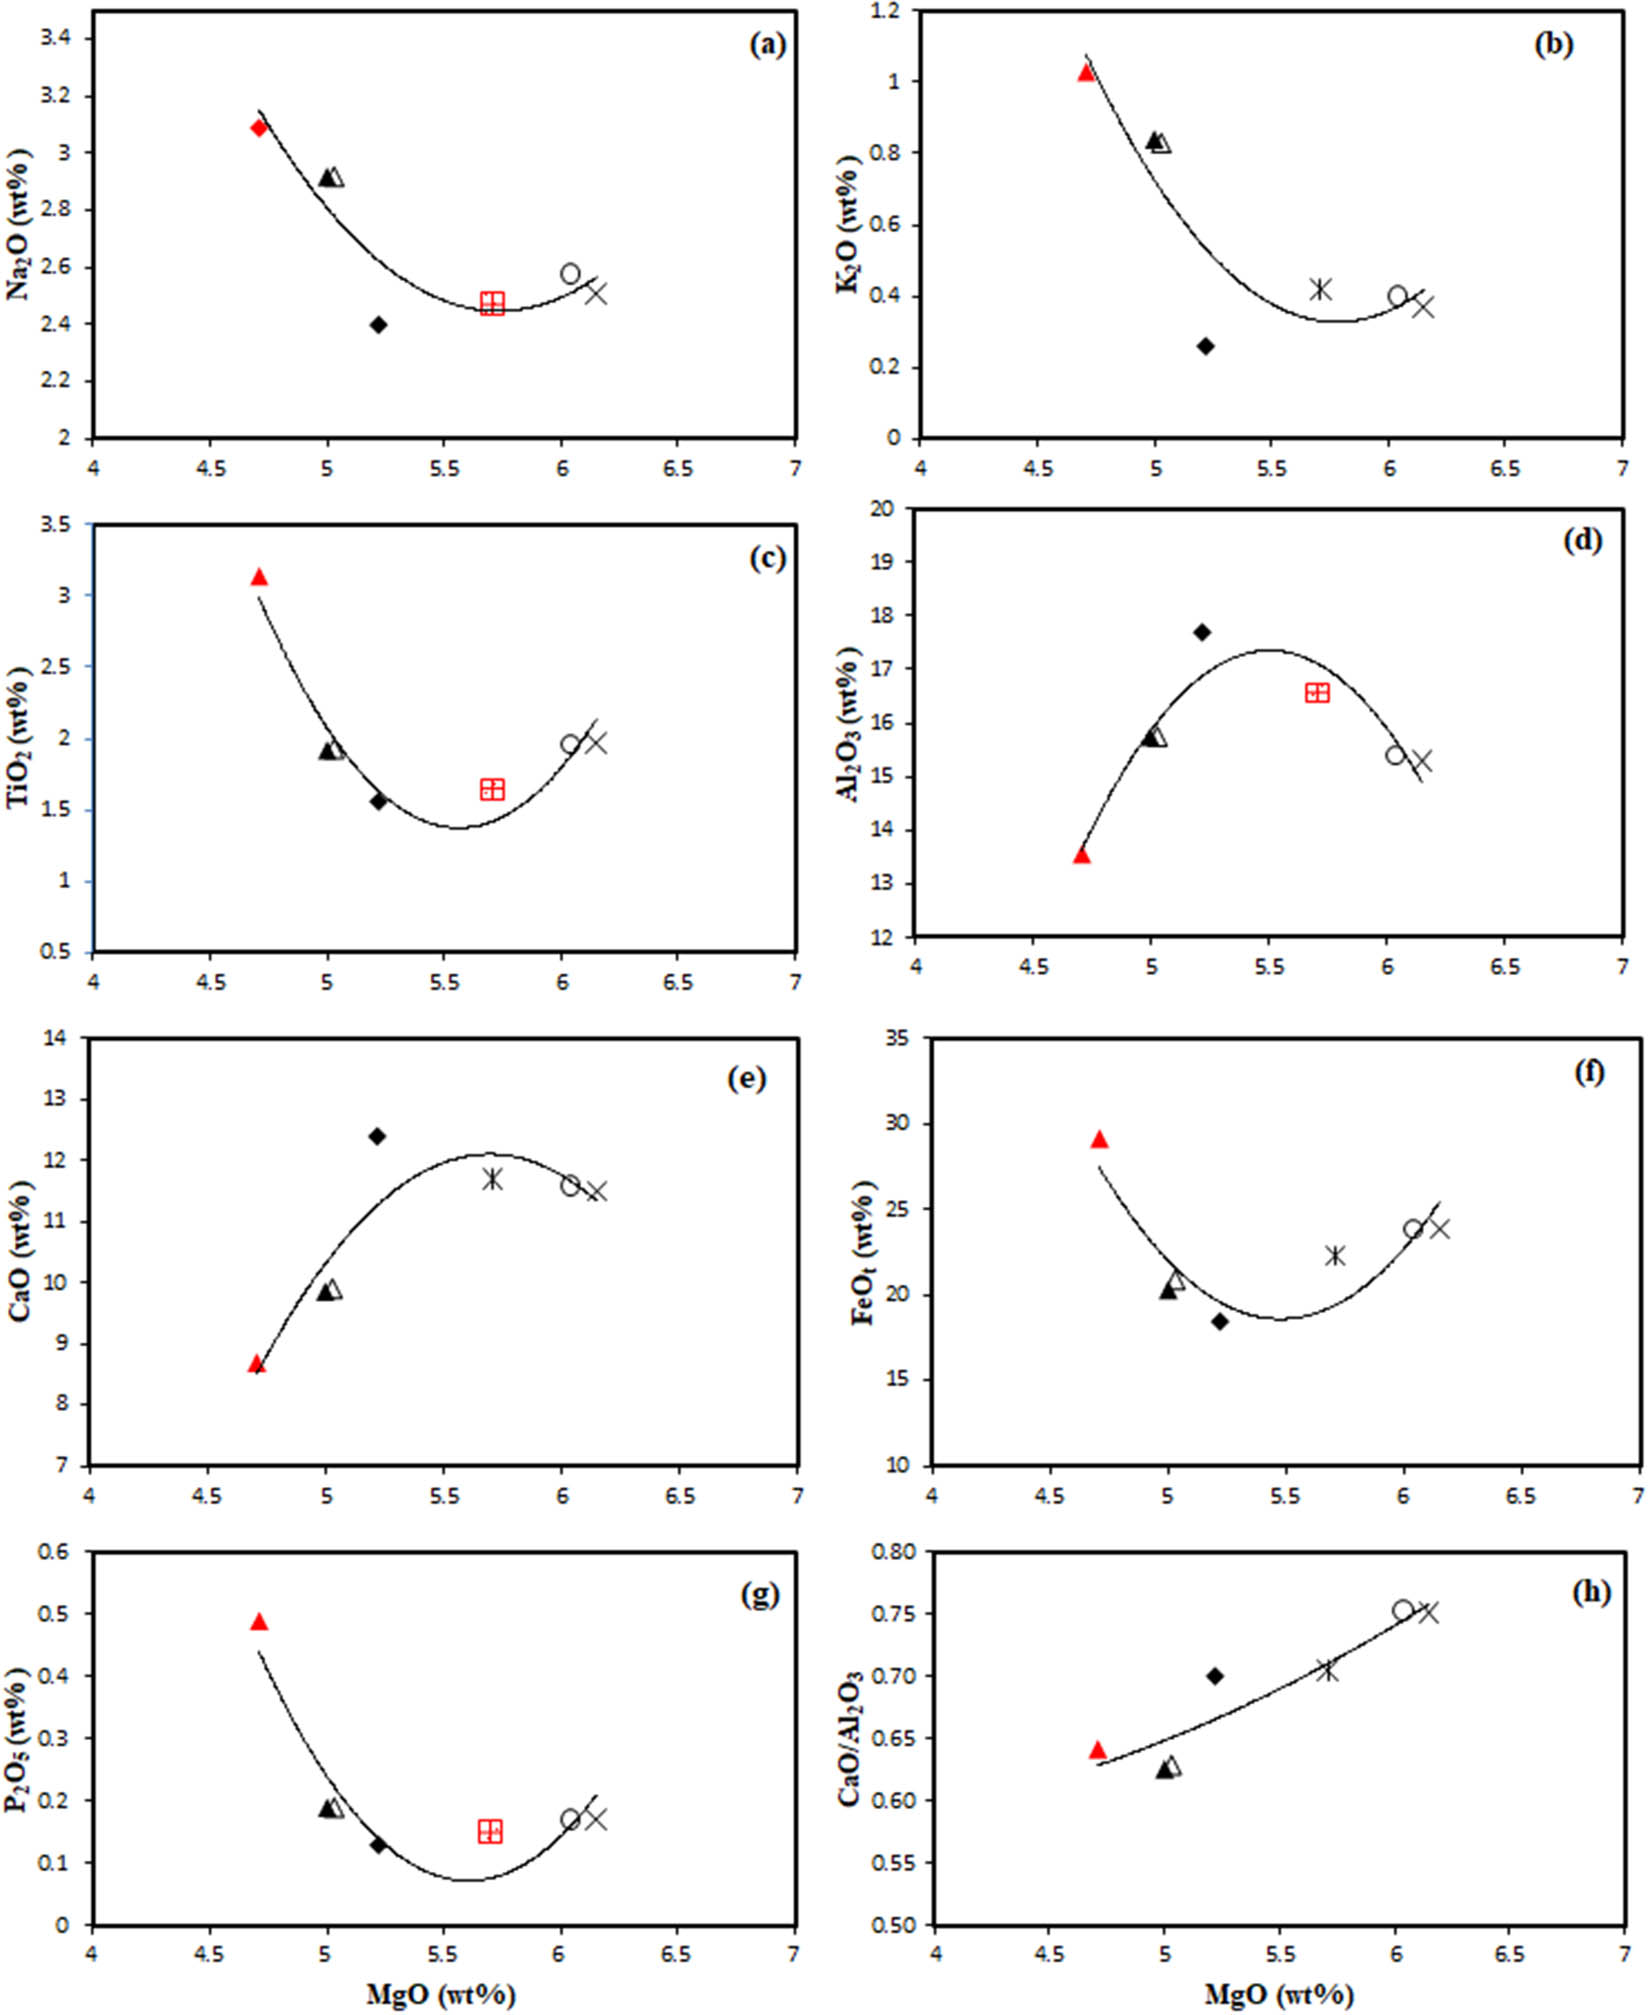
Plots of major oxides vs Mg2O for Gomer basalt samples.
Samples also show a great variation in compatible and incompatible trace element concentrations. They have low Ni (26–72 ppm), Co (22–51 ppm), and Cr (10–150 ppm) contents. Some selected compatible and incompatible trace elements against MgO plots for Gomer basalts are shown in Figure 12. Ni, Cr, and Co exhibit a positive correlation with MgO. In contrast, compatible elements (e.g., V) and incompatible trace elements (Sr, La, Zr) show negative correlations with a well-defined evolution trend with MgO. Eu shows a positive correlation from MgO values 4–5.5 wt% and a negative correlation from MgO values 5.5–6.15 wt%.
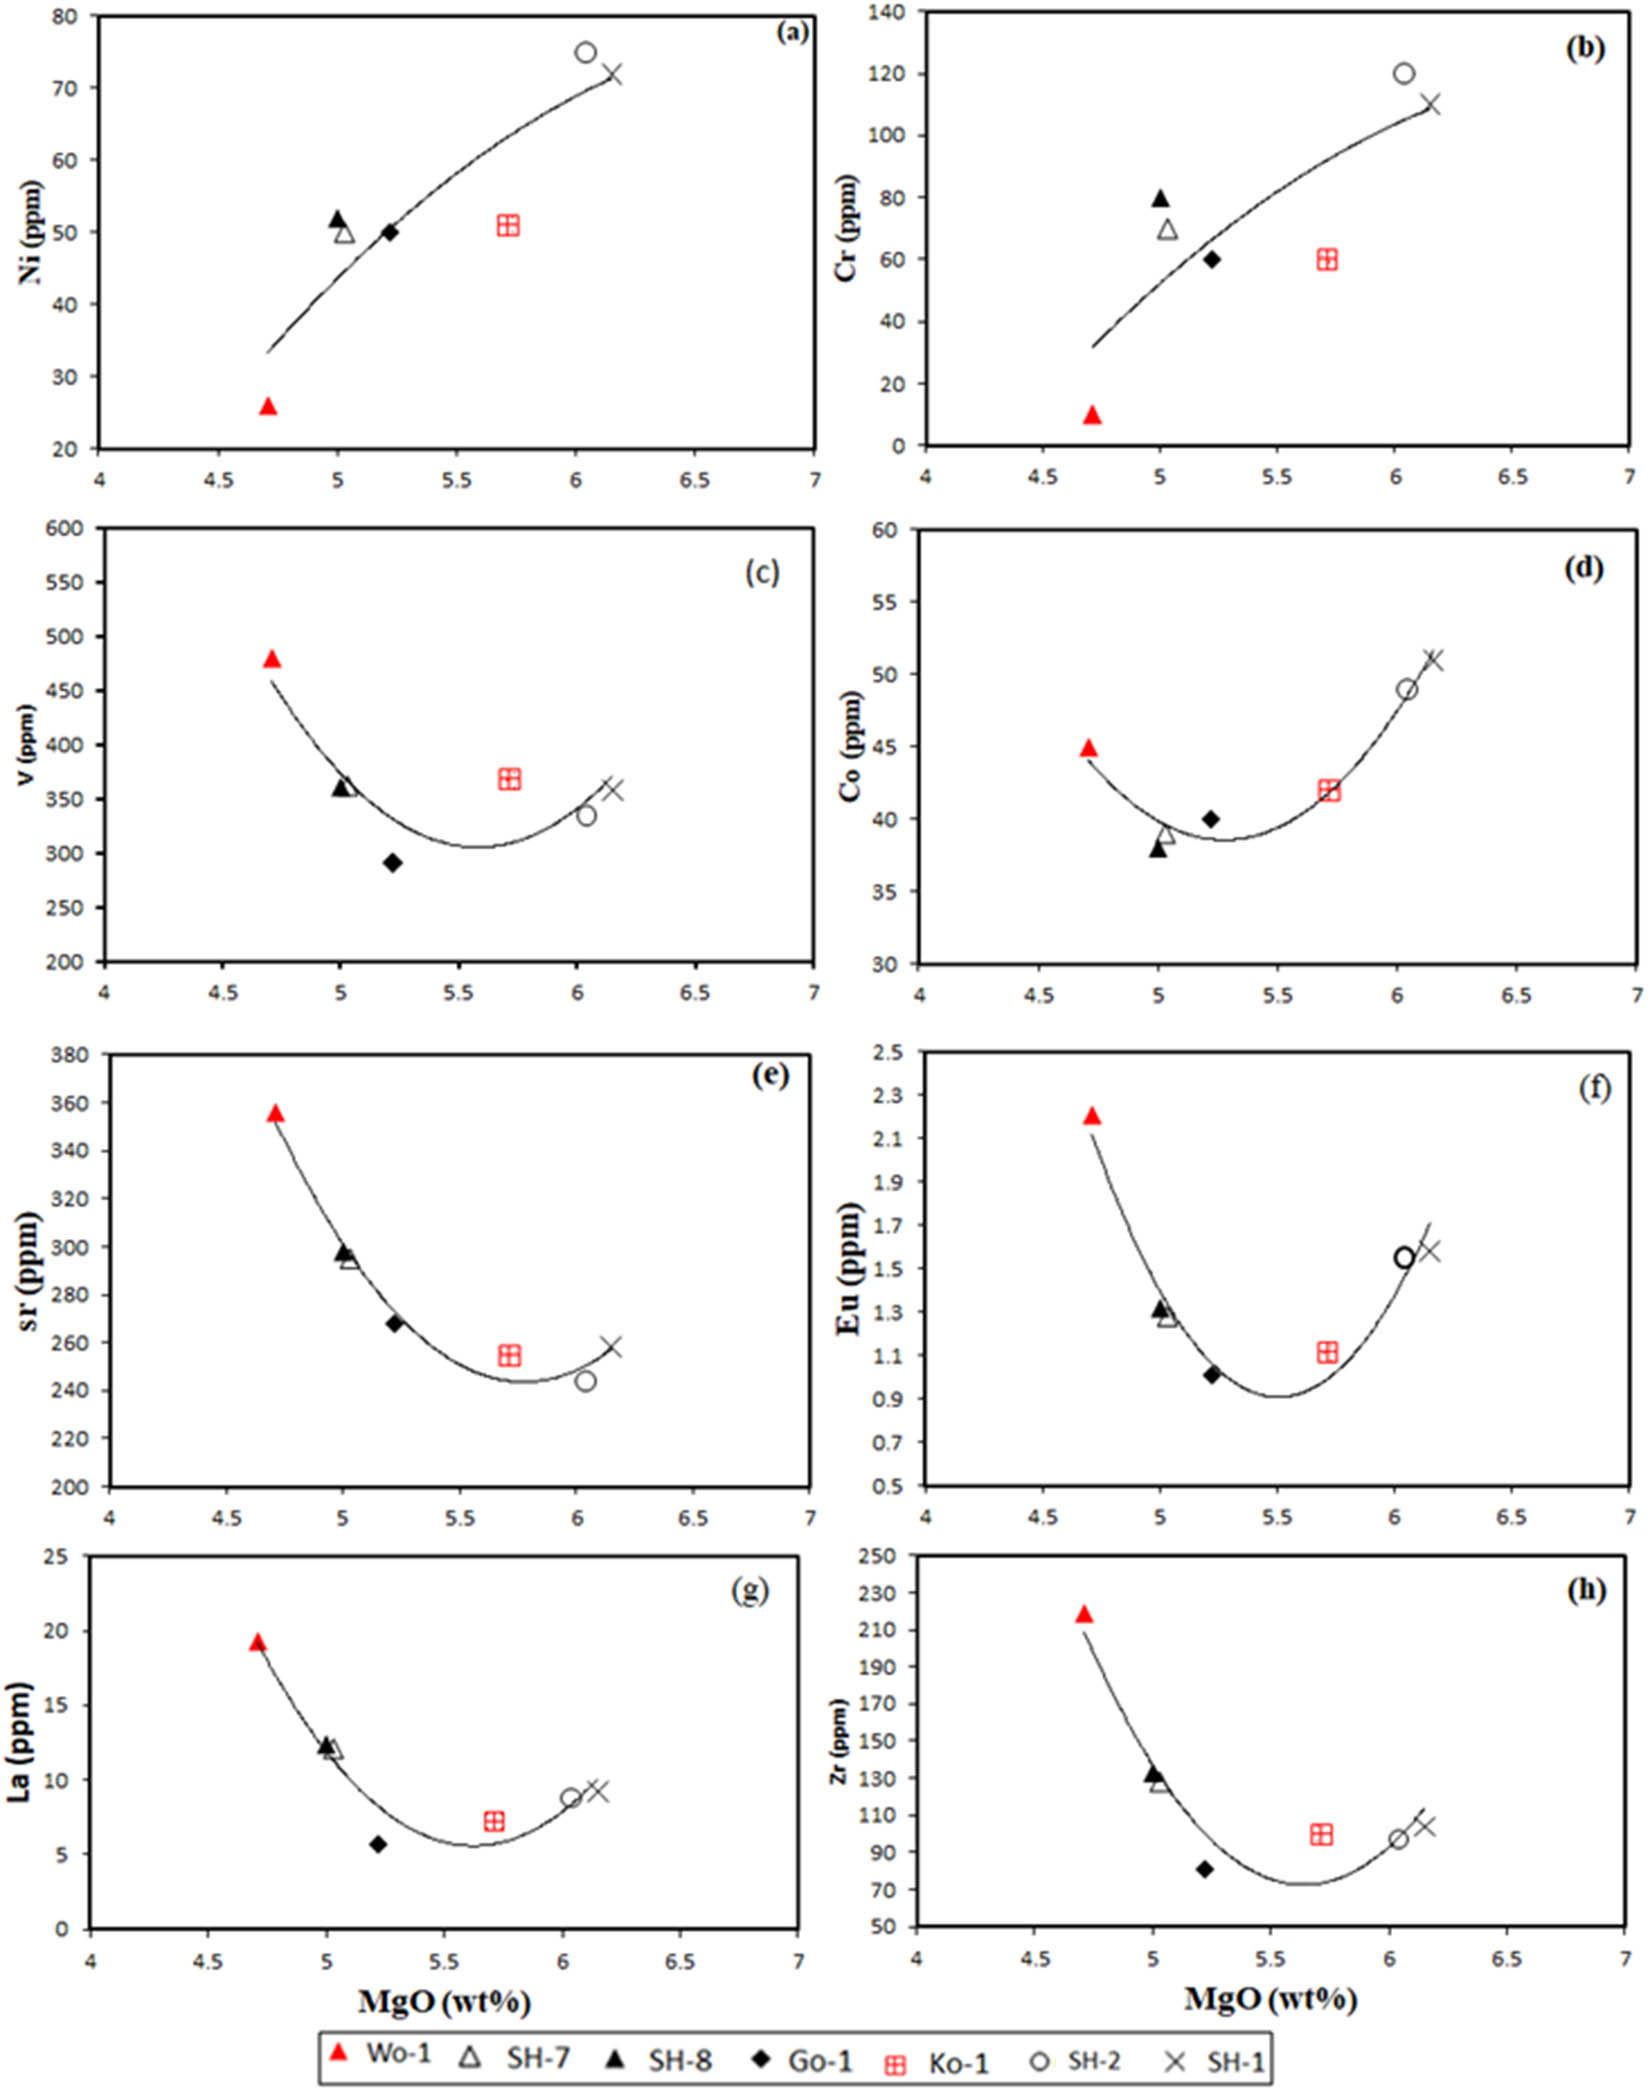
Selected compatible and incompatible trace element abundances (ppm) vs MgO (wt%) for the Gomer basalts.
3.3.3 Spider diagram
The primitive mantle-normalized multi-element diagram of the representative samples is shown in Figure 13. The diagram for all samples shows a right declining trend with decreasing incompatibility of trace elements similar to E-MORB [58]. All lavas also show enrichment in Ba, U, K, Pb, Sr, Nd, and Ti and depletion in Rb, Th, Ta, Eu, and P, with most samples showing slightly negative Ce and Nb anomalies. The pronounced troughs at P, Nb, and Ta, and peaks at Pb, U, and Ba, observed in the multi-element spider diagram (Figure 13), along with elevated La/Ybₙ ratios ranging from 2.19 to 3.85, strongly suggest interaction with crustal components during magma evolution [53]. E-MORB reference values have been plotted alongside the Gomer basalt samples to strengthen the geochemical comparison with potential mantle sources. In addition, a supplementary diagram has been included with all samples normalized directly to E-MORB, providing a clearer basis for evaluating mantle source characteristics and the degree of enrichment.
![Figure 13
(a) Primitive mantle-normalized multi-element spider diagrams for Gomer basalts and basalts from the Northwestern Ethiopian plateau and Ethiopian rifts, plotted for comparison; the REE element abundances of oceanic basalts (N-MORB, E-MORB, and OIB) from [58] are also plotted for references; (a) multi-element spider diagram for Gomer basalts; (b) multi-element spider diagram for Gomer basalts and oceanic basalts (N-MORB, E-MORB and OIB); (c) multi-element spider diagram for Gomer basalts and Oligocene flood basalts from [6,7] (d) multi-element spider diagram for Gomer basalts and Afar basalts from [59] (e) multi-element spider diagram for Gomer basalts and MER basalts from [31]. Normalization values are from [58].](/document/doi/10.1515/geo-2025-0816/asset/graphic/j_geo-2025-0816_fig_013.jpg)
(a) Primitive mantle-normalized multi-element spider diagrams for Gomer basalts and basalts from the Northwestern Ethiopian plateau and Ethiopian rifts, plotted for comparison; the REE element abundances of oceanic basalts (N-MORB, E-MORB, and OIB) from [58] are also plotted for references; (a) multi-element spider diagram for Gomer basalts; (b) multi-element spider diagram for Gomer basalts and oceanic basalts (N-MORB, E-MORB and OIB); (c) multi-element spider diagram for Gomer basalts and Oligocene flood basalts from [6,7] (d) multi-element spider diagram for Gomer basalts and Afar basalts from [59] (e) multi-element spider diagram for Gomer basalts and MER basalts from [31]. Normalization values are from [58].
3.3.4 REE diagram
The chondrite-normalized REE patterns of the representative samples are given in Figure 14. All samples are characterized by variably moderate enrichment in LREE (La/SmN = 1.19–1.71) and less fractionated sub-parallel REE (La/YbN = 2.19–3.85) and HREE patterns. The analyzed samples show pronounced small negative Eu anomalies (Eu/Eu* = 1.56–2.7) (Where the subscript N means chondrite-normalized [58]. All samples show similar trends, suggesting similar magma sources and REE fractionation degrees. They are well correlated with Enriched Mid Oceanic Ridge Basalt and are distinct from Ocean Island basalt (OIB). Furthermore, an E-MORB-normalized REE diagram is included in the supplementary figures to directly compare with this mantle end member, supporting the discussion of source enrichment and melting conditions.
![Figure 14
Chondrite-normalized REE diagrams for Gomer basalts and basalts from Northwestern Ethiopian plateau and Ethiopian rifts, plotted for comparison; the REE element abundances of oceanic basalts (N-MORB, E-MORB, and OIB) from [58] are also plotted for references; (a) REE diagram for Gomer basalts; (b) REE diagram for Gomer basalts and oceanic basalts (N-MORB, E-MORB and OIB); (c) REE diagram for Gomer basalts and Oligocene flood basalts from [6,7]; (d) REE diagram for Gomer basalts and Afar basalts from [59]; (e) REE diagram for Gomer basalts and MER basalts from [31]. Normalization values are from [58].](/document/doi/10.1515/geo-2025-0816/asset/graphic/j_geo-2025-0816_fig_014.jpg)
Chondrite-normalized REE diagrams for Gomer basalts and basalts from Northwestern Ethiopian plateau and Ethiopian rifts, plotted for comparison; the REE element abundances of oceanic basalts (N-MORB, E-MORB, and OIB) from [58] are also plotted for references; (a) REE diagram for Gomer basalts; (b) REE diagram for Gomer basalts and oceanic basalts (N-MORB, E-MORB and OIB); (c) REE diagram for Gomer basalts and Oligocene flood basalts from [6,7]; (d) REE diagram for Gomer basalts and Afar basalts from [59]; (e) REE diagram for Gomer basalts and MER basalts from [31]. Normalization values are from [58].
4 Discussion
The Gomer basalts provide a rare opportunity to study an underexplored volcanic region with mantle source characteristics that are essential for comparative global studies of basaltic provinces. Identifying E-MORB signatures and fractional crystallization processes offers critical parallels to other flood basalt provinces worldwide, such as the Deccan Traps and the Icelandic plume, shedding light on mantle upwelling and tectonic evolution in rift settings. Moreover, the geochemical patterns observed in Gomer basalts contribute to understanding the role of volcanic activity in Earth’s climatic and environmental history. The geochemical variation of basalts in continental settings is mainly controlled by several factors, including mantle source composition, degree of partial melting, and specific shallow-level processes such as crustal contamination and crystal fractionation [60]. These different factors and/or processes are essential issues in modern petrology. Significant geochemical variations in basalts of the Gomer area in a relatively narrow silica (43.1–51.7) range can help evaluate several alternative processes, including the tapping of different mantle sources and the possibility of crustal assimilation combined with fractional crystallization.
4.1 Fractional crystallization
The analyzed basaltic samples from the Gomer area are not primary mantle melts known from their low MgO (400–500 ppm, Cr: >1,000 ppm, and MgO: 10–15 wt% [61]. These characteristics suggest that they have undergone olivine, clinopyroxene ± spinel fractionation from parental magmas either in magma chambers or en route to the Earth’s surface. The low to moderate concentrations of Ni (26–75 ppm) and Cr (10–150 ppm) and the co-variations of Ni, Cr, CaO, FeOt, and Al2O3 with MgO in Gomer basalts confirm the suggestion of fractional crystallization of olivine, clinopyroxene ± spinel. The porphyritic to glomeroporphyritic textures with plagioclase, pyroxene, and Olivine phenocrysts in Gomer basalts imply that the magma was crystallizing these mineral phases before reaching the earth’s surface. Extremely coarse-grained phenocrysts of plagioclase, pyroxene, and Olivine surrounded by a fine-grained matrix of the same minerals indicate bimodal crystallization of Gomer basalts began from a deep-seated magma chamber with high-pressure and temperature conditions.
The mineral assemblages dominated by olivine, clinopyroxene, and plagioclase, and the absence of garnet-phase influence in REE patterns, suggest that the Gomer magmas fractionated within the spinel peridotite stability field, corresponding to depths shallower than ∼80 km. Mineral-melt equilibrium models (e.g., Putirka [62]) support crystallization pressures of ∼0.4–0.8 GPa, typical for lower to middle crustal magma chambers. The relatively high (Tb/Yb)ₙ values (1.29–1.70) are still below the garnet stability threshold (>1.8), reinforcing the view that no residual garnet was involved during fractional crystallization. These data collectively support a low-pressure, crustal magma storage regime, with differentiation likely occurring in shallow-seated reservoirs, followed by ascent and final crystallization in feeder conduits or subvolcanic bodies.
The presence of abundant clinopyroxene and plagioclase phenocrysts, particularly in the form of glomerocrysts and poikilitic textures, indicates a prolonged crystallization history at depth prior to eruption. Their modal proportions (clinopyroxene 5–20%, plagioclase 10–20%) and crystal size distribution are consistent with equilibrium crystallization at moderate to high pressures, likely within mid- to lower-crustal magma chambers. These features, along with the lack of pervasive zoning or disequilibrium textures, support a model of polybaric fractional crystallization, where minerals began crystallizing under deep-seated conditions and continued through magma ascent. Although detailed mineral chemistry was not conducted, the petrographic characteristics provide indirect evidence for high-pressure crystallization regimes. Furthermore, the positive correlation of CaO/Al2O3 with MgO contents in the lavas also indicates that clinopyroxene fractionation plays a significant role in the differentiation of Feldspars. Apatite and Ti–Fe oxides are not a significant fractionation mineral assemblage given the negative correlation between K2O, Na2O, P2O5, and TiO2 with MgO and the positive anomalies in the trace element profiles.
Moreover, the positive Sr and Eu anomalies (Eu/Eu* = 1.56–2.07) on the normalized spider diagrams for these samples and the increase in Al2O3 and Sr concentrations with decreasing MgO also imply that plagioclase fractionation from the mafic lavas was not undergone in the early stages of differentiation. The positive Eu and Sr anomalies in all samples may also indicate the selective retention (accumulation) of plagioclase crystals in magmas during differentiation or contamination of mantle-derived melts by lower-crustal material [63]. As the major and trace element abundances change regularly and predictably with progressive differentiation [64,65], the overall major and trace element data trends for Gomer basalts generally show coherent trends; there are no considerable scatter plots. Thus, this suggests that significant and trace element variations within the suite are due to fractional crystallization processes [65].
4.2 Crustal contamination
Mantle-derived magmas in continental settings can be subjected to variable degrees of contamination by different crustal components during either their ascent through or stagnation in a thick and compositionally variable region, which leads to their compositional diversity [66,67]. The different mechanisms by which crustal contamination may arise include the bulk assimilation of crustal material, the assimilation of partial melt-derived crustal materials, and the selective exchange of specific elements aided by the transfer of fluids from crust to melt [57].
The pronounced troughs at P, Nb, and Ta and peaks at Pb, U, and Ba of the Gomer tholeiitic samples with a La/YbN (2.19–3.85) ratio of greater than one and with no Zr Hf anomaly suggest that their parent magmas were contaminated by crustal material. Moreover, the Ce/Pb and Nb/U ratios of ocean basalts (OIBs and MORBs) are reasonably well-constrained and are relatively uniform (Ce/Pb = 25 ± 5 and Nb/U = 47 ± 10) [5], reflecting the composition of the Earth’s mantle and therefore, are sensitive indicators of crustal contamination of mantle-derived mafic magmas. Basaltic lavas with lower Ce/Pb and Nb/U values reflect a crustal overprint to the primary mantle-derived signature [5,58]. The basalt samples from the Gomer area have lower Ce/Pb (2.9–9) and Nb/U (19.05–35.33) values, a low-to-the-range typical for oceanic basalts [5]. Yet, the values are much more similar to those of continental crust (CC) [68] than mantle composition, which supports the idea of crustal contamination in the analyzed tholeiitic samples. Similarly, in Nb/U vs SiO2 plot of Gomer basalts showing a trend away from the oceanic MORB-OIB array toward lower Nb/U ratios reflecting the role of lithospheric mantle in the genesis of parent magma and magma-crust interactions.
In addition, La/Ta ratios for primary mantle-derived melts are well-defined (La/Ta < 22) [69] and are sensitive to contamination, making them valuable indicators for crustal assimilation of mafic rocks [31]. Thus, the crustal contamination effects of the basaltic lavas from the Gomer area were also confirmed by their higher La/Ta (17–40.3) ratios than the La/Ta ratio for the primary mantle-derived melts (La/Ta < 22) [69].
Figure 15a compares Nb/U ratios to SiO2 contents across Gomer basalt samples. Most samples plot below the typical mantle Nb/U range (∼47 ± 10), particularly those with higher SiO2 values. This trend is characteristic of crustal contamination, as the CC has lower Nb/U ratios than the mantle. The data suggest that while some samples (e.g., Wo-1, SH-7) retain near-mantle Nb/U values, others (e.g., Ko-1, SH-2) have likely undergone interaction with the crust, lowering their Nb/U ratios. This is consistent with assimilation-fractional crystallization processes, especially in samples showing evolved compositions.
![Figure 15
(a) Variation of Nb/U vs Ce/Pb of Gomer basalts. Mantle compositional fields are after Hofmann et al. [5]. The average composition of the upper and LCC (av. UCC and av. LCC, respectively) is from Rudnick and Gao [68]. (b) Nb/U vs SiO2 plot of Gomer basalts showing a trend away from the oceanic MORB-OIB array toward lower Nb/U ratios reflecting the role of lithospheric mantle in the genesis of parent magma and magma-crust interactions.](/document/doi/10.1515/geo-2025-0816/asset/graphic/j_geo-2025-0816_fig_015.jpg)
(a) Variation of Nb/U vs Ce/Pb of Gomer basalts. Mantle compositional fields are after Hofmann et al. [5]. The average composition of the upper and LCC (av. UCC and av. LCC, respectively) is from Rudnick and Gao [68]. (b) Nb/U vs SiO2 plot of Gomer basalts showing a trend away from the oceanic MORB-OIB array toward lower Nb/U ratios reflecting the role of lithospheric mantle in the genesis of parent magma and magma-crust interactions.
The plot (Figure 15b) uses Ce/Pb and Nb/U ratios to distinguish between mantle-derived and crustally modified basalts. The shaded fields represent average mantle values (Nb/U ≈ 47 ± 10, Ce/Pb ≈ 20 ± 5). The Gomer basalt samples plot significantly below both mantle fields, clustering near the average lower continental crust (LCC) and upper continental crust (UCC) values. This indicates that the magma experienced significant crustal contamination, likely during its ascent through thick lithosphere or stagnation in crustal magma chambers.
4.3 Degree of partial melting
The overall data trends, for example, patterns on normalized multi-element and REE diagrams for Gomer basalts, the non-scattered plots on the primary and trace element variation diagrams, and the similar incompatible trace elements ratios between samples indicate that the volcanic groups are identical in their source and their parental magmas were derived from the same mantle sources by the same degrees of partial melting. The hypersthene-quartz normative nature of the Gomer basaltic suite supported that their parental magma generation was attributed to the high degree of partial melting from shallow mantle sources [70]. Furthermore, similar sub-parallel patterns on normalized multi-element and REE diagrams for Gomer samples suggest the same mantle source (co-genetic) [71]. In addition, the rare-earth elements (REEs) are also the most vital informants to understand the mantle melting conditions, as their relative concentration in mantle-derived magmas reflects the degree of partial melting and the nature of the aluminous phase (spinel or garnet) in the mantle source [72]. The HREE (e.g., Yb) is compatible with garnet and has high garnet/melt partition coefficients, whereas MREE (e.g., Sm and Gd) and LREE (e.g., La) are incompatible and have low garnet/melt partition coefficients [57,72]. La/Yb and Sm/Yb are strongly fractionated when melting occurs in the garnet stability field, and on the other hand, in contrast to this, La/Yb is slightly fractionated, and Tb/Yb are nearly unfractionated during melting in the spinel peridotite domain. Low (La/Yb) N ratios (2.19–3.85) and relatively flat HREE patterns [(Tb/Yb) N = 1.29–1.7 and (Dy/Yb) N = 1.27–1.57)] for the Gomer basalts are consistent with a higher degree of partial melting of an E-MORB-type of the mantle in the spinel lherzolite stability field. Moreover, the ratios of Zr/Y and Nb/Y are less sensitive to crustal assimilation and are considered indicators of residual garnet in the mantle source from which basaltic melts are derived and, thus, a proxy for depth [73]. The high field strength element (HFSE) (Zr/Y ≤ 4.6 and Nb/Y ≤ 0.5) ratios of the Gomer basalts are relatively lower and consistent with a spinel peridotite source [73,74].
Figure 16a shows the discrimination between partial melting in the presence of garnet peridotite (deep mantle) vs spinel peridotite (shallower mantle). All the Gomer basalt samples plot below the garnet–spinel boundary, in the spinel peridotite field, with (Tb/Yb)ᴺ ratios ranging from approximately 1.2–1.6. The (La/Dy)ᴺ values vary from ∼1.5 to 3.0, suggesting an enriched mantle source but not one influenced by garnet residue. Figure 16b shows the separation of the melting signatures of spinel vs garnet peridotite. Again, all samples fall in the spinel peridotite field, confirming that the residual garnet phase was not involved during partial melting. The (La/Sm)ᴺ values reflect light REE enrichment, supporting derivation from an enriched spinel lherzolite source, consistent with an E-MORB-type mantle.
![Figure 16
(a) (Tb/Dy)N vs (La/Dy)N and b) (Tb/Yb)N vs (La/Sm) N variation plots for Gomer basalts. Chondrite normalization values. The horizontal solid line in (a) and (b) separates the fields of garnet-bearing peridotite and of spinel-bearing peridotite (from Wang et al. [76]), respectively. In both diagrams, all samples from the Gomer area are plotted in spinel peridotite fields.](/document/doi/10.1515/geo-2025-0816/asset/graphic/j_geo-2025-0816_fig_016.jpg)
(a) (Tb/Dy)N vs (La/Dy)N and b) (Tb/Yb)N vs (La/Sm) N variation plots for Gomer basalts. Chondrite normalization values. The horizontal solid line in (a) and (b) separates the fields of garnet-bearing peridotite and of spinel-bearing peridotite (from Wang et al. [76]), respectively. In both diagrams, all samples from the Gomer area are plotted in spinel peridotite fields.
4.4 Mantle source characteristics
The patterns on primitive mantle-normalized multi-element and chondrite-normalized REE plots (for Gomer basalts are more likely consistent with a contribution from E-MORB [58]. All samples are characterized by their enrichments in highly and moderately compatible trace element abundances (e.g., LREE abundances), ranging from a few tens of the chondritic abundances to hundreds is challenging to reconcile strictly with a depleted mid-ocean ridge basalt (MORB) mantle source. These patterns are usually thought to be typical of magmas generated by the partial melting of the asthenospheric upper mantle [75].
The multi-element spider diagram of the Gomer basalts shows a typical E-MORB signature, with moderate LILE enrichments and distinct negative anomalies at Nb and Ta, alongside positive spikes at Pb and U. These patterns are characteristic of CFBs and are often attributed to either subduction-modified mantle sources or crustal contamination [77]. Comparisons with other global LIP systems reveal similar features; for example, Afar flood basalts display comparable Nb–Ta depletions and Pb enrichments associated with plume-lithosphere interaction [59], while Deccan Traps basalts show these signatures due to significant crustal input (Mahoney et al. 2000). In the Gomer basalts, the La/Ybₙ range of 2.19–3.85, with elevated Ba, U, and Pb and suppressed Nb and Ta, underscores the role of enriched mantle source melting coupled with minor crustal assimilation. These geochemical characteristics emphasize mantle heterogeneity beneath the northwestern Ethiopian plateau, indicating a composite source involving an E-MORB-like mantle influenced by lithospheric input and early rift-related magmatism. The enrichment characteristics in the incompatible trace elements observed in MORB (E-MORB) may originate in material entrained from the lower mantle [78], or as plumes or hotspots rising from below the asthenosphere [79], or from subducted materials distributed in a streaky fashion throughout the upper mantle [79].
Furthermore, the ratios of the highly incompatible trace element having similar incompatibility (e.g., Zr/Nb, Nb/Th, Ba/La, Ba/Nb, Ba/Th, Rb/Nb, Th/Yb, Zr/Y, and La/Nb) are often thought to be more directly representatives of source compositions and can indicate the mantle source heterogeneity as they are the least susceptible to fractionate during partial melting and not significantly changed by limited degrees of low-pressure crystallization of melts [71,80,81]. The Gomer basalts have incompatible trace element ratios (e.g., Zr/Nb = 12.4–19.8, La/Nb = 1.13–1.5) similar to E-MORB [58]. [82,83] have also emphasized the importance of the Zr/Nb ratio as an indicator of the “depleted” or “enriched” nature of the source region for basaltic lavas. The studied samples have lower Zr/Nb (4.9–19.8) ratios than N-MORB (Zr/Nb > 30), suggesting an enriched mantle source. However, plume-type basalts generally have lower Zr/Nb ratios than N-MORB (Zr/Nb > 30). Therefore, the Gomer basalts’ Zr/Nb values (4.9–19.8) exhibit a comparatively lower range, reflecting a plume signature of the magma that generated these lavas. In addition, samples also have low Y/Nb (0.62–4.46) and Ti/Zr (69.52–121.7) ratios and high Zr/Y (3.79–7.96) ratios, which confirm their derivation from enriched mantle regions [83]. In the Zr/Nb vs Nb/Th plot (Figure 17a), the studied samples have a strong tendency to fall between the values of PM and E-MORB mantle array, reflecting the role of PM and E-MORB type mantle in the genesis of parent magma with minor magma crust interactions. In addition, in the Ba/Th vs Rb/Nb and Ba/Nb vs Ba/La plots of Figure 17 (Weaver [84]), the Gomer basalts show high affinity to EM-I with minor involvement of EM-II and PM mantle end members.
![Figure 17
(a) Zr/Nb vs Nb/Th, (b) Ba/La vs Ba/Nb, and (c) Ba/Th vs Rb/Nb plot of Gomer basalts relative to the mantle compositional components. The fields for PM, HIMU, EMI, and EMII are based on data from Weaver [84]. The data for PM, N-MORB, E-MORB, and OIB are from Sun and McDonough [58]. The data for the continental, lower, and UCC are from Rudnick and Gao [68]. PM, primitive mantle; HIMU, high (U/Pb) source; EM1 and EM2, enriched mantle sources; N-MORB, normal ocean ridge basalt; E-MORB, enriched ocean ridge basalt; OIB, oceanic island basalt; LCC, UCC, and CC.](/document/doi/10.1515/geo-2025-0816/asset/graphic/j_geo-2025-0816_fig_017.jpg)
(a) Zr/Nb vs Nb/Th, (b) Ba/La vs Ba/Nb, and (c) Ba/Th vs Rb/Nb plot of Gomer basalts relative to the mantle compositional components. The fields for PM, HIMU, EMI, and EMII are based on data from Weaver [84]. The data for PM, N-MORB, E-MORB, and OIB are from Sun and McDonough [58]. The data for the continental, lower, and UCC are from Rudnick and Gao [68]. PM, primitive mantle; HIMU, high (U/Pb) source; EM1 and EM2, enriched mantle sources; N-MORB, normal ocean ridge basalt; E-MORB, enriched ocean ridge basalt; OIB, oceanic island basalt; LCC, UCC, and CC.
The trace element ratios of the Gomer basalts provide significant insights into their mantle source characteristics. The Zr/Nb ratios range from 12.4 to 19.8, and La/Nb ratios from 1.13 to 1.5, consistent with an enriched mantle source, similar to E-MORB compositions. These ratios suggest a mantle source undergoing prior enrichment processes [85]. Additionally, the Ti/Y ratios, which vary between 450 and 700, further support the involvement of an enriched mantle component. We have utilized REE-based discrimination diagrams to further constrain the mantle source’s depth and nature. The (La/Yb)ₙ vs (Tb/Yb)ₙ plot is particularly informative, distinguishing between garnet and spinel peridotite sources. The (Tb/Yb)ₙ ratios in this study’s samples are consistently below 1.8, indicating melting within the spinel peridotite facies.
4.5 Tectonic settings
The HFSE abundances and ratios are considered suitable parameters to discriminate the tectonic environment for the eruption of basaltic magmas. All basalt samples are plotted in the Ti vs Zr diagram [81] in the field of the within-plate basalt (WPB). The plots of these samples also cluster WPBs on the Zr vs Zr/Y [83]. The Gomer basalts are geographically located in the northwestern Ethiopia plateau, have a stratified nature, and are classified as low Ti basalt of the northwestern Ethiopia plateau based on TiO2 contents and incompatible trace element abundance and ratios, implying the Gomer basalts belong to pre-rift basalts of the Northwestern Ethiopia plateau. These geochemical characteristics – particularly the E-MORB-like trace element signatures and the low TiO2 content – support derivation from an enriched mantle source associated with early-stage continental rifting in the western Ethiopian Plateau, contributing valuable insights into the geodynamic evolution of the Ethiopian Rift System (Figure 18).
![Figure 18
(a) Ti–Zr discrimination diagram (Pearce [86]) shows the Gomer rock samples plotted within-plate lavas field. (b) Ti/Y–Zr discrimination diagram [82] also shows the Gomer rock samples plotted within-plate lavas field.](/document/doi/10.1515/geo-2025-0816/asset/graphic/j_geo-2025-0816_fig_018.jpg)
4.6 Comparison of Gomer basalts with other Ethiopian basaltic provinces: Northwestern Ethiopian plateau basalts, Afar basalts, and Main Ethiopian Rift basalts
While geochemical discrimination diagrams (e.g., Ti–Zr, Ti/Y-Zr) plot the Gomer basalts within the WPB field, this classification must be contextualized within the broader tectonic setting. The location of the Gomer region on the western margin of the Ethiopian plateau – along the evolving East African Rift System – suggests a tectonomagmatic environment shaped by early-stage continental rifting. The E-MORB-like trace element signatures, low (La/Yb)ᴺ ratios, and spinel-peridotite-derived melting patterns are consistent with partial melting due to asthenospheric upwelling and decompression in an extending lithosphere. These features point to a transitional setting influenced by plume–lithosphere interaction and rift initiation rather than mature rift magmatism.
Incompatible trace element data from previous works, such as for Northwestern Ethiopian plateau Oligocene basalts [6,7], MER basalts [31], and Afar rift basalts [59], have been plotted on spider and REEs diagrams together with the primary data of this study to compare and determine possible petrogenetic relationships among them. Incompatible trace element data with low LOI and higher MgO (>6 wt%) values were selected to plot.
The primitive mantle normalized multi-element patterns for Gomer basalts are similar to the LT NW Ethiopian plateau basalts, with a typical peak at Ba, K, Sr, Pb, and Ti and troughs at Th and Nb. The chondrite-normalized REE patterns are similar to the LT NW Ethiopian plateau basalts, except for the LREE depletion in the LT Oligocene plateau basalts. However, the Gomer basalts are more enriched in the most incompatible elements than the LT basalts. The TiO2 contents and the Ti/Y and Nb/Y ratios for Gomer basalts are typical of the LT Oligocene plateau basalts [6]. Although the Gomer basalts have many similar incompatible element characteristics with the LT plateau basalts, some other consistent differences are also found between patterns of those lavas that require distinct histories of the petrogenetic process.
On the other hand, the Gomer basalts and MER basalts show similar patterns on REEs and spider diagrams with different enrichments in incompatible elements and have typical peaks at Ba, Pb, Sr, and Ti. However, both basalts show opposed anomalies at Nb and U. Nb shows negative anomalies, whereas U is positive in Gomer Basalts, as opposed to the MER basalts. From this, we can conclude that both magmas are from enriched mantles with different petrogenetic processes acting on them. The Gomer basalts also show similar enrichments in incompatible elements on REEs and spider diagrams with no more common peaks and troughs, except both show peaks at U. Although both magma suites have similar enrichments in incompatible elements, they show their peaks and troughs differently, thus implying that they are derived from enriched mantle sources, with no common history of petrogenesis.
5 Conclusion
The following points have been drawn based on field observations of petrographic and geochemical data obtained in the present study: the study area comprises differently textured basalts, scoriaceous basalt, agglomerate, and meta-granites. The Gomer area basalts mainly comprise olivine, clinopyroxene, plagioclase, and opaques. They show highly porphyritic to glomeroporphyritic textures with abundant phenocrysts of clinopyroxene and plagioclase and very subordinate olivine set in an intergranular textured groundmass of the same mineral assemblage as the phenocrysts with some opaques. Based on the proportion of phenocryst mineral assemblage, the studied samples are grouped as plagioclase-pyroxene phyric basalt and plagioclase phyric basalt. The Gomer basalts are tholeiitic in suites, constituting their hypersthene-quartz normative nature. The overall coherent trends on selected major and trace variation diagrams, similar incompatible trace element ratios, and similar and subparallel patterns on normalized multi-element and REE diagrams for the Gomer tholeiitic-basalts suggest that they are co-genetic. Co-variations of Ni, Cr, Co, CaO, FeOt, and Al2O3 with MgO in the Gomer basalts indicate that they have undergone fractional crystallization of olivine, clinopyroxene, plagioclase ± spinel.
The Gomer basalts display some E-MORB-like trace element characteristics with lower Nb/U and Ce/Pb ratios than the oceanic basalts derived from E-MORB-like primary melt with some crustal contamination. Low (La/Yb) N ratios (2.19–3.85) and relatively flat HREE patterns [(Tb/Yb) N = 1.29–1.7 and (Dy/Yb) N = 1.27–1.57)] for the Gomer basalts are consistent with higher degree partial melting of an E-MORB-type mantle in the spinel stability field. Based on Ti–Zr and Ti/Y-Zr plots, the Gomer area basalts revealed a WPB tectonic setting. This study’s findings have significant implications beyond the regional context. By revealing mantle heterogeneity and the tectonic setting of the Gomer basalts, the research offers valuable data for global geodynamic models and comparative studies with other volcanic regions. These results also provide a foundation for understanding mantle-crust interactions, rifting dynamics, and their role in shaping Earth’s geological and climatic history. In general, the observed spider diagrams and the ratios of some of the highly incompatible elements support a model for the genesis of basalts from the Gomer area by the same degrees and/or depths of partial melting from the same enriched type of mantle sources. Thus, as discussed above, fractional crystallization processes and contamination by crustal source materials were involved in the evolution of the Gomer basalts. These findings enhance our understanding of Ethiopian plateau volcanism and provide a framework for interpreting mantle dynamics and volcanic processes across similar global provinces.
-
Funding information: Authors state no funding involved.
-
Author contributions: Habtamu Wondem: writing – original draft, methodology, investigation, and conceptualization. Minyahl Teferi: writing – original draft, formal analysis, data curation, and conceptualization. Muralitharan Jothimani: writing – review and editing, and writing – original draft. Demeke Wondem: methodology, investigation, and data curation.
-
Conflict of interest: Authors state no conflict of interest.
-
Data availability statement: The data used in this study may be available upon reasonable request.
References
[1] Mohr P. Ethiopian flood basalt province. Nature. 1983;303:577–84.10.1038/303577a0Search in Google Scholar
[2] Mohr P, Zanettin B. The Ethiopian flood basalt province. In: Macdougall JD, editor. Continental flood basalts. Dordrecht: Kluwer Academic Publishing; 1988. p. 63–110.10.1007/978-94-015-7805-9_3Search in Google Scholar
[3] Trua T, Deniel C, Mazzuoli R. Crustal control in the genesis of Plio-Quaternary bimodal magmatism of the Main Ethiopian Rift (MER): geochemical and isotopic (Sr, Nd, Pb) evidence. Chem Geol. 1999;155:201–31.10.1016/S0009-2541(98)00174-0Search in Google Scholar
[4] Kieffer B, Arndt N, Lapierre H, Bastien F, Bosch D, Pecher A, et al. Flood and shield basalts from Ethiopia: magmas from the African superswell. J Pet. 2004;45:793–834.10.1093/petrology/egg112Search in Google Scholar
[5] Hofmann C, Courtillot V, Féraud G, Rochette P, Yirgu G, Ketefo E, et al. Timing of the Ethiopian flood basalt event and implications for plume birth and global change. Nature. 1997;389:838–41.10.1038/39853Search in Google Scholar
[6] Pik RD, Coulon C, Yirgu G, Hofmann C, Ayalew D. The Northwestern Ethiopian plateau flood basalts: classification and spatial distribution of magma types. J Volcanol Geoth Res. 1998;81:91–111.10.1016/S0377-0273(97)00073-5Search in Google Scholar
[7] Pik R, Deniel C, Coulon C, Yirgu G, Marty B. Isotopic and trace element signatures of Ethiopian flood basalts; evidence for plume-lithosphere interactions. Geochim Cosmochim Acta. 1999;63:2263–79.10.1016/S0016-7037(99)00141-6Search in Google Scholar
[8] Ukstins IA, Renne PR, Wolfenden E, Baker J, Ayalew D, Menzies M. Matching conjugate volcanic rifted margins: 40Ar/39Ar chrono-stratigraphy of pre- and syn-rift bimodal flood volcanism in Ethiopia and Yemen. Earth Planet Sci Lett. 2002;198:289–306.10.1016/S0012-821X(02)00525-3Search in Google Scholar
[9] Ayalew D, Yirgu G. Crustal contribution to the genesis of Ethiopian plateau rhyolitic ignimbrites: basalts and rhyolite geochemical provinciality. J Geol Soc Lond. 2003;160:47–56.10.1144/0016-764901-169Search in Google Scholar
[10] Meshesha D, Shinjo R. Petrochemical evidence for diversity of magma compositions at the northwestern Ethiopian volcanic province. Bull Fac Sci Univ Ryukyus. 2004;78:251–66.Search in Google Scholar
[11] Meshesha D, Shinjo R. Hafnium isotope variations in Bure volcanic rocks from the northwestern volcanic province: a new insight for mantle source diversity. J Mineral Petrol Sci. 2010;105:101–11.10.2465/jmps.090427aSearch in Google Scholar
[12] Beccaluva L, Bianchini G, Natali C, Siena F. Continental flood basalts and mantle plumes: a case study of the Northern Ethiopian Plateau. J Pet. 2009;50:1377–403.10.1093/petrology/egp024Search in Google Scholar
[13] Chayes F. A simple point counter for thin section. Am Min. 1949;36:1–11.Search in Google Scholar
[14] Vysetti B, Manavalan S. Data quality in geochemical elemental and isotopic analysis. Minerals. 2022;12(8):999. 10.3390/min12080999.Search in Google Scholar
[15] Verma S, Díaz-González L, Pérez-Garza J, Rosales-Rivera M. Quality control in geochemistry from a comparison of four central tendency and five dispersion estimators and example of a geochemical reference material. Arab J Geosci. 2016;9:1–14. 10.1007/s12517-016-2764-4.Search in Google Scholar
[16] Fedorowich J, Richards J, Jain J, Kerrich R, Fan J. A rapid method for REE and trace-element analysis using laser sampling ICP-MS on direct fusion whole-rock glasses. Chem Geol. 1993;106:229–49. 10.1016/0009-2541(93)90029-I.Search in Google Scholar
[17] Gupta J. Determination of scandium, yttrium and eight rare earth elements in silicate rocks and six new geological reference materials by simultaneous multi-element electrothermal atomic absorption spectrometry with Zeeman-effect background correction. J Anal Spectrom. 1993;8:93–101. 10.1039/JA9930800093.Search in Google Scholar
[18] Garçon M, Sauzéat L, Carlson R, Shirey S, Simon M, Balter V, et al. Nitrile, Latex, Neoprene and Vinyl Gloves: A primary source of contamination for trace element and Zn isotopic analyses in geological and biological samples. Geostand Geoanal Res. 2017;41:367–80. 10.1111/ggr.12161.Search in Google Scholar
[19] Wainwright P, Sieniawska C, Cook P. Sample contamination as a source of error in trace element analysis: an ever-present threat. J Clin Pathol. 2016;69:838. 10.1136/jclinpath-2016-203720.Search in Google Scholar PubMed
[20] Henderson C. Analysis of standard silicate rocks. Earth Planet Sci Lett. 1967;3:1–7. 10.1016/0012-821X(67)90002-7.Search in Google Scholar
[21] Gupta JG, Bertrand N. Direct ICP-MS determination of trace and ultratrace elements in geological materials after decomposition in a microwave oven. Talanta. 1995;42(11):1595–607. 10.1016/0039-9140(95)01612-0.Search in Google Scholar PubMed
[22] Flanagan FJ, editor. Descriptions and analyses of eight new USGS rock standards. Vol. 840. US Department of the Interior, Geological Survey; 1976.10.3133/pp840Search in Google Scholar
[23] Torgov V, Demidova MG, Korda T, Kalish N, Shul’man RS. Extraction–atomic absorption spectrometric method for the determination of the platinum group elements and gold in copper–nickel ores using an autoclave sample decomposition technique. Analyst. 1996;121:489–94. 10.1039/AN9962100489.Search in Google Scholar
[24] Balaram V, Patil M, Agrawal A, Subba Rao DV, Charan SN, Satyanarayanan M, et al. Preparation and certification of high-grade gold geochemical reference material. Accredit Qual Assur. 2006;11:329–35. 10.1007/S00769-006-0179-8.Search in Google Scholar
[25] Gu T, Zhang Z, Wang C, Yan W. Preparation and certification of high-grade gold ore reference materials (GAu 19–22). Geostand Geoanal Res. 2001;25:153–8. 10.1111/J.1751-908X.2001.TB00970.X.Search in Google Scholar
[26] Bonifacie M, Jendrzejewski N, Agrinier P, Coleman M, Pineau F, Javoy M. Pyrohydrolysis-IRMS determination of silicate chlorine stable isotope compositions. Chem Geol. 2007;242:187–201. 10.1016/J.CHEMGEO.2007.03.012.Search in Google Scholar
[27] Meshesha D, Shinjo R. Crustal contamination and diversity of magma sources in the northwestern Ethiopian volcanic province. J Mineral Petrol Sci. 2007;102(5):272–90.10.2465/jmps.061129Search in Google Scholar
[28] Ayalew D, Barbey P, Marty B, Reisberg L, Yirgu G, Pik R. Source, genesis and timing of giant ignimbrite deposits associated with Ethiopian continental flood basalts. Geochim Cosmochim Acta. 2002;66:1429–48. 10.1016/S0016-7037(01)00834-1.Search in Google Scholar
[29] Yirgu G, Ebinger CJ, Maguire PKH. The afar volcanic province within the East African Rift System. Geol Soc Lond Spec Publ. 2006;259:327.10.1144/GSL.SP.2006.259.01.01Search in Google Scholar
[30] Janney PE, Le Roex AP, Carlson RW, Viljoen KS. A chemical and multi-isotope study of the Western Cape melilitite province, South Africa: implications for the sources of kimberlites and the origin of the HIMU signature in Africa. J Pet. 2002;43:2339–70.10.1093/petrology/43.12.2339Search in Google Scholar
[31] Furman T. Geochemistry of East African Rift basalts: an overview. J Afr Earth Sci. 2007;48:157–60.10.1016/j.jafrearsci.2006.06.009Search in Google Scholar
[32] Rooney TO, Nelson WR, Ayalew D, Hanan B, Yirgu G, Kappelman J. Melting the lithosphere: Metasomes as a source for mantle-derived magmas. Earth Planet Sci Lett. 2017;461:105–18.10.1016/j.epsl.2016.12.010Search in Google Scholar
[33] Mege D, Korme T. Dyke swarm emplacement in the Ethiopian Large Igneous Province: not only a matter of stress. J Volcanol Geotherm Res. 2004;132(4):283–310. 10.1016/S0377-0273(03)00318-4.Search in Google Scholar
[34] Peccerillo A, Barberio MR, Yirgu Y, Ayalew D, Barberi M, Wu TW. Relationships between mafic and acid peralkaline magmatism in continental rift settings: a petrological, geochemical and isotopic study of the Gedemsa volcano, central Ethiopian rift. J Pet. 2003;44:2003–32.10.1093/petrology/egg068Search in Google Scholar
[35] Getaw A, Ayalew D, Fontijn K. Lithostratigraphy of the Chole section, Southeastern Ethiopian volcanic province. Min Pet. 2024;118(4):513–33. 10.1007/s00710-024-00877-y.Search in Google Scholar
[36] Kazmin V. Geological map of Ethiopia, scale 1:2,000,000. Addis Ababa: Geological Survey of Ethiopia; 1973.Search in Google Scholar
[37] Rochette P, Tamrat E, Féraud G, Pik R, Courtillot V, Ketefo E, et al. Magnetostratigraphy and timing of the Oligocene Ethiopian traps. Earth Planet Sci Lett. 1998;164:497–510.10.1016/S0012-821X(98)00241-6Search in Google Scholar
[38] Coulie E, Quidelleur X, Gillot PY, Courtillot V, Lefevre JC, Chiesa S. Comparative K-Ar and Ar/Ar dating of Ethiopian and Yemenite Oligocene volcanism: implications for timing and duration of the Ethiopian traps. Earth Planet Sci Lett. 2003;206(3–4):477–92.10.1016/S0012-821X(02)01089-0Search in Google Scholar
[39] Rooney TO. The Cenozoic magmatism of East-Africa: Part I-Flood basalts and pulsed magmatism. Lithos. 2017;286:264–301.10.1016/j.lithos.2017.05.014Search in Google Scholar
[40] Wolfenden E, Ebinger C, Yirgu G, Deino A, Ayalew D. Evolution of the northern Main Ethiopian rift: birth of a triple junction. Earth Planet Sci Lett. 2004;224:213–28.10.1016/j.epsl.2004.04.022Search in Google Scholar
[41] Davidson A, Rex DC. Age of volcanism and rifting in southern Ethiopia. Nature. 1980;283:65–6.10.1038/283657a0Search in Google Scholar
[42] Ferrando S, Frezzotti ML, Neumann ER, De Astis G, Peccerillo A, Dereje A, et al. Composition and thermal structure of the lithosphere beneath the Ethiopian plateau: evidence from mantle xenoliths in basanites, Injibara, Lake Tana Province. Min Pet. 2008;93(1–2):47–78.10.1007/s00710-007-0219-zSearch in Google Scholar
[43] Kabeto K. Geological and geochemical variations in mid-tertiary Ethiopian flood basalt province, Maychew, Tigray region, Ethiopia. Momona Ethiop J Sci. 2010;2(1):4–25.10.4314/mejs.v2i1.49647Search in Google Scholar
[44] Abbate E, Bruni P, Sagri M. Geology of Ethiopia: a review and geomorphological perspectives. Landscapes and landforms of Ethiopia. Dordrecht: Springer; 2015. p. 33–64.10.1007/978-94-017-8026-1_2Search in Google Scholar
[45] Mengesha H, Hiluf H, Meshesha D, Chekol T, Asimow PD. Geochemical characteristics of flood basalts from Adigrat area, northwestern Ethiopian Plateau: Implication for mantle source heterogeneity. Geochem J. 2024;58(3):109–26.10.2343/geochemj.GJ24010Search in Google Scholar
[46] Brousse R, Ildefonse JP. Pyroxene-pyrolite and plagioclase-pyrolite in inclusions, with Norites, in an Alkali Basalt (Causses, France). Bull Volcanol. 1970;34:792–822.10.1007/BF02596802Search in Google Scholar
[47] Le Roex AP, Erlank AJ, Needham HD. Geochemical and mineralogical evidence for the occurrence of at least three distinct magma types in the ‘Famous’ region. Contributions Mineral Petrol. 1981;77(1):24–37.10.1007/BF01161499Search in Google Scholar
[48] Yazdi A, Ashja-Ardalan A, Emami MH, Dabiri R, Foudazi M. Chemistry of minerals and geothermobarometry of volcanic rocks in the region located in Southeast of Bam, Kerman Province. Open J Geol. 2017;7(11):1644–53.10.4236/ojg.2017.711110Search in Google Scholar
[49] Frisch T. Chemical variations among the amphiboles of Shefford Mountain, a Monteregian intrusion in southern Quebec. Can Mineral. 1970;10(3):553–70.Search in Google Scholar
[50] Yaseen IAAB. Petrography, geochemistry and petrogensis of basal flow from Ar-Rabba Area, Central Jordan. Int J Geosci. 2016;7(3):378–96.10.4236/ijg.2016.73030Search in Google Scholar
[51] Renjith ML. Micro-textures in plagioclase from 1994–1995 eruption, Barren Island Volcano: evidence of dynamic magma plumbing system in the Andaman subduction zone. Geosci Front. 2014;5(1);113–26.10.1016/j.gsf.2013.03.006Search in Google Scholar
[52] Kelsey CH. Calculation of the C.I.P.W. norm. Mineral Mag. 1965;34:276–82.10.1180/minmag.1965.034.268.23Search in Google Scholar
[53] Cox K, Bell J, Pankhurst R. The interpretation of igneous rocks. London: Springer; 1979. 10.1007/978-94-017-3373-1.Search in Google Scholar
[54] Winchester JA, Floyd PA. Geochemical discrimination of different magma series and their differentiation products using immobile elements. Chem Geol. 1977;20:325–43.10.1016/0009-2541(77)90057-2Search in Google Scholar
[55] Miyashiro A. Volcanic rock series in island arcs and active continental margins. Am J Sci. 1974;274:321–55. 10.2475/ajs.274.4.321.Search in Google Scholar
[56] Irvine TN, Baragar WRA. A guide to the chemical classification of the common volcanic rocks. Can J Earth Sci. 1971;8:523–48.10.1139/e71-055Search in Google Scholar
[57] Rollinson H. New models for the genesis of plagiogranites in the Oman ophiolite. Lithos. 2009;112(3–4):603–14.10.1016/j.lithos.2009.06.006Search in Google Scholar
[58] Sun S, McDonough WF. Chemical and isotopic systematics of oceanic basalts: implications for mantle composition and processes. Geol Soc Lond Spec Publ. 1989;42:313–45.10.1144/GSL.SP.1989.042.01.19Search in Google Scholar
[59] Tortelli G, Gioncada A, Pagli C, Braschi E, Gebru EF, Keir D. Constraints on the magma source and rift evolution from geochemistry of the Stratoid flood basalts (Afar, Ethiopia). Geochem Geophys Geosyst. 2022;23:e2022GC010434. 10.1029/2022GC010434.Search in Google Scholar
[60] McKenzie DP, Bickle MJ. The volume and composition of melt generated by extension of the lithosphere. J Pet. 1988;29:625–79.10.1093/petrology/29.3.625Search in Google Scholar
[61] Frey F, Green D, Roy S. Integrated models of basalt petrogenesis: a study of quartz tholeiites to olivine melilites from Southeastern Australia utilizing geochemical and experimental petrological data. J Pet. 1978;19:463–513.10.1093/petrology/19.3.463Search in Google Scholar
[62] Putirka KD. Thermometers and barometers for volcanic systems. Rev Mineral Geochem. 2008;69(1):61–120.10.2138/rmg.2008.69.3Search in Google Scholar
[63] Taylor S, McLennan S. The geochemical evolution of the continental crust. Rev Geophys. 1995;33:241–62.10.1029/95RG00262Search in Google Scholar
[64] Nockolds SR, Allen R. Geochemistry of some igneous rock series, II. Geochim Cosmochim Acta. 1954;5:245–85.10.1016/0016-7037(54)90035-6Search in Google Scholar
[65] Barberi F, Ferrar G, Santacroce M, Treuil M, Varet J. A transitional basalt-pantellerite sequence of fractional crystallization: the Boina Center (Afar Rift, Ethiopia). J Pet. 1975;16:22–56.10.1093/petrology/16.1.22Search in Google Scholar
[66] Gallagher K, Hawkesworth CJ. Dehydration melting and the generation of continental flood basalts. Nature. 1992;358:57–9.10.1038/358057a0Search in Google Scholar
[67] Arndt NT, Czamanske GK, Wooden JL, Fedorenko VA. Mantle and crustal contributions to continental flood volcanism. Tectonophysics. 1993;223:39–52.10.1016/0040-1951(93)90156-ESearch in Google Scholar
[68] Rudnick RL, Gao S. Composition of the continental crust. In Treatise on geochemistry. Dordrecht: Springer; Vol. 3. 2003. p. 659.10.1016/B0-08-043751-6/03016-4Search in Google Scholar
[69] Hart W, Woldegabriel G, Walter RC, Mertzman SA. Basaltic volcanism in Ethiopia: constraints on continental rifting and mantle interactions. J Geophys Res. 1989;94:7731–48.10.1029/JB094iB06p07731Search in Google Scholar
[70] DePaolo DJ, Daley EE. Neodymium isotopes in basalts of the southwest basin and range and lithospheric thinning during continental extension. Chem Geol. 2000;169(1–2):157–85.10.1016/S0009-2541(00)00261-8Search in Google Scholar
[71] Wilson M. Igneous petrogenesis. London: Unwin Hyman; 1989.10.1007/978-1-4020-6788-4Search in Google Scholar
[72] Haschke M, Gunther A. Balancing crustal thickening in arcs by tectonic vs magmatic means. Geology. 2003;31:933–6.10.1130/G19945.1Search in Google Scholar
[73] Fitton JG, Saunders AD, Norry MJ, Hardarson BS, Taylor RN. Thermal and chemical structure of the Iceland plume. Earth Planet Sci Lett. 1997;153(3–4):197–208. 10.1016/S0012-821X(97)00170-2.Search in Google Scholar
[74] Baksi AK. Search for a deep-mantle component in mafic lavas using a Nb-Y-Zr plot. Can J Earth Sci. 2001;38(5):813–24. 10.1139/cjes-38-5-813.Search in Google Scholar
[75] Hooper PR, Hawkesworth CJ. Isotopic and geochemical constraints on the origin and evolution of the Columbia River basalt. J Pet. 1993;34:1203–46.10.1093/petrology/34.6.1203Search in Google Scholar
[76] Wang K, Plank T, Walker JD, Smith EI. A mantle melting profile across the Basin and Range, SW USA. J Geophys Res. 2002;107:1–21.10.1029/2001JB000209Search in Google Scholar
[77] Kelemen PB, Johnson KTM, Kinzler RJ, Irving AJ. High-field-strength element depletions in arc basalts due to mantle-magma interaction. Nature. 1990;345(6275):521.10.1038/345521a0Search in Google Scholar
[78] Galer SJG, O’Nions RK. Residence time of thorium, uranium and lead in the mantle with implications for mantle convection. Nature. 1985;316:778–82.10.1038/316778a0Search in Google Scholar
[79] Allegre C, Turcotte D. Implications of a two-component marble-cake mantle. Nature. 1986;323:123–7.10.1038/323123a0Search in Google Scholar
[80] Saunders AD, Norry MJ, Tarney J. Origin of MORB and chemically-depleted mantle reservoirs: trace element constraints. J Pet. 1988;29:415–45.10.1093/petrology/Special_Volume.1.415Search in Google Scholar
[81] Pearce JA. Geochemical fingerprinting of oceanic basalts with applications to ophiolite classification and the search for Archean oceanic crust. Lithos. 2008;100(1–4):14–48.10.1016/j.lithos.2007.06.016Search in Google Scholar
[82] Pearce JA, Norry MJ. Petrogenetic implications of Ti, Zr, Y and Nb variations in volcanic rocks. Contrib Mineral Petrol. 1979;69:33–47.10.1007/BF00375192Search in Google Scholar
[83] Le Roex AP, Dick HJB, Erlank AJ, Reid AM, Frey FA, Hart SR. Geochemistry, mineralogy and petrogenesis of lavas erupted along the south west Indian ridge between the Bouvet triple junction and 11 degrees east. J Pet. 1983;24:267–318.10.1093/petrology/24.3.267Search in Google Scholar
[84] Weaver BL. The origin of ocean island basalt end-member compositions: trace element and isotopic constraints. Earth Planet Sci Lett. 1991;104(2–4):381–97.10.1016/0012-821X(91)90217-6Search in Google Scholar
[85] Getaw A, Ayalew D, Fontijn K, Mengistie T. Petrogenesis and geochemical evolution of Chole basalts, Southeastern Ethiopian Plateau. Int J Earth Sci (Geol Rundsch). 2024;113:1715–36. 10.1007/s00531-024-02463-1.Search in Google Scholar
[86] Pearce JA. Trace element characteristics of lavas from destructive plate boundaries. Orogenic Andesites Relat Rocks. 1982;528–48.Search in Google Scholar
© 2025 the author(s), published by De Gruyter
This work is licensed under the Creative Commons Attribution 4.0 International License.
Articles in the same Issue
- Research Articles
- Seismic response and damage model analysis of rocky slopes with weak interlayers
- Multi-scenario simulation and eco-environmental effect analysis of “Production–Living–Ecological space” based on PLUS model: A case study of Anyang City
- Remote sensing estimation of chlorophyll content in rape leaves in Weibei dryland region of China
- GIS-based frequency ratio and Shannon entropy modeling for landslide susceptibility mapping: A case study in Kundah Taluk, Nilgiris District, India
- Natural gas origin and accumulation of the Changxing–Feixianguan Formation in the Puguang area, China
- Spatial variations of shear-wave velocity anomaly derived from Love wave ambient noise seismic tomography along Lembang Fault (West Java, Indonesia)
- Evaluation of cumulative rainfall and rainfall event–duration threshold based on triggering and non-triggering rainfalls: Northern Thailand case
- Pixel and region-oriented classification of Sentinel-2 imagery to assess LULC dynamics and their climate impact in Nowshera, Pakistan
- The use of radar-optical remote sensing data and geographic information system–analytical hierarchy process–multicriteria decision analysis techniques for revealing groundwater recharge prospective zones in arid-semi arid lands
- Effect of pore throats on the reservoir quality of tight sandstone: A case study of the Yanchang Formation in the Zhidan area, Ordos Basin
- Hydroelectric simulation of the phreatic water response of mining cracked soil based on microbial solidification
- Spatial-temporal evolution of habitat quality in tropical monsoon climate region based on “pattern–process–quality” – a case study of Cambodia
- Early Permian to Middle Triassic Formation petroleum potentials of Sydney Basin, Australia: A geochemical analysis
- Micro-mechanism analysis of Zhongchuan loess liquefaction disaster induced by Jishishan M6.2 earthquake in 2023
- Prediction method of S-wave velocities in tight sandstone reservoirs – a case study of CO2 geological storage area in Ordos Basin
- Ecological restoration in valley area of semiarid region damaged by shallow buried coal seam mining
- Hydrocarbon-generating characteristics of Xujiahe coal-bearing source rocks in the continuous sedimentary environment of the Southwest Sichuan
- Hazard analysis of future surface displacements on active faults based on the recurrence interval of strong earthquakes
- Structural characterization of the Zalm district, West Saudi Arabia, using aeromagnetic data: An approach for gold mineral exploration
- Research on the variation in the Shields curve of silt initiation
- Reuse of agricultural drainage water and wastewater for crop irrigation in southeastern Algeria
- Assessing the effectiveness of utilizing low-cost inertial measurement unit sensors for producing as-built plans
- Analysis of the formation process of a natural fertilizer in the loess area
- Machine learning methods for landslide mapping studies: A comparative study of SVM and RF algorithms in the Oued Aoulai watershed (Morocco)
- Chemical dissolution and the source of salt efflorescence in weathering of sandstone cultural relics
- Molecular simulation of methane adsorption capacity in transitional shale – a case study of Longtan Formation shale in Southern Sichuan Basin, SW China
- Evolution characteristics of extreme maximum temperature events in Central China and adaptation strategies under different future warming scenarios
- Estimating Bowen ratio in local environment based on satellite imagery
- 3D fusion modeling of multi-scale geological structures based on subdivision-NURBS surfaces and stratigraphic sequence formalization
- Comparative analysis of machine learning algorithms in Google Earth Engine for urban land use dynamics in rapidly urbanizing South Asian cities
- Study on the mechanism of plant root influence on soil properties in expansive soil areas
- Simulation of seismic hazard parameters and earthquakes source mechanisms along the Red Sea rift, western Saudi Arabia
- Tectonics vs sedimentation in foredeep basins: A tale from the Oligo-Miocene Monte Falterona Formation (Northern Apennines, Italy)
- Investigation of landslide areas in Tokat-Almus road between Bakımlı-Almus by the PS-InSAR method (Türkiye)
- Predicting coastal variations in non-storm conditions with machine learning
- Cross-dimensional adaptivity research on a 3D earth observation data cube model
- Geochronology and geochemistry of late Paleozoic volcanic rocks in eastern Inner Mongolia and their geological significance
- Spatial and temporal evolution of land use and habitat quality in arid regions – a case of Northwest China
- Ground-penetrating radar imaging of subsurface karst features controlling water leakage across Wadi Namar dam, south Riyadh, Saudi Arabia
- Rayleigh wave dispersion inversion via modified sine cosine algorithm: Application to Hangzhou, China passive surface wave data
- Fractal insights into permeability control by pore structure in tight sandstone reservoirs, Heshui area, Ordos Basin
- Debris flow hazard characteristic and mitigation in Yusitong Gully, Hengduan Mountainous Region
- Research on community characteristics of vegetation restoration in hilly power engineering based on multi temporal remote sensing technology
- Identification of radial drainage networks based on topographic and geometric features
- Trace elements and melt inclusion in zircon within the Qunji porphyry Cu deposit: Application to the metallogenic potential of the reduced magma-hydrothermal system
- Pore, fracture characteristics and diagenetic evolution of medium-maturity marine shales from the Silurian Longmaxi Formation, NE Sichuan Basin, China
- Study of the earthquakes source parameters, site response, and path attenuation using P and S-waves spectral inversion, Aswan region, south Egypt
- Source of contamination and assessment of potential health risks of potentially toxic metal(loid)s in agricultural soil from Al Lith, Saudi Arabia
- Regional spatiotemporal evolution and influencing factors of rural construction areas in the Nanxi River Basin via GIS
- An efficient network for object detection in scale-imbalanced remote sensing images
- Effect of microscopic pore–throat structure heterogeneity on waterflooding seepage characteristics of tight sandstone reservoirs
- Environmental health risk assessment of Zn, Cd, Pb, Fe, and Co in coastal sediments of the southeastern Gulf of Aqaba
- A modified Hoek–Brown model considering softening effects and its applications
- Evaluation of engineering properties of soil for sustainable urban development
- The spatio-temporal characteristics and influencing factors of sustainable development in China’s provincial areas
- Application of a mixed additive and multiplicative random error model to generate DTM products from LiDAR data
- Gold vein mineralogy and oxygen isotopes of Wadi Abu Khusheiba, Jordan
- Prediction of surface deformation time series in closed mines based on LSTM and optimization algorithms
- 2D–3D Geological features collaborative identification of surrounding rock structural planes in hydraulic adit based on OC-AINet
- Spatiotemporal patterns and drivers of Chl-a in Chinese lakes between 1986 and 2023
- Land use classification through fusion of remote sensing images and multi-source data
- Nexus between renewable energy, technological innovation, and carbon dioxide emissions in Saudi Arabia
- Analysis of the spillover effects of green organic transformation on sustainable development in ethnic regions’ agriculture and animal husbandry
- Factors impacting spatial distribution of black and odorous water bodies in Hebei
- Large-scale shaking table tests on the liquefaction and deformation responses of an ultra-deep overburden
- Impacts of climate change and sea-level rise on the coastal geological environment of Quang Nam province, Vietnam
- Reservoir characterization and exploration potential of shale reservoir near denudation area: A case study of Ordovician–Silurian marine shale, China
- Seismic prediction of Permian volcanic rock reservoirs in Southwest Sichuan Basin
- Application of CBERS-04 IRS data to land surface temperature inversion: A case study based on Minqin arid area
- Geological characteristics and prospecting direction of Sanjiaoding gold mine in Saishiteng area
- Research on the deformation prediction model of surrounding rock based on SSA-VMD-GRU
- Geochronology, geochemical characteristics, and tectonic significance of the granites, Menghewula, Southern Great Xing’an range
- Hazard classification of active faults in Yunnan base on probabilistic seismic hazard assessment
- Characteristics analysis of hydrate reservoirs with different geological structures developed by vertical well depressurization
- Estimating the travel distance of channelized rock avalanches using genetic programming method
- Landscape preferences of hikers in Three Parallel Rivers Region and its adjacent regions by content analysis of user-generated photography
- New age constraints of the LGM onset in the Bohemian Forest – Central Europe
- Characteristics of geological evolution based on the multifractal singularity theory: A case study of Heyu granite and Mesozoic tectonics
- Soil water content and longitudinal microbiota distribution in disturbed areas of tower foundations of power transmission and transformation projects
- Oil accumulation process of the Kongdian reservoir in the deep subsag zone of the Cangdong Sag, Bohai Bay Basin, China
- Investigation of velocity profile in rock–ice avalanche by particle image velocimetry measurement
- Optimizing 3D seismic survey geometries using ray tracing and illumination modeling: A case study from Penobscot field
- Sedimentology of the Phra That and Pha Daeng Formations: A preliminary evaluation of geological CO2 storage potential in the Lampang Basin, Thailand
- Improved classification algorithm for hyperspectral remote sensing images based on the hybrid spectral network model
- Map analysis of soil erodibility rates and gully erosion sites in Anambra State, South Eastern Nigeria
- Identification and driving mechanism of land use conflict in China’s South-North transition zone: A case study of Huaihe River Basin
- Evaluation of the impact of land-use change on earthquake risk distribution in different periods: An empirical analysis from Sichuan Province
- A test site case study on the long-term behavior of geotextile tubes
- An experimental investigation into carbon dioxide flooding and rock dissolution in low-permeability reservoirs of the South China Sea
- Detection and semi-quantitative analysis of naphthenic acids in coal and gangue from mining areas in China
- Comparative effects of olivine and sand on KOH-treated clayey soil
- YOLO-MC: An algorithm for early forest fire recognition based on drone image
- Earthquake building damage classification based on full suite of Sentinel-1 features
- Potential landslide detection and influencing factors analysis in the upper Yellow River based on SBAS-InSAR technology
- Assessing green area changes in Najran City, Saudi Arabia (2013–2022) using hybrid deep learning techniques
- An advanced approach integrating methods to estimate hydraulic conductivity of different soil types supported by a machine learning model
- Hybrid methods for land use and land cover classification using remote sensing and combined spectral feature extraction: A case study of Najran City, KSA
- Streamlining digital elevation model construction from historical aerial photographs: The impact of reference elevation data on spatial accuracy
- Analysis of urban expansion patterns in the Yangtze River Delta based on the fusion impervious surfaces dataset
- A metaverse-based visual analysis approach for 3D reservoir models
- Late Quaternary record of 100 ka depositional cycles on the Larache shelf (NW Morocco)
- Integrated well-seismic analysis of sedimentary facies distribution: A case study from the Mesoproterozoic, Ordos Basin, China
- Study on the spatial equilibrium of cultural and tourism resources in Macao, China
- Urban road surface condition detecting and integrating based on the mobile sensing framework with multi-modal sensors
- Application of improved sine cosine algorithm with chaotic mapping and novel updating methods for joint inversion of resistivity and surface wave data
- The synergistic use of AHP and GIS to assess factors driving forest fire potential in a peat swamp forest in Thailand
- Dynamic response analysis and comprehensive evaluation of cement-improved aeolian sand roadbed
- Rock control on evolution of Khorat Cuesta, Khorat UNESCO Geopark, Northeastern Thailand
- Gradient response mechanism of carbon storage: Spatiotemporal analysis of economic-ecological dimensions based on hybrid machine learning
- Comparison of several seismic active earth pressure calculation methods for retaining structures
- Mantle dynamics and petrogenesis of Gomer basalts in the Northwestern Ethiopia: A geochemical perspective
- Study on ground deformation monitoring in Xiong’an New Area from 2021 to 2023 based on DS-InSAR
- Paleoenvironmental characteristics of continental shale and its significance to organic matter enrichment: Taking the fifth member of Xujiahe Formation in Tianfu area of Sichuan Basin as an example
- Equipping the integral approach with generalized least squares to reconstruct relict channel profile and its usage in the Shanxi Rift, northern China
- InSAR-driven landslide hazard assessment along highways in hilly regions: A case-based validation approach
- Attribution analysis of multi-temporal scale surface streamflow changes in the Ganjiang River based on a multi-temporal Budyko framework
- Review Articles
- Humic substances influence on the distribution of dissolved iron in seawater: A review of electrochemical methods and other techniques
- Applications of physics-informed neural networks in geosciences: From basic seismology to comprehensive environmental studies
- Ore-controlling structures of granite-related uranium deposits in South China: A review
- Shallow geological structure features in Balikpapan Bay East Kalimantan Province – Indonesia
- A review on the tectonic affinity of microcontinents and evolution of the Proto-Tethys Ocean in Northeastern Tibet
- Special Issue: Natural Resources and Environmental Risks: Towards a Sustainable Future - Part II
- Depopulation in the Visok micro-region: Toward demographic and economic revitalization
- Special Issue: Geospatial and Environmental Dynamics - Part II
- Advancing urban sustainability: Applying GIS technologies to assess SDG indicators – a case study of Podgorica (Montenegro)
- Spatiotemporal and trend analysis of common cancers in men in Central Serbia (1999–2021)
- Minerals for the green agenda, implications, stalemates, and alternatives
- Spatiotemporal water quality analysis of Vrana Lake, Croatia
- Functional transformation of settlements in coal exploitation zones: A case study of the municipality of Stanari in Republic of Srpska (Bosnia and Herzegovina)
- Hypertension in AP Vojvodina (Northern Serbia): A spatio-temporal analysis of patients at the Institute for Cardiovascular Diseases of Vojvodina
- Regional patterns in cause-specific mortality in Montenegro, 1991–2019
- Spatio-temporal analysis of flood events using GIS and remote sensing-based approach in the Ukrina River Basin, Bosnia and Herzegovina
- Flash flood susceptibility mapping using LiDAR-Derived DEM and machine learning algorithms: Ljuboviđa case study, Serbia
- Geocultural heritage as a basis for geotourism development: Banjska Monastery, Zvečan (Serbia)
- Assessment of groundwater potential zones using GIS and AHP techniques – A case study of the zone of influence of Kolubara Mining Basin
- Impact of the agri-geographical transformation of rural settlements on the geospatial dynamics of soil erosion intensity in municipalities of Central Serbia
- Where faith meets geomorphology: The cultural and religious significance of geodiversity explored through geospatial technologies
- Applications of local climate zone classification in European cities: A review of in situ and mobile monitoring methods in urban climate studies
- Complex multivariate water quality impact assessment on Krivaja River
- Ionization hotspots near waterfalls in Eastern Serbia’s Stara Planina Mountain
- Shift in landscape use strategies during the transition from the Bronze age to Iron age in Northwest Serbia
- Assessing the geotourism potential of glacial lakes in Plav, Montenegro: A multi-criteria assessment by using the M-GAM model
- Flash flood potential index at national scale: Susceptibility assessment within catchments