A novel travel route planning method based on an ant colony optimization algorithm
-
Shan He


Abstract
As people’s living standards improve, tourism has become an important way for people to spend their time on leisure and entertainment. The growing number of tourists in recent years has given rise to the creation of tourism-related ancillary services. Travelers need to choose a travel route that suits their needs and expectations and do it in a way that does not cause a waste of time, whether it is an emerging self-driving tour or a traditional tour group. Therefore, the optimization of tourist routes is of great significance to the majority of tourists. Given the planning requirements of tourist attractions in the post-epidemic era, an ant colony-based optimization algorithm is proposed to resolve the planning problem of optimal tourist routes. An optimized pheromone update strategy is also proposed based on the basic ant colony optimization algorithm. The optimized ant colony algorithm tries to balance two conflicting concepts, namely, flows into tourist attractions and the carrying capacity of destinations. To analyze the performance of the proposed optimization algorithm, the effects of different optimization algorithms on the route planning of tourist attractions were compared in the experiment, and the acceleration ratio of the optimized ant colony algorithm was tested using the graphics processing unit parallel computing program. The results show that the proposed algorithm provides certain advantages and has certain potential in parallel computing. To sum up, this study provides a better scientific basis for optimal tourist route planning and has a good reference value.
1 Introduction
Traveling has always been one of the most popular forms for human beings to spend their leisure time. Tourism can not only bring happiness to individuals and families but also stimulate regional economic development and promote cultural publicity. Nowadays, with the rapid development of the economy, the comprehensive development of domestic infrastructure construction, and the comprehensive coverage of transportation, the tourism industry has ushered in a period of great development.
In China, people usually plan to travel on holidays, which results in a very hectic time of year for travel. In addition, because China’s population base is very large, the density of people at tourist attractions is very high. This situation leads to a phenomenon of few tourist activities during off-seasons but high demand during the holidays. Moreover, it has led tourism destinations to suffer from shrunk economic activities, so the economy of the tourist areas has been slowing down and poor personal experiences are observed.
The tourism industry, as one of the most sensitive service industries has been long hit globally and especially in China due to the Covid-19 pandemic. Besides, its healing stage is at a slow pace. Based on the impact of the epidemic, coupled with the inherent problems of China’s tourism industry, China’s domestic tourism industry has been greatly affected. However, with the full inoculation of vaccines and the gradual introduction of various supporting policies, we believe that the tourism industry could gradually recover. The tourism industry needs to supply corresponding preparations for the normalized management and control of the epidemic. This includes the application of innovative methods to conduct more scientific management operations of scenic spots. For example, tourism can be optimized and upgraded with the help of mathematical models in future tourism travel planning.
Tourist itinerary planning is a research hotspot in the field of tourism recommendation. Tourist itinerary planning refers to the design of travel itineraries for tourists who are interested in visiting multiple scenic spots. This design considers not only the time constraint and low cost but also the preferences of tourists. The goal is to maximize passengers’ satisfaction. At present, tourist route planning is essentially a traveling salesman problem or a vehicle routing problem in another aspect [1], which is a non-deterministic polynomial problem.
The orientation of the problem is a simplified model in tourist route planning. It refers to visiting multiple locations with associated profits/benefits for a limited time, and each location can only be accessed once. The purpose is to make the recommended itinerary with the greatest total profit/benefit. A variety of approaches have been developed according to different constraints. For example, the directional motion problem with the time window, considering the opening time of scenic spots as a constraint condition [2,3], makes the planned route more realistic. Most of the existing orienteering problem research is adapted to popular tourist attractions and only considers a single attribute, such as the largest score, the smallest distance, the smallest cost, and other features, as the interests of the scenic spots to construct the objective function. Just considering one attribute at a time is not a realistic method for practical purposes.
At present, the solution methods of tourist route planning mainly include exact algorithms, heuristic algorithms, or intelligent meta-heuristic algorithms. Among them, although the exact algorithm can obtain accurate solutions, its searchability is poor, and it can only be applied to small-scale planning [4,5]. The heuristic algorithm could attain a feasible solution in a short time, but the quality of the solution is not acceptable. The intelligent meta-heuristic algorithm has become the mainstream algorithm to resolve the current problem. Meta-heuristic algorithms include the genetic algorithm (GA) [6,7,8], the particle swarm algorithm [9,10,11], the ant colony algorithm [12,13,14], and the simulated annealing algorithm [15,16,17]. The simulated annealing algorithm is a heuristic optimization algorithm derived from the principle of solid annealing, which could obtain global optimization results with a higher probability and is widely used in optimization settings, traveling salesman problems, and so on. GA originates from the idea of natural evolution proposed by Darwin and follows the natural law of competition and the survival law of best fitting. Because of its fast search speed, strong randomness, simple process, and strong flexibility, it is widely used in various fields, such as combinatorial optimization and production scheduling. However, the GA has inherent drawbacks. The population will cause premature convergence problems due to the reduction of diversity in the evolution process, and it also suffers a problem known as the local optimal problem [18]. It adopts a distributed positive feedback parallel computing mechanism, which can be combined with other algorithms to derive more refined outcomes [19,20,21]. More up-to-date research related to any colony algorithm can be found in refs [22,23,24].
This article mainly studies the problem of tourist route planning and proposes an improved ant colony algorithm in tourist route planning for practical problems. The proposed method increases computational performance by using graphics processing unit (GPU) operation. The experimental findings show that the proposed ant colony optimization method is fast and could minimize congestion issues in scenic areas when compared to the basic ant colony algorithm and other algorithms.
The rest of the article is outlined as follows: Section 2 presents the literature review; Section 3 presents the fundamental blocks of the improved ant colony algorithm; Section 4 is allocated to experimentation and results; and Section 5 concludes the conducted research.
2 Literature
2.1 Optimization of tourist routes
The design of tourist routes in tourist attractions is the operation of tourism agencies that target visitors and use traffic routes to make connections between tourists and a series of scenic spots using the distribution characteristics in a certain area. It relies on the resources, facilities, and service quality of tourism regions. Tourist routes can be divided into two types according to the length of the distance between the source of tourists and the distributed tourist attractions. The first one is the route from the source of tourists to the edge of the distributed tourist attractions. The second is to distribute the routes connecting the scenic spots and the scenic spots in the area of the tourist attractions. Route optimizations of distributed tourist attractions refer to the process of integrating the distributed tourist attractions resources on these two routes and making reasonable adjustments to the routes to maximize the social and economic benefits of tourism organizations or regions.
China is rich in tourism resources and has many high-quality tourism resources. However, at present, most of the route design of domestic tourist attractions suffers from a simple and mechanical arrangement and combines many attractions in a certain area. This approach lacks an analysis of the potential market. Many route designs are difficult to explore because of the tourism characteristics and economic development strategies of the region. Such a line gives tourists an intuitive feeling that the theme is not prominent. This makes it impossible for travelers to feel the different experiences brought by different routes. Besides, the lasting attraction to tourists and the word-of-mouth publicity of the scenic spot itself are not mentioned. Tourism organizations consider their long- and short-term interests more in the design process of the route, which makes it difficult to balance the common interests of the participating organizations related to the scenic spot. Route optimizations of tourist attractions for the scenic spot management agency can also correct and resolve various problems caused by blind implementations in the early stages of the development of tourist attractions routes. A balance of common interests between tourism participants and management agencies needs to be found through route optimization. Thus, tourism development and management agencies can truly stand at the height of “big tourism” and regional economic development and design routes with an overall and long-term perspective.
The study of tourist routes in tourist attractions has always been the focus of academic research, and it is also a common concern of tourism enterprises, individuals, and institutions. For tourist attractions, the planning, design, development, and implementation level of tourist routes will directly affect the development of tourism resources in the region and will also have a certain impact on the regional comprehensive economic development. At present, the research on tourist routes mainly focuses on two aspects. On the one hand, from the perspective of travel agencies, it analyzes how to improve their core competitiveness and route advantages through the design of tourist routes. The independent management rights and intellectual property rights of tourism route design are explored, as well as the rational distribution of tourism market resources. On the other hand, from the perspective of tourism-driven regional economic development, the balanced development of scenic spots in the region is achieved through the study of tourism route design.
2.2 Route optimization of tourist attractions for the post-epidemic era
The above concepts are aimed at general travel route planning, focusing on content-oriented route planning. After the outbreak of the new crown epidemic in 2020, domestic tourism was completely blocked, showing a cliff-like decline. Residents have terminated their travel plans, major scenic spots have been closed, and large-scale cultural and recreational activities have been canceled due to the new epidemic. The prevention and control measures of the cultural and tourism systems are very timely. At the beginning of 2020, various scenic spots and venues have been suspended one after another. The cultural and tourism management section requires national travel agencies and online tourism companies to suspend the operation of group tours and “air ticket + hotel” tourism products. In terms of inbound tourism, this business has come to a standstill, which is the most far-reaching sector. In early 2020, several foreign airlines suspended flights to and from China. At the same time, the World Health Organization declared the new outbreak a public health emergency of international concern. As a result, inbound tourism in the form of groups has almost stopped, and inbound tourism in the form of individual tourists has been greatly affected.
With the development of the epidemic, the tourism industry is expected to recover in a period after the nationwide vaccination. In response to the needs of the post-epidemic era and the need for route planning after the normalization of epidemic control, the number of people in the scenic area must be considered an important factor. At the same time, as mentioned above, the number of people in the scenic spot is too large, and the sense of experience during the travel process is significantly reduced. Taking advantage of the quantifiable characteristics of scenic spots, various optimization algorithms are applied to design travel routes and control the number of people in each scenic spot. Therefore, tourism route planning for the post-epidemic era can focus on the control and planning of the flow of visitors in scenic spots. This is helpful for epidemic control and experience improvement. To achieve the goal of both normalization of tourism and epidemic prevention and control, it is necessary to consider the number of travelers at multiple attractions at the same time. In other words, it is best not to have a very dense number of travelers in a single scenic spot, and it is best to have a relatively balanced number of visitors in each scenic spot. The control of the number of personnel can be achieved through prior route planning. For example, the tickets issued by the scenic spots stipulate the time and route, or the tour group moves in time and space according to the time and route recommended by the system.
3 The improved ant colony algorithm
3.1 Traditional ant colony algorithm
Figure 1 depicts the path optimization principle of an ant colony algorithm. The ant colony algorithm tries to find the shortest path between an ant nest and a food source, which is commonly recognized through message exchange. The ant colony algorithm has the advantage of using a distributed computation that allows multiple individuals to perform parallel computing at the same time, greatly improving the algorithm’s computing power and operating efficiency.
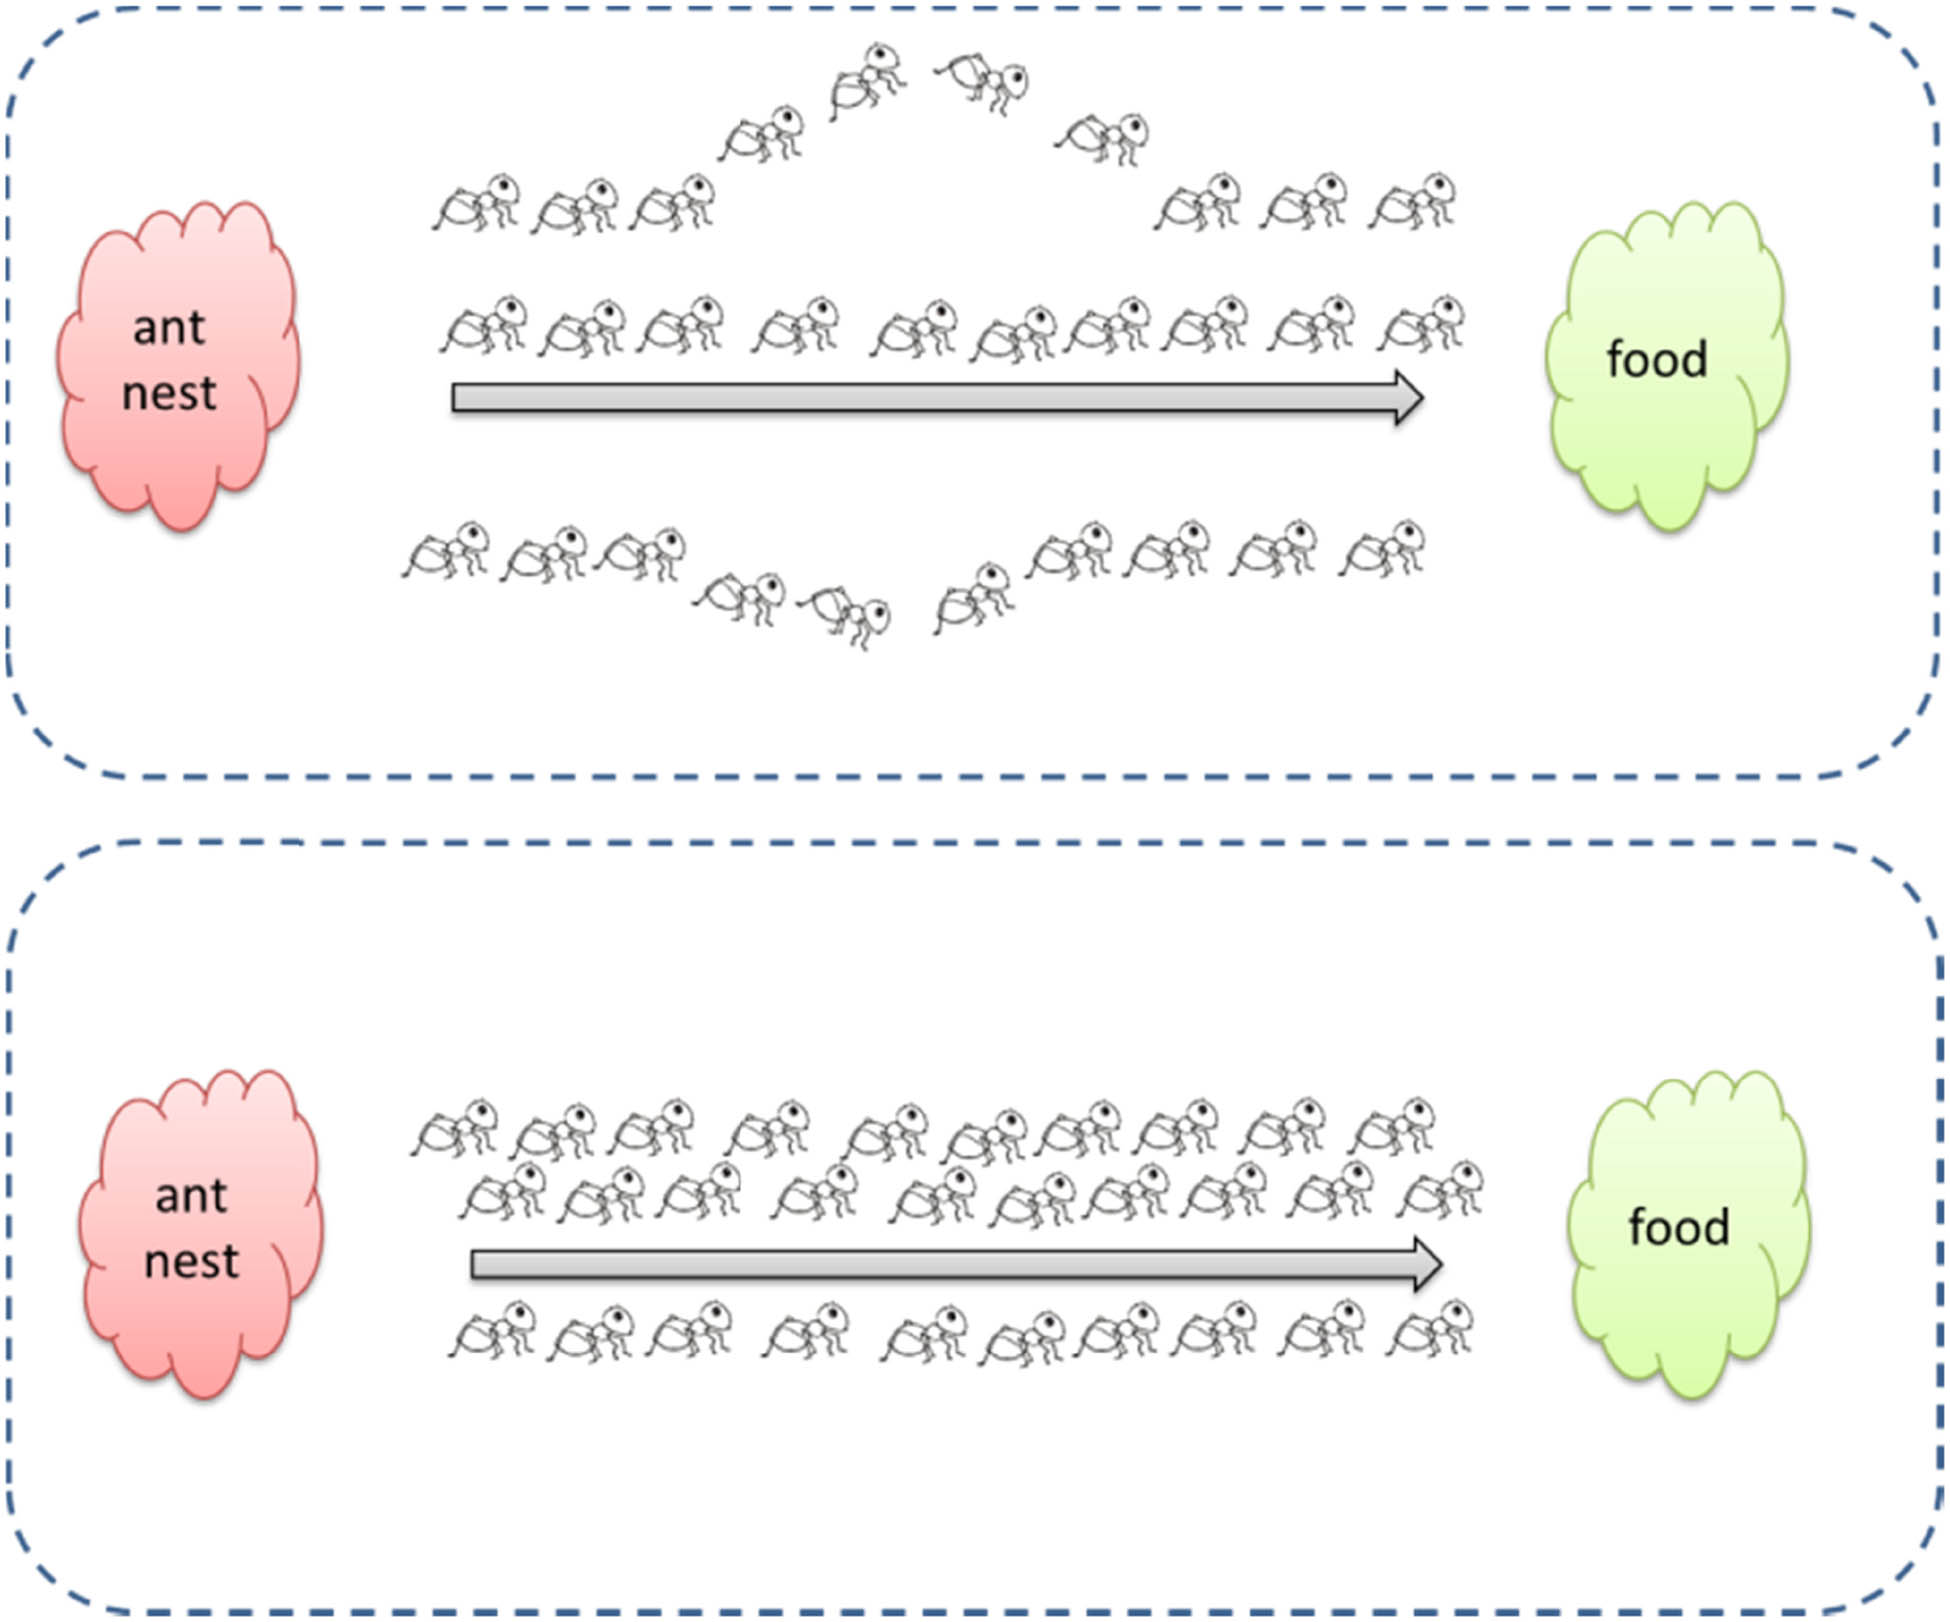
Ant colony path optimization principle.
Assuming that there are K ants in the ant colony. The ant colony is required to pass through S scenic spots, and L xy (x, y = 1, 2, …, n) is used to represent the distance between the scenic spots x and y. It is stipulated that at time t, the size of the amount of pheromone on the path between the scenic spots x and y is represented by P xy (t). The state transition probability T i xy is the key factor for the ant i (i = 1, 2, …, K) to move from the scenic spots x to y. It is affected by many factors. Equation (1) presents its calculation as follows:
where G i (i = 1, 2,…, K) represents the set of sights that ant i has experienced. E xy represents the expected value of ants moving from spots x to y, which is a heuristic function, E xy = 1/L xy . wP represents the importance of pheromones along the path between attractions. The larger the value, the greater the influence of the pheromone. wL represents the importance of the heuristic function of the distance between sights. The larger its value, the greater its impact. Tabu is the set of allowed paths.
To describe the volatilization state of the pheromone when ants pass through scenic spots, the path information is adjusted by the volatilization factor v. When all ants complete a visit to the scenic spot, the value of the pheromone between all scenic spots is updated. Equation (2) is used to update.
where the term (1 − v) represents the remaining adjustment degree value of the pheromone in equation (2).
where
3.2 The update strategy of the optimized pheromone
The ants choose the path through the concentration of pheromone in the standard algorithm, and the shortest path is chosen as the optimal solution. However, when planning routes to scenic spots, it is not enough to consider only the shortest distance. Yet, it is also necessary to consider the scenic spots’ carrying capacity. The basic ant colony algorithm’s pheromone mechanism causes the path-finding process to fall into the local optimum rather than the global optimum. When the entire path is determined, no new path exploration is performed, and local convergence would be easy to achieve. A pheromone update strategy is used in the article to save the algorithm from falling into a local convergence state.
The amount of pheromone on each path is the same when the ant colony algorithm is initialized. Ants choose paths with equal state transition probability in the first stage of the algorithm. After accounting for congestion, if the pheromone value of each path is the same, the ants’ efficiency in finding the optimal path will decrease and the time to find the optimal solution will increase. As a result, the pheromone update strategy must be optimized. The traffic information on each route changes all the time. As shown in Figure 2, there may be visitors on the optimal path, and other paths may become sparse.
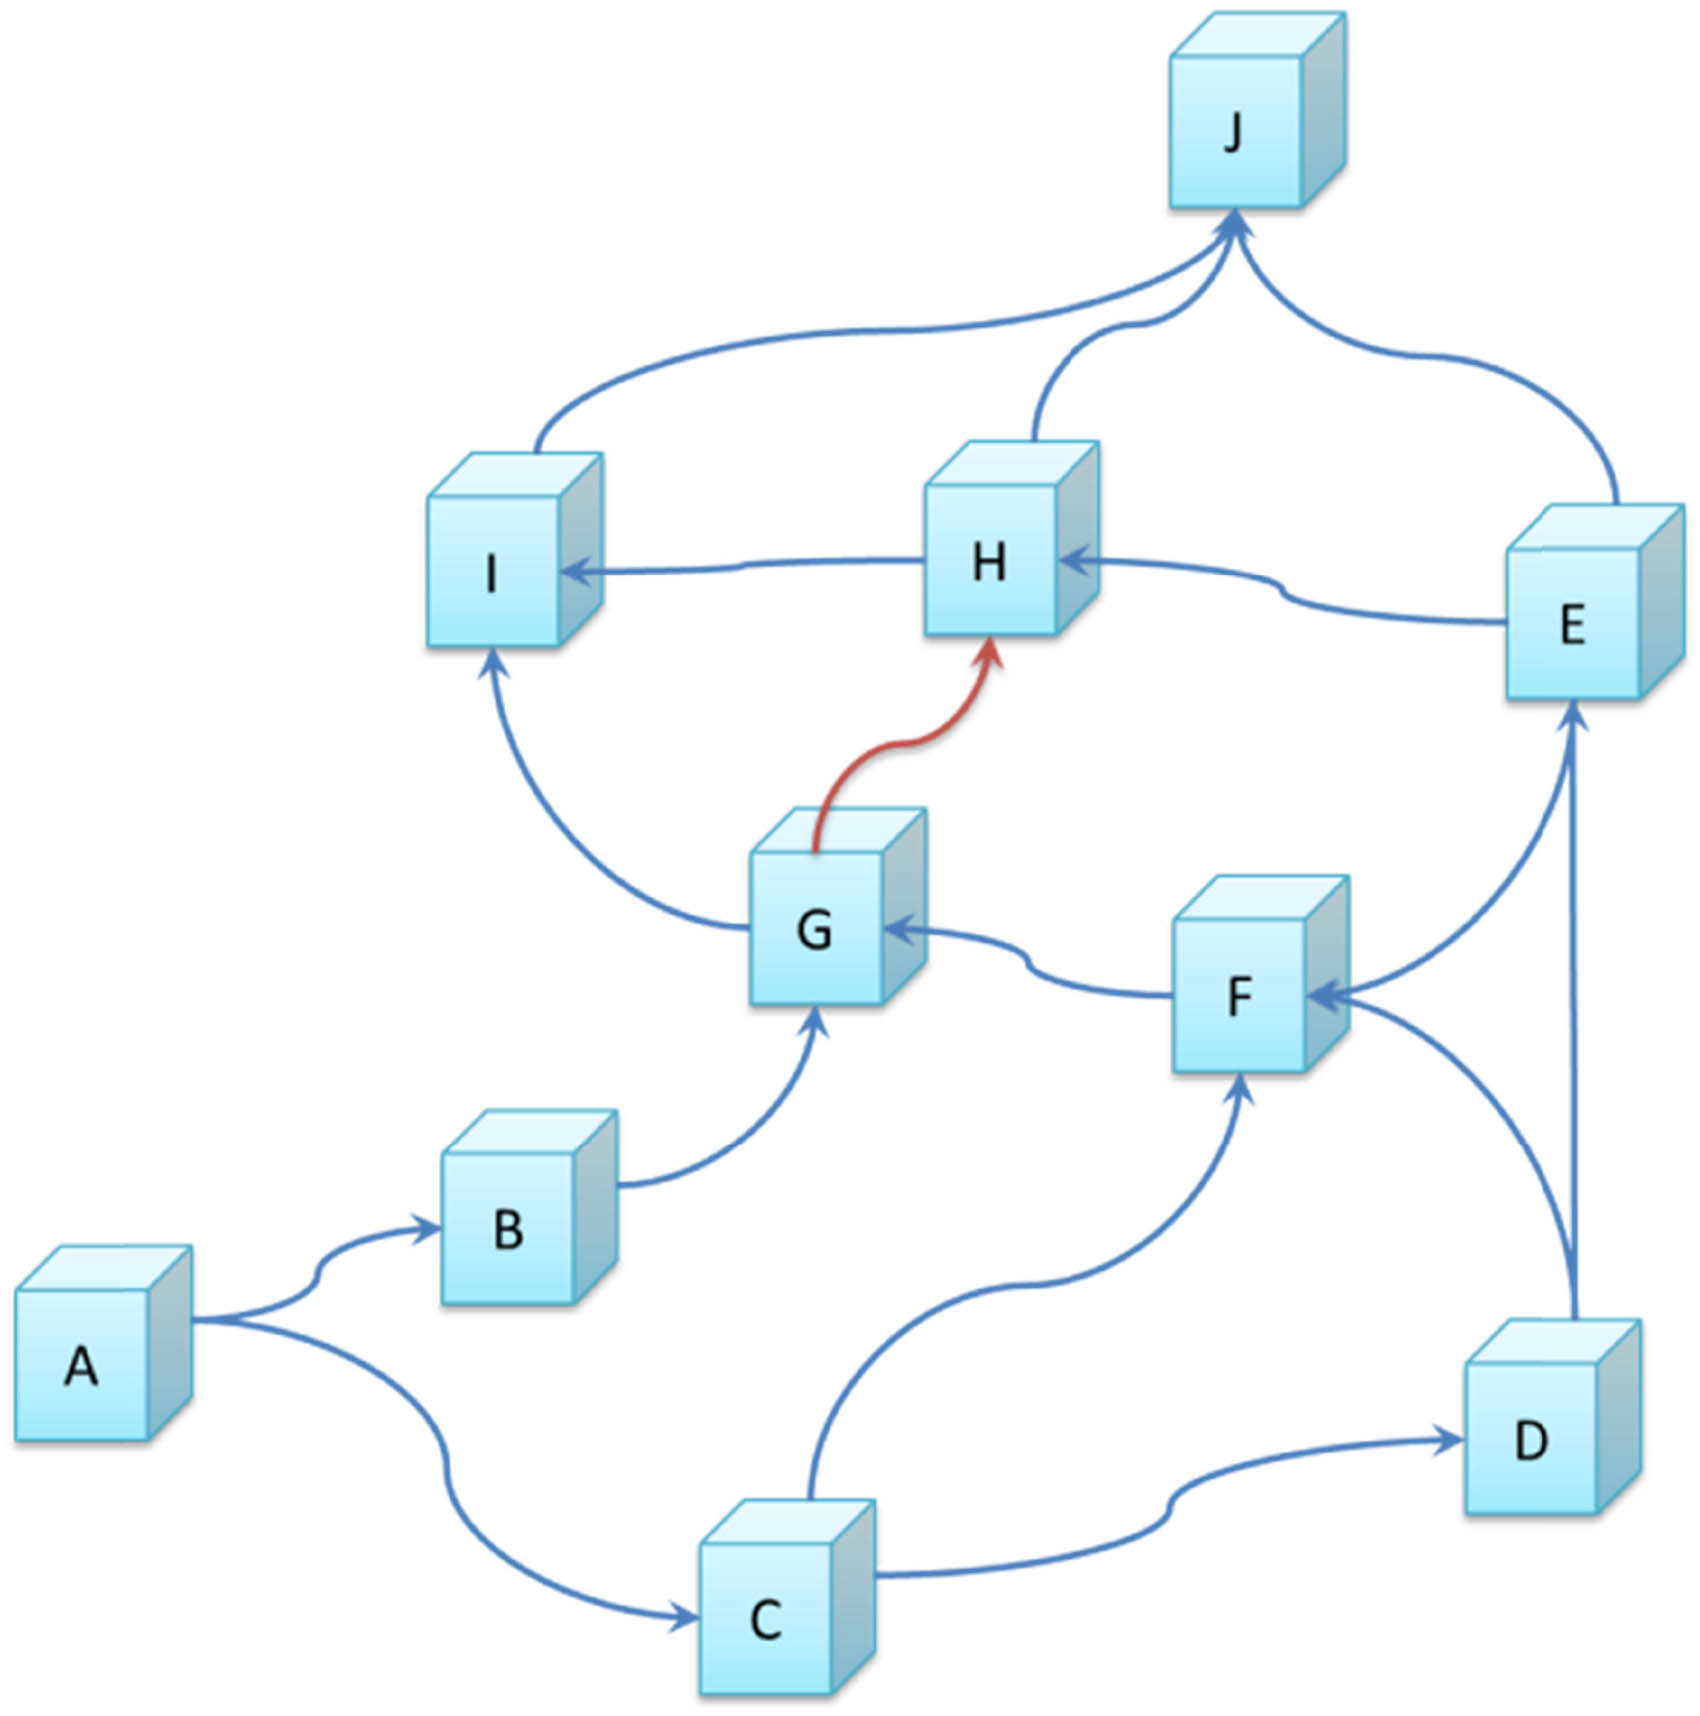
The dynamic adjustment of an ant colony path.
In Figure 2, the red line segment represents the road segment with high traffic flow. The optimal path from scenic spots A to J is A, B, G, H, and J. Among them, the GH section suddenly became congested. If the original optimal path is no longer the optimal choice, then the pheromone strategy is updated. The path with smooth traffic is reselected, and the optimized path becomes A, B, G, I, and J.
According to the above analysis, the key step is to set the pheromone intensity on each path so that the pheromone intensity on the path between each of the two scenic spots stays within a stable range. At the same time, the pheromone intensity is concentrated as much as possible on the optimal path, allowing it to eventually find the global optimal solution. When there is no congestion, the specific content of the pheromone update strategy is organized as follows: ants have completed a visit, and the length of an ant’s visit path X at random is chosen as the standard. The length of the visiting path Y of other ants is compared with the length of the path, and the pheromone of X and the pheromone concentration on the path is shorter than this path, the pheromones are updated to ensure that the final optimal solution is the global optimal solution.
3.3 The process of solving the optimal tourism route
The optimal route could be found after optimizing the update strategy of the pheromone. The following are the specific implementation steps: (1) The initialization process: the value of the pheromone is set to 1. During the iteration, the heuristic information remains unchanged. (2) Create the solution: ant i would depart from a location chosen at random. It begins with the sights and works its way through them all. Assuming that i have not visited all of the scenic spots, the journey begins at ant’s current location and proceeds to the next scenic spot at random. When there are still unvisited attractions, a random number between 0 and 1 is generated at random. If the random number is smaller than the control parameter, the scenic spot with the greatest feasibility is selected as the next scenic spot to visit among the scenic spots that have never been visited. Otherwise, the next attraction is chosen by roulette to visit. After the ants have traversed all the scenic spots, they return to the sequence of traversing the scenic spots. The specific steps of ants traversing scenic spots are shown in Figure 3.
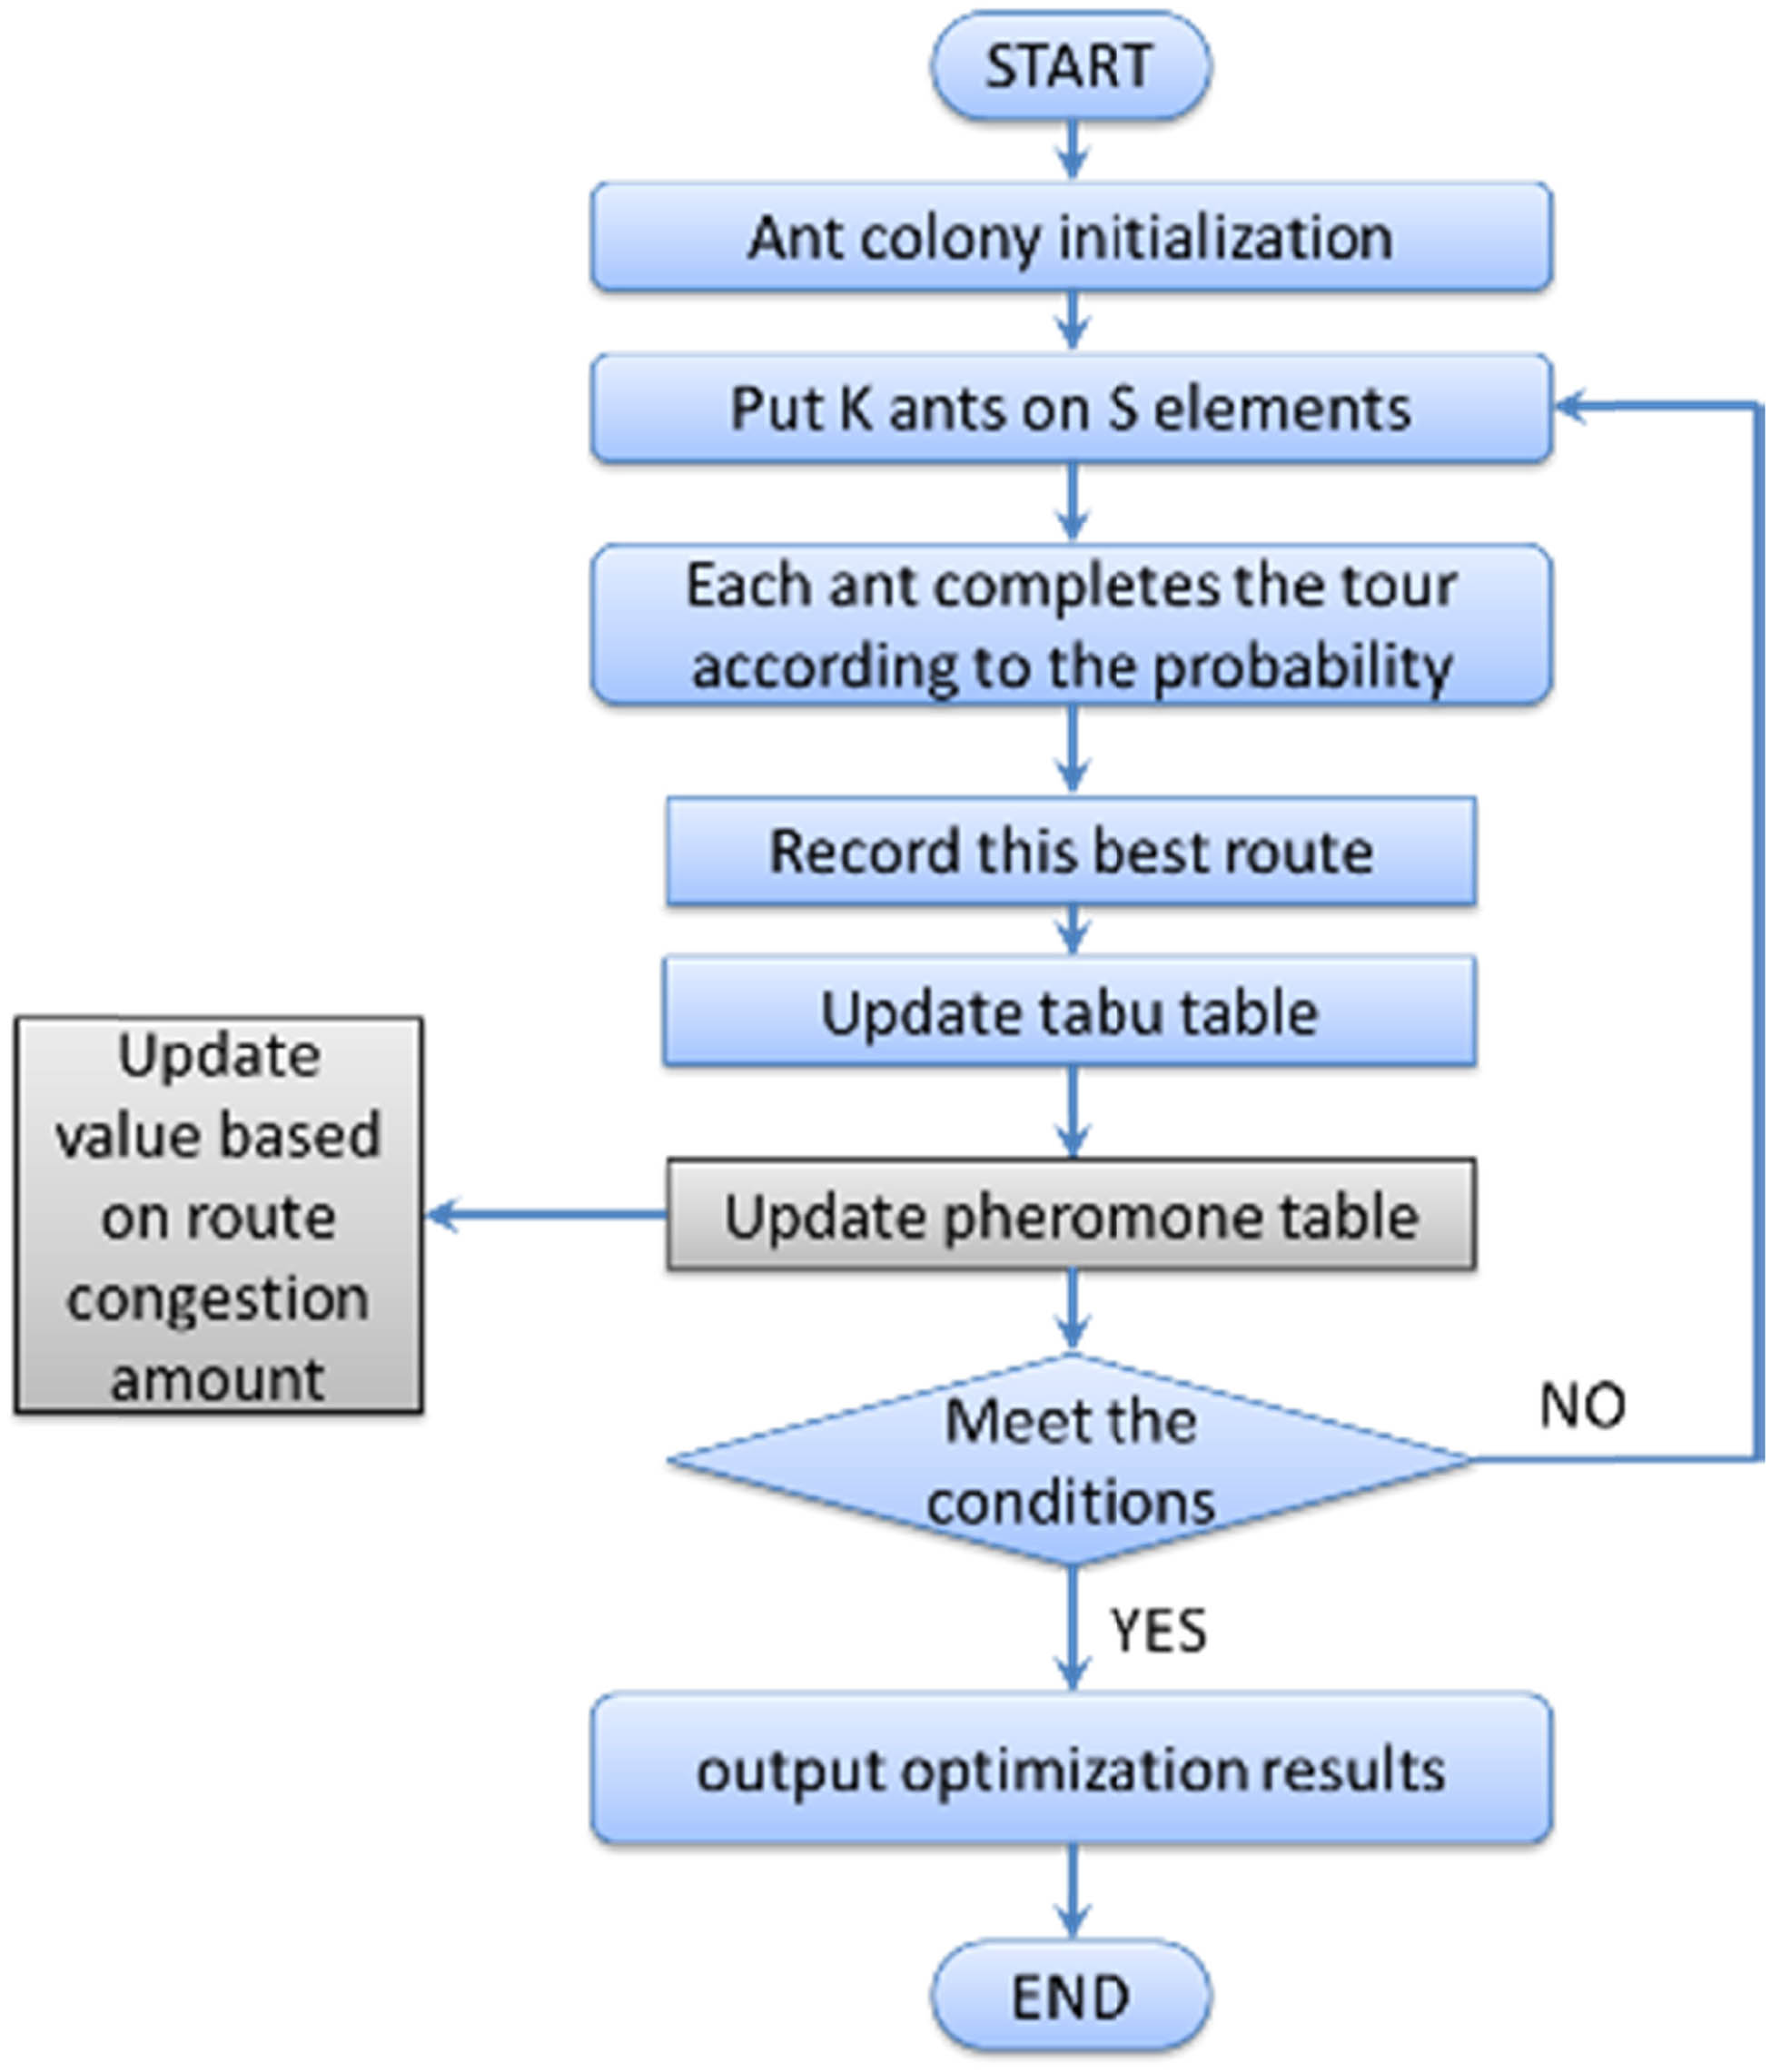
The proposed ant colony algorithm.
The roulette random number approach is employed in the process of traveling to the picturesque sites. Each ant’s selection probability is used to determine the cumulative probability. To determine the next attraction to be chosen, the generated random number is compared to the cumulative likelihood. Iteration continues until the shortest line is discovered, then output is presented. Thus, the design of the ant colony optimization algorithm-based travel route planning method has been fully presented.
3.4 Parallel computing method
This work uses GPU computing technology to deal with real-time computing scenarios due to the enormous number of visitors coming to tourist attractions in real scenarios. One of the properties of the ant colony algorithm is parallel distributed computing. Compute Unified Device Architecture (CUDA) features the architectural characteristics of parallel computing. The study found that combining the ant colony algorithm with CUDA can result in high-performance computing. The optimal path planning problem based on the ant colony algorithm is transformed into the multi-thread parallel processes of the GPU by combining the GPU and CUDA, using the characteristics of high-speed floating-point operation and parallel computing of the central processing unit (CPU). According to the programming model of CUDA, the individual ants are simulated by threads, and the individual ants are projected onto the threads of CUDA.
Let s be the number of picturesque sites and K be the number of ants. K is the total number of threads in the GPU parallel path planning model. As illustrated in Figure 4, these threads are grouped into four CUDA blocks, with K/4 being the number of threads in each block. Initialization, transition probability calculation, distance computation, and pheromone update are all done sequentially in the model. These four modules are defined as CUDA functions and are multithreaded on the GPU. The following are the specific implementation steps: To determine the next transfer scenic place, first assign K threads to four blocks and calculate their corresponding scenic spot transition probabilities at the same time. Second, the s threads are divided into s blocks, and the pheromone increments on the s paths are calculated. Third, use a thread to calculate the distance and get the optimal travel path. Finally, the s threads are divided into s blocks again, and the pheromone on the path is updated.
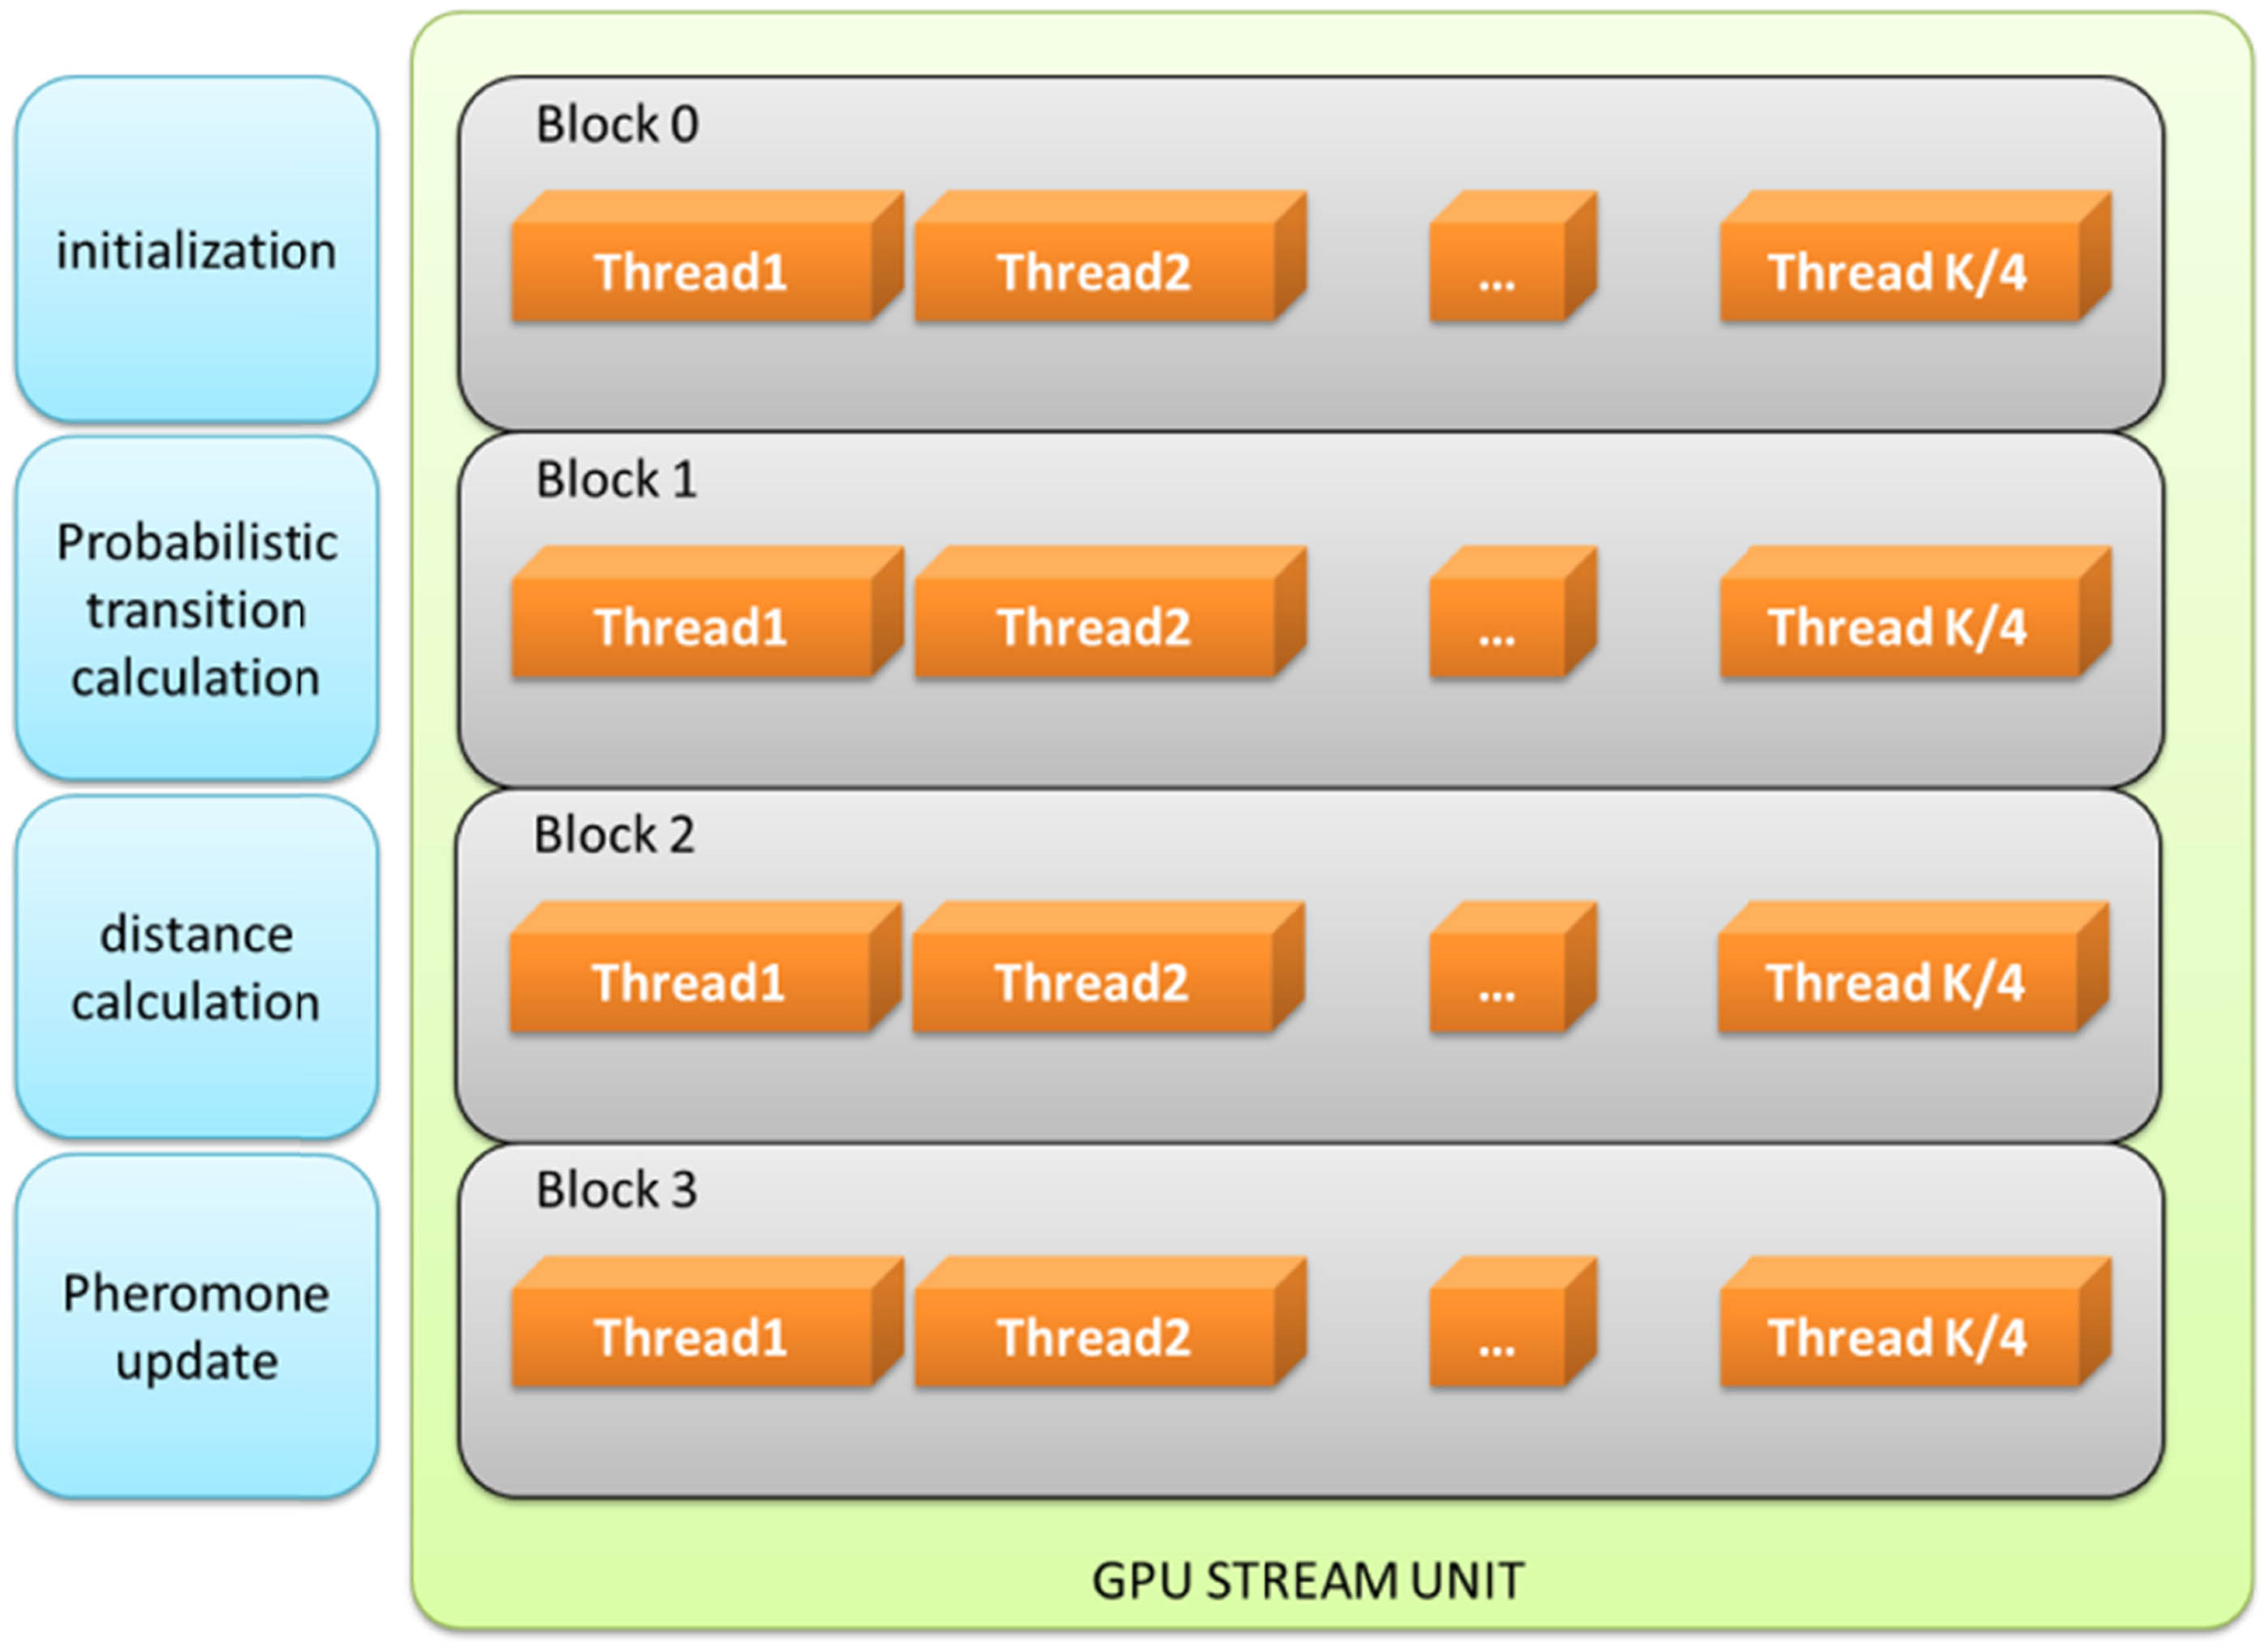
A schematic diagram of the GPU computing framework.
4 Experiments
4.1 Experimental setup
In the experimental environment, the simulation is carried out through the MATLAB platform. The important parameter settings in the algorithm are shown in Table 1.
Definitions of ant colony algorithm parameters
| Parameters | Definitions |
|---|---|
| w P | The importance of pheromone on the path between attractions |
| w L | The importance of the heuristic function representing the distance between attractions |
| K | The total number of ants in the colony |
| v | Pheromone volatile factor |
Under the above experimental environment, the ranking of tourist attractions in this area is A–J, respectively. The location distribution of scenic spots is shown in Figure 5.
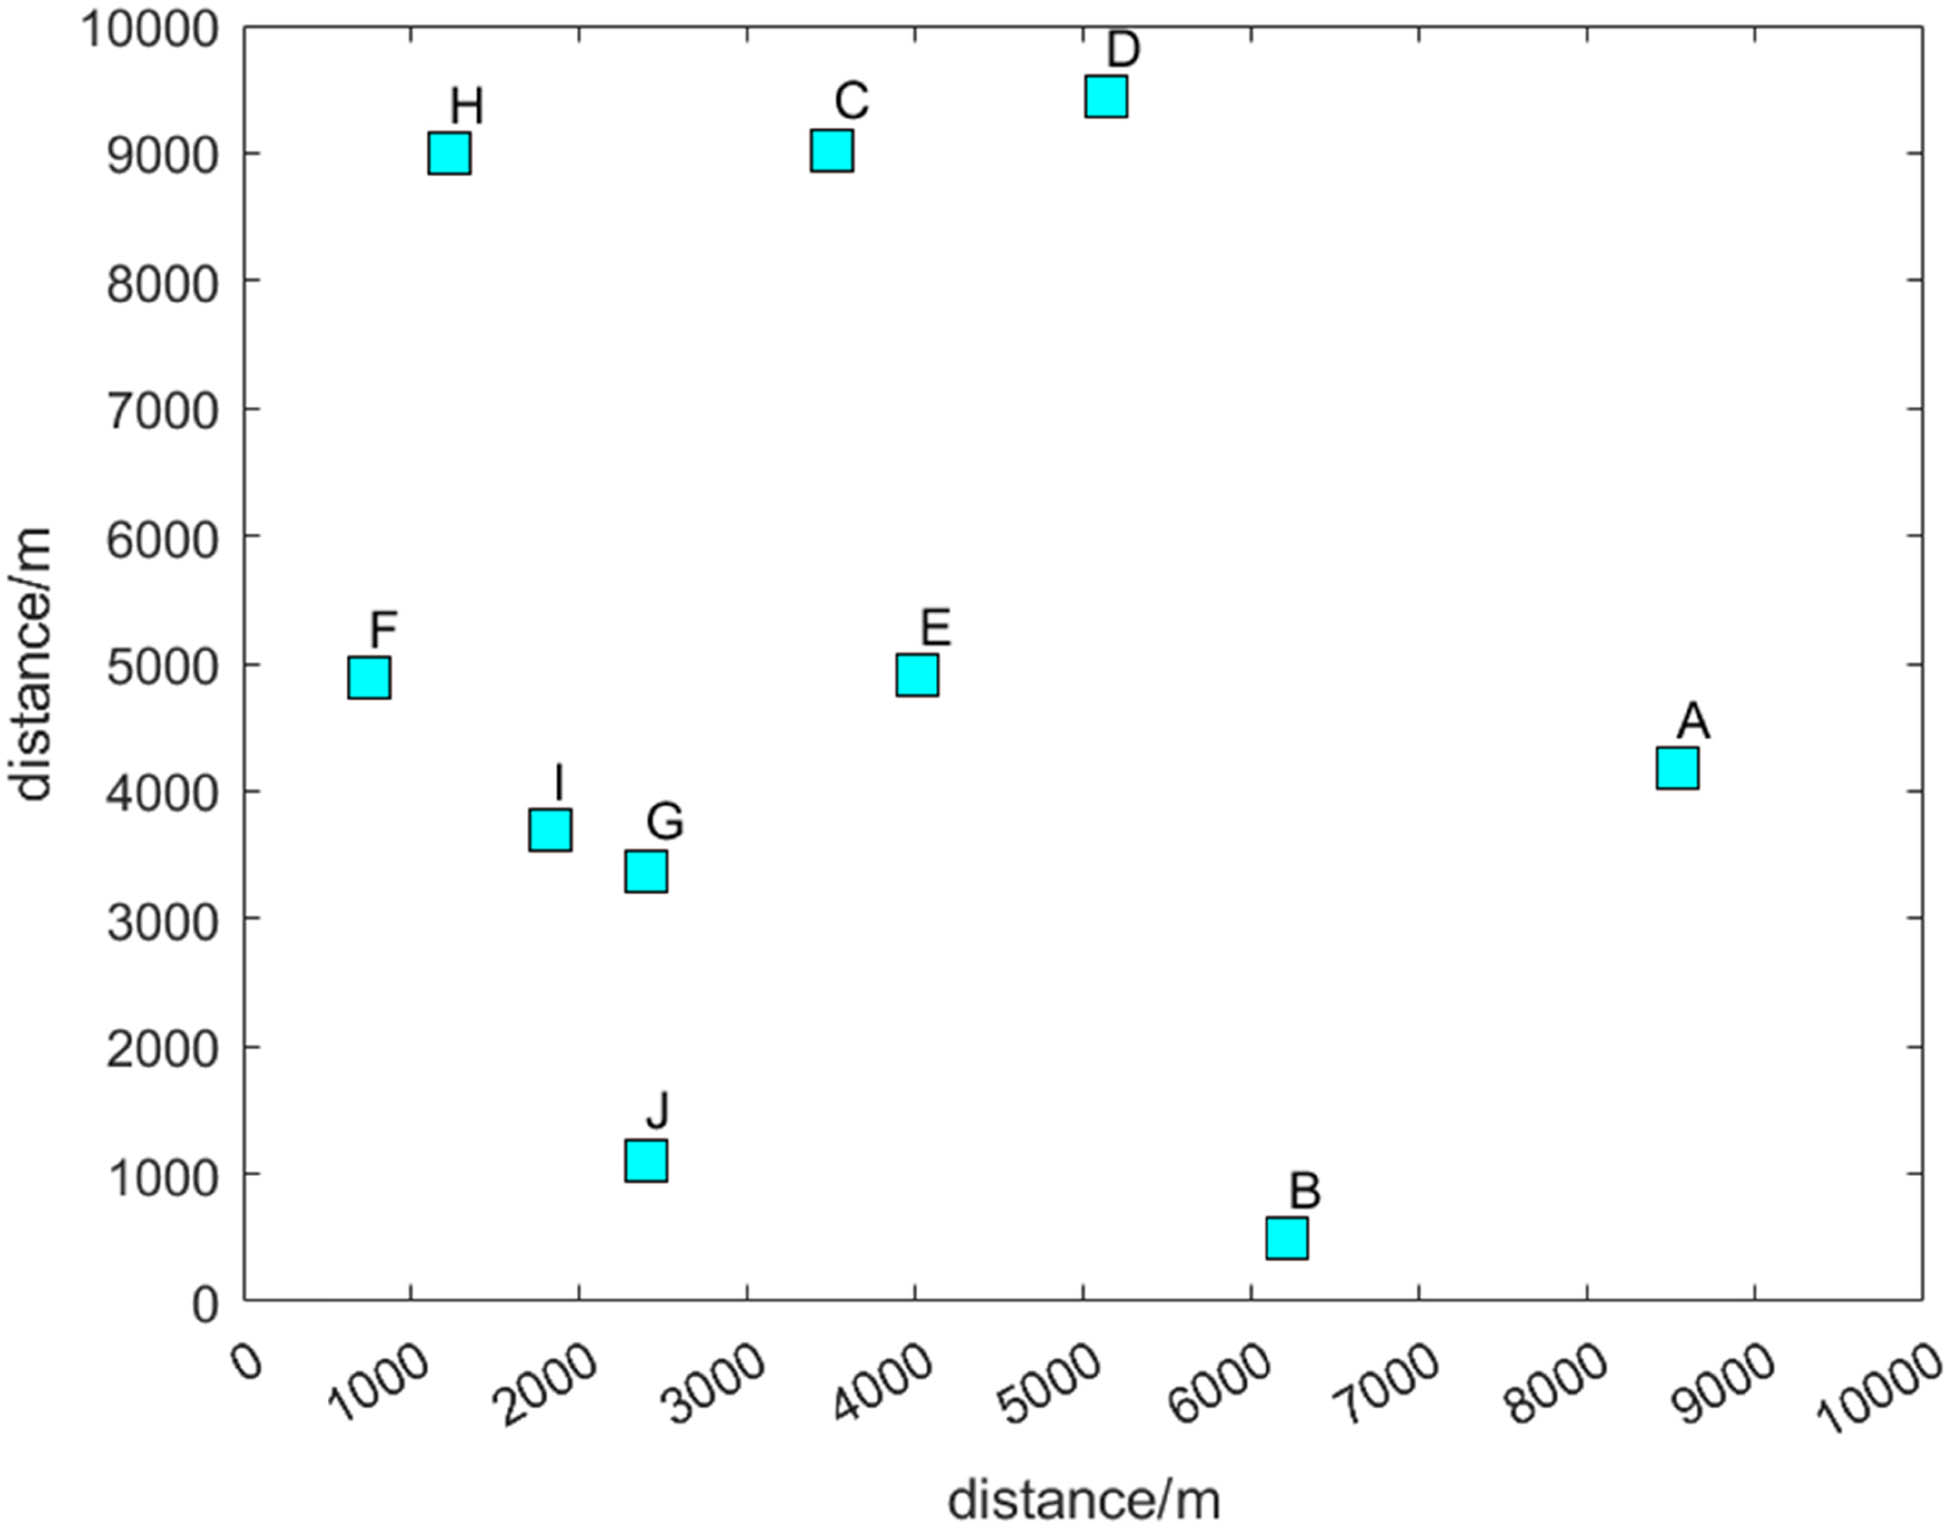
Schematic diagram of the location of tourist attractions.
4.1.1 The influence of parameter v
When v = 0.1, the number of iterations is about 15. The final distance value tends to be flat in the iteration of the shortest distance. When the pheromone volatility factor is adjusted to 0.5, the pheromone increases. The shortest distance becomes smaller. When the number of iterations is about 40, the shortest distance of each generation has become flat. Although the volatilization rate of pheromones becomes faster and faster, the shortest path found is shorter than before. When v is too small, the amount of pheromone on the unselected path will decay rapidly. Although it is simple to slip into a local optimum, the algorithm’s convergence will improve. In addition, when v is too large, the increment of the pheromone amount on the selected path decreases, and the search space becomes larger, so although the possibility of the algorithm falling into the local optimum decreases, the convergence of the algorithm decreases.
4.1.2 The influence of parameter w P
When w P = 1, the result of the iteration with the shortest distance tends to converge, causing the number of iterations to reach about 15 times. When w P = 3, the calculated shortest distance grows, and the calculation iteration trend resembles that of w P = 1. After about 50 iterations, the average distance drops sharply and then gradually flattens out. As a result, the larger the value of w P, the more likely the ants will choose the path they have previously traveled. The randomness of the search will be weakened, and the algorithm will converge ahead of time. The analysis of the influence of ant colony algorithm parameters is shown in Table 2.
The influence analysis of ant colony algorithm parameters
| Parameters | Analysis | Value range |
|---|---|---|
| w P | When it becomes larger, the randomness becomes smaller; when it becomes smaller, the search range becomes smaller. | [0, 5] |
| w L | Same as above. | [0, 5] |
| K | The larger K, the more accurate it is, but the calculation amount is larger. | 256 |
| v | The smaller the value, the slower the convergence speed; the larger the value, the more effective paths will be excluded and the search for the optimal value will be affected. | [0.1, 0.9] |
4.2 Comparison of experimental results of different algorithms
Based on the above experimental conditions, simulations are carried out to record the flow of visitors in scenic spots for a while. Figure 6 depicts that the congestion of scenic spots planned by other algorithms has not been well relieved, especially the congestion of scenic spots E, G, and I is more serious, while the congestion of scenic spots planned by the proposed ant colony optimization algorithm is somewhat less. Thus, the tourist load of each scenic spot is relatively balanced. Because the proposed algorithm considers the crowd flow factor, if the pheromone value of each path is the same, it will reduce the efficiency of the ants in finding the optimal path. The pheromone update strategy is optimized to alleviate the crowd congestion in hot spots.
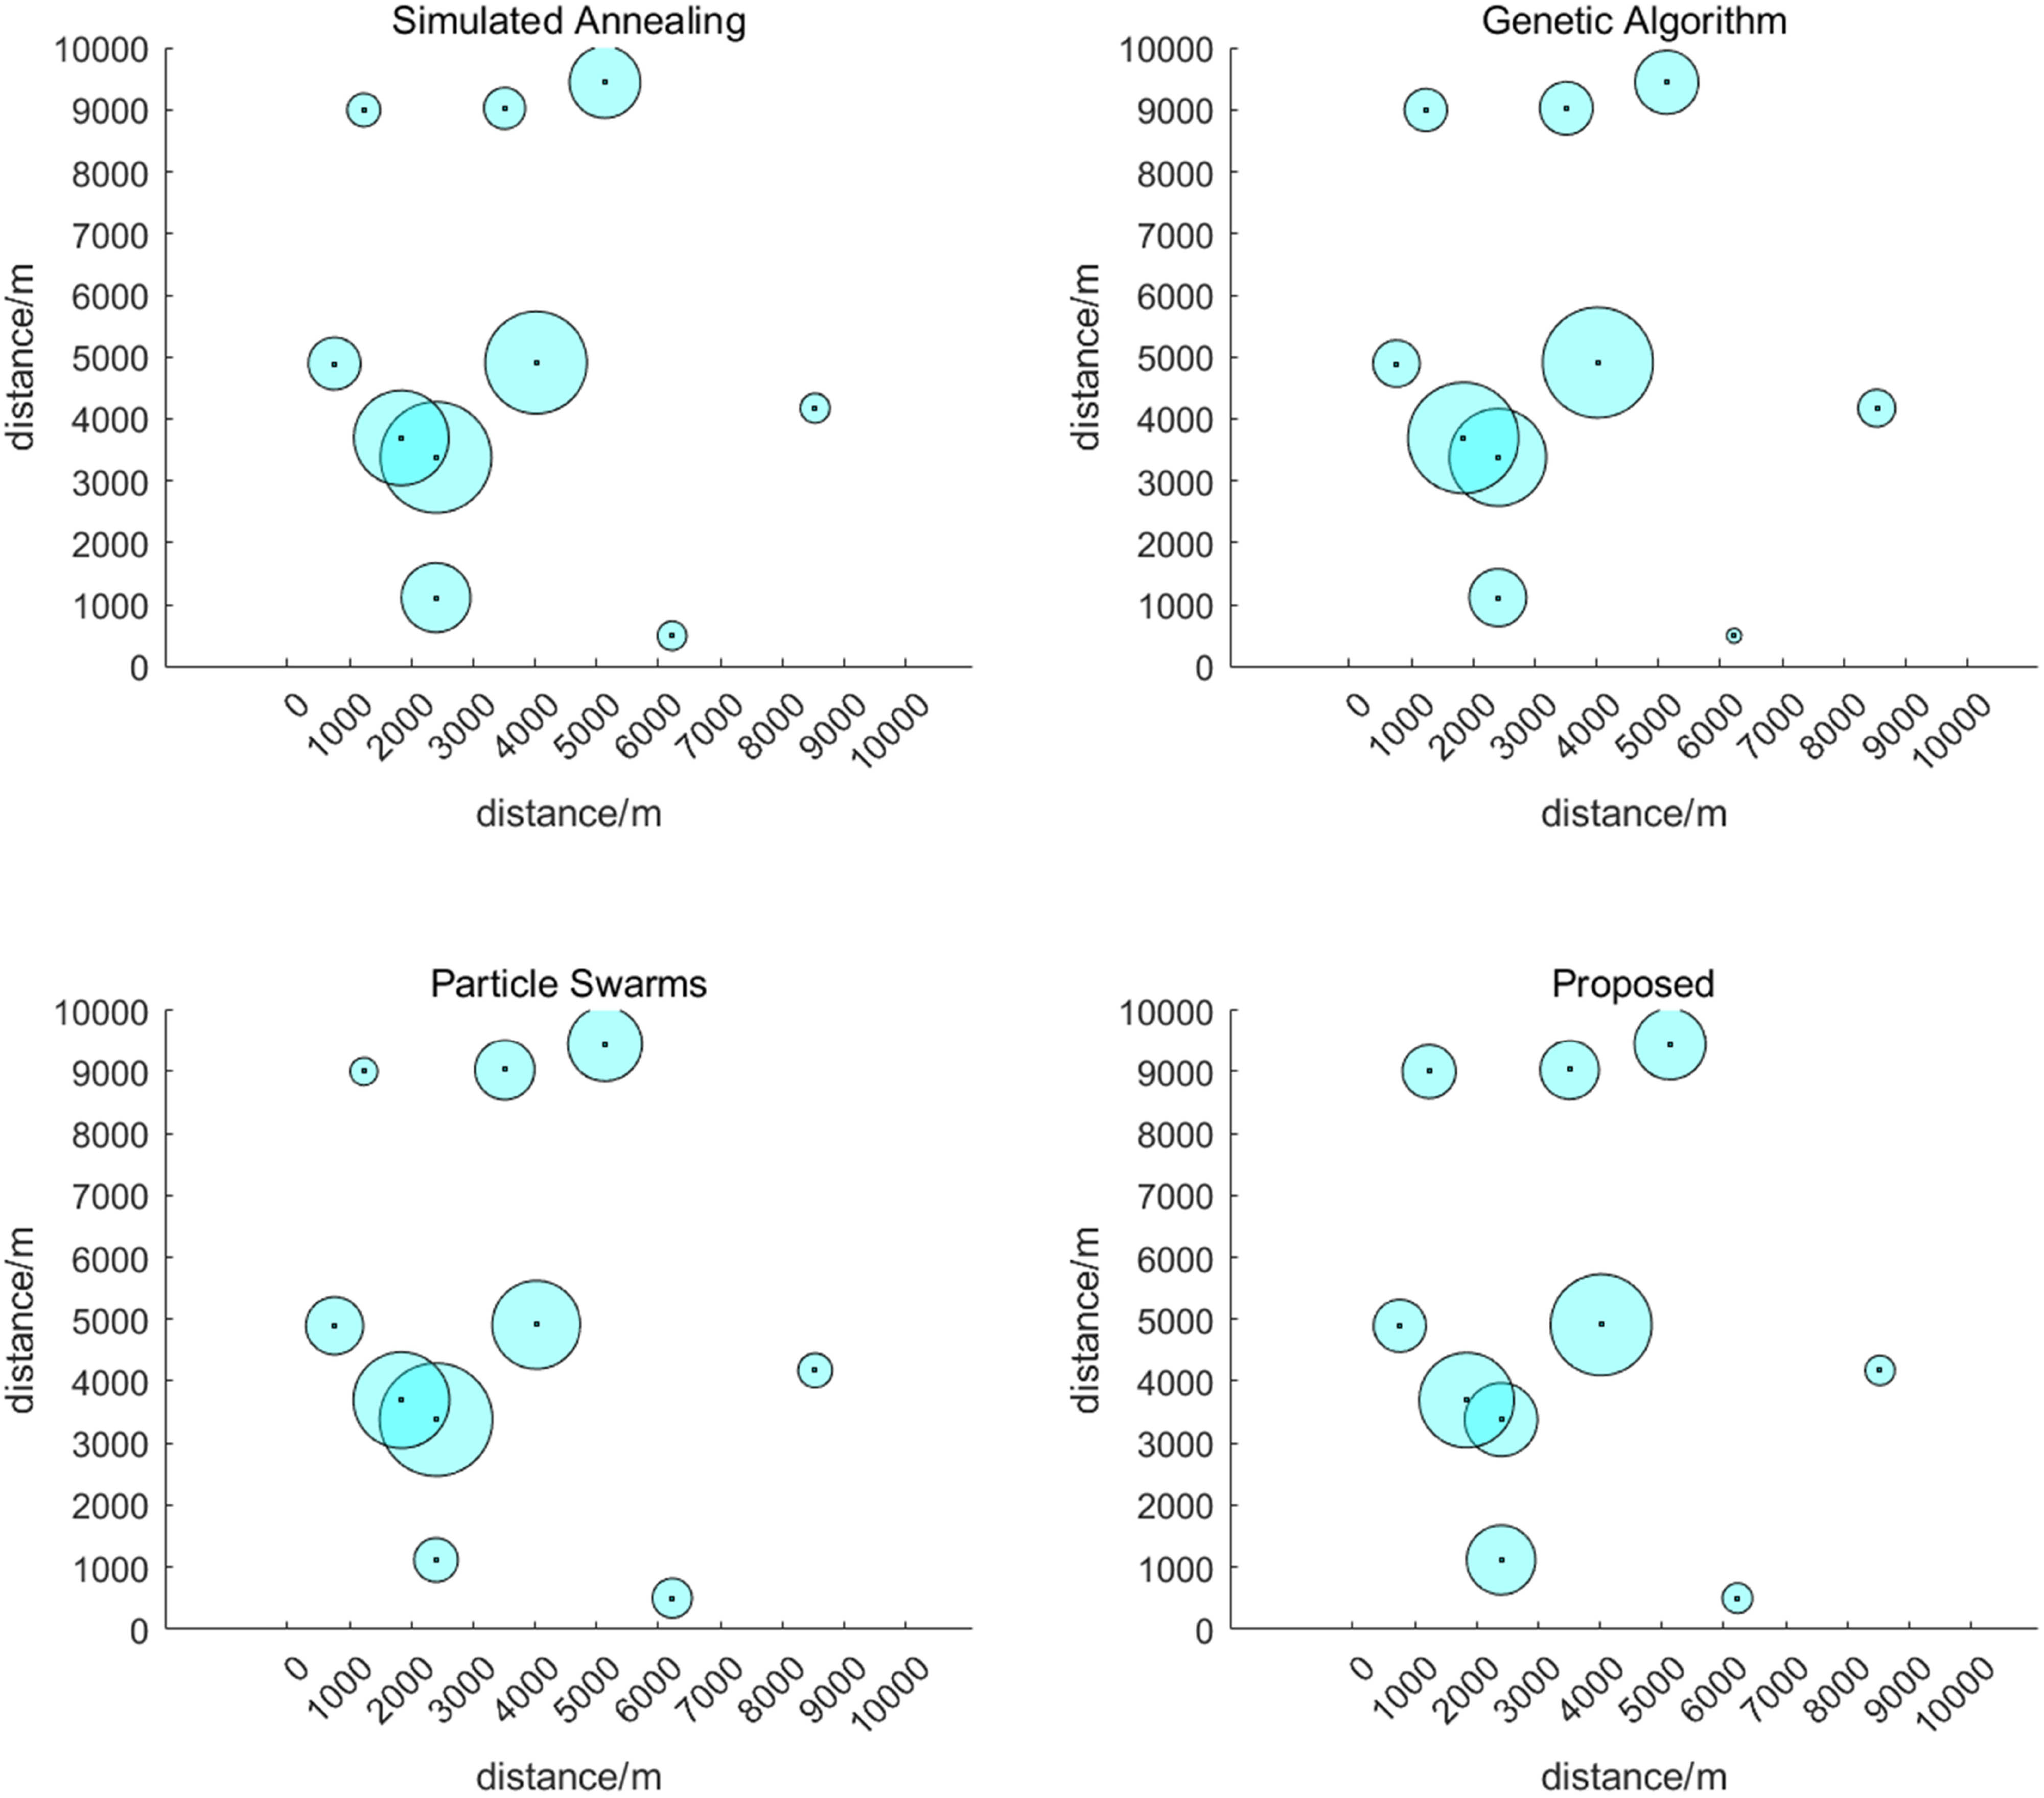
Schematic diagrams of the location of scenic spots.
The experimental results are shown in Table 3 and Figure 7, including the location of the scenic spots and the normalized traffic data finally calculated by each algorithm. By calculating the standard deviation of the visitor flow scores of all scenic spots, the concentration degree of visitor flow in each scenic spot is characterized, i.e., the smaller the standard deviation, the more dispersed the people flow. The experimental results suggest that the standard deviation of the proposed algorithm is lower than the previous three algorithms. After removing the three hottest spots, the calculated standard deviation is the same as that of other algorithms. It shows that the proposed ant colony algorithm has a solid contribution to reducing crowds.
Experimental results
| Scenic spot locations | Normalized foot traffic value | |||||
|---|---|---|---|---|---|---|
| No. | Longitude | Latitude | Simulated annealing | GA | Particle swarns | Proposed |
| A | 8531 | 4173 | 0.238 | 0.301 | 0.276 | 0.239 |
| B | 6221 | 497 | 0.234 | 0.119 | 0.319 | 0.242 |
| C | 3510 | 9028 | 0.334 | 0.428 | 0.481 | 0.474 |
| D | 5133 | 9448 | 0.576 | 0.512 | 0.602 | 0.576 |
| E* | 4019 | 4909 | 0.825 | 0.892 | 0.713 | 0.817 |
| F | 760 | 4893 | 0.423 | 0.378 | 0.465 | 0.423 |
| G* | 2400 | 3378 | 0.897 | 0.786 | 0.912 | 0.592 |
| H | 1234 | 9001 | 0.268 | 0.344 | 0.222 | 0.432 |
| I* | 1840 | 3693 | 0.766 | 0.895 | 0.776 | 0.766 |
| J | 2400 | 1113 | 0.559 | 0.465 | 0.354 | 0.559 |
| Standard deviation | 0.251 | 0.263 | 0.232 | 0.192 | ||
| Standard deviation without 3 hot points | 0.146 | 0.130 | 0.133 | 0.136 | ||
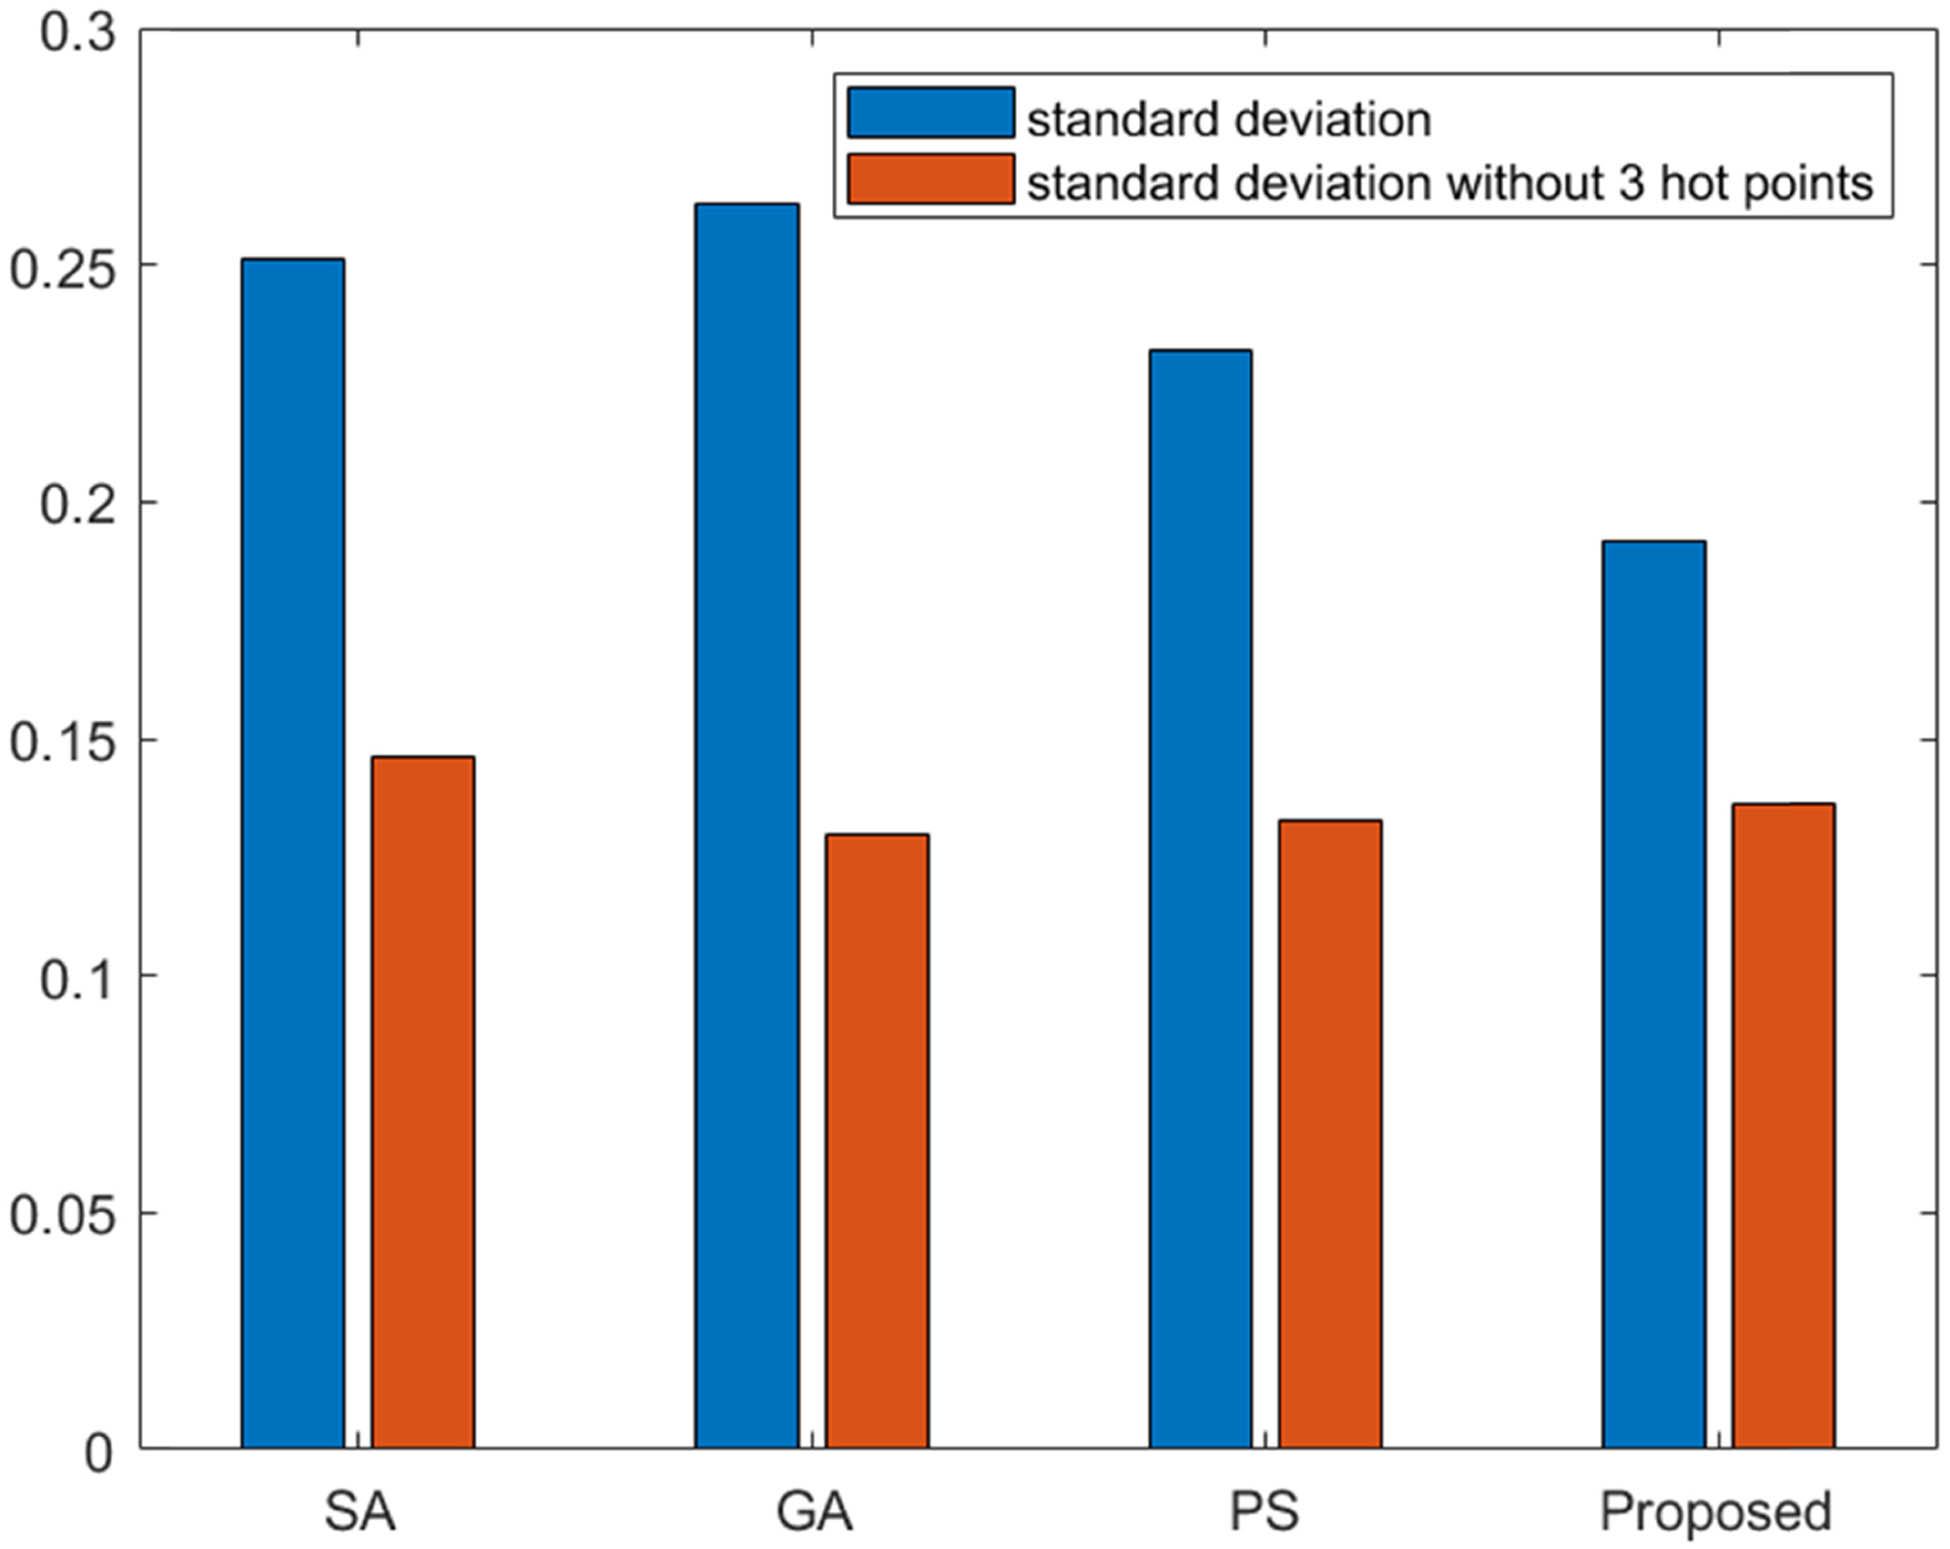
Standard deviation of different algorithms.
4.3 Comparison of experimental results of GPU computing
The proposed ant colony algorithm is written in parallel to test how fast the calculation speed would be. The hardware environment of the experimental environment in this article is CPU: Intel(R) Core (TM) i7-11700K@3.60 GHz. The computer graphics card is an ordinary consumer-grade graphics card: NVIDIA GeForce GTX 1660s (Compute Capability 7.5). The operating system is Win10. The CUDA version is 11.1, and the programming environment is VS2019. The experimental data and related parameters are the same as presented in the previous section, and the maximum number of iterations is set to 200.
Several experiments were performed on each set of parameters on the GPU and CPU, respectively. The experimental results show that in the CUDA environment, the distributed parallel algorithm based on GPU achieves relatively higher computing efficiency. The relevant data in Table 4 give the calculation time and acceleration rate of the GPU-based path planning algorithm and the CPU-based algorithm after iterating under different parameter conditions.
The acceleration results of the parallelized computing
| No. of attractions | No. of ants | CPU time (s) | GPU time (s) | Speedup ratio |
|---|---|---|---|---|
| 10 | 256 | 23.126 | 9.250 | 2.5 |
| 10 | 512 | 52.676 | 5.726 | 9.2 |
| 10 | 1024 | 120.775 | 9.981 | 12.1 |
Different parameter conditions are checked. The calculation time and acceleration rate of the GPU-based path planning algorithm and the CPU-based algorithm are experimented with when the number of attractions is fixed at 10. As the number of ants grows, both CPU and GPU times increase slowly. However, the proposed method solves the corresponding problem swiftly.
5 Conclusion
An ant colony-based optimization algorithm is proposed to resolve the planning problem of optimal tourist routes. An optimized pheromone update strategy is also proposed based on the basic ant colony optimization algorithm. The optimized ant colony algorithm tries to balance two conflicting concepts, namely, flows into tourist attractions and the carrying capacity of destinations.
This article mainly studies the problem of tourist route planning and proposes an improved ant colony algorithm in tourist route planning for practical problems. The work is mainly reflected in two aspects: (1) Aiming at overcoming the shortcomings of the conventional tourist route planning algorithm whose evolution speed is slow but the search time is long, this article designs a tourist route planning method based on the ant colony optimization algorithm. (2) To increase the computational performance of the proposed method, this study uses GPU operation. The experimental findings show that the proposed ant colony optimization method is fast and could minimize congestion issues in scenic areas compared to the basic ant colony algorithm and other algorithms.
The effects of different optimization algorithms on the route planning of tourist attractions were compared in the experiment, and the acceleration ratio of the optimized ant colony algorithm was tested using the GPU parallel computing program. The results show that the proposed algorithm provides certain advantages and has certain potential in parallel computing. To sum up, this study provides a better scientific basis for optimal tourist route planning and has a good reference value.
However, there are still several flaws in online travel route planning, and more research and better optimization schemes are required. The research just discusses the route planning problem between picturesque sites. The same issue regarding scenic spots has not been addressed. Future research will focus on it.
-
Funding information: This study is not sponsored by any funding agency.
-
Conflict of interest: The authors declare that there are no competing interests.
-
Data availability statement: The labeled dataset used to support the findings of this study is available from the corresponding author upon request.
References
[1] Gavalas D, Konstantopoulos C, Mastakas K, Pantziou G. A survey on algorithmic approaches for solving tourist trip design problems. J Heuristics. 2014;20:291–328.10.1007/s10732-014-9242-5Suche in Google Scholar
[2] Thayer TC, Carpin S. An adaptive method for the stochastic orienteering problem. IEEE Robot Autom Lett. 2021;6(2):4185–92.10.1109/LRA.2021.3068699Suche in Google Scholar
[3] Macharet DG, Neto AA, Shishika D. Minimal exposure Dubins orienteering problem. IEEE Robot Autom Lett. 2021;6(2):2280–7.10.1109/LRA.2021.3061004Suche in Google Scholar
[4] Sylejmani K, Dorn J, Musliu N. Planning the trip itinerary for tourist groups. Inf Technol Tour. 2017;17:275–314.10.1007/s40558-017-0080-9Suche in Google Scholar
[5] Huang T, Gong Y-J, Zhang Y-H, Zhan Z-H, Zhang J. Automatic planning of multiple itineraries: A niching genetic evolution approach. IEEE Trans Intell Transp Syst. 2019;21(10):4225–40.10.1109/TITS.2019.2939224Suche in Google Scholar
[6] Hajati F, Rezaee A, Gheisari S, editors. Genetic algorithms for scheduling examinations. Advanced Information Networking and Applications: Proceedings of the 35th International Conference on Advanced Information Networking and Applications (AINA-2021). Vol. 3, Springer; 2021.10.1007/978-3-030-75078-7_52Suche in Google Scholar
[7] Borah BJ, Borah S, editors. Genetic algorithm based optimization and design of pile foundation. Ground characterization and foundations: Proceedings of Indian Geotechnical Conference 2020. Vol. 1, Springer; 2022.10.1007/978-981-16-3383-6_58Suche in Google Scholar
[8] Blankemeyer S, Kolditz T, Busch J, Seitz M, Nyhuis P, Raatz A. Adaptive aerodynamic part feeding enabled by genetic algorithm. Prod Eng. 2021;16:1–8.10.1007/s11740-021-01076-wSuche in Google Scholar
[9] Singh N, Singh S, Houssein EH. Hybridizing salp swarm algorithm with particle swarm optimization algorithm for recent optimization functions. Evolut Intell. 2022;1(1):1–34.10.1007/s12065-020-00486-6Suche in Google Scholar
[10] Bento ME. A hybrid particle swarm optimization algorithm for the wide-area damping control design. IEEE Trans Ind Inform. 2021;18(1):592–9.10.1109/TII.2021.3054846Suche in Google Scholar
[11] Quarto M, D'Urso G, Giardini C. Micro-EDM optimization through particle swarm algorithm and artificial neural network. Precis Eng. 2022;73:63–70.10.1016/j.precisioneng.2021.08.018Suche in Google Scholar
[12] Yavuz G, Durmuş B, Aydın D. Artificial bee colony algorithm with distant savants for constrained optimization. Appl Soft Comput. 2022;116:108343.10.1016/j.asoc.2021.108343Suche in Google Scholar
[13] Durgut R. Improved binary artificial bee colony algorithm. Front Inf Technol Electron Eng. 2021;22(8):1080–91.10.1631/FITEE.2000239Suche in Google Scholar
[14] Barbosa Castro ND, Hernández Martin JA, Sáenz Blanco F, Tapias Forero EF, editors. Educational strategy combining technological capacity and ant colony algorithm to improve the ideal dispatch using wind energy. WITS 2020: Proceedings of the 6th International Conference on Wireless Technologies, Embedded, and Intelligent Systems. Springer; 2021.10.1007/978-981-33-6893-4_51Suche in Google Scholar
[15] Gavidia-Calderon C, Castañon CB. Isula: A java framework for ant colony algorithms. SoftwareX. 2020;11:100400.10.1016/j.softx.2020.100400Suche in Google Scholar
[16] Lin S-W, Vincent FY. A simulated annealing heuristic for the team orienteering problem with time windows. Eur J Oper Res. 2012;217(1):94–107.10.1016/j.ejor.2011.08.024Suche in Google Scholar
[17] Nayeri S, Tavakkoli-Moghaddam R, Sazvar Z, Heydari J. A heuristic-based simulated annealing algorithm for the scheduling of relief teams in natural disasters. Soft Comput. 2022;26(1):1–19.10.1007/s00500-021-06425-6Suche in Google Scholar
[18] Umbarkar A, Joshi MS, Hong W-C. Comparative study of diversity based parallel dual population genetic algorithm for unconstrained function optimisations. Int J Bio-Inspired Comput. 2016;8(4):248–63.10.1504/IJBIC.2016.10000242Suche in Google Scholar
[19] Ali SK, Fadzilan MF, Shaari ANS, Hadi MS, Pek Eek RT, Mat Darus IZ. Modelling of flexible beam based on ant colony optimization and cuckoo search algorithms. J Vibroeng. 2021;23(4):810–22.10.21595/jve.2020.21730Suche in Google Scholar
[20] Zhang Z, Cao G, Li X, Zhang B, Li S. A new algorithm for traveling salesman problems based on negative feedback ant colony algorithm supervised by 2-optimization. J Nonlinear Convex Anal. 2020;21(8):1727–42.10.3390/math8101650Suche in Google Scholar
[21] Bonabeau E, Dorigo M, Theraulaz G. Inspiration for optimization from social insect behaviour. Nature. 2000;406(6791):39–42.10.1038/35017500Suche in Google Scholar PubMed
[22] Hou Y, Guo X, Han H, Wang J. Knowledge-driven ant colony optimization algorithm for vehicle routing problem in instant delivery peak period. Appl Soft Comput. 2023;110551. 10.1016/j.asoc.2023.110551.Suche in Google Scholar
[23] Ebid AM, Abdel-Kader MY, Mahdi IM. Abdel-Rasheed I Ant colony optimization based algorithm to determine the optimum route for overhead power transmission lines. Ain Shams Eng J. 2023;102344. 10.1016/j.asoc.2023.110551.Suche in Google Scholar
[24] Wu H, Gao Y. An ant colony optimization based on local search for the vehicle routing problem with simultaneous pickup–delivery and time window. Appl Soft Comput. 2023;139:110203.10.1016/j.asoc.2023.110203Suche in Google Scholar
© 2023 the author(s), published by De Gruyter
This work is licensed under the Creative Commons Attribution 4.0 International License.
Artikel in diesem Heft
- Regular Articles
- Diagenesis and evolution of deep tight reservoirs: A case study of the fourth member of Shahejie Formation (cg: 50.4-42 Ma) in Bozhong Sag
- Petrography and mineralogy of the Oligocene flysch in Ionian Zone, Albania: Implications for the evolution of sediment provenance and paleoenvironment
- Biostratigraphy of the Late Campanian–Maastrichtian of the Duwi Basin, Red Sea, Egypt
- Structural deformation and its implication for hydrocarbon accumulation in the Wuxia fault belt, northwestern Junggar basin, China
- Carbonate texture identification using multi-layer perceptron neural network
- Metallogenic model of the Hongqiling Cu–Ni sulfide intrusions, Central Asian Orogenic Belt: Insight from long-period magnetotellurics
- Assessments of recent Global Geopotential Models based on GPS/levelling and gravity data along coastal zones of Egypt
- Accuracy assessment and improvement of SRTM, ASTER, FABDEM, and MERIT DEMs by polynomial and optimization algorithm: A case study (Khuzestan Province, Iran)
- Uncertainty assessment of 3D geological models based on spatial diffusion and merging model
- Evaluation of dynamic behavior of varved clays from the Warsaw ice-dammed lake, Poland
- Impact of AMSU-A and MHS radiances assimilation on Typhoon Megi (2016) forecasting
- Contribution to the building of a weather information service for solar panel cleaning operations at Diass plant (Senegal, Western Sahel)
- Measuring spatiotemporal accessibility to healthcare with multimodal transport modes in the dynamic traffic environment
- Mathematical model for conversion of groundwater flow from confined to unconfined aquifers with power law processes
- NSP variation on SWAT with high-resolution data: A case study
- Reconstruction of paleoglacial equilibrium-line altitudes during the Last Glacial Maximum in the Diancang Massif, Northwest Yunnan Province, China
- A prediction model for Xiangyang Neolithic sites based on a random forest algorithm
- Determining the long-term impact area of coastal thermal discharge based on a harmonic model of sea surface temperature
- Origin of block accumulations based on the near-surface geophysics
- Investigating the limestone quarries as geoheritage sites: Case of Mardin ancient quarry
- Population genetics and pedigree geography of Trionychia japonica in the four mountains of Henan Province and the Taihang Mountains
- Performance audit evaluation of marine development projects based on SPA and BP neural network model
- Study on the Early Cretaceous fluvial-desert sedimentary paleogeography in the Northwest of Ordos Basin
- Detecting window line using an improved stacked hourglass network based on new real-world building façade dataset
- Automated identification and mapping of geological folds in cross sections
- Silicate and carbonate mixed shelf formation and its controlling factors, a case study from the Cambrian Canglangpu formation in Sichuan basin, China
- Ground penetrating radar and magnetic gradient distribution approach for subsurface investigation of solution pipes in post-glacial settings
- Research on pore structures of fine-grained carbonate reservoirs and their influence on waterflood development
- Risk assessment of rain-induced debris flow in the lower reaches of Yajiang River based on GIS and CF coupling models
- Multifractal analysis of temporal and spatial characteristics of earthquakes in Eurasian seismic belt
- Surface deformation and damage of 2022 (M 6.8) Luding earthquake in China and its tectonic implications
- Differential analysis of landscape patterns of land cover products in tropical marine climate zones – A case study in Malaysia
- DEM-based analysis of tectonic geomorphologic characteristics and tectonic activity intensity of the Dabanghe River Basin in South China Karst
- Distribution, pollution levels, and health risk assessment of heavy metals in groundwater in the main pepper production area of China
- Study on soil quality effect of reconstructing by Pisha sandstone and sand soil
- Understanding the characteristics of loess strata and quaternary climate changes in Luochuan, Shaanxi Province, China, through core analysis
- Dynamic variation of groundwater level and its influencing factors in typical oasis irrigated areas in Northwest China
- Creating digital maps for geotechnical characteristics of soil based on GIS technology and remote sensing
- Changes in the course of constant loading consolidation in soil with modeled granulometric composition contaminated with petroleum substances
- Correlation between the deformation of mineral crystal structures and fault activity: A case study of the Yingxiu-Beichuan fault and the Milin fault
- Cognitive characteristics of the Qiang religious culture and its influencing factors in Southwest China
- Spatiotemporal variation characteristics analysis of infrastructure iron stock in China based on nighttime light data
- Interpretation of aeromagnetic and remote sensing data of Auchi and Idah sheets of the Benin-arm Anambra basin: Implication of mineral resources
- Building element recognition with MTL-AINet considering view perspectives
- Characteristics of the present crustal deformation in the Tibetan Plateau and its relationship with strong earthquakes
- Influence of fractures in tight sandstone oil reservoir on hydrocarbon accumulation: A case study of Yanchang Formation in southeastern Ordos Basin
- Nutrient assessment and land reclamation in the Loess hills and Gulch region in the context of gully control
- Handling imbalanced data in supervised machine learning for lithological mapping using remote sensing and airborne geophysical data
- Spatial variation of soil nutrients and evaluation of cultivated land quality based on field scale
- Lignin analysis of sediments from around 2,000 to 1,000 years ago (Jiulong River estuary, southeast China)
- Assessing OpenStreetMap roads fitness-for-use for disaster risk assessment in developing countries: The case of Burundi
- Transforming text into knowledge graph: Extracting and structuring information from spatial development plans
- A symmetrical exponential model of soil temperature in temperate steppe regions of China
- A landslide susceptibility assessment method based on auto-encoder improved deep belief network
- Numerical simulation analysis of ecological monitoring of small reservoir dam based on maximum entropy algorithm
- Morphometry of the cold-climate Bory Stobrawskie Dune Field (SW Poland): Evidence for multi-phase Lateglacial aeolian activity within the European Sand Belt
- Adopting a new approach for finding missing people using GIS techniques: A case study in Saudi Arabia’s desert area
- Geological earthquake simulations generated by kinematic heterogeneous energy-based method: Self-arrested ruptures and asperity criterion
- Semi-automated classification of layered rock slopes using digital elevation model and geological map
- Geochemical characteristics of arc fractionated I-type granitoids of eastern Tak Batholith, Thailand
- Lithology classification of igneous rocks using C-band and L-band dual-polarization SAR data
- Analysis of artificial intelligence approaches to predict the wall deflection induced by deep excavation
- Evaluation of the current in situ stress in the middle Permian Maokou Formation in the Longnüsi area of the central Sichuan Basin, China
- Utilizing microresistivity image logs to recognize conglomeratic channel architectural elements of Baikouquan Formation in slope of Mahu Sag
- Resistivity cutoff of low-resistivity and low-contrast pays in sandstone reservoirs from conventional well logs: A case of Paleogene Enping Formation in A-Oilfield, Pearl River Mouth Basin, South China Sea
- Examining the evacuation routes of the sister village program by using the ant colony optimization algorithm
- Spatial objects classification using machine learning and spatial walk algorithm
- Study on the stabilization mechanism of aeolian sandy soil formation by adding a natural soft rock
- Bump feature detection of the road surface based on the Bi-LSTM
- The origin and evolution of the ore-forming fluids at the Manondo-Choma gold prospect, Kirk range, southern Malawi
- A retrieval model of surface geochemistry composition based on remotely sensed data
- Exploring the spatial dynamics of cultural facilities based on multi-source data: A case study of Nanjing’s art institutions
- Study of pore-throat structure characteristics and fluid mobility of Chang 7 tight sandstone reservoir in Jiyuan area, Ordos Basin
- Study of fracturing fluid re-discharge based on percolation experiments and sampling tests – An example of Fuling shale gas Jiangdong block, China
- Impacts of marine cloud brightening scheme on climatic extremes in the Tibetan Plateau
- Ecological protection on the West Coast of Taiwan Strait under economic zone construction: A case study of land use in Yueqing
- The time-dependent deformation and damage constitutive model of rock based on dynamic disturbance tests
- Evaluation of spatial form of rural ecological landscape and vulnerability of water ecological environment based on analytic hierarchy process
- Fingerprint of magma mixture in the leucogranites: Spectroscopic and petrochemical approach, Kalebalta-Central Anatolia, Türkiye
- Principles of self-calibration and visual effects for digital camera distortion
- UAV-based doline mapping in Brazilian karst: A cave heritage protection reconnaissance
- Evaluation and low carbon ecological urban–rural planning and construction based on energy planning mechanism
- Modified non-local means: A novel denoising approach to process gravity field data
- A novel travel route planning method based on an ant colony optimization algorithm
- Effect of time-variant NDVI on landside susceptibility: A case study in Quang Ngai province, Vietnam
- Regional tectonic uplift indicated by geomorphological parameters in the Bahe River Basin, central China
- Computer information technology-based green excavation of tunnels in complex strata and technical decision of deformation control
- Spatial evolution of coastal environmental enterprises: An exploration of driving factors in Jiangsu Province
- A comparative assessment and geospatial simulation of three hydrological models in urban basins
- Aquaculture industry under the blue transformation in Jiangsu, China: Structure evolution and spatial agglomeration
- Quantitative and qualitative interpretation of community partitions by map overlaying and calculating the distribution of related geographical features
- Numerical investigation of gravity-grouted soil-nail pullout capacity in sand
- Analysis of heavy pollution weather in Shenyang City and numerical simulation of main pollutants
- Road cut slope stability analysis for static and dynamic (pseudo-static analysis) loading conditions
- Forest biomass assessment combining field inventorying and remote sensing data
- Late Jurassic Haobugao granites from the southern Great Xing’an Range, NE China: Implications for postcollision extension of the Mongol–Okhotsk Ocean
- Petrogenesis of the Sukadana Basalt based on petrology and whole rock geochemistry, Lampung, Indonesia: Geodynamic significances
- Numerical study on the group wall effect of nodular diaphragm wall foundation in high-rise buildings
- Water resources utilization and tourism environment assessment based on water footprint
- Geochemical evaluation of the carbonaceous shale associated with the Permian Mikambeni Formation of the Tuli Basin for potential gas generation, South Africa
- Detection and characterization of lineaments using gravity data in the south-west Cameroon zone: Hydrogeological implications
- Study on spatial pattern of tourism landscape resources in county cities of Yangtze River Economic Belt
- The effect of weathering on drillability of dolomites
- Noise masking of near-surface scattering (heterogeneities) on subsurface seismic reflectivity
- Query optimization-oriented lateral expansion method of distributed geological borehole database
- Petrogenesis of the Morobe Granodiorite and their shoshonitic mafic microgranular enclaves in Maramuni arc, Papua New Guinea
- Environmental health risk assessment of urban water sources based on fuzzy set theory
- Spatial distribution of urban basic education resources in Shanghai: Accessibility and supply-demand matching evaluation
- Spatiotemporal changes in land use and residential satisfaction in the Huai River-Gaoyou Lake Rim area
- Walkaway vertical seismic profiling first-arrival traveltime tomography with velocity structure constraints
- Study on the evaluation system and risk factor traceability of receiving water body
- Predicting copper-polymetallic deposits in Kalatag using the weight of evidence model and novel data sources
- Temporal dynamics of green urban areas in Romania. A comparison between spatial and statistical data
- Passenger flow forecast of tourist attraction based on MACBL in LBS big data environment
- Varying particle size selectivity of soil erosion along a cultivated catena
- Relationship between annual soil erosion and surface runoff in Wadi Hanifa sub-basins
- Influence of nappe structure on the Carboniferous volcanic reservoir in the middle of the Hongche Fault Zone, Junggar Basin, China
- Dynamic analysis of MSE wall subjected to surface vibration loading
- Pre-collisional architecture of the European distal margin: Inferences from the high-pressure continental units of central Corsica (France)
- The interrelation of natural diversity with tourism in Kosovo
- Assessment of geosites as a basis for geotourism development: A case study of the Toplica District, Serbia
- IG-YOLOv5-based underwater biological recognition and detection for marine protection
- Monitoring drought dynamics using remote sensing-based combined drought index in Ergene Basin, Türkiye
- Review Articles
- The actual state of the geodetic and cartographic resources and legislation in Poland
- Evaluation studies of the new mining projects
- Comparison and significance of grain size parameters of the Menyuan loess calculated using different methods
- Scientometric analysis of flood forecasting for Asia region and discussion on machine learning methods
- Rainfall-induced transportation embankment failure: A review
- Rapid Communication
- Branch fault discovered in Tangshan fault zone on the Kaiping-Guye boundary, North China
- Technical Note
- Introducing an intelligent multi-level retrieval method for mineral resource potential evaluation result data
- Erratum
- Erratum to “Forest cover assessment using remote-sensing techniques in Crete Island, Greece”
- Addendum
- The relationship between heat flow and seismicity in global tectonically active zones
- Commentary
- Improved entropy weight methods and their comparisons in evaluating the high-quality development of Qinghai, China
- Special Issue: Geoethics 2022 - Part II
- Loess and geotourism potential of the Braničevo District (NE Serbia): From overexploitation to paleoclimate interpretation