Monitoring drought dynamics using remote sensing-based combined drought index in Ergene Basin, Türkiye
-
Kerim Aykut Gümüş
 ,
Filiz Bektaş Balçık
,
Filiz Bektaş Balçık

Abstract
Remote sensing-based approaches have gained widespread usage in drought monitoring studies. However, relying on single-variable drought indices may be inadequate to provide a comprehensive understanding of drought dynamics. In this study, principal component analysis was employed to derive a combined index, namely, the combined drought index (CDI), from multiple indices such as vegetation condition index, temperature condition index, precipitation condition index, and soil moisture condition index. The CDI was subsequently employed to analyze drought occurrences in the Ergene Basin-Türkiye period from 2001 to 2020 (May to October) using MODIS data. Correlations were computed with standardized precipitation index (SPI) and standardized precipitation evapotranspiration index (SPEI) at 1-, 3-, and 6-month scales and crop yield. The results revealed that drought incidents transpired in the Ergene Basin for at least 1 month annually. May exhibited the wettest, while September stood as the driest month. The severity of drought and its spatial extent displayed an increasing trend followed by a subsequent decline during the aforementioned period. The CDI demonstrated stronger correlations with the 1-month standardized indices than the 3- and 6-month SPI-SPEI. A robust correlation of 0.79 was also observed between the CDI and the crop yield. In general, the CDI performed well in determining the spatial and temporal patterns of the historic droughts. As a result, the CDI could be leveraged to develop effective drought monitoring and management, which could help mitigate the negative impact of drought in the fragile environment of the Ergene Basin.
1 Introduction
Drought is a hydroclimatic natural disaster that has adverse effects on various areas such as agriculture, water resources, natural ecosystems as well as social life [1,2,3]. It can be categorized into four main types: meteorological, agricultural, hydrological, and socio-economic [3]. Consequently, the monitoring and evaluation of drought hold significant value in light of its wide-ranging adverse impacts. To accomplish this goal, diverse methods have been developed to assess various dimensions of drought, such as intensity, duration, severity, and spatial distribution [4].
When discussing traditional tools, several indices like Deciles, standardized precipitation index (SPI), Palmer drought severity index (PDSI), and surface water supply index depend on climate and meteorological data collected from ground measurement stations [5]. In addition, the standardized precipitation evapotranspiration index (SPEI) was calculated by integrating both potential evapotranspiration (PET) and precipitation data [6]. Nonetheless, since these indices rely on data gathered from ground measurement stations, they may have limitations, incomplete information, and potential errors, and may not be available in real time [7]. On the other hand, an increasing number of observation satellites provide valuable data for monitoring and analyzing vegetation, soil, and water dynamics. These satellites enable the high spatial and temporal resolution monitoring of drought in regions with limited local measurement capabilities [8,9]. Remote sensing-based vegetation, water, and temperature indices are widely used to track the response of plants to climate conditions [9]. Numerous remote sensing-based indices have been developed, including the vegetation condition index (VCI), normalized difference water index, land surface water index, temperature condition index (TCI), normalized difference temperature index, vegetation health index (VHI), temperature vegetation dryness index, and evapotranspiration drought index [10].
Drought characteristics are too complex to adequately express by a single climate variable [11,12]. Therefore, single-variable drought indices based on precipitation, temperature, streamflow, or soil moisture may fall short in capturing the complex features of drought events [11,12]. In this context, various multivariable drought indices have been proposed, such as the VHI, normalized difference drought index (NDDI), PDSI, and SPEI. However, while VHI and NDDI are primarily used to monitor agricultural drought, PDSI and SPEI are generally preferred to monitor meteorological drought. Therefore, these indices can only be used to monitor one of the four defined drought types [13]. However, different types of drought can occur simultaneously in a given area [14]. Hence, in the assessment of drought in an area, combined indices have been developed by combining various drought indices to account for information about different drought types [13,15].
For this purpose, various approaches such as Copula functions [12,13,16], ordered weighted averaging method [17], multivariable linear regression method [18], constrained optimization method [19,20,21], and principal component analysis (PCA) [15,16,19,22,23,24], among others, are utilized. PCA is a multivariate approach utilized in this scenario to decrease the complexity of a dataset. It achieves this by generating a set of new perpendicular variables known as principal components (PCs) in a descending order of significance [25]. This approach is widely employed in the analysis of drought [23]. Studies conducted in China and Iran by Karimi et al. [15] and Du et al. [24], respectively, have combined single-variable drought indices (MODIS-based VCI, TCI, TRMM-based precipitation condition index (PCI) and MODIS-based soil water index) using the PCA method to create synthesized drought index and combined drought index (CDI). In studies conducted in Ethiopia and India by Bayissa et al. [26] and Kulkarni et al. [27] respectively, CHIRPS-based SPI and NOAH [27]/MODIS [26]-based LST, MODIS-based NDVI, NOAH-based Soil Moisture data, and in a study conducted in China by Liu et al. [16], in situ station-based precipitation, evapotranspiration, soil moisture of top two layers (SM1 and SM2), and runoff data were used to obtain CDI-E, CDI-M, and ADI (aggregate drought index) using this method. These aforementioned combined indices were then compared with drought indices obtained from in situ meteorological station data (such as SPI and SPEI) and/or crop yield for validation purposes.
The objective of the present study was to develop a combined index that integrates vegetation condition, surface temperature, precipitation, and soil moisture to conduct a comprehensive spatial and temporal analysis of drought in the Ergene Basin, Türkiye. The authors claim that such a CDI approach has never been used before to monitor and analyze drought in Türkiye. The study integrates the MODIS-based VCI, TCI, CHIRPS-based PCI, and ERA-5-based soil moisture condition index (SMCI) to produce CDI in the Google Earth Engine (GEE) platform. Moreover, by utilizing the CDI from the year 2001 to 2020, the spatial distribution and temporal variations of drought within the basin will be evaluated. The effectiveness of the CDI in monitoring and assessing drought events in the basin will be assessed by comparing it with meteorological drought indices (SPI-SPEI) and the crop yield data.
2 Materials and methods
2.1 Study area
The study area, the Ergene Basin, is located in the northwestern section of Türkiye, specifically in the Thrace subregion, marking the transitional zone from the Marmara region to the European Continent [28]. Geographically, the basin lies between 40°38′ to 42°05′N and 26°03′ to 28°12′E. The Ergene Basin covers a total area of 14,486 km², corresponding to 1.9% of all basins in Türkiye [28,29].
The climate of the Ergene Basin is characterized by a harsh and cold winter and a hot and dry continental climate during summers. However, the basin’s southern part experiences a mild and rainy winter and a hot and dry Mediterranean climate. The annual average temperature for 2001–2020, calculated using monthly total precipitation and monthly average temperature data obtained from meteorological stations in the basin, is 14.3°C, with an annual average precipitation amount of 623.84 mm (Figure S1).
The Ergene Basin is a home to a population of 1,891,878 people [30]. It is an important agricultural region that significantly contributes to agricultural production in Türkiye due to its fertile agricultural land. Agricultural areas cover about 66% of the basin [28], with approximately 48% rainfed cultivable land, 13% continuously irrigated land, and 7% areas with natural vegetation [31]. In 2020, the basin produced 820,736 tons of sunflower (43% of the country’s production), 1,739,850 tons of wheat (10% of the country’s production), and 980,000 tons of rice (paddy) (44% of the annual production) [32].
2.2 Data
Various factors are considered when selecting the study period in drought studies conducted in the literature. For example, in studies conducted by Karimi et al. and Wei et al. [15,20,21], the growing seasons of crops were chosen as the study period within a year. In this study, remote sensing and in situ drought index maps and time series specific to the Ergene Basin were generated, and drought analyses were conducted for the period from 2001 to 2020 for each year’s May–October period when the growth and harvest season of crops in the basin and the time of the year when drought is most strongly felt. MOD13A2 1 km spatial resolution 16-day composite NDVI, MOD11A1 1 km spatial resolution daily LST, CHIRPS pentad 0.05° spatial resolution 30+ year global rainfall data set, and ECMWF ERA5-land monthly averaged by hour of day data with a spatial resolution of 0.1° from GEE platform were used.
Furthermore, to compute the meteorological drought indices SPI and SPEI, monthly “total precipitation” and “average temperature” data were obtained from Çorlu, Edirne, İpsala, Kırklareli, Lüleburgaz-Tigem, Malkara, Tekirdağ, and Uzunköprü Meteorological Stations from 1991 to 2020 (Figure 1). Furthermore, agricultural production statistics (sunflower, rice, maize, wheat, etc.) at the basin level for the period 2004–2020 were obtained from the Turkish Statistical Institute (TURKSTAT) database to calculate the crop yield [32].

Study area and meteorological stations.
2.3 Methods
The study aimed to investigate the spatial and temporal patterns of drought in the Ergene Basin between May and October from 2001 to 2020 using the CDI. In addition, the performance of CDI in monitoring drought was assessed. To produce CDI, various remote sensing-based drought indices such as VCI, TCI, SMCI, and PCI were computed. In addition, in situ SPI-SPEI for different periods and detrended crop yield data were utilized. Subsequently, the remote sensing-based CDI was compared to in situ drought indices and detrended crop yield measurements (Figure 2).

Flowchart of the study.
2.3.1 Calculation of drought indices
In this research, two categories of drought indices were calculated and analyzed: remote sensing-based drought indices and in situ drought indices.
2.3.1.1 Remote sensing-based indices
The remote sensing-based indices were examined under two categories: single remote sensing drought indices and CDI. The GEE platform was utilized to carry out all mapping, time series analysis, and preprocessing of remote sensing data associated with these indices [24].
2.3.1.1.1 Single remote sensing drought index
Over the past few years, remote sensing systems have been extensively employed to monitor environmental phenomena, including drought, at different scales. In the field of drought research, commonly used indices such as VCI, TCI, PCI, and SMCI are utilized. These indices offer valuable insights into vegetation conditions, surface temperature, precipitation patterns, and soil moisture content [24,33,34]. The equations used to compute these indices are presented in Table 1. The index values are standardized on a scale of 0–100. The changes in these index values from 0 to 100 correspond to the transition from unfavorable to optimal conditions [10,35]. In the equations presented in Table 1, i represents the values for the corresponding month, and min and max correspond to the multi-year minimum and maximum NDVI, LST, precipitation, and soil moisture values.
Selected drought indices
| Drought index | Data source | Formula | Reference |
|---|---|---|---|
| VCI | MODIS | VCI = 100 ×
|
[33] |
| TCI | MODIS | TCI = 100 ×
|
[33] |
| PCI | CHIRPS | PCI = 100 ×
|
[35] |
| SMCI | ERA-5 | SMCI = 100 ×
|
[35] |
For the calculation of the VCI, the MOD13A2 1 km spatial resolution 16-day composite NDVI data were utilized, and the cloud-affected pixels were either weighted or removed based on the pixel reliability band “SummaryQA flags” of the MOD13A2. No additional geometric correction was performed for the MOD13A2 and MOD11A1 datasets [36]. In contrast, to calculate the PCI and SMCI, the CHIRPS precipitation and ERA-5 soil moisture data were adjusted to a spatial resolution of 1 km using the bilinear resampling technique [36].
2.3.1.1.2 CDI and PCA
The mixture of diverse datasets, considering the differential contributions of variables and components, is facilitated by adopting the combined index approach [37]. One of these approaches, PCA is widely used to identify dominant patterns in datasets in climate and drought studies [23,24,27]. The primary objective of PCA is to extract valuable insights from a multivariate dataset by constructing a fresh set of variables known as PCs. These components adeptly encapsulate the inherent variability in the original dataset while simultaneously reducing its dimensionality [25].
PCA is a statistical method that employs an orthogonal transformation to convert a set of observations into a new dataset. This transformation aims to filter the components of the original dataset while preserving the maximum variability [22].
Equation (1) provides the mathematical formula for CDI and outlines the fundamental structure that links the PCs to the original data [22,26].
where Z is the n × p matrix of PCs, in which p is the number of variables (e.g., VCI, TCI, SMCI, and PCI), n is the number of observations (e.g., number of years for a specific month), X is the n × p matrix of standardized observational data (the column mean subtracted from each element and divided by the column standard deviation), and E is the p × p matrix of eigen vectors. Nonetheless, in the case of orthogonal treatments, PCs are essentially independent vectors, and it is inappropriate to merge all of them into a single numerical representation [16]. According to the study by Keyantash and Dracup [22], it is recommended to utilize the first PC (PC1), as it preserves the maximum variability of the original datasets. In particular, if the eigenvector
The CDI values were normalized by dividing them by their standard deviation (equation (3)) [26]. Normalization is necessary to prevent significant spikes in the time series values of CDI caused by months with higher degrees of variability [26].
where
In this study, PCA was applied to extract the key information from the VCI, TCI, SMCI, and PCI. The previously calculated values of these indices were used as input for the PCA. It was observed that the PC1 consistently captured over 79% of the information contained in the VCI, TCI, SMCI, and PCI (Table S1). Therefore, PC1 was identified as the CDI [22]. By using the PCA method, CDI maps and time series were generated for the period of May to October from 2001 to 2020 in the Ergene Basin. In addition, in this study, the drought index values were divided into five categories based on conducted studies [15,24]. These drought categories are presented in Table S2.
2.3.1.2 In situ meteorological station measurement-based indices
The SPI and SPEI are widely used in drought studies, either derived solely from precipitation data or calculated using precipitation and temperature data [39].
The SPI, developed by [40], is calculated by dividing the difference between the precipitation in a specified period and the average of the same period across all historical years by the standard deviation. The SPEI, presented by [6], serves as an essential indicator of the climatological water balance, obtained by utilizing data on precipitation (P) and PET across diverse time intervals [41]. Moreover, these indices can be calculated for various time frames, including 1, 3, 6, 9, 12, 24, and 48 months.
In this study, the methodologies put forth by the studies by McKee et al. [40] and Vicente-Serrano et al. [6] were utilized to compute the SPI and SPEI, which were subsequently compared to the CDI as reference values.
Monthly average temperature and total precipitation data were obtained from the MGM for the meteorological stations situated within the basin, covering the period from 1991 to 2020. Following data acquisition, the obtained data underwent processing, and calculations were performed to compute the SPI and SPEI at 1-, 3-, and 6-month time scales. These calculations were carried out utilizing the “SPEI Package” within the RStudio environment. To calculate SPI and SPEI with a spatial resolution of 1 km, the inverse distance weighted interpolation method was employed by utilizing of the QGIS software. Subsequently, these raster datasets were uploaded onto the GEE platform to generate drought maps and time series encompassing the entire study period for the Ergene Basin.
2.3.2 Evaluation of CDI
Correlation analysis is a statistical methodology used to examine the degree of correlation between variables [20]. In the context of drought studies, Pearson correlation coefficients are frequently employed to explore the relationships and reliability of various indices [20].
In this study, the effectiveness of the CDI was assessed through the utilization of two separate datasets: standardized indices and crop yield data. Pearson correlation coefficients were employed to establish the relationship between CDI and the standardized indices, as well as CDI and crop yield. The objective was to evaluate the degree of agreement between CDI and the standardized indices, as well as CDI and crop yield.
2.3.2.1 Evaluation of CDI with in situ meteorological station measurement-based indices
SPI-SPEI are commonly used reference indices for the validation of drought indices [20]. In this regard, correlations between drought indices and these reference indices are utilized. In this study, standardized indices for the 1-, 3-, and 6-month time scales were generated for the May to October periods of the 20-year period. Subsequently, spatial correlation coefficient maps were produced to examine the relationship between these indices and CDI.
2.3.2.2 Evaluation of CDI with crop yield
Crop yield is often used to assess the performance of combined indices. This study focused on the relationship between CDI and the crop yield using sunflower cultivation data in the basin.
In the basin, primary crops include wheat, sunflower, corn, canola, and rice. Wheat and canola have growth periods from October to June, while rice and corn are often irrigated. This makes monitoring drought through satellite data for them challenging. Conversely, sunflower cultivation is particularly practiced during drought-prone months, often in rainfed or under limited irrigation conditions [42,43]. The cultivation of this plant under such conditions increases its sensitivity to extreme environmental conditions such as heat and drought [44,45]. This characteristic turns sunflower into an indicator where signs of climate changes can be observed earlier [46]. Sunflower cultivation covers about 40–45% of the arable land in the basin and is practiced on a rotating basis under rainfed conditions from April until October [32]. This cultivation period aligns with the May to October timeframe, which is the focus of this study’s seasonal investigation. This synchronization allows for a direct comparison between annual sunflower production data and the annual CDI values calculated for the May to October period.
The sunflower is a suitable crop to reflect the agricultural characteristics of the basin. Its growing period closely aligns with the seasonal study period, and its extensive and continuous cultivation in broad rainfed agricultural areas enhances the significance of this plant in representing the basin. Considering its sensitivity to climate changes, the use of sunflower production data specific to the basin is found to be highly meaningful when assessing the effectiveness of the CDI in evaluating agricultural drought in the basin.
In this context, the crop yield data for sunflower in the basin has been calculated as the ratio of production (tons) to the total cultivable area (hectares) [26,27]. It is influenced by factors such as technology, policy, and diseases [24]. However, the present study focuses on objectively assessing the impact of climatic conditions on sunflower yield. Non-climatic trends were eliminated, and the detrended yield data were analyzed in relation to the annual CDI values [26]. The crop yield time series for sunflower is shown in Figure 3.
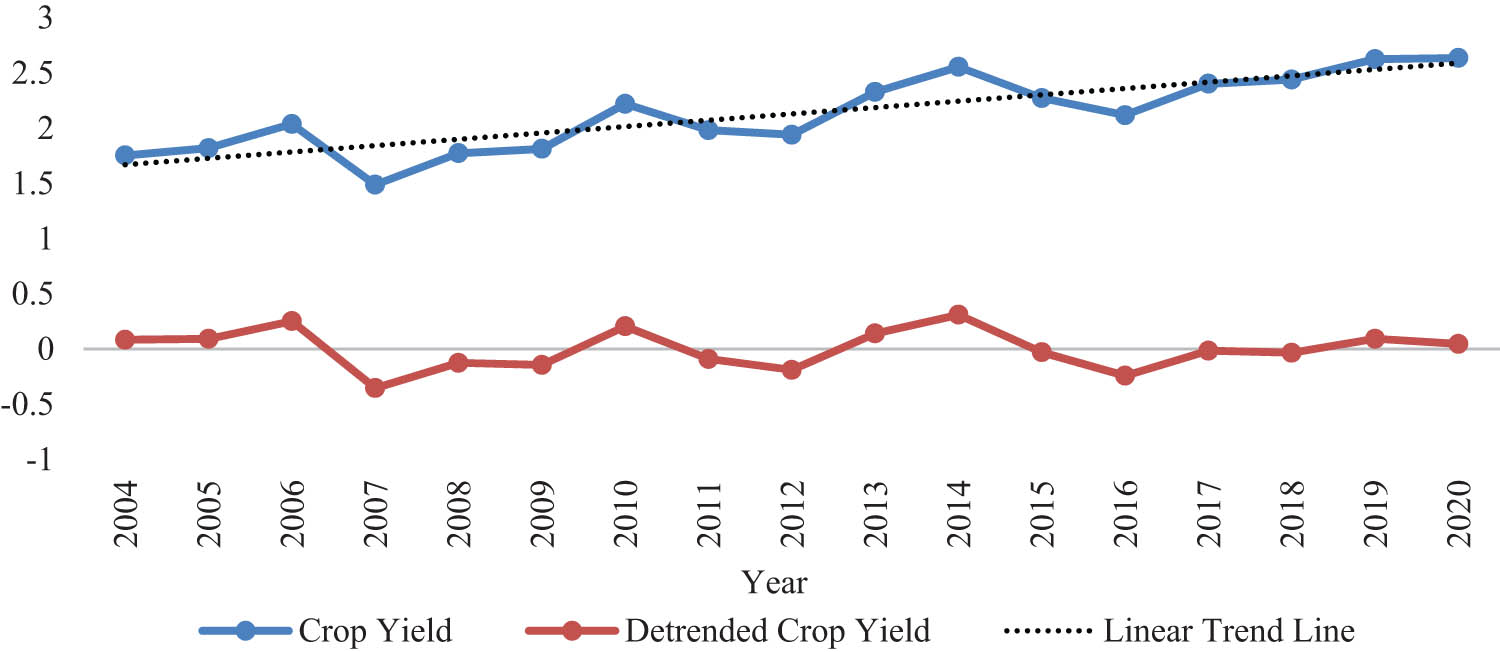
Crop yield pattern of sunflower cultivation in the basin before and after detrending.
3 Result and discussion
3.1 Temporal and spatial distribution characteristics of CDI
Time series of monthly CDI generated by using PCA is shown in Figure 4. According to Figure 4, at least 1 dry month occurs every year in the basin during this period. Moreover, CDI generally exhibited a similar pattern each year from May to October, fluctuating between values of 35 and 79. In addition, it was found that the peak and trough values of CDI varied according to the drought conditions experienced in the basin. According to Figure 4, the driest month in the basin was September 2001, while the wettest month was May 2011. The CDI time series for the May to October periods from 2001 to 2020 is illustrated in Figure 4.

CDI time series for the period from 2001 to 2020.
The examination of the drought behavior during the May to October period in the basin over a 20-year timeframe indicated a decrease in CDI values from May to September, followed by a slight increase from September to October, in conjunction with increasing temperatures and decreasing rainfall (Figure S1) (Figure 5a). The driest month in the basin was September, while the wettest month was May (Figure 5a). CDI values remained in the mild drought class for 3 months starting from August (Figure 5a). Furthermore, the spatial extent impacted by drought in the basin exhibited an upward trend until September, followed by a slight decline thereafter. Notably, in September, approximately 73% of the basin experienced drought, which decreased to 71% in October (as illustrated in Figure 5b). In May, merely 1% of the basin encountered extreme drought conditions, while this figure rose to 4% in August and reached 6% in September and October. Conversely, no areas exhibited extreme drought in June and July. Severe drought affected 1% of the basin in May and June, with the affected areas expanding from June to September before contracting in October. Moderate drought areas demonstrated an increase until September, followed by a marginal decrease in October. In addition, the extent of mild drought areas rose until July, then decreased in August and September, and again experienced an increase in October. Despite the reduction observed in August and September, there was an expansion in the geographical coverage of areas impacted by extreme, severe, and moderate drought.

(a) Average monthly CDI values for the period from 2001 to 2020 and (b) monthly percentage of drought grade area for the period from 2001 to 2020.
Figure 6 illustrates the average monthly drought map from May to October. In May, the drought-affected areas were concentrated in the southwestern part of the basin (Figure 6a). In June, most of these areas showed no signs of drought, except for some mild droughts in the northern region (Figure 6b). By July, the basin experienced mild drought conditions, which intensified in August with the emergence of severe and extreme droughts (Figure 6c and d). In September and October, the eastern and southern parts of the basin were particularly affected by severe and extreme droughts (Figure 6e and f). The average monthly drought maps provided an overview of the drought patterns in the basin.
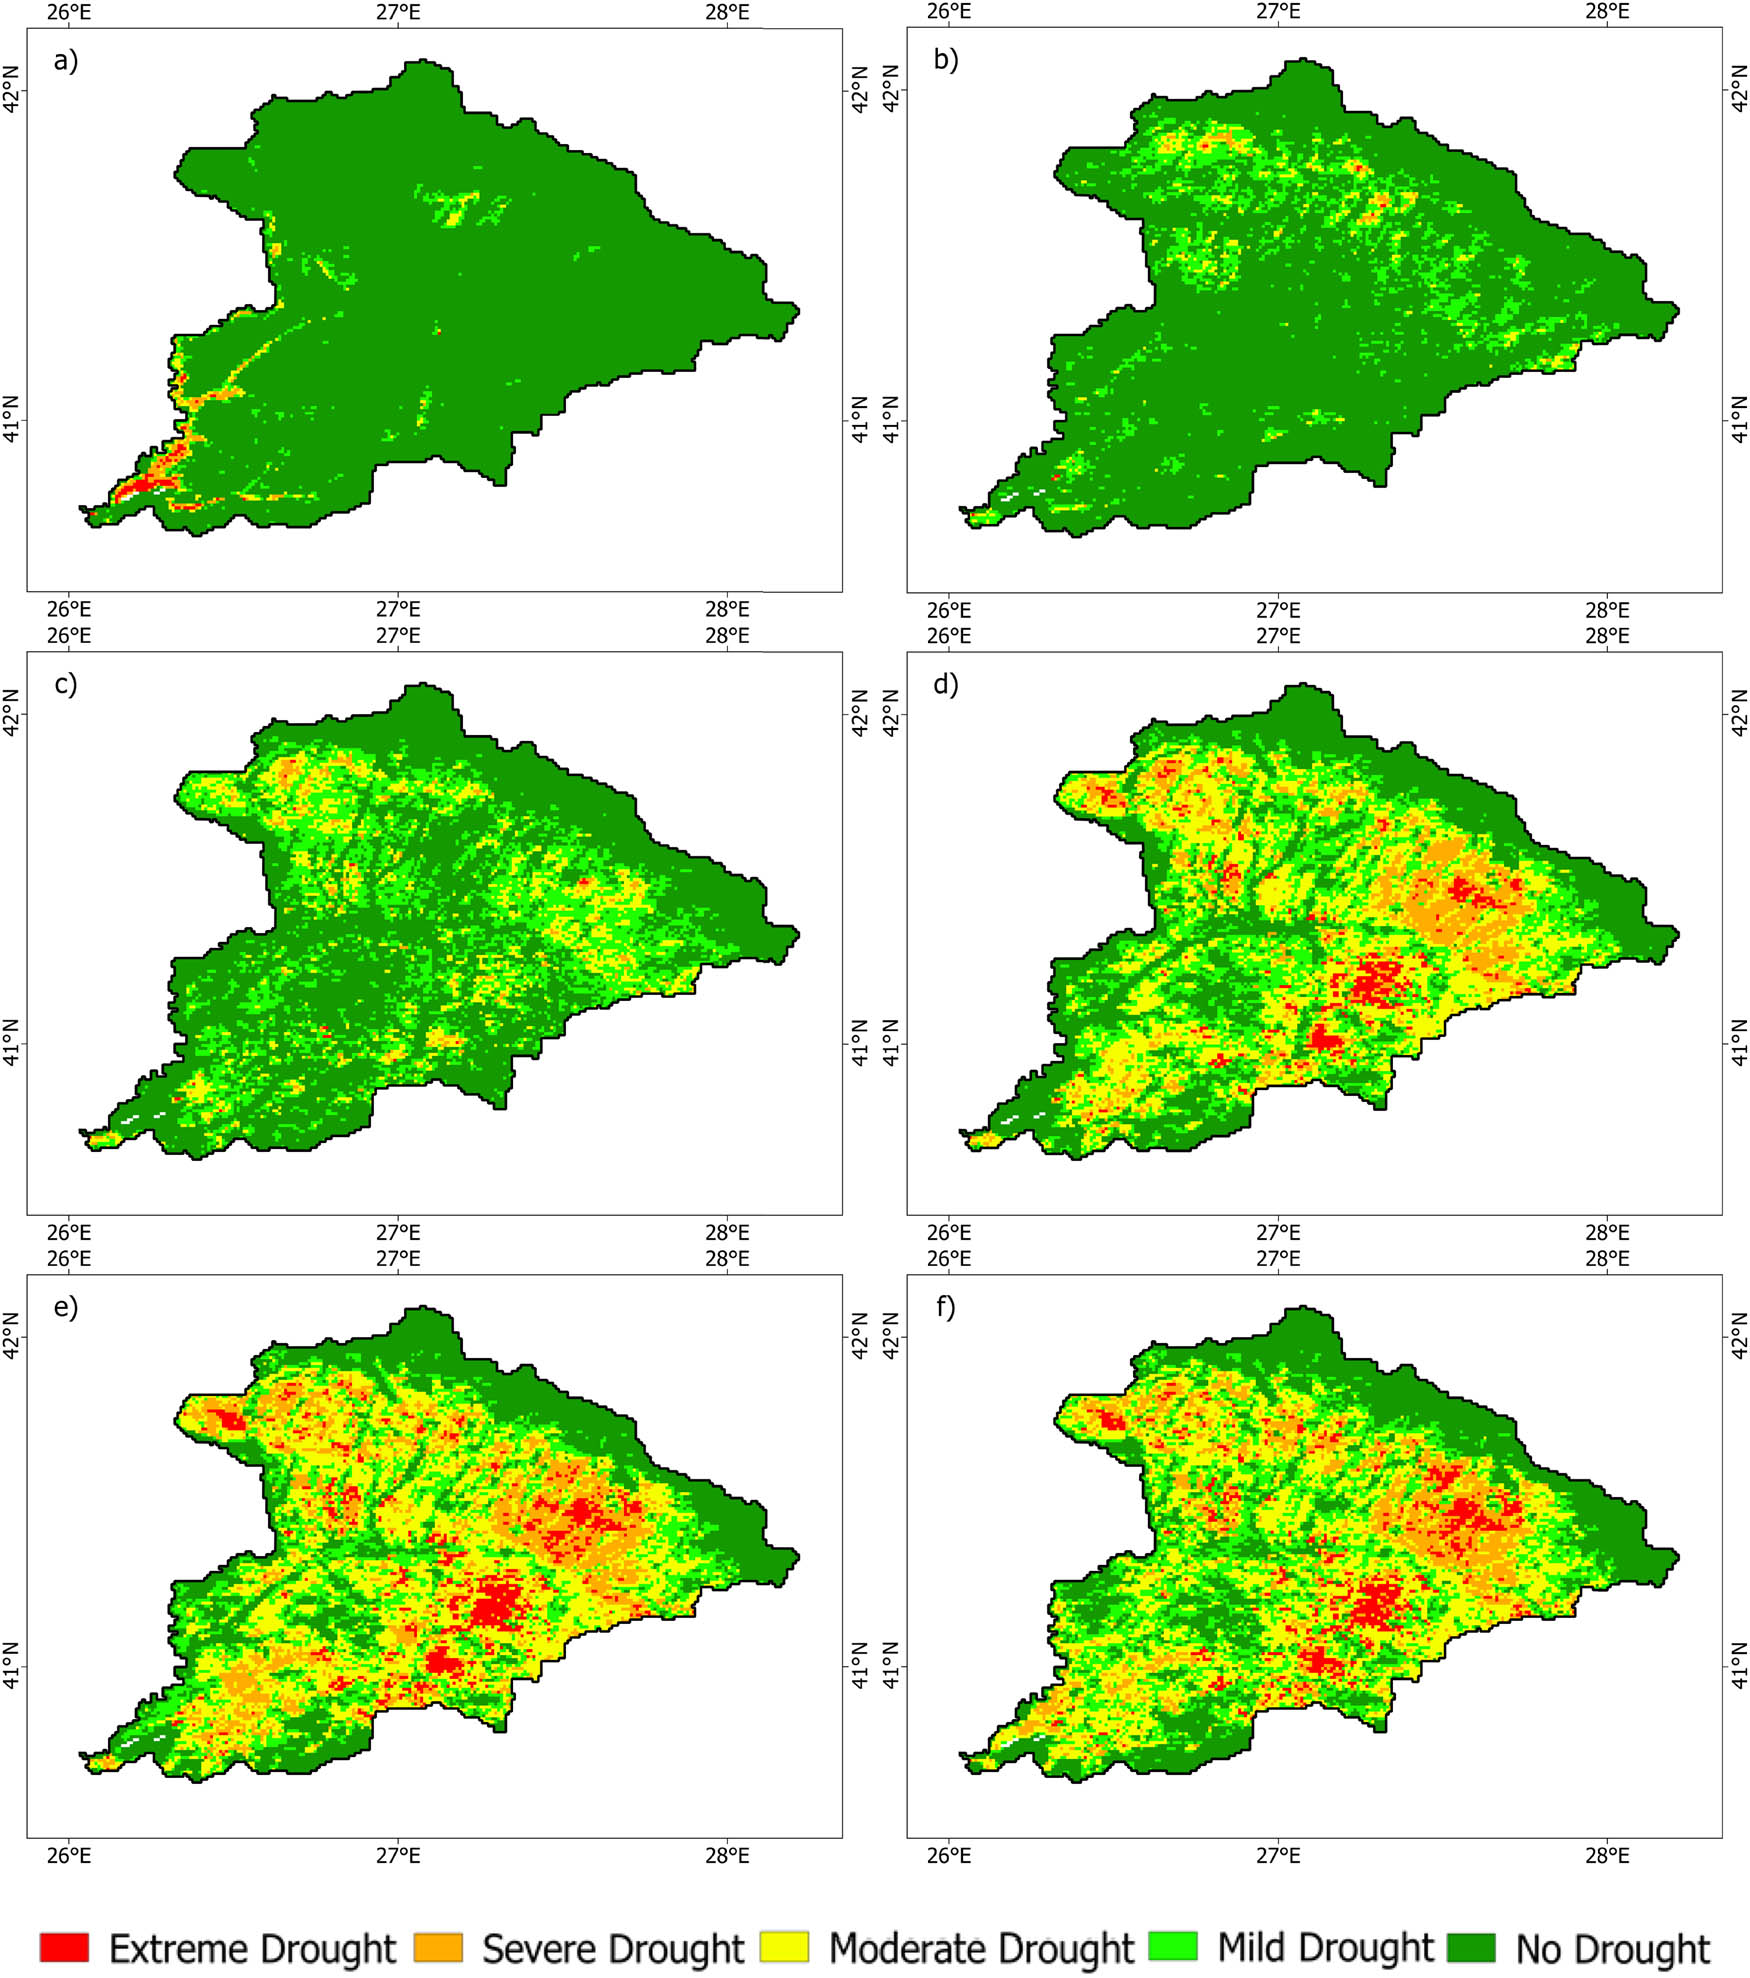
Monthly average drought maps for the period from 2001 to 2020: (a) May, (b) June, (c) July, (d) August, (e) September, and (f) October.
As shown in Figure 4, although CDI values generally followed a similar pattern throughout the study period, the peak and trough values varied depending on the drought conditions. While it was observed that at least 1 month of drought occurred in each year from 2001 to 2020 (Figure 4), the overall drought situation in the basin during the May to October period varied from year to year. This variability was reflected in the annual average CDI values, showing fluctuations between 44 and 59 (Figure 7a). Specifically, the CDI values for 2001, 2003, 2007, 2008, 2012, and 2016 indicated drought events in the basin (Figure 7a). The CDI values for 2009, 2013, and 2020 were on the threshold. It can be observed that drought events occurred approximately every 4 years in the basin since 2003, and the intensity of droughts decreased toward the end of the 20-year period (Figure 7a). The drought event in 2001 was the most severe and widespread among the mentioned years. Moreover, the wettest year was identified as 2014. In 2001, approximately 65% of the basin area was affected by drought, with over 11% classified as extreme, 17% as severe, 21% as moderate, and 16% as mild. In contrast, in 2014, about 69% of the basin area did not experience drought conditions (Figure 7b).

(a) Annual average CDI values, (b) annual percentage of drought grade area.
In 2001, the basin experienced the most widespread and intense drought, affecting 65% of the area during the 20-year period. The following year, in 2002, was significantly wetter. However, drought occurred again in 2003. After the drought in 2003, there was a recovery trend in the basin until 2006. However, the rate of recovery decreased from 2004 onward. Following this relatively wet period of 3 years, the basin was affected by drought again in 2007. The intensity of the drought in 2007 was equal to that of the drought in 2003. Despite a slight improvement after the drought in 2007, the basin continued to be affected by drought in 2008.
The drought impact in the basin decreased after the drought in 2007 and continued to decline until 2010. However, dry conditions intensified again in the basin after 2010, leading to the drought event in 2012. The drought in 2012 was the second most severe drought in the basin. Following a 2-year recovery period, the basin experienced its wettest year in 2014. After 2014, the basin became progressively drier each year until 2016. This trend culminated in the drought event of 2016. Subsequently, 2017 was wetter than 2016, 2018 was drier than 2017, and 2019 was wetter than 2018. 2020, on the other hand, was the driest year since 2016. The annual CDI change maps for the basin are shown in Figure S2.
Figure 8 displays the spatial distribution of the average CDI value (a) and the corresponding classifications (b) for the period from 2001 to 2020. The CDI values indicated that the majority of the study area predominantly encountered moderate and mild drought conditions (Figure 8a and b). Approximately 45% of the area fell within the CDI range of 30–50 (Figure 8c). Furthermore, the CDI values tended to be higher in areas where rainfed agriculture is practiced, as well as in forested regions. It was observed that areas most sensitive to drought were clustered in a crescent shape.

The spatial distribution of the average CDI values (a) and the classifications (b) from 2001 to 2020 and the statistical histogram of CDI values (c).
In summary, over the course of the 20-year study period from 2001 to 2020, approximately six drought events occurred, exhibiting a frequency of approximately one event every 4 years. Notably, the intensity of these drought events gradually declined as the study period progressed. The most severe and extensive drought event transpired in 2001, while the wettest year within the 20-year timeframe was observed in 2014. In addition, a decline in CDI values was observed from May onward during the May to October period, primarily due to rising temperatures and reduced precipitation. It was discerned that May represents the month with the wettest condition, while September is characterized as the driest month within the study area. Furthermore, it was revealed that areas most susceptible to drought are spatially concentrated in a crescent shape within the basin.
In recent years, drought, which is one of the most devastating climate-related disasters, has been occurring with increased frequency, intensity, and duration in Europe [47]. The southeastern European countries neighboring Türkiye’s northwest border had experienced drought events in 2001–2002, 2003–2004, 2007–2008, 2011–2013, 2016–2017, 2018–2019, and 2020 [48,49,50]. In Türkiye, widespread and severe droughts occurred in 2001, 2007–2008, 2013–2014, and 2020–2021 [51,52,53,54]. This study also indicated that the annual CDI values confirmed the occurrence of drought in the basin during the years 2001, 2003, 2007, 2008, 2012, and 2016. Furthermore, the values for 2009, 2013, and 2020 were at the threshold. These findings are consistent with the findings of previous studies [48,49,50,51,52,53,54].
3.2 Evaluation of CDI with standardized indices
SPI and SPEI are commonly used meteorological drought indices to assess drought conditions across different time scales [20]. In the Ergene basin, the performance of CDI in drought monitoring was evaluated by comparing the time series of CDI with SPI-SPEI at various time scales from 2001 to 2020. As shown in Figures S3 and S6, CDI exhibited good consistency in fluctuation with the standardized indices at a 1-month time scale. The temporal fluctuations of the 1-month indices and CDI are particularly consistent, especially from 2010 onward. With the 3-month indices, CDI showed consistent fluctuations in some periods (Figures S4 and S7). The time series of CDI and the meteorological indices at a 3-month scale demonstrated strong consistency, especially from 2003 to 2006, 2012 to 2014, and 2018 to 2020, although generally weaker consistency compared to the 1-month indices. However, with the 6-month SPI-SPEI, CDI showed consistency only in a few periods (Figures S5 and S8). In conclusion, the change trends of CDI and the 1-month meteorological indices appear to be similar. Figures S3–S8 present the temporal variations of CDI and SPI-SPEI at various time scales (1, 3, and 6 months).
On the other hand, to better evaluate CDI’s drought monitoring capability, the correlations between CDI and multitemporal SPI-SPEI were assessed spatially. The highest correlation and consistency were observed between CDI and 1-month meteorological indices, covering the largest area (Figure 9). The correlation values between CDI and 1-month indices concentrated between 0.5 and 1. Nevertheless, the correlation values in the southwestern part of the basin demonstrated lower values. Moreover, as the time scale expanded, the breadth of areas displaying high correlation and strong consistency diminished. CDI displayed a substantial correlation with 3-month indices, with correlation values varying from 0.4 to 0.7. Conversely, the correlation values between CDI and 6-month SPI-SPEI predominantly fell within the range of 0.2–0.5, indicating significant areas with limited correlation. Furthermore, when SPI and SPEI were compared separately with CDI, SPEI showed higher correlations with CDI compared to SPI for the same period. Maps depicting the spatial distribution of correlations between CDI and meteorological indices are shown in Figure 9.

CDI correlation maps: (a) SPI-1, (b) SPI-3, (c) SPI-6, (d) SPEI-1, (e) SPEI-3, and (f) SPEI-6.
The correlation analysis between CDI and 1-month SPI-SPEI revealed a more robust relationship in comparison to other time scales, consistent with prior studies [15,17,19,20,55,56]. Interestingly, when comparing the SPI and SPEI for the same period, the correlation between CDI and SPEI was higher than that of SPI. This finding contradicts the results of previous studies [19,56].
3.3 Evaluation of CDI with crop yield
The crop yield is often used as an independent variable for assessing the CDIs. In this research, the correlation coefficient analysis was employed to examine the connection between the detrended crop yield and the CDI. It became evident that the sunflower crop directly reflects the impacts of agricultural drought in the basin. Therefore, a year-to-year comparison was made using the annual detrended data of sunflower crop yield and the annual CDI (averaged for the May to October study period) values of the basin [20,27]. As a result of this comparison, a strong and linear statistical relationship (r = 0.79) was found between CDI values and detrended crop yield data of sunflower. This indicates that the fluctuations in CDI can reflect the changes in crop yield in the basin. This finding is consistent with the results of previous studies [20,27,57,58], which contrast with the studies by Du et al. [24] and Bayissa et al. [26] that characterized this relationship as weak. The time series of the data used in the comparison is shown in Figure 10.
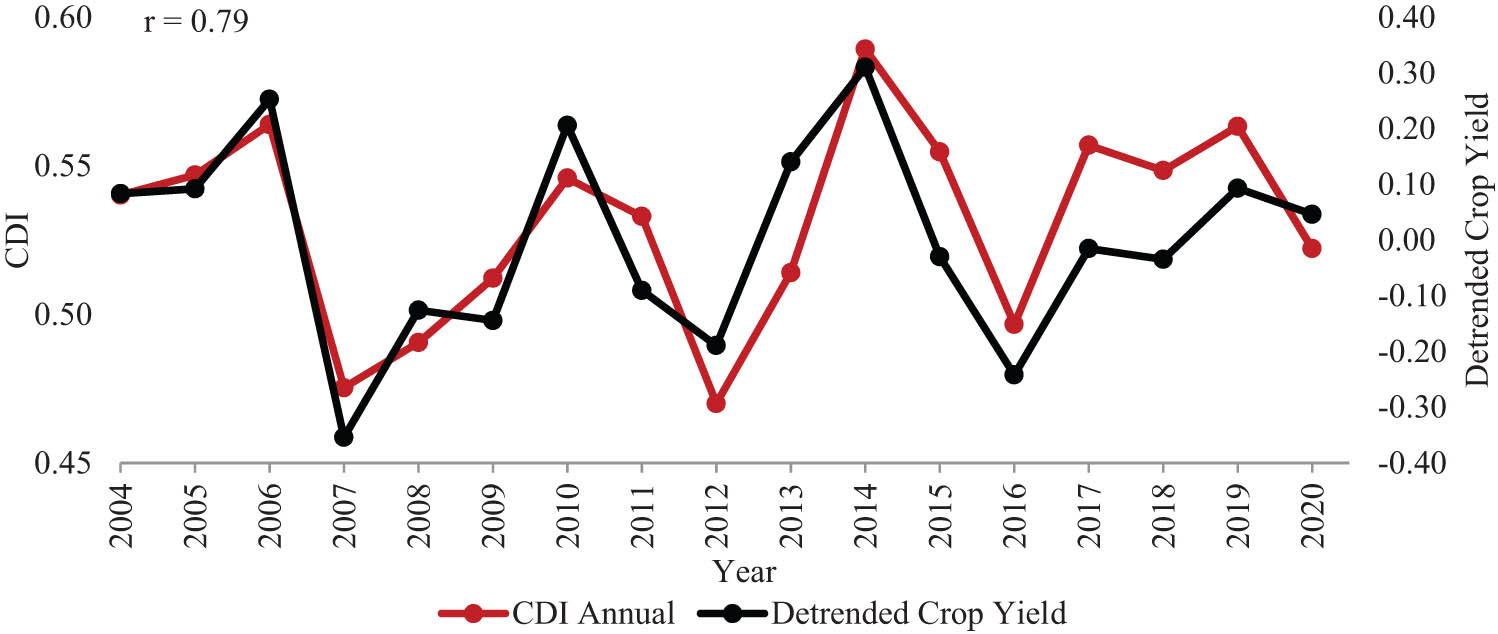
Time series of annual CDI and detrended crop yield for sunflower.
In conclusion, the CDI exhibited a stronger correlation with 1-month SPI-SPEI compared to other time scales of meteorological indices. In additionally, it showed a high correlation with crop yield data. These findings suggest that CDI has the potential to serve as a reliable indicator for monitoring meteorological and agricultural drought in the examined region. Moreover, it is anticipated that the Mediterranean region, encompassing Türkiye as well, will endure significant drought repercussions as a consequence of climate change. This, in turn, will adversely affect agricultural output [59]. In this context, sunflower can be considered as an indicator plant for detecting drought in this region.
4 Conclusions
Drought, a natural occurrence with negative impacts across multiple domains, necessitates sustainable and effective monitoring due to its harmful effects on society and the ecosystem. Remote sensing methodologies, renowned for their extensive coverage and frequent temporal observations, are extensively employed to fulfill this purpose.
In this study, a detailed and accurate drought analysis was conducted in the Ergene Basin, and a new combined index incorporating vegetation condition, surface temperature, precipitation, and soil moisture was proposed. The CDI was derived by combining the VCI, TCI, PCI, and SMCI by using PCA. This combined index was then used to analyze the spatial distribution and temporal drought changes in the Ergene Basin from 2001 to 2020. In addition, the performance of CDI in monitoring and assessing drought was evaluated by comparing it with standardized indices and crop yield data. The study utilized not only remote sensing data but also in situ observations. The MODIS 1 km spatial resolution 16-day NDVI, 1 km spatial resolution daily LST, 0.05° spatial resolution CHIRPS precipitation dataset, and 0.1° spatial resolution ERA-5 Soil Moisture data were used as the remote sensing datasets. In addition, precipitation and temperature data from meteorological stations in Çorlu, Edirne, İpsala, Kırklareli, Lüleburgaz-Tigem, Malkara, and Tekirdağ were utilized to calculate SPI and SPEI.
According to the analysis, it was found that there was at least one drought month in the basin every year from 2001 to 2020. CDI values ranged from 35 to 79, indicating varying degrees of drought in the basin. It was determined that the wettest month in the May to October period is May, while the driest month is September. The degree of drought and the affected area in the basin showed an increasing trend followed by a decreasing trend during this period.
Based on the annual variations in CDI, the most intense and widespread drought in the basin occurred in 2001. Furthermore, these changes indicate that a drought event occurred on average every 4 years in the basin from 2003 to 2020, with drought intensity decreasing toward the end of the 20 years.
In addition, the CDI demonstrates the strongest correlation with 1-month SPI-SPEI when comparing CDI to other time scales. When assessing CDI in comparison to SPI-SPEI individually, it becomes apparent that SPEI exhibits a higher correlation with CDI than SPI for the corresponding period. Moreover, there is a substantial correlation (r = 0.79) between CDI values and sunflower crop yield data. The CDI maps also reveal a remarkable consistency in the spatial distribution of drought, revealing clusters of heightened vulnerability arranged in a crescent-like pattern.
Briefly, the high correlation of CDI’s SPI-SPEI in short periods (1 and 3 months) and crop yield demonstrates its effectiveness in monitoring meteorological and agricultural droughts. In addition, the alignment between the drought years identified by the annual CDI for the period 2001–2020 and the documented drought years in Türkiye and the southeastern European countries adjacent to the northwest border of Türkiye further validates the competence of CDI in drought studies.
This study highlights how PCA-based CDI can contribute to improved drought management practices, more accurate crop yield estimation, and the creation of customized drought mitigation strategies in the Ergene Basin.
Drought monitoring is still the main challenge in a relatively changing environment. It is worth mentioning that the input parameters used in this study were available in different spatial resolutions. While some datasets were only available in a coarse resolution, they still represent spatial variability. However, for future research, it is recommended to use high-resolution input data to enhance the accuracy of the results.
Acknowledgments
All authors thank the anonymous reviewers and the editor for the constructive comments on the earlier version of the manuscript. We would like to thank all data providers. Agricultural production statistics were obtained from the Turkish Statistical Institute (TURKSTAT) database. Meterological station based data were provided from the General Directorate of Meteorology (MGM). The research presented in this article constitutes the first author’s PhD thesis study at the Graduate School of İstanbul Technical University.
-
Author contributions: Conceptualization, K.A.G and F.B.B.; methodology, K.A.G, F.B.B., T.E. and C.K.; formal analysis, K.A.G.; data curation, K.A.G; writing—original draft preparation, K.A.G.; writing—review and editing, K.A.G., F.B.B., T.E. and C.K.; visualization, K.A.G. and F.B.B. All authors have read and agreed to the published version of the manuscript.
-
Conflict of interest: Authors state no conflict of interest.
References
[1] Páscoa P, Gouveia C, Russo A, Bojariu R, Vicente-Serrano S, Trigo R. Drought impacts on vegetation in southeastern Europe. Remote Sens. 2020;12:2156. 10.3390/rs12132156.Search in Google Scholar
[2] Erkoç MH. A scientific analysis on the water levels of lake Beysehir and drought conditions in the area. Bull Geophys Oceanogr. 2023;64(3):317–30. 10.4430/bgo00426.Search in Google Scholar
[3] Sun XF, Wang M, Li G, Wang Y. Regional-scale drought monitor using synthesized index based on remote sensing in northeast China. Open Geosci. 2020;12:163–73. 10.1515/geo-2020-0037.Search in Google Scholar
[4] Harriette A, Ngetich F, Okeyo J. Spatial evaluation of droughts using selected satellite-based indices in the upper Tana River Watershed. Kenya. Int J Plant Soil Sci. 2019;30(1):1–13. 10.9734/ijpss/2019/v30i130164.Search in Google Scholar
[5] Ghulam A, Qin Q, Teyip T, ZL LI. Modified Perpendicular Drought Index (MPDI): a real-time drought monitoring method. ISPRS J Photogramm Remote Sens. 2007;62(2):150–64. 10.1016/j.isprsjprs.2007.03.002.Search in Google Scholar
[6] Vicente-Serrano SM, Beguería S, JLópez-Moreno JI. A multiscalar drought index sensitive to global warming: The standardized precipitation evapotranspiration index. J Clim. 2010;23(7):1696–718. 10.1175/2009JCLI2909.1.Search in Google Scholar
[7] Renza D, Martinez E, Arquero A, Sánchez-Lladó J. Drought Estimation Maps by Means of Multidate Landsat Fused Images. Proceedings of the 30th EARSeL Symposium. Paris, France: 2010 31 May–03 Jun.Search in Google Scholar
[8] Tatem J, Goetz SJ, Hay SI. Fifty years of earth observation satellites: Views from above have lead to countless advances on the ground in both scientific knowledge and daily life. Am Sci. 2008;96(5):390–8.10.1511/2008.74.390Search in Google Scholar PubMed PubMed Central
[9] AghaKouchak A, Farahmand A, Melton FS, Teixeira J, Anderson MC, Wardlow BD, et al. Remote Sensing of drought: Progress, challenges and opportunities. Rev Geophys. 2015;53:452–81. 10.1002/2014RG000456.Search in Google Scholar
[10] Du TL, Bui DD, Nguyen MD, Lee H. Satellite-based, multi-indices for evaluation of agricultural droughts in a highly dynamic tropical catchment, central Vietnam. Water. 2018;10(5):659. 10.3390/w10050659.Search in Google Scholar
[11] Waseem M, Ajmal M, Kim TW. Development of a new composite drought index for multivariate drought assessment. J Hydrol. 2015;527:30–7. 10.1016/j.jhydrol.2015.04.044.Search in Google Scholar
[12] Xu K, Yang D, Xu X, Lei H. Copula based drought frequency analysis considering the spatio-temporal variability in Southwest China. J Hydrol. 2015;527:630–40. 10.1016/j.jhydrol.2015.05.030.Search in Google Scholar
[13] Yang J, Chang J, Wang Y, Li Y, Hu H, Chen Y, et al. Comprehensive drought characteristics analysis based on a nonlinear multivariate drought index. J Hydrol. 2018;557:651–67. 10.1016/j.jhydrol.2017.12.055.Search in Google Scholar
[14] Hao Z, Singh VP. Drought characterization from a multivariate perspective: A review. J Hydrol. 2015;527:668–78. 10.1016/j.jhydrol.2015.05.031.Search in Google Scholar
[15] Karimi M, Shahedi K, Raziei T, Miryaghoubzadeh M. Meteorological and agricultural drought monitoring in Southwest of Iran using a remote sensing-based combined drought index. Stoch Environ Res Risk Assess. 2022;36:3707–24. 10.1007/s00477-022-02220-3.Search in Google Scholar
[16] Liu Y, Zhu RL, Yong B, Singh VP, Yuan F, Jiang S, et al. On the mechanisms of two composite methods for construction of multivariate drought indices. Sci Total Environ. 2019;647:981–91. 10.1016/j.scitotenv.2018.07.273.Search in Google Scholar PubMed
[17] Jiao W, Tian C, Chang Q, Novick K, Wang L. A new multi-sensor integrated index for drought monitoring. Agric For Meteorol. 2019;268:74–85. 10.1016/j.agrformet.2019.01.008.Search in Google Scholar
[18] Liu Q, Zhang S, Zhang H, Bai Y, Zhang J. Monitoring drought using composite drought indices based on remote sensing. Sci Total Environ. 2020;711:134585. 10.1016/j.scitotenv.2019.134585.Search in Google Scholar PubMed
[19] Hao C, Zhang J, Yao F. Combination of multi-sensor remote sensing data for drought monitoring over Southwest China. Int J Appl Earth Obs Geoinf. 2015;35(B):270–83. 10.1016/j.jag.2014.09.011.Search in Google Scholar
[20] Wei W, Zhang J, Zhou J, Zhou L, Xie B, Li C. Monitoring drought dynamics in China using Optimized Meteorological Drought Index (OMDI) based on remote sensing data sets. J Environ Manag. 2021;292:112733. 10.1016/j.jenvman.2021.112733.Search in Google Scholar PubMed
[21] Wei W, Zhang J, Zhou L, Xie B, Zhou J, Li C. Comparative evaluation of drought indices for monitoring drought based on remote sensing data. Environ Sci Pollut Res. 2021;28:20408–25. 10.1007/s11356-020-12120-0.Search in Google Scholar PubMed
[22] Keyantash JA, Dracup JA. An aggregate drought index: assessing drought severity based on fluctuations in the hydrologic cycle and surface water storage. Water Resour Res. 2004;40(9):1–13. 10.1029/2003WR002610.Search in Google Scholar
[23] Gocic M, Trajkovic S. Spatiotemporal characteristics of drought in Serbia. J Hydrol. 2014;510:110–23. 10.1016/j.jhydrol.2013.12.030.Search in Google Scholar
[24] Du L, Qingjiu Tian Q, Yu T, Meng Q, Jancso T, Udvardy P, et al. A comprehensive drought monitoring method integrating MODIS and TRMM data. Int J Appl Earth Observation Geoinf. 2013;23:245–53. 10.1016/j.jag.2012.09.010.Search in Google Scholar
[25] Abdi H, Williams LJ. Principal component analysis. WIREs Comput Stat. 2010;2(4):433–59. 10.1002/wics.101.Search in Google Scholar
[26] Bayissa Y, Tadesse T, Svoboda M, Wardlow B, Poulsen C, Swigart J, et al. Developing a satellite-based combined drought indicator to monitor agricultural drought: a case study for Ethiopia. GISci Remote Sens. 2018;56(5):718–48. 10.1080/15481603.2018.1552508.Search in Google Scholar
[27] Kulkarni SS, Wardlow BD, Bayissa YA, Tadesse T, Svoboda MD, Gedam SS. Developing a remote sensing-based combined drought indicator approach for agricultural drought monitoring over Marathwada India. Remote Sens. 2020;12(13):2091. 10.3390/rs12132091.Search in Google Scholar
[28] Kahraman AC, Özkul M. Situation assessment report II of protection action plan of Ergene Basin. Retrieved August 2018. 20:2023. https://marmara.gov.tr/UserFiles/Attachments/2018/12/28/5b310972-a243-4ad4-b777-d64bf43365a0.pdf.Search in Google Scholar
[29] Directorate General for State Hydraulic Works (DSI). Meriç-Ergene and Northern Marmara Basins Master Plan Report. Ankara, Türkiye: 2018.Search in Google Scholar
[30] Turkstat. 2022. Address-based population registration system results. Turkish Statistical Institute (TURKSTAT), Population Data, Retrieved August 20, 2023, https://biruni.tuik.gov.tr/medas/? locale = tr.Search in Google Scholar
[31] Ministry of Agriculture and Forestry of Turkish Republic. Meriç-Ergene drought management plan strategic environmental assessment draft scopeing report. Retrieved August, 20, 2023, https://www.tarimorman.gov.tr/SYGM/Belgeler/Meriç%20Marmara%20SÇD%20Taslak/Meric_Ergene_Kurkalık_SCD_taslak_Kapsam_Belirleme_Raporu.pdf. 2022.Search in Google Scholar
[32] Turkstat. 2022. Agricultural production statistics. Turkish Statistical Institute (TURKSTAT), Agricultural Production Data (tons), Total Cultivable Area Data (hectares). Retrieved August 20, 2023, https://biruni.tuik.gov.tr/medas/?locale=tr.Search in Google Scholar
[33] Kogan FN. Application of vegetation index and brightness temperature for drought detection. Adv Space Res. 1995;15(11):91–100. 10.1016/0273-1177(95)00079-T.Search in Google Scholar
[34] Zhang AZ, Jia GS. Monitoring meteorological drought in semiarid regions using multi-sensor microwave remote sensing data. Remote Sens Environ. 2013;134:12–23. 10.1016/j.rse.2013.02.023.Search in Google Scholar
[35] Khan R, Gilani H, Iqbal N, Shahid I. Satellite based (2000–2015) drought hazard assessment with indices, mapping, and monitoring of Potohar plateau, Punjab, Pakistan. Environ Earth Sci. 2020;79:23. 10.1007/s12665-019-8751-9.Search in Google Scholar
[36] Sandeep P, Reddy GPO, Jegankumar R, Arun Kumar KC. Monitoring of agricultural drought in semi-arid ecosystem of Peninsular India through indices derived from time-series CHIRPS and MODIS datasets. Ecol Indic. 2021;121:107033. 10.1016/j.ecolind.2020.107033.Search in Google Scholar
[37] Mainali J, Pricope NG. High-resolution spatial assessment of population vulnerability to climate change in Nepal. Appl Geogr. 2017;82:66–82. 10.1016/j.apgeog.2017.03.008.Search in Google Scholar
[38] Bazrafshan J, Hejabi S, Rahimi J. Drought monitoring using the Multivariate Standardized Precipitation index (MSPI). Water Resour Manage. 2014;28:1045–60. 10.1007/s11269-014-0533-2.Search in Google Scholar
[39] Hu Z, Chen X, Chen D, Li J, Wang S, Zhou Q, et al. Dry gets drier, wet gets wetter: a case study over the arid regions of central Asia. Int J Climatol. 2019;39(2):1072–91. 10.1002/joc.5863.Search in Google Scholar
[40] McKee TB, Doesken NJ, Kleist J. The relation of drought frequency and duration to time scales. Proceedings of the Eight Conference on Applied Climatology. Anaheim, California, USA: 1993 January. p. 17–22.Search in Google Scholar
[41] Stagge JH, Tallaksen LM, Gudmundsson L, Van Loon AF, Stahl K. Candidate distributions for climatological drought indices (SPI and SPEI). Int J Climatol. 2015;35(13):4027–40. 10.1002/joc.4267.Search in Google Scholar
[42] Gurkan H, Ozgen Y, Bayraktar N, Bulut H, Yildiz M. Possible impacts of climate change on sunflower yield in Turkey. In: Amanullah, editor. Agronomy – Climate Change & Food Security. London, UK: IntechOpen; 2020. p. 25–34. 10.5772/intechopen.91062.Search in Google Scholar
[43] Hussain M, Farooq S, Hasan W, Ul-Allah S, Tanveer M, Farooq M, et al. Drought stress in sunflower: Physiological effects and its management through breeding and agronomic alternatives. Agric Water Manag. 2018;201:152–66. 10.1016/j.agwat.2018.01.028.Search in Google Scholar
[44] Pekcan V, Evci G, Yilmaz MI, Nalcaiyi ASB, Erdal ŞÇ, Cicek N, et al. Drought effects on yield traits of some sunflower inbred lines. Agric For. 2015;61(4):101–7.10.17707/AgricultForest.61.4.10Search in Google Scholar
[45] Robert GA, Rajasekar M, Manivannan P. Triazole-induced drought stress amelioration on growth yield, and pigments composition of Helianthus annuus L. (sunflower). Int Multidiscip Res J. 2016;5:6–15.10.1007/s13204-015-0482-ySearch in Google Scholar
[46] Debaeke P, Bedoussac L, Bonnet C, Bret-Mestries E, Seassau C, Gavaland A, et al. Sunflower crop: environmental-friendly and agroecological. Oilseed Fats Crop Lipids. 2017;23:1–12.10.1051/ocl/2017020Search in Google Scholar
[47] Spinoni J, Antofie T, Barbosa P, Bihari Z, Lakatos M, Szalai S, et al. An overview of drought events in the Carpathian Region in 1961-2010. Adv Sci. 2013;10:21–32. 10.5194/asr-10-21-2013.Search in Google Scholar
[48] Blauhut V, Stoelzle M, Ahopelto L, Brunner M, Teutschbein C, Wendt D, et al. Lessons from the 2018–2019 European droughts: A collective need for unifying drought risk management. Nat Hazards Earth Syst Sci. 2021;22(6):2201–17. 10.5194/nhess-2021-276.Search in Google Scholar
[49] Ionita M, Nagavciuc V. Changes in drought features at the European level over the last 120 years. Nat Hazards Earth Syst Sci. 2021;21(5):1685–701. 10.5194/nhess-21-1685-2021.Search in Google Scholar
[50] GDO (2023) - Drought Events. Global Drought Observatory (GDO), Retrieved August 20, 2023, https://edo.jrc.ec.europa.eu/gdo/php/index.php? id = 2020.Search in Google Scholar
[51] Patel K. Turkey Experiences Intense Drought. NASA Earth Observatory. Retrieved August 20, 2023, https://earthobservatory.nasa.gov/images/147811/turkey-experiences-intense-drought. 2021.Search in Google Scholar
[52] Türkes M, Tatlı H. Use of the standardized precipitation index (SPI) and a modified SPI for shaping the drought probabilities over Turkey. Int J Climatol. 2009;29:2270–82. 10.1002/joc.1862.Search in Google Scholar
[53] Kurnaz L. Drought in Turkey. Istanbul Policy Center Sabancı Üniversitesi. 2014. Retrieved August, 20, 2023, https://ipc.sabanciuniv.edu/Content/Images/CKeditorImages/20200323-16034498.pdf.Search in Google Scholar
[54] Pekpostalci SD, Tur R, Mehr AD, Ghaffari AMV, Dąbrowska D, Nourani V. Drought monitoring and forecasting across Turkey: A contemporary review. Sustainability. 2023;15(7):6080. 10.3390/su15076080.Search in Google Scholar
[55] Zhang L, Jiao W, Zhang H, Huang C, Tong Q. Studying drought phenomena in the Continental United States in 2011 and 2012 using various drought indices. Remote Sens Environ. 2017;190:96–106. 10.1016/j.rse.2016.12.010.Search in Google Scholar
[56] Wang K, Li T, Wei J. Exploring drought conditions in the three river headwaters region from 2002 to 2011 using multiple drought indices. Water. 2019;11(2):190. 10.3390/w11020190.Search in Google Scholar
[57] Vyas SS, Bhattacharya KB, Nigam R, Guhathakurta P, Gosh K, Chattopadhyay N. A combined deficit index for regional agricultural drought assessment over semi-arid tract of India using geostationary meteorological satellite data. Int J Appl Earth Obs Geoinf. 2015;39:28–39. 10.1016/j.jag.2015.02.009.Search in Google Scholar
[58] Tadesse T, Champagne C, Wardlow BD, Hadwen TA, Brown JF, Demisse GB, et al. Building the vegetation drought response index for Canada (Vegdri-Canada) to monitor agricultural drought: first results. GISci Remote Sens. 2017;54(2):230–57. 10.1080/15481603.2017.1286728.Search in Google Scholar
[59] IPCC. Climate change 2014: synthesis report, contribution of working groups I, II and III to the fifth assessment report of the intergovernmental panel on climate change. 2014. Retrieved August, 20, 2023, https://www.ipcc.ch/site/assets/uploads/2018/05/SYR_AR5_FINAL_full_wcover.pdf.Search in Google Scholar
© 2023 the author(s), published by De Gruyter
This work is licensed under the Creative Commons Attribution 4.0 International License.
Articles in the same Issue
- Regular Articles
- Diagenesis and evolution of deep tight reservoirs: A case study of the fourth member of Shahejie Formation (cg: 50.4-42 Ma) in Bozhong Sag
- Petrography and mineralogy of the Oligocene flysch in Ionian Zone, Albania: Implications for the evolution of sediment provenance and paleoenvironment
- Biostratigraphy of the Late Campanian–Maastrichtian of the Duwi Basin, Red Sea, Egypt
- Structural deformation and its implication for hydrocarbon accumulation in the Wuxia fault belt, northwestern Junggar basin, China
- Carbonate texture identification using multi-layer perceptron neural network
- Metallogenic model of the Hongqiling Cu–Ni sulfide intrusions, Central Asian Orogenic Belt: Insight from long-period magnetotellurics
- Assessments of recent Global Geopotential Models based on GPS/levelling and gravity data along coastal zones of Egypt
- Accuracy assessment and improvement of SRTM, ASTER, FABDEM, and MERIT DEMs by polynomial and optimization algorithm: A case study (Khuzestan Province, Iran)
- Uncertainty assessment of 3D geological models based on spatial diffusion and merging model
- Evaluation of dynamic behavior of varved clays from the Warsaw ice-dammed lake, Poland
- Impact of AMSU-A and MHS radiances assimilation on Typhoon Megi (2016) forecasting
- Contribution to the building of a weather information service for solar panel cleaning operations at Diass plant (Senegal, Western Sahel)
- Measuring spatiotemporal accessibility to healthcare with multimodal transport modes in the dynamic traffic environment
- Mathematical model for conversion of groundwater flow from confined to unconfined aquifers with power law processes
- NSP variation on SWAT with high-resolution data: A case study
- Reconstruction of paleoglacial equilibrium-line altitudes during the Last Glacial Maximum in the Diancang Massif, Northwest Yunnan Province, China
- A prediction model for Xiangyang Neolithic sites based on a random forest algorithm
- Determining the long-term impact area of coastal thermal discharge based on a harmonic model of sea surface temperature
- Origin of block accumulations based on the near-surface geophysics
- Investigating the limestone quarries as geoheritage sites: Case of Mardin ancient quarry
- Population genetics and pedigree geography of Trionychia japonica in the four mountains of Henan Province and the Taihang Mountains
- Performance audit evaluation of marine development projects based on SPA and BP neural network model
- Study on the Early Cretaceous fluvial-desert sedimentary paleogeography in the Northwest of Ordos Basin
- Detecting window line using an improved stacked hourglass network based on new real-world building façade dataset
- Automated identification and mapping of geological folds in cross sections
- Silicate and carbonate mixed shelf formation and its controlling factors, a case study from the Cambrian Canglangpu formation in Sichuan basin, China
- Ground penetrating radar and magnetic gradient distribution approach for subsurface investigation of solution pipes in post-glacial settings
- Research on pore structures of fine-grained carbonate reservoirs and their influence on waterflood development
- Risk assessment of rain-induced debris flow in the lower reaches of Yajiang River based on GIS and CF coupling models
- Multifractal analysis of temporal and spatial characteristics of earthquakes in Eurasian seismic belt
- Surface deformation and damage of 2022 (M 6.8) Luding earthquake in China and its tectonic implications
- Differential analysis of landscape patterns of land cover products in tropical marine climate zones – A case study in Malaysia
- DEM-based analysis of tectonic geomorphologic characteristics and tectonic activity intensity of the Dabanghe River Basin in South China Karst
- Distribution, pollution levels, and health risk assessment of heavy metals in groundwater in the main pepper production area of China
- Study on soil quality effect of reconstructing by Pisha sandstone and sand soil
- Understanding the characteristics of loess strata and quaternary climate changes in Luochuan, Shaanxi Province, China, through core analysis
- Dynamic variation of groundwater level and its influencing factors in typical oasis irrigated areas in Northwest China
- Creating digital maps for geotechnical characteristics of soil based on GIS technology and remote sensing
- Changes in the course of constant loading consolidation in soil with modeled granulometric composition contaminated with petroleum substances
- Correlation between the deformation of mineral crystal structures and fault activity: A case study of the Yingxiu-Beichuan fault and the Milin fault
- Cognitive characteristics of the Qiang religious culture and its influencing factors in Southwest China
- Spatiotemporal variation characteristics analysis of infrastructure iron stock in China based on nighttime light data
- Interpretation of aeromagnetic and remote sensing data of Auchi and Idah sheets of the Benin-arm Anambra basin: Implication of mineral resources
- Building element recognition with MTL-AINet considering view perspectives
- Characteristics of the present crustal deformation in the Tibetan Plateau and its relationship with strong earthquakes
- Influence of fractures in tight sandstone oil reservoir on hydrocarbon accumulation: A case study of Yanchang Formation in southeastern Ordos Basin
- Nutrient assessment and land reclamation in the Loess hills and Gulch region in the context of gully control
- Handling imbalanced data in supervised machine learning for lithological mapping using remote sensing and airborne geophysical data
- Spatial variation of soil nutrients and evaluation of cultivated land quality based on field scale
- Lignin analysis of sediments from around 2,000 to 1,000 years ago (Jiulong River estuary, southeast China)
- Assessing OpenStreetMap roads fitness-for-use for disaster risk assessment in developing countries: The case of Burundi
- Transforming text into knowledge graph: Extracting and structuring information from spatial development plans
- A symmetrical exponential model of soil temperature in temperate steppe regions of China
- A landslide susceptibility assessment method based on auto-encoder improved deep belief network
- Numerical simulation analysis of ecological monitoring of small reservoir dam based on maximum entropy algorithm
- Morphometry of the cold-climate Bory Stobrawskie Dune Field (SW Poland): Evidence for multi-phase Lateglacial aeolian activity within the European Sand Belt
- Adopting a new approach for finding missing people using GIS techniques: A case study in Saudi Arabia’s desert area
- Geological earthquake simulations generated by kinematic heterogeneous energy-based method: Self-arrested ruptures and asperity criterion
- Semi-automated classification of layered rock slopes using digital elevation model and geological map
- Geochemical characteristics of arc fractionated I-type granitoids of eastern Tak Batholith, Thailand
- Lithology classification of igneous rocks using C-band and L-band dual-polarization SAR data
- Analysis of artificial intelligence approaches to predict the wall deflection induced by deep excavation
- Evaluation of the current in situ stress in the middle Permian Maokou Formation in the Longnüsi area of the central Sichuan Basin, China
- Utilizing microresistivity image logs to recognize conglomeratic channel architectural elements of Baikouquan Formation in slope of Mahu Sag
- Resistivity cutoff of low-resistivity and low-contrast pays in sandstone reservoirs from conventional well logs: A case of Paleogene Enping Formation in A-Oilfield, Pearl River Mouth Basin, South China Sea
- Examining the evacuation routes of the sister village program by using the ant colony optimization algorithm
- Spatial objects classification using machine learning and spatial walk algorithm
- Study on the stabilization mechanism of aeolian sandy soil formation by adding a natural soft rock
- Bump feature detection of the road surface based on the Bi-LSTM
- The origin and evolution of the ore-forming fluids at the Manondo-Choma gold prospect, Kirk range, southern Malawi
- A retrieval model of surface geochemistry composition based on remotely sensed data
- Exploring the spatial dynamics of cultural facilities based on multi-source data: A case study of Nanjing’s art institutions
- Study of pore-throat structure characteristics and fluid mobility of Chang 7 tight sandstone reservoir in Jiyuan area, Ordos Basin
- Study of fracturing fluid re-discharge based on percolation experiments and sampling tests – An example of Fuling shale gas Jiangdong block, China
- Impacts of marine cloud brightening scheme on climatic extremes in the Tibetan Plateau
- Ecological protection on the West Coast of Taiwan Strait under economic zone construction: A case study of land use in Yueqing
- The time-dependent deformation and damage constitutive model of rock based on dynamic disturbance tests
- Evaluation of spatial form of rural ecological landscape and vulnerability of water ecological environment based on analytic hierarchy process
- Fingerprint of magma mixture in the leucogranites: Spectroscopic and petrochemical approach, Kalebalta-Central Anatolia, Türkiye
- Principles of self-calibration and visual effects for digital camera distortion
- UAV-based doline mapping in Brazilian karst: A cave heritage protection reconnaissance
- Evaluation and low carbon ecological urban–rural planning and construction based on energy planning mechanism
- Modified non-local means: A novel denoising approach to process gravity field data
- A novel travel route planning method based on an ant colony optimization algorithm
- Effect of time-variant NDVI on landside susceptibility: A case study in Quang Ngai province, Vietnam
- Regional tectonic uplift indicated by geomorphological parameters in the Bahe River Basin, central China
- Computer information technology-based green excavation of tunnels in complex strata and technical decision of deformation control
- Spatial evolution of coastal environmental enterprises: An exploration of driving factors in Jiangsu Province
- A comparative assessment and geospatial simulation of three hydrological models in urban basins
- Aquaculture industry under the blue transformation in Jiangsu, China: Structure evolution and spatial agglomeration
- Quantitative and qualitative interpretation of community partitions by map overlaying and calculating the distribution of related geographical features
- Numerical investigation of gravity-grouted soil-nail pullout capacity in sand
- Analysis of heavy pollution weather in Shenyang City and numerical simulation of main pollutants
- Road cut slope stability analysis for static and dynamic (pseudo-static analysis) loading conditions
- Forest biomass assessment combining field inventorying and remote sensing data
- Late Jurassic Haobugao granites from the southern Great Xing’an Range, NE China: Implications for postcollision extension of the Mongol–Okhotsk Ocean
- Petrogenesis of the Sukadana Basalt based on petrology and whole rock geochemistry, Lampung, Indonesia: Geodynamic significances
- Numerical study on the group wall effect of nodular diaphragm wall foundation in high-rise buildings
- Water resources utilization and tourism environment assessment based on water footprint
- Geochemical evaluation of the carbonaceous shale associated with the Permian Mikambeni Formation of the Tuli Basin for potential gas generation, South Africa
- Detection and characterization of lineaments using gravity data in the south-west Cameroon zone: Hydrogeological implications
- Study on spatial pattern of tourism landscape resources in county cities of Yangtze River Economic Belt
- The effect of weathering on drillability of dolomites
- Noise masking of near-surface scattering (heterogeneities) on subsurface seismic reflectivity
- Query optimization-oriented lateral expansion method of distributed geological borehole database
- Petrogenesis of the Morobe Granodiorite and their shoshonitic mafic microgranular enclaves in Maramuni arc, Papua New Guinea
- Environmental health risk assessment of urban water sources based on fuzzy set theory
- Spatial distribution of urban basic education resources in Shanghai: Accessibility and supply-demand matching evaluation
- Spatiotemporal changes in land use and residential satisfaction in the Huai River-Gaoyou Lake Rim area
- Walkaway vertical seismic profiling first-arrival traveltime tomography with velocity structure constraints
- Study on the evaluation system and risk factor traceability of receiving water body
- Predicting copper-polymetallic deposits in Kalatag using the weight of evidence model and novel data sources
- Temporal dynamics of green urban areas in Romania. A comparison between spatial and statistical data
- Passenger flow forecast of tourist attraction based on MACBL in LBS big data environment
- Varying particle size selectivity of soil erosion along a cultivated catena
- Relationship between annual soil erosion and surface runoff in Wadi Hanifa sub-basins
- Influence of nappe structure on the Carboniferous volcanic reservoir in the middle of the Hongche Fault Zone, Junggar Basin, China
- Dynamic analysis of MSE wall subjected to surface vibration loading
- Pre-collisional architecture of the European distal margin: Inferences from the high-pressure continental units of central Corsica (France)
- The interrelation of natural diversity with tourism in Kosovo
- Assessment of geosites as a basis for geotourism development: A case study of the Toplica District, Serbia
- IG-YOLOv5-based underwater biological recognition and detection for marine protection
- Monitoring drought dynamics using remote sensing-based combined drought index in Ergene Basin, Türkiye
- Review Articles
- The actual state of the geodetic and cartographic resources and legislation in Poland
- Evaluation studies of the new mining projects
- Comparison and significance of grain size parameters of the Menyuan loess calculated using different methods
- Scientometric analysis of flood forecasting for Asia region and discussion on machine learning methods
- Rainfall-induced transportation embankment failure: A review
- Rapid Communication
- Branch fault discovered in Tangshan fault zone on the Kaiping-Guye boundary, North China
- Technical Note
- Introducing an intelligent multi-level retrieval method for mineral resource potential evaluation result data
- Erratum
- Erratum to “Forest cover assessment using remote-sensing techniques in Crete Island, Greece”
- Addendum
- The relationship between heat flow and seismicity in global tectonically active zones
- Commentary
- Improved entropy weight methods and their comparisons in evaluating the high-quality development of Qinghai, China
- Special Issue: Geoethics 2022 - Part II
- Loess and geotourism potential of the Braničevo District (NE Serbia): From overexploitation to paleoclimate interpretation