Origin of block accumulations based on the near-surface geophysics
-
Václav Duffek
 ,
Petr Tábořík
,
Petr Tábořík

Abstract
Understanding the internal structure of specific landforms is a crucial prerequisite for determining their origin and evolution. Near-surface geophysics represents a non-invasive way of subsurface investigation, and it can be used to describe subsurface conditions, especially in protected areas. We tested possible hypotheses of block accumulations origin and evolution by four different geophysical methods (electrical resistivity tomography [ERT], shallow seismic refraction [SSR], ground penetrating radar [GPR], and electromagnetic induction [EMI]) in the Central European Uplands. At the same time, we evaluated the applicability of geophysical methods to determine the internal structure and thickness of block accumulations. Based on the application of two suitable methods (ERT and SSR), we (1) estimated the thicknesses of block accumulations, (2) partially described their internal structure, and (3) presented the most probable hypotheses of block accumulation origin and evolution in two investigated sites.
Graphical abstract

1 Introduction
Block accumulations formed by rock fragments of various sizes and genesis are a significant part of mountain and periglacial geosystems [1,2,3]. In their relict forms accumulations usually occur with different degrees of infilling [4,5]. The study of such accumulations is important for understanding the origin and evolution of the surveyed area [3,6]. Moreover, block accumulations can serve as a source of palaeoclimatology proxies [3,7].
Practically, the only non-invasive approach (in cases where drilling and digging are not possible) to investigate the block accumulations characteristics is the use of geophysical methods. The applicability of these methods is widely demonstrated in many geomorphological studies [8,9,10,11,12,13,14,15]. The general advantages and limitations of some of these methods are summarised by refs [16,17,18,19,20,21,22,23,24]. However, relatively few studies [17,20,25,26,27,28] evaluate the potential of the commonly used geophysical methods for studying block accumulations. This is because both non-compact and heterogeneous structure [2] and the presence of a large number of air-filled voids [20] limit the possible applicability of geophysics.
This study aims to describe the origin and evolution of block accumulations based on the geophysical exploration. At the same time, the aim of the study is to evaluate the applicability of four common geophysical methods to determine the internal structure and thickness of block accumulations.
2 Regional settings
The present study was carried out in two localities (Slunečná site and Skalka site, respectively) of the Bohemian Forest, which is a typical Central European crystalline metamorphic mountain range (Figure 1). The Bohemian Forest stretches 125 km along the state border of Czechia and Germany. During Pleistocene, several glacial cirques and small glacial troughs were formed across the Bohemian Forest and most of the slopes were modified by glacial or periglacial processes [29]. These phenomena generated numerous scattered blocks, boulders, and block accumulations with different degrees of infilling [4]. Both sites have a subarctic climate (Dfc) as defined according to the Köppen climate classification [30]. The block accumulations observed in the studied sites differ in their (1) surface structures (infilled type in Slunečná site vs open blocky surface (OBS) type in Skalka site – in the latter case, the inter-block spaces are not filled with matrix), (2) topography (lower altitude and gentler slope in Slunečná site vs higher altitude with a steeper slope in Skalka site), (3) bedrock geology (medium-grained porphyric biotite granite in Slunečná site vs two mica-paragneiss in Skalka site), and (4) vegetation cover (fully forested in Slunečná site vs almost non-forested area in Skalka site). The basic characteristics of the two localities are provided in Table 1 and plotted in Figure 1. Both localities also differ in the most relevant hypotheses of their origin and evolution. By the geophysical survey we tested following hypotheses.
![Figure 1
Location of the investigated areas and geological conditions. The key to the geological map has been simplified for the purpose of this research: Q = sediment (Q colluvial, Qh fluvial, orQh organic, aQ anthropogenic, Qp glaciogenic), gm = paragneiss, gco = paragneiss with garnet, g = granite, q = quartzite, sM = biotitic migmatite, i = aplite. Data source: [36].](/document/doi/10.1515/geo-2022-0468/asset/graphic/j_geo-2022-0468_fig_001.jpg)
Location of the investigated areas and geological conditions. The key to the geological map has been simplified for the purpose of this research: Q = sediment (Q colluvial, Qh fluvial, orQh organic, aQ anthropogenic, Qp glaciogenic), gm = paragneiss, gco = paragneiss with garnet, g = granite, q = quartzite, sM = biotitic migmatite, i = aplite. Data source: [36].
Basic characteristics of the sites
| Characteristics | ||||||
|---|---|---|---|---|---|---|
| site | Altitude (m a.s.l.) | Area (m2) | Aspect | Slope (°) | Rock | OBS |
| Slunečná | 915–935 | 7,645.5 | West | 11–21 | Granite | No |
| Skalka | 1,192–1,218 | 2,215.0 | West | 19–25 | Paragneiss | Yes |
The total area of Slunečná is the sum of the partial areas of the surveyed block accumulations.
Block accumulations in Slunečná site are: (1) products of in situ frost-shattering [1], (2) products of frost sorting on the slope in the form of sorted polygons, sorted nets or sorted stripes [31], (3) expression of the Cover Beds concept [32,33,34], and (4) allochthonous material transported by gelifluction in which one can observe different degree on washing-out of fines [4,5]. Block accumulation in Skalka site is: (1) product of in situ frost-shattering [1,3] and (2) allochthonous material transported by gelifluction [6,35].
3 Methods of geomorphological mapping and geophysical research
In the preparatory phase of our survey, we performed geomorphological mapping of the extent and the surficial manifestations of block accumulations using the adopted methodology by ref. [5]. In addition to the boundaries of block accumulations, we determined the concentration of blocks as a ratio of the area covered with visible blocks to the area covered by fine-grained and/or organic debris matrix. We also investigated the clast size (given by the length of the longest axis) and the degree of filling of inter-block spaces. The individual types of block accumulations observed in the study area are summarised in Figure 2.
![Figure 2
Types of block accumulation with a graphical representation of the block concentration per unit of surface area, colour symbology (the same as in Figures 3–7), and description of the detailed characteristics of block cover. The schematic is based on [4].](/document/doi/10.1515/geo-2022-0468/asset/graphic/j_geo-2022-0468_fig_002.jpg)
Electrical resistivity tomography (ERT), shallow seismic refraction (SSR), ground penetrating radar (GPR), and electromagnetic induction (EMI) measurement were applied to the mapped block accumulations. When topographic corrections were needed, we used a uniform topography derived from LIDAR data-based digital elevation model (DMR 5G model by ref. [37]). Considering the spatial distribution of the blocks and/or the observed transitions between block accumulations of different type and slope angle (see Table 1), various profile orientations in the two localities were chosen. The central block accumulation in Skalka was investigated along the longitudinal profile (i.e. in the direction of the greatest slope angle), and the cluster of block accumulations in Slunečná was examined along the transverse profile (i.e. along the contour line).
We employed four different geophysical techniques to obtain as much geophysical information as possible. The survey results were used to test the origin and evolution hypotheses and also to evaluate the applicability of individual methods. We create a combined interpretation based on all the methods used. These comprehensive interpretations include (1) cross-validation of the results obtained from different methods (if possible, considering the different nature of various geophysical fields) and (2) combined interpretation of the main subsurface structures of the block accumulations, which could be compared with the surficial manifestation of the accumulations. The basic parameters of the geophysical instruments and of the measurements used in this study are provided in Table 2.
Selected measurement parameters of the used geophysical methods
| Slunečná site | Skalka site | ||
|---|---|---|---|
| ERT | Device | Automatic resistivity system – ARES | Automatic resistivity system – ARES |
| Start (m) | 0 | 0 | |
| End (m) | 315 | 315 | |
| Spacing (m) | 5 | 5 | |
| Array | WS and Wα | WS | |
| SSR | Device | Geode seismic recorder | Geode seismic recorder |
| Start (m) | 126 | 90 | |
| End (m) | 264 | 205 | |
| Spacing (m) | 3 | 5 | |
| Shotpoints (m) | 6* | 10* | |
| GPR | Device | Malå Ramac system X3M CU | Malå Ramac system X3M CU 100 and 250 MHz |
| 100 and 250 MHz | |||
| Start (m) | 126 | 106 | |
| End (m) | 267 | 178 | |
| Sampling (m) | 0.2 (manual trigger) | 0.2 (manual trigger) | |
| EMI | Device | CMD-Explorer (Hi/Lo) | CMD-Explorer (Hi/Lo) |
| CMD MiniExplorer (Hi/Lo) | |||
| Start (m) | 126 | 106 | |
| End (m) | 267 | 178 | |
| Sampling (m), (s) | 1 m (manual mode), 0.2 s (continual mode) | 1 m (manual mode) | |
Note that the profiles of both the sites do not start or end at the same position.
*Always placed at half distance between two neighbouring geophones (i.e. positions 127.5–133.5–139.5 m at Slunečná site and 92.5–102.5–112.5 m at Skalka site).
3.1 ERT
We selected the multi-electrode resistivity method of measurement and subsequent processing by ERT as the main exploration technique in both sites. This method was especially selected because of the following reasons: (1) it has been widely used in previous studies of block accumulations with different origin [13,38,39,40,41,42,43,44,45], (2) it has a high resolution [46,47], and (3) it has a large depth range [24,48,49], as well as (4) it processes data relatively fast [16,50]. High-quality grounding is crucial to acquire reliable data [51]. Therefore, in Skalka site, we grounded the electrodes using sponges saturated in electrolyte (hypersaline solution) (Figure 3a) to ensure sufficient conductive contact with the surface. This approach has been previously verified [12,52]. We carried out the ERT measurements in Skalka site in 2009, and the first results were reported by ref. [53], which marked the initial stage of the block accumulation research. In our study, we used the original data from 2009 and reprocessed them using a more advanced approach (i.e. using a newer version of processing Res2Dinv software [v3.56.22 instead of v3.54.44] and advanced data interpretation skills). We used the Wenner–Schlumberger (WS) electrode array in both sites since it gives sufficient resolution, depth range, and sensitivity to both horizontal and vertical structures. It is also robust towards geoelectrical noise [16,54,55,56]. In Slunečná, we also used the Wenner alpha (Wα) electrode configuration, which, due to its lower sensitivity, possess higher robustness to noise [16,54]. We applied stacking and standard deviation to improve data quality. Basic information on the measurement geometry is summarised in Table 2.

Various geophysical methods ERT (a and b), SSR (c), GPR (d and e), EMI (f and g), used for studying the block accumulations in Slunečná site (b, e, and g) and the central block accumulation in Skalka site (a, c, d, and f).
We processed the measured data using Res2Dinv tomographic inversion software, and topographic corrections were applied. All data were filtered using RMS statistics tool and the most erroneous or outlying values were excluded (approximately 6–9% of data). We inverted data from both arrays (WS and Wα) and we used a joint inversion model. We applied both standard (L2 norm) and robust (L1 norm) inversions [57]. However, models using robust blocks did not deliver satisfactory explanatory power. Therefore, we further interpreted the standard inversion models. We optimised damping factor values [49,58,59,60] to overcome the inherent non-uniqueness of the inverse problem and to avoid fitting noise in the ERT measurements and, therefore, suppress the effect of the heterogeneity of the block fields within inverse resistivity models.
3.2 SSR
SSR measurements are generally used to evaluate the elastic properties of block accumulations [11,20,61,62,63]. In this study, we used geophones with a frequency of 10 Hz to measure the SSR. The source of the seismic signal was an 8 kg sledge hammer (Figure 3c) and a metal pad, which we used to determine the initial time t0. In both localities, we used distant shotpoints providing sufficient coverage of the measured profile margins by seismic beams and signal summing to acquire better quality data. Data were processed using (1) the plus-minus method [64] to determine the first refraction boundary which we expected to be the lower limit of the investigated block accumulations and (2) seismic tomography (ST) [63,65] which shows overall geological conditions based on seismic velocity distribution. First arrival times were picked in SeisImager-Pickwin software (Geometrics, Inc./OYO Corporation). Data quality check was performed using a reciprocal time check function in SeisImager-Plotrefa (Geometrics, Inc./OYO Corporation) with maximum reciprocal time error 5% and, if needed, the first arrivals of seismic signal were further adjusted. We used ST in the Rayfract program (Intelligent Resources, Inc.). The advantage of this software is the calculation of tomography taking Fresnel zones into consideration [66,67], so the calculated velocity slices (showing the distribution of seismic P-wave velocities) better match the measured records. Both layered and gradient models were created in Rayfract. However, both models yielded similar results. As determining the thickness of block accumulations was one of the main goals of the study, we preferred layered models, which should better depict a layered environment. Topography corrections were used in all models. The interfaces obtained by the plus-minus method [64] were added to the ERT models for both localities to relate the SSR results to ERT results (like [68]).
3.3 GPR
GPR was used as the method using electromagnetic signals to reveal the possible depth and internal structures of the block accumulation [19,22,69,70,71,72,73]. In both locations, we performed measurements using the Malå Ramac system of GPR with X3M control unit and shielded antennas of 250 and 100 MHz (Figure 3d and e). The use of shielded antennas was important in Slunečná, which is forested. The trigger wheel or time-mode trigger could not have been used owing to the extreme conditions of block accumulations, which caused continuous motion with constant velocity impossible. Therefore, we used a 20 cm manual trigger in all cases (Figure 2c and d). The measured data from both locations were processed using ReflexW 6.0 software (Sandmeier software) similar to [74]. We introduced the topography of the environment into all GPR sections. We used the EM wave propagation velocity of 0.09 m/ns based on the assumption of non-homogeneous unsaturated stacking of loose blocks with predominantly air-filled inter-block voids [9,19,75]. We processed the radargrams using the following processing sequence: (1) Resorting – X-Flip Profile (due to extremely difficult operation with antennas and to save time, some profiles were measured in a reversed way), (2) static corrections – move start-time (first arrival time adjustment), (3) 1-D filter – subtract mean (dewow), (4) 2-D filter – background removal, (5a) gain – energy decay and (5b) gain – Y-manual gain (in a vertical direction), (6) 2-D filter – running average, and (7) topographic migrations. In some cases, topographic migrations provide more continuous reflections and, thus, its interpretations are mostly unambiguous [19].
3.4 EMI
We carried out EMI measurements to obtain information on the conductive and/or resistive properties of block accumulations [8,11,76,77,78]. In contrast to the ERT, EMI measurements do not require coupling with the subsurface using metal electrodes (see Figure 3f and g). The device uses contactless measurements based on the principle of EM induction [79,80]. We utilised a CMD Explorer conductivity meter (GF Instruments, Brno), which allowed us to take measurements in two different regimes, i.e. both vertical and horizontal orientations of the measuring dipole coils axes with different calibrated penetration depths (measuring position “Hi” refers to vertical orientation with a full depth range and “Lo” refers to horizontal orientation with a half depth range). In Slunečná, we also used a different conductivity probe CMD MiniExplorer (GF Instruments), which is designed for more detailed survey (as it measures in shallower depths compared with CMD Explorer, for details see below). Owing to the heterogeneity of the examined environment and the expected high range of the measured values, we used manually controlled data collection (sampled at 1 m intervals) in both localities (Figure 2e and f) to obtain more accurate results with direct control on data quality based on the measured standard deviation ( σ ) of up to 5%. Owing to the more accessible nature of the terrain, continuous data collection was also applied at the Slunečná site for experiments. We measured the apparent resistivity values at the depth levels (Explorer – Hi: −2.2, −4.2, and −6.7 m, Lo: −1.1, −2.1, and −3.3 m; MiniExplorer – Hi: −0.5, −1.0, and −1.8 m, Lo: −0.25, −0.5, and −0.9 m) calibrated by the manufacturer. We displayed the resultant apparent resistivity curves for the depth levels using Grapher 9 (Golden Software).
4 Results and interpretations
4.1 Slunečná site
We delineated block accumulations with different characteristics through geomorphological mapping of the block accumulation clusters in the Slunečná locality (Figure 4a). Most of the accumulations were less dense (types B1, B2, and B3, where blocks were not in a visible contact with each other), except for a single dense accumulation (situated in 228–265 m, Figure 5a), where blocks were in contact with each other – type B5 [4]. All accumulations were mostly composed of blocks with the longest axis of up to 1 m, with sparsely incorporated larger and smaller blocks. The distribution of blocks with different size was random. The spaces between the blocks were all filled with finer matrix and the two southernmost block accumulations had the highest slope angle.

Location of block accumulations at the Slunečná (a) and Skalka (b) sites. The types of block accumulations and position of the geophysical profile are shown. For block accumulation types description, see Figure 2. The surroundings of the mapped block accumulations at the Slunečná site are formed of a mixture of scattered islets of B1 and B2 block accumulation types.
![Figure 5
Results of the survey in the Slunečná site. (a) Types of block accumulation (modified after [4]) along the geophysical profile, black dashed lines in ERT and SSR models, radargram and EMI curves denote the boundary between different types of block accumulation. (b) Cropped ERT subsurface resistivity distribution model (5th iteration standard inversion, RMS error 2.1%). White solid lines represent first and second interfaces (see below). (c) Subsurface contour model of seismic velocities (RMS error 4.4%) with first and second interfaces derived from Hagedoorn’s [64] plus-minus method (solid white lines). Solid black lines represent isolines 2 and 5 km/s. (d) Radargram (vertical exaggeration: two times) obtained by GPR (f = 100 MHz) with a significant reflector (yellow dashed line) and maximum effective penetration depth (white dashed line). (e) Detailed segment of radargram where B5 block accumulation changes into B3 and vice versa. (f) Apparent resistivity depth (d) curves obtained by EMI (CMD Explorer, Hi).](/document/doi/10.1515/geo-2022-0468/asset/graphic/j_geo-2022-0468_fig_005.jpg)
Results of the survey in the Slunečná site. (a) Types of block accumulation (modified after [4]) along the geophysical profile, black dashed lines in ERT and SSR models, radargram and EMI curves denote the boundary between different types of block accumulation. (b) Cropped ERT subsurface resistivity distribution model (5th iteration standard inversion, RMS error 2.1%). White solid lines represent first and second interfaces (see below). (c) Subsurface contour model of seismic velocities (RMS error 4.4%) with first and second interfaces derived from Hagedoorn’s [64] plus-minus method (solid white lines). Solid black lines represent isolines 2 and 5 km/s. (d) Radargram (vertical exaggeration: two times) obtained by GPR (f = 100 MHz) with a significant reflector (yellow dashed line) and maximum effective penetration depth (white dashed line). (e) Detailed segment of radargram where B5 block accumulation changes into B3 and vice versa. (f) Apparent resistivity depth (d) curves obtained by EMI (CMD Explorer, Hi).
The integration of the WS and Wα electrode configurations in the ERT resulted in a model of the subsurface resistivity distribution (Figure 5b) with higher density of the measured data and low RMS error (2.1%). This model shows an increase in the thickness of high-resistive bodies (resistivity from 7 to 27.6 kΩm). The thickness in the first half of the profile (0–195 m) reaching a maximum of 7 m. The maximum thickness in the second half (195–270 m) of the profile was 9 m. This pattern was interrupted several times (at 200–205 and 245–250) with lower resistivity (varying from 4.4 to 7 kΩm). The greater thickness of high-resistive bodies in the second half of the ERT profile most likely reflects an increase in the thickness of the block accumulations. Similarly, bodies with very high resistivities (over 20 kΩm) may indicate areas with higher block concentrations (accumulations with air-filled inter-block spaces, i.e. B5 category). The lower resistivity bodies likely represent block accumulations where inter-block spaces are filled with fine-grained matrix. At a depth of ca. 7 m lies conductive band, which is characterised by low resistivities (<4.4 kΩm). At a position of approx. 200 m, there is a zone that interrupts the low resistive environment of the second layer. An environment with the lowest resistivities (<4.4 kΩm) probably corresponds to the disrupted (likely weathered) parent rocks [1]. The relatively higher resistivity (4.4–11 kΩm) at a depth of approximately 15 m, which forms the third layer, most likely corresponds to intact rock.
The seismic model (with RMS error 4.4%) consists of three layers. The solid white lines in Figure 5c represent two subsurface refraction boundaries detected by the SSR plus-minus method [64]. The first interface within the inverse seismic velocity model is partially copied by an isoline of 2 km/s at an average depth of 7 m. The second interface is partially copied with isolines of 5 km/s. In parts of the profile around the 180, 220, and 250 m, both isolines drop to greater depths. This shift in isolines to varying depth may be caused by the selective weathering of bedrock [81,82,83]. The first (uppermost) layer with a constant thickness was delineated by isolines of approximately 2 km/s. The second layer was delineated by isolines of 2 and 5 km/s. The thickness of the second (middle) layer was found to change along the profile. The third (bottom) layer was bounded by an isoline of 5 km/s, which corresponds to the seismic wave propagation velocity in intact granites [84,85,86,87,88].
Two depth profiles of the subsurface environment were measured by GPR using antennas with f = 100 and 250 MHz, respectively. We obtained similar result for both antennas, but the 100 MHz antenna exhibited a higher penetration depth. Therefore, we have reported data obtained only from the 100 MHz antenna (Figure 5d). We achieved a penetration depth of approximately 6–9 m (Figure 5d). In the all resulting radargrams, it was relatively difficult to detect any unequivocal interface or significant changes in the subsurface environment, except for a structure at approximately 215 m (see yellow dashed line in Figure 5e) where the interfaces are markedly curved. The interfaces could represent a possible original surface of the currently infilled shallow depression there which also have a significant manifestation in SSR model (a rapid decrease in seismic velocity). In some places, the reflections reached deeper (e.g. at 220 and 255 m), which might indicate pockets of thicker debris (Figure 5d). The absence of interpretable reflection boundaries (but not a lack of reflections) is further discussed in the following sections.
We used EMI measurements to construct the apparent resistivity curves. The curves were scattered, and the measured values were highly variable (ranging from 200 to 1,100 Ωm, see Figure 5f). The variations in values obtained using CMD Mini Explorer conductivity meter were even more fluctuated, and the measured values often dropped to negative values. The best quality results were obtained by CMD Explorer conductivity meter with vertical coil setting (Hi position) in the manual measurement mode (Figure 5f). Measurements in continuous mode did not yield better results. The rapid change in the trends of the curves was observed at positions 200 and 205 m. The curves of the depth of −2.2 and −6.7 were smoother in the 120–200 (205) m section and were more variable in the second half of the profile. This is likely caused by the rapidly changing thickness of the block accumulation.
4.2 Skalka site
In Skalka site, we determined the surficial characteristics of the central block accumulation by geomorphological mapping (Figures 3 and 5a). We found block concentration of the central accumulation to be very high when the blocks were in contact with each other (Figure 3) and the inter-block voids were not filled with the matrix (i.e. category B6 [4]). We found blocks with the longest axis of ∼1 m, sparsely distributed smaller blocks (tens of centimetres), and/or larger blocks (up to 2 m) on the surface of the central accumulation. Blocks in the downslope part of the accumulation had slightly smaller diameter than those in the upslope part (as well as [53]).
The model of ERT measurements in Skalka site (with RMS error 5.8%) demonstrates the presence of several extremely high-resistive bodies (resistivity varying from 55 to 102 kΩm) near the surface (Figure 6b). Their occurrence is mainly linked to the upslope parts of the profile. Along the downslope part of the profile, the resistivity of the uppermost layer generally decreases. However, approximately in the third quarter of the profile (i.e. at 165 m), there is another extremely high-resistive body (from 55 to 102 kΩm). There is a relatively lower resistivity environment (from 5 to 30 kΩm) under the layer of these bodies (approximately 20 m deep). The high-resistivity bodies in the resistivity model (at approximately 100, 115, 130, and 165 m) most likely correspond to the stacking of blocks with large air-filled voids. The occurrence of lower resistivities at depths of up to 5 m (at approximately 120 m and from 140 to 160 m) most likely correspond to areas where the inter-block spaces are filled with a fine-grained matrix. A sudden increase in subsurface resistivity at 95 m probably indicates the upslope limit of the block accumulation, and the sharp reduction in resistivity at 175 m marks its downslope limit. High resistivities (>55 kΩm) between 95 and 175 m could thus likely be caused by more air filed voids within block accumulation, which correspond with the B6 type description [4].
![Figure 6
Results of survey in the Skalka site area. (a) Different types of block accumulation [4] along the geophysical profile, black dashed lines in ERT and SSR models radargrams and EMI curves denote the boundary between different types of block accumulation. (b) Cropped model of subsurface distribution of the resistivity obtained by ERT (5th iteration standard inversion, RMS error 5.8%). White solid line represents first interface (see below). (c) Contour model of seismic velocities below the surface (RMS error 4.5%) with the first interface derived from Hagedoorn’s [64] plus-minus method (solid white line). Solid black lines represent isolines 2.5 and 4.5 km/s. (d) Radargram obtained using GPR (f = 100 MHz) with maximum effective penetration depth (white dashed line). (e) Detailed segment of radargram where B6 block accumulation changes into B4 and vice versa. (f) Apparent resistivity depth (d) curves obtained by EMI (CMD Explorer Lo – black curve and Hi – remaining curves). Note that the curves of nearly identical depths do not follow the same trend and tend to go against each other.](/document/doi/10.1515/geo-2022-0468/asset/graphic/j_geo-2022-0468_fig_006.jpg)
Results of survey in the Skalka site area. (a) Different types of block accumulation [4] along the geophysical profile, black dashed lines in ERT and SSR models radargrams and EMI curves denote the boundary between different types of block accumulation. (b) Cropped model of subsurface distribution of the resistivity obtained by ERT (5th iteration standard inversion, RMS error 5.8%). White solid line represents first interface (see below). (c) Contour model of seismic velocities below the surface (RMS error 4.5%) with the first interface derived from Hagedoorn’s [64] plus-minus method (solid white line). Solid black lines represent isolines 2.5 and 4.5 km/s. (d) Radargram obtained using GPR (f = 100 MHz) with maximum effective penetration depth (white dashed line). (e) Detailed segment of radargram where B6 block accumulation changes into B4 and vice versa. (f) Apparent resistivity depth (d) curves obtained by EMI (CMD Explorer Lo – black curve and Hi – remaining curves). Note that the curves of nearly identical depths do not follow the same trend and tend to go against each other.
The model of seismic velocity isolines (with RMS error 4.5%) shown in the tomographic inverse section (Figure 6c) follows the slope topography, except for the upper half of the profile where they fall to greater depths. Based on the plus-minus method [64], a single interface was found that copies the slope topography along the entire profile at depths of 8‒10 m. This observation points to very low variability in the thickness of block accumulation and a double-layered environment. This refraction boundary follows an isoline of 2.5 km/s, which does not correspond to higher propagation velocity (>4.5 km/s) of seismic waves in intact gneisses [84,85,86,87,88]. The refraction boundary thus does not present the contact of the block accumulation with an intact rock. Below the block accumulation probably lies the layer of disrupted bedrock (e.g. by tectonics and frost shattering) and likely weathered parent rock, delineated by an isoline of 4.5 km/s, which corresponds to the velocity of propagation in the intact gneiss [85]. The total thickness of the accumulation and disrupted zone varies greatly over the course of the profile, exceeding 15 m at the deepest point in the first half of the profile.
We present the GPR results of Skalka site that were obtained only by 100 MHz antenna for the same reason as in the Slunečná site. Our results (Figure 6d) indicated similar depths with a narrow range between 6 and 9 m. However, the depth was approximately 7 m in majority of the profile. This is in accordance with the commonly accepted values of the effective depth range for a 100 MHz antenna, i.e. 6–7 m [22]. Furthermore, the reflections completely disappeared at greater depths, probably due to the loss of energy. As we reached the limits of the used antenna, we can only presume that we have reached the lower margin of the investigated block field. No major reflecting interfaces, indicating the presence of a possible internal structure (e.g. layering), were found in the sections. We found areas with stronger and weaker reflections (e.g. in Figure 6f) in the radargram after processing raw data (at approximately 140 and 160 m for the former and at approximately 120 m for the latter).
The apparent resistivity curves for the two coil orientations and for all depth ranges were constructed based on the EMI measurements. Despite the chosen approach of measurement (i.e. manual data acquisition), the measured values were highly variable (ranging from 400 to 1,600 Ωm). The CMD Explorer conductivity meter provides the best quality data (in all EMI settings), and a common trend could be interpreted from the curves acquired from its vertical coil orientation setting (Hi position). The curves acquired from similar depths using two different coil orientations (i.e. Lo [black] and Hi [green] in Figure 6e) did not show similar values of the apparent resistivities when mutually compared. An interpretation of the variable EMI curves, including a comparison with the results of other methods, is further discussed in the subsequent section.
5 Discussion
5.1 Evaluation of the applicability of geophysical methods
Analysis of the results shows that the applied methods generated data with a variable quality. During the evaluation of their applicability, we considered the quality of the obtained data and considered the main difficulties of their acquisition, i.e. geophone and electrode placement, extremely difficult motion, and manipulation with the EMI probe or GPR antennas. Based on our outputs (see Table 3), we can state that (1) the SSR method is suitable for block accumulation research (similar to [20]), (2) the usage of ERT method is “conditional” depending on the quality of electrode grounding, (3) contactless EMI cannot be utilised, or with considerable limitations (we recommend that EMI should be used only as a complementary method), and finally, (4) the GPR method would be suitable to determine the thickness of block accumulation when uses low frequency (e.g. 20–30 MHz) antennas to achieve a greater maximum penetration depth [72].
Comparison of the applicability of the selected geophysical methods for the exploration of block accumulations according to certain characteristics
| Geophysical task | ERT | SSR | EMI | GPR |
|---|---|---|---|---|
| Detection of thickness | + | ++ | − | + |
| Detection of internal structure | + | +/− | +/− | +/− |
| How demanding the method is | ||||
| In man-power | +/− | − | +/− | − |
| In measurement time | − | − | +/− | + |
| In data processing | + | − | ++ | +/− |
| In interpretation | + | + | +/− | − |
Individual characteristics of geophysical task are provided using the following symbols: ++ suitable; + suitable but with limitation; +/− suitable but with significant limitations or modification necessary; − unsuitable. Characteristics of the difficulty of the method are given by the following symbols: ++ undemanding; + undemanding with exceptions; +/− demanding; − very demanding.
5.1.1 ERT
In both sites, ERT measurements indicated the probable thickness of the block accumulations as well as some interfaces among them. The penetration depth reported by ref. [16] was achieved in both sites. However, the ERT method is not fully suitable for determining the exact thickness of the block accumulation separately as exemplified by investigation of ref. [53] who provided interpretations based solely on the ERT. Such inaccurate interpretations are most likely a result of overestimated thickness of the superficial layer caused by decreasing resolution and sensitivity at larger depths and associated interpolations [12,57,89]. This confirms that the comprehensive approach presented by ref. [20,26] provided results with lesser uncertainty. We confirm the difficulty of good grounding of the electrodes on the OBS type of block accumulation, as previously mentioned by ref. [23]. A mere preparation for geophysical profiling, especially ensuring sufficient grounding of the electrodes required 5 h in Skalka site. A similar time was reported by ref. [12] when applied to a talus cone. We can also confirm that on the sparser block accumulations with inter-block spaces filled with more conductive material, the method better determined the depth, as proposed by ref. [20]. The authors are aware that a shorter electrode step would result in a more detail output with higher resolution, and the resulting model and its interpretation could be more accurate (as advised by e.g. ref. [20]).
5.1.2 SSR
The SSR method supplemented and corrected the interpretations of resistivity tomography in both sites, especially for the correction of the subsurface interface depth. In Slunečná site, the thickness of the block accumulations determined based on the plus-minus method was approximately 7 m, which is slightly lesser than the thickness value determined by ERT. Studies [12,26] also reported that the SSR method can accurately detect the first interface at a shallower depth compared to ERT. The second interface modelled by the plus-minus method corresponds to a certain increase in the resistivity of the subsurface environment compared to the interjacent middle layer, which could be characterised by an intact rock [90,91].
In Skalka site, the maximum thickness of the highly resistive bodies was previously estimated to be 20 m, which was interpreted as block accumulation layer [53]. However, this thickness was subsequently reduced to only 8 m based on our SSR results, specifically from the first refraction boundary captured by the plus-minus method [64]. This refraction boundary is approximately followed by the 2.5 km/s isoline. However, such seismic velocity does not correspond to the velocity of the intact parent rock. We assume that the intact rock surface might be characterised by 4.5 km/s isoline [84,85,86,88], and the interjacent layer could likely represent the form of a heavily disrupted parent rock. The applied correction was based on the ability to detect changes in the elastic parameters of the bedrock in SSR compared to ERT [85].
We achieved better results in Skalka site, which is formed of larger loose blocks. In the vegetated sparse block accumulation with a loamy matrix in Slunečná, the seismic waves in the substrate appeared to be poorly transmitted [18]. Generally, the seismic hammer does not produce high frequency signal, thus, the resolution of the measurements using this seismic source is rather low. Nevertheless, inaccessibility of the studied sites did not enable the usage of a high-frequency seismic source. Repeating the impulse at individual spots several times requires long measurement time and demanding manpower [12,20].
5.1.3 GPR
Compared to ref. [74], the GPR did not provide any easily interpretable data. We could observe strong reflections (as in ref. [74]) in both radargrams, but the investigated environment was too heterogeneous. The inner structure (formed of loose blocks) was rather highly disordered (chaotic) for any anticipation of continuous reflecting interfaces (its graphical interpretation is provided in Figure 7). Therefore, it was not possible to accurately identify the assumed interfaces between the block accumulations and the underlying bedrock, as confirmed by other methods. Furthermore, the probable energy loss and attenuation of the residual signal at the depth of the assumed bedrock surface played a significant role in not allowing the reliable determination of accumulation thickness [22,92]. Similar problems were noted by ref. [93] in a landslide environment. In summary, the determination of the internal structure of block accumulation using GPR was rather unfeasible [72].
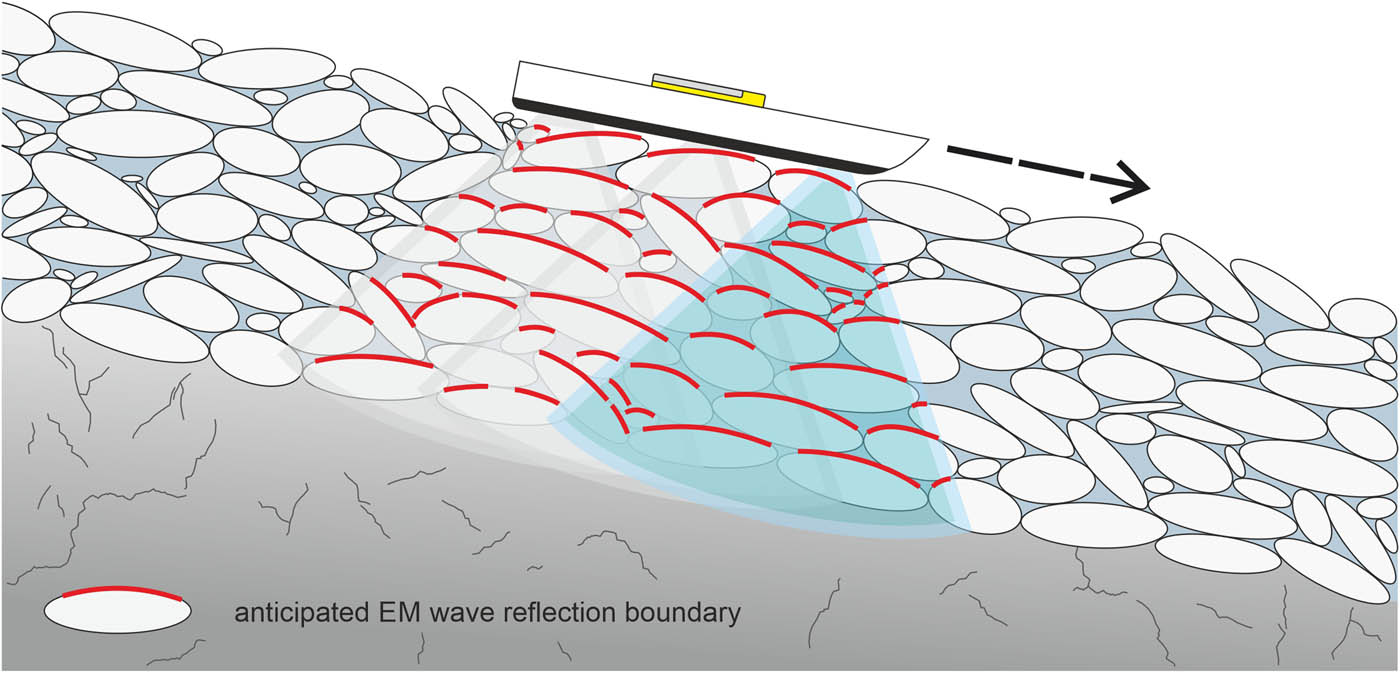
Schematic interpretation of the propagating EM waves, and the anticipated discontinuous GPR reflection boundaries on discrete blocks forming accumulations with an irregular architecture. Inter-block space is either air-filled (Skalka site) or partially filled with a fine-grained matrix (Slunečná site).
For both GPR antennas, the maximum depth range reported by ref. [22] was achieved in both sites. Even if we agree that block accumulations can provide suitable conditions for reaching the maximum penetration depth of the GPR method [26,94], we could not assert with absolute certainty that the obtained penetration depth exceeded the thickness of the investigated block accumulations as we had probably reached the method limitations. Meanwhile, the sudden disappearance of reflection might be caused by a strong signal attenuation in the relatively more conductive environment composed mostly of disrupted, weathered, and water-saturated parent rocks. We can conclude that the overall thickness assumed for the studied block layer approximately matched the GPR penetration depth.
The use of lower-frequency antennas with a greater penetration depth could be a solution for the above-mentioned problem. Sass [25] reached a depth of over 50 m on a talus cone using a frequency of 25 MHz. Otto and Sass [12] reached a depth of 40 m using the same antenna. These depths could be sufficient to detect the surface of the parent rock in the both locations. However, the use of low-frequency antennas has several limitations. Although the low-frequency GPR antenna (e.g. 20 or 30 MHz) delivers sufficient penetration depth, the resolution of such measurement and the ability to distinguish geological structures are rather low due to its long wavelength [94,95]. In addition, such antennas are not shielded, and, therefore, they are highly sensitive to geoelectric noise and unwanted reflections from trees and operators [19]. Schrott and Sass [20] considered the use of unshielded antennas in wooden terrains to be almost impossible. The lower-frequency antennas also have larger size. Even the transportation of a 100 MHz antenna with the size of approximately 1 m2 to the survey site was extremely difficult. The measurement itself was very demanding and sometimes even dangerous. In accordance to ref. [20], due to the difficult terrain, we experienced a significantly longer measurement time compared to the measurements in easily accessible sights.
5.1.4 EMI
All the measured EMI data were highly variable, and the apparent resistivity curves were scattered. The most reliable data were obtained in both sites using CMD Explorer with vertical coil axis orientation and manual gain measurement mode. Note that acquiring data with direct quality control demands large amount of time. Although the apparent resistivity curves were scattered, we could observe and further interpret specific trends in the curves, which agree with ERT resistivity models. However, the interpretation of EMI without any other supporting data is questionable. There could be several reasons for the poor EMI results with low interpretation ability, such as (1) the natural heterogeneity of block accumulations, (2) discontinuous measurement mode with a discrete induced EM field at every single point, and (3) extremely high sensitivity to EM noise [79].
In Slunečná, EMI data were found to roughly correspond to the results of ERT, SSR, and geomorphological mapping, especially for the indication of transitions to different subsurface conditions. Even though the EMI data measured in Skalka site were highly scattered, a certain concordance of the EMI curves (especially those in −2.2 and −6.7 m) with the ERT section could be observed.
5.2 Internal structure and tested hypotheses of origin and evolution
We reconstructed the accumulation’s internal structure and thickness and tested the most relevant hypotheses of origin and evolution in the two studied sites mostly on the basis of the data obtained from the SSR and ERT surveys. This is because the EMI and GPR methods provided ambiguous results possibly due to insufficient penetration depth of GPR and highly scattered EMI curves. The thickness of the block accumulations in both sites ranged from 7 to 9 m. In the integrated geological model (Figures 8 and 9), the surface of unweathered parent rock was determined as the second velocity boundary as derived from the Hagedoorn’s plus-minus method [64,96] at Slunečná site and the isoline of 4.5 km/s in the seismic velocity model of Skalka site. This approach suggests that the overall depth of the block accumulations with the eluvium ranged from 10 to 15 m in Slunečná site and from 8 to 20 m in Skalka site. The individual types of block accumulation [4] were interpreted in a vertical section, and the internal structure of the block accumulation was outlined based solely on the ERT results.
![Figure 8
Integrated geological model of the Slunečná site interpreting the subsurface conditions and particular types of block accumulations along the geophysical profile. Red indexes reflect the following: I. = body of parent rock; II. = the most probable body of the disturbed parent rock; III. = body of block accumulation; and a, b – seismic refraction boundaries derived from the plus-minus method [64]. Results obtained by processing our data collected in 2017.](/document/doi/10.1515/geo-2022-0468/asset/graphic/j_geo-2022-0468_fig_008.jpg)
Integrated geological model of the Slunečná site interpreting the subsurface conditions and particular types of block accumulations along the geophysical profile. Red indexes reflect the following: I. = body of parent rock; II. = the most probable body of the disturbed parent rock; III. = body of block accumulation; and a, b – seismic refraction boundaries derived from the plus-minus method [64]. Results obtained by processing our data collected in 2017.
![Figure 9
Integrated geological model of the Skalka site interpreting the subsurface conditions and particular types of block accumulations along the geophysical profile. Red indexes show the following: I. = body of parent rock; II. = the most probable body of disturbed parent rock; III. = body of block accumulation; and a – seismic refraction boundary derived from the plus-minus method [64]. Results obtained by processing our own data collected in 2017.](/document/doi/10.1515/geo-2022-0468/asset/graphic/j_geo-2022-0468_fig_009.jpg)
Integrated geological model of the Skalka site interpreting the subsurface conditions and particular types of block accumulations along the geophysical profile. Red indexes show the following: I. = body of parent rock; II. = the most probable body of disturbed parent rock; III. = body of block accumulation; and a – seismic refraction boundary derived from the plus-minus method [64]. Results obtained by processing our own data collected in 2017.
The integrated geological model of the Slunečná site (Figure 8) shows that the results of the geophysical survey agree well with the results of geomorphological mapping, except for the area from 240 to 260 m, where a discrepancy between the mapped surficial accumulations of B5 and relatively lower resistivity subsurface bodies can be observed.
We do not favour the hypothesis of in situ weathering, because there are no rock outcrops, tors, or cliffs upslope the block accumulations and the thickness of accumulations ranged from 7 to 9 m (compare with maximum 3 m of in situ weathered mantle described by ref. [1]. We declined the hypothesis of sorted slope [31] based on the geomorphological mapping, because the accumulations are developed as restricted polygon (Figure 4) with no upslope and downslope continuation. None of the subsurface layer can be interpreted as the layer of periglacial cover bed concept because of their significantly larger thickness (compare several metres on Figure 8 and several tens of centimetres in refs. [32,33,34]). On the other hand, the highest category of the block accumulation is lying on the slope with the highest slope angle and vice versa. Based on the previously mentioned statements, we incline to gelifluction origin (probably in a cold periods of Pleistocene) of block accumulations in Slunečná site with different degrees of washing out of fines due to the slope angle [4,5].
The middle layer (second layer in Figure 8) cannot be of glaciogenic origin, although part of the Bohemian Massif was glaciated during the last ice age [97]. However, the site is located far from the hypothetical extent of the nearest palaeoglaciers [29,98]. Moreover, the periglacial cover bed concept or glaciogenic origin of the middle layer does not match our results in a geophysical characteristic, especially seismic velocities. The measured velocities (over 2.5 km/s in Figure 8) do not match either with the velocities of 0.3–0.6 km/s [88,99,100] anticipated for fine-grained aeolian sediments (typical for middle layer of cover bed [34]) or with the typical velocities of glaciogenic sediments (i.e. till) with <2.5 km/s [85,88,101,102]. These values are significantly lower than the measured velocities in the studied site. The low resistivities in the middle layer might be also caused by stagnant seepage water [98,103]. However, considering the position of the block accumulations at approximately 70 m above the valley floor on the Slunečná slope, we do not favour such an interpretation. Therefore, the middle layer is most probably disturbed bedrock, which gradually changes to the unweathered bedrock.
The integrated geological model reconstructed for Skalka site (Figure 9) shows that the subsurface extent of the block accumulation determined by the geophysical survey does not fully correspond to its surficial manifestation found by geomorphological mapping. The accumulation emerges at 106 m in the profile and submerges at 176 m. The geophysical survey may indicate the presence of a block accumulation at 95 m. The discrepancy in these results indicates the presence of a well-developed block accumulation covered by soil, with no surficial manifestation. Such outcomes confirm the importance of integrated interpretations and cross-validation of geophysical and geomorphological methods.
Based on the geomorphological mapping and geophysical survey, we incline to complex polygenetic origin of the block accumulation in Skalka site [3], which were probably created by in situ weathering and gelifluction transport. Because of the in situ weathering of bedrock and disintegration of rock scarps or tors lying upslope would not probably create a 7–9 metre thick layer of loose block (compare a few metres described by [1]), some material probably had to be transported by gelifluction from above lying gently sloped plateau, where intensive cryoplanation could took place [35]. This hypothesis is in accordance with the reduction of block size downslope along the profile. The accumulation is probably not a relict block stream [104], because these landforms most often lay on the bottom of valleys and are longer than wider [3,104]. Occurrence of relict rock glacier could explain the accumulation origin, but there are no morphological manifestations on the surface (such as steep front slope or transverse and longitudinal ridges described by refs. [3,105].
The middle layer in the upper part of the profile (second layer in Figure 9) is (similar to Slunečná site) most probably disturbed bedrock, which gradually changes into the unweathered bedrock. We do not support the glacial origin of this layer for the same reason as in Slunečná site. As well as the middle layer in Figure 9 cannot represent the middle layer in the cover bed concepts [32,33,34], due to its thickness and seismic velocities. The accumulation position almost on a high plateau without any peat bog and with a high slope angle excludes low resistivities caused by the stagnant seepage water.
In summary, we consider the allochthonous periglacial explanation of block accumulations origin in both sites with different degrees of washing out of fines in Slunečná site and with an interaction of in situ frost shattering in Skalka site. The research showed that the combination of suitable geophysical methods is valuable in the clarification of geomorphological hypotheses and confirmed the importance of using a multidisciplinary geophysical survey. In addition, Table 3 provides a clear comparison of the applicability of the methods for the investigation of block accumulations and the associated difficulties.
6 Conclusion
The combined use of geophysical methods provided us an opportunity to acquire new information on the characteristics of block accumulations. The accumulations were simultaneously mapped and classified based on block concentrations per unit surface area. Geophysical research estimated that the thickness of block accumulations can reach approximately 7–9 m at both investigated sites. The ascertained depth of the unweathered parent rock surface ranged from 8 to 20 m. We interpret the interjacent middle layer (if present) as an intensively disrupted and weathered parent rock, and we prefer the concept of periglacial origin of the allochthonous block accumulations. The exploration demonstrated that the surface manifestations of block accumulations almost correspond to the sub-surface geophysical image.
An integrated interpretation of all results proved to be very useful for creating a conceptual geological model and for testing geomorphological hypotheses. It furthermore provided a means to (1) cross-validate the individual geophysical methods, (2) cross-validate the geophysical results and geomorphological mapping, and (3) mutually compare the applicability of individual method.
It can be concluded that SSR is probably the most suitable technique for exploring the thickness of block accumulation. However, it does not provide abundant information on the internal structure due to insufficient resolution while using a sledge hammer as a seismic source. ERT was applicable for determining the thickness of the block accumulation as well as the changes in subsurface conditions. GPR delivered less information on the internal structure than expected, probably because of the erratic characters of block accumulations. Although the achieved penetration depth was reasonable, it was insufficient for the determination of the accumulation thickness. The use of EMI measurements is suitable only with significant limitations.
Acknowledgments
This work was carried out with the support of the long-term conceptual development of the research organisation RVO: 67985891. It was co-funded by the institutional support of the Centre for Geosphere Dynamics (UNCE/SCI/006) and by Faculty of Education at the University of West Bohemia (GRAK 2021_21_58 and GRAK 2023-DS-1). We are very thankful to Wiley Editing Services for the English style revision. We would like to thank our colleagues for their help with field research and also for their help with the formal editing of the manuscript.
-
Author contributions: This article was written with the collaboration of all authors. VD drafted the final form of the manuscript and assisted during the fieldwork. PT contributed mainly on the methodological level, ensured the professional accuracy of the geophysical methods, and processed the results from the geophysical measurements. VS contributed at the geomorphological level of the manuscript and assisted during the fieldwork. PM ensured the professional accuracy of the geomorphological interpretations and assisted during the fieldwork. The order of the authors was determined on the basis of the proportion of author’s works.
-
Conflict of interest: Authors state no conflict of interest.
References
[1] Ballantyne CK. Age and significance of mountain-topdetritus. Permafr Periglac Process. 1998;9(4):327–45.10.1002/(SICI)1099-1530(199810/12)9:4<327::AID-PPP298>3.0.CO;2-9Search in Google Scholar
[2] Rea B. Blockfields (Felsenmeer). In Elias SA, editor. Encyclopedia of quaternary science. Amsterdam: Elsevier; 2013. p. 523–34.10.1016/B978-0-444-53643-3.00103-5Search in Google Scholar
[3] Engel Z, Braucher R, Aster Team. Origin and 10Be surface exposure dating of a coarse debris accumulation in the Hrubý Jeseník Mountains, Central Europe. Geomorphology. 2020;365:1–12.10.1016/j.geomorph.2020.107292Search in Google Scholar
[4] Żurawek R, Żyszkowski E, Górecki A. Topographic control of periglacial slope covers, Ślęża Massif, Southwest Poland: A statistical approach. Permafr Periglac Process. 2005;16:241–8.10.1002/ppp.521Search in Google Scholar
[5] Migoń P, Jancewicz K, Kasprzak M. Inherited periglacial geomorphology of a basalt hill in the Sudetes, Central Europe: Insights from LiDAR-aided landform mapping. Permafr Periglac Process. 2020;31:587–97.10.1002/ppp.2062Search in Google Scholar
[6] van Stein H. Stratified slope deposits: Periglacial and other processes involved. Geol Soc Spec Publ. 2011;354:213–26.10.1144/SP354.14Search in Google Scholar
[7] Colleoni F, Wekerle C, Näslund JO, Brandefelt J, Masina S. Constraint on the penultimate glacial maximum Northern Hemisphere ice topography (≈140 kyrs BP). Quat Sci Rev. 2016;137:97–112. 10.1016/j.quascirev.2016.01.024 Search in Google Scholar
[8] Evans RL, Law LK, St Louis B, Cheesman S. Buried paleo-channels on the New Jersey continental margin: Channel porosity structures from electromagnetic surveying. Mar Geol. 2000;170(3–4):381–94.10.1016/S0025-3227(00)00081-5Search in Google Scholar
[9] Völkel J, Leopold M, Roberts MC. The radar signatures and age of periglacial slope deposits, Central Highlands of Germany. Permafr Periglac Process. 2001;12:379–87.10.1002/ppp.402Search in Google Scholar
[10] Musil M, Maurer HR, Green AG, Horstmeyer H, Nietsche FO, Vonder Mühll D, et al. Shallow seismic surveying of an Alpine rock glacier. Geophysics. 2002;67(6):1701–10.10.1190/1.1527071Search in Google Scholar
[11] Gabriel G, Kirsch R, Siemon B, Wiederhold H. Geophysical investigation of buried Pleistocene subglacial valleys in Northern Germany. J Appl Geophys. 2003;53:159–80.10.1016/j.jappgeo.2003.08.005Search in Google Scholar
[12] Otto JC, Sass O. Comparing geophysical methods for talus slope investigation in the Turmann valley (Swiss Alps). Geomorphology. 2006;76:257–72.10.1016/j.geomorph.2005.11.008Search in Google Scholar
[13] Kasprzak M. High-resolution electrical resistivity tomography applied to patterned ground, (Wedel Jarlsberg Land, south-west Spitsbergen). Polar Res. 2015;34:25678. 10.3402/polar.v34.25678.Search in Google Scholar
[14] Stacke V, Tábořík P. Interaction of the hillslopes and valley bottoms on the NW slope of the Lysá hora Mt., the highest peak of the Western Beskids. Carpathian J Earth Environ Sci. 2015;10(2):159–74.Search in Google Scholar
[15] Hartvich F, Blahůt J, Stemberk J. Rock avalanche and rock glacier: A compound landform study from Hornsund, Svalbard. Geomorphology. 2017;276:244–56.10.1016/j.geomorph.2016.10.008Search in Google Scholar
[16] Loke MH. Electrical imaging surveys for environmental and engineering studies: A practical guide to 2-D and 3-D surveys. Geotomo Softw (1997-2000). 2000;67. https://pages.mtu.edu/∼ctyoung/LOKENOTE.PDF.Search in Google Scholar
[17] Musset AE, Khan AM. Looking into the Earth. An introduction to geological geophysics. London: Cambridge University Press; 2000. p. 492.Search in Google Scholar
[18] Pelton JR. Near-surface seismology: Surface-based methods. In Butler DK, editor. Near-surface geophysics. Tulsa: Society of Exploration Geophysics; 2005. p. 219–64.10.1190/1.9781560801719.ch8Search in Google Scholar
[19] Neal A. Ground-penetrating radar and its use in sedimentology: principles, problems and progress. Earth-Sci Rev. 2004;66(3):261–330.10.1016/j.earscirev.2004.01.004Search in Google Scholar
[20] Schrott L, Sass O. Application of field geophysics in geomorphology: advances and limitations exemplified by case studies. Geomorphology. 2008;93:55–73.10.1016/j.geomorph.2006.12.024Search in Google Scholar
[21] Milsom J, Eriksen A. Field geophysics. 4th Edn. London: Wiley and Sons; 2011. p. 304.10.1002/9780470972311Search in Google Scholar
[22] Słowik M. Influence of measurement conditions on depth range and resolution of GPR images: The example of lowland valley alluvial fill (the Obra River, Poland). J Appl Geophys. 2012;85:1–14.10.1016/j.jappgeo.2012.06.007Search in Google Scholar
[23] Tábořík P, Lenart J, Blecha V, Vilhelm J, Turský O. Geophysical anatomy of counter-slope scarps in sedimentary flysch rocks (Outer Western Carpathians). Geomorphology. 2017;276:59–70.10.1016/j.geomorph.2016.09.038Search in Google Scholar
[24] Blecha V, Fischer T, Tábořík P, Vilhem J, Klanica R, Valenta J, et al. Geophysical evidence of the eastern marginal fault of the Cheb basin (Czech Republic). Stud Geophys Geod. 2018;62(4):660–80.10.1007/s11200-017-0452-9Search in Google Scholar
[25] Sass O. Determination of the internal structure of alpine talus using different geophysical methods (Lechtaler Alps, Austria). Geomorphology. 2006;80:45–58.10.1016/j.geomorph.2005.09.006Search in Google Scholar
[26] Sass O. Bedrock detection and talus thickness assessment in the European Alps using geophysical methods. J Appl Geophys. 2007;62:254–69.10.1016/j.jappgeo.2006.12.003Search in Google Scholar
[27] Hauck C, Kneisel C, editors. Applied geophysics in periglacial environments. Cambridge: Cambridge University Press; 2008. p. 256.10.1017/CBO9780511535628Search in Google Scholar
[28] Uxa T, Křížek M, Krause D, Hartvich F, Tábořík P, Kasprzak M. Comment on ‘Geophysical approach to the study of a periglacial blockfield in a mountain area (Ztracené kameny, Eastern Sudetes, Czech Republic)’ by Stan et al. (2017). Geomorphology. 2019;328:231–7.10.1016/j.geomorph.2018.10.010Search in Google Scholar
[29] Hauner U, Lehrberger G, Brugger M. Der Naturraum Bayerischer Wald – Šumava In den Eiszeiten. Grafenau: Nationalparkverwaltung Bayerischer Wald; 2019.Search in Google Scholar
[30] Tolasz R. Climate atlas of Czechia. Praha: Czech Hydrometeorological Institute and Palacký University; 2007.Search in Google Scholar
[31] Treml V, Křížek M, Engel Z. Classification of patterned ground based on morphometry and site characteristics: A case study from the high sudetes, Central Europe. Permafr Periglac Process. 2010;21:67–77. 10.1002/ppp.671.Search in Google Scholar
[32] Völkel J, Zepp H, Kleber A. Periglaziale Deckschichten in Mittelgebirgen – ein offenes Forschungsfeld. Ber. z. dt. Landeskunde. 2002;76:101–14.Search in Google Scholar
[33] Raab T, Leopold M, Völkel J. Character, age, and ecological significance of pleistocene periglacial slope deposits in Germany. Phys Geogr. 2007;28(6):451–73.10.2747/0272-3646.28.6.451Search in Google Scholar
[34] Semmel A, Terhorst B. The concept of the Pleistocene periglacial cover beds in central Europe: A review. Quat Int. 2010;222:120–8.10.1016/j.quaint.2010.03.010Search in Google Scholar
[35] Štěpančíková P, Rowberry M. Rock landforms that reflect differential relief development in the north-eastern sector of the rychlebské hory and the adjacent area of žulovská pahorkatina (SE Sudeten Mts, Czech Republic). Acta Geodyn Geomater. 2008;5:297–321.Search in Google Scholar
[36] Pelc Z, Šebesta J. Sheets 22-33 – Kašperské Hory. Geological map of the Czech Republic (1:50 000). Praha, Czech Republic: Czech Geological Survey; 1994.Search in Google Scholar
[37] Český úřad zeměměřický a katastrální [Internet]. Praha: ČÚZK; 2022. [cited 2022 June 14] http://www.cuzk.cz/. (accessed on 14 June 2022).Search in Google Scholar
[38] Kneisel C, Hauck C. Electrical methods. In Hauck C, Kneisel C, editors. Applied geophysics in periglacial environments. Cambridge: Cambridge University Press; 2008. p. 3–27.10.1017/CBO9780511535628.002Search in Google Scholar
[39] Pánek T, Hradecký J, Minár J, Hungr O, Dušek R. Late Holocene catastrophic slope collapse affected by deep-seated gravitational deformation in flysch: Ropice Mountain, Czech Republic. Geomorphology. 2009;103:414–29. 10.1016/j.geomorph.2008.07.012.Search in Google Scholar
[40] Lenart J, Pánek T, Dušek R. Genesis, types and evolution of crevice-type caves in the flysch belt of the Western Carpathians (Czech Republic). Geomorphology. 2014;204:459–76.10.1016/j.geomorph.2013.08.025Search in Google Scholar
[41] Raška P, Hartvich F, Cajz V, Adamovič J. Structural setting of the Čertovka landslide (Ústí nad Labem, Czech Republic): morphostructural analysis and electrical resistivity tomography. Geol Q. 2014;58(1):85–98.10.7306/gq.1134Search in Google Scholar
[42] Kasprzak M, Strzelecki MC, Traczyk A, Kondracka M, Lim M, Migała K. On the potential for a bottom active layer below coastal permafrost: the impact of seawater on permafrost degradation imaged by electrical resistivity tomography (Hornsund, SW Spitsbergen). Geomorphology. 2017;293:347–59. 10.1016/j.geomorph.2016.06.013.Search in Google Scholar
[43] Engel Z, Křížek M, Kasprzak M, Traczyk A, Hložek M, Krbcová K. Geomorphological and sedimentary evidence of probable glaciation in the Jizerské hory Mountains, Central Europe. Geomorphology. 2017;280:39–50.10.1016/j.geomorph.2016.12.008Search in Google Scholar
[44] Stemberk J, Hartvich F, Blahut J, Rybář J, Krejčí O. Tectonic strain changes affecting the development of deep seated gravitational slope deformations in the Bohemian Massif and Outer Western Carpathians. Geomorphology. 2017;289:3–17.10.1016/j.geomorph.2016.07.004Search in Google Scholar
[45] Strzelecki MC, Kasprzak M, Lim M, Swirad ZM, Jaskólski M, Pawłowski Ł, et al. Cryo-conditioned rocky coast systems: A case study from Wilczekodden, Svalbard. Sci Total Env. 2017;607-608:443–53. 10.1016/j.scitotenv.2017.07.009.Search in Google Scholar PubMed
[46] Rizzo E, Colella A, Lapenna V, Piscitelli S. High-resolution images of the fault controlled High Agri Valley basin (Southern Italy) with deep and shallow Electrical Resistivity Tomographies. Phys Chem Earth. 2004;29:321–7.10.1016/j.pce.2003.12.002Search in Google Scholar
[47] Maillet GM, Rizzo E, Revil A, Vella C. High resolution electrical resistivity tomography (ERT) in a transition zone environment: Application for detailed internal architecture and infilling processes study of a Rhône River Paleo-channel. Mar Geophys Res. 2005;26:317–28.10.1007/s11001-005-3726-5Search in Google Scholar
[48] Nguyen F, Kemna A, Antonsson A, Engesgaard P, Kuras O, Ogilvy R, et al. Characterization of seawater intrusion using 2D electrical imaging. Surf Geophys. 2009;7:377–90.10.3997/1873-0604.2009025Search in Google Scholar
[49] Chalupa V, Pánek T, Tábořík P, Klimeš J, Hartvich F, Grygar R. Deep-seated gravitational slope deformations controlled by the structure of flysch nappe outliers: Insights from large-scale electrical resistivity tomography survey and LiDAR mapping. Geomorphology. 2018;321:174–87.10.1016/j.geomorph.2018.08.029Search in Google Scholar
[50] Loke MH, Barker RD. Rapid least-squares inversion of apparent resistivity pseudosections using a quasi-Newton method. Geophys Prospect. 1996;44:131–52.10.1111/j.1365-2478.1996.tb00142.xSearch in Google Scholar
[51] Dahlin T, Zhou B. A numerical comparison of 2D resistivity imaging with ten electrode arrays. Geophys Prospect. 2004;52(5):379–98.10.1111/j.1365-2478.2004.00423.xSearch in Google Scholar
[52] Tábořík P. Use of Electrical Resistivity Tomography in the Research of Mountain Relief. PhD thesis. Czech Republic: University of Ostrava; 2012 (in Czech).Search in Google Scholar
[53] Mentlík P. Development of summit parts in the SW part of Šumava Mts. – research by innovative methods. Habilitation thesis. Slovakia: Comenius University in Bratislava; 2011 (in Czech).Search in Google Scholar
[54] Zhou W, Beck BF, Adams AL. Effective electrode array in mapping karst hazards in electrical resistivity tomography. Env Geol. 2002;42:922–8.10.1007/s00254-002-0594-zSearch in Google Scholar
[55] Szalai S, Szarka L. Parameter sensitivity maps of surface geoelectric arrays: I. Linear arrays. Acta Geod Geophys Hung. 2008;43:419–37.10.1556/AGeod.43.2008.4.4Search in Google Scholar
[56] Szalai S, Novák A, Szarka L. Depth of investigation and vertical resolution of surface geoelectric arrays. J Env Eng Geophys. 2009;14:15–23.10.2113/JEEG14.1.15Search in Google Scholar
[57] Loke MH Tutorial: 2‐D and 3‐D Electrical Imaging Surveys. User’s Manual. 2019. Geotomo software; 2019. p. 85.Search in Google Scholar
[58] Sasaki Y. Resolution of resistivity tomography inferred from numerical simulation. Geophys Prospect. 1992;40(4):453–63.10.1111/j.1365-2478.1992.tb00536.xSearch in Google Scholar
[59] Loke MH, Kiflu H, Wilkinson PB, Harro D, Kruse S. Optimized arrays for 2D resistivity surveys with combined surface and buried arrays. Surf Geophys. 2015a;13(2096):505–17.10.3997/1873-0604.2015038Search in Google Scholar
[60] Loke MH, Wilkinson PB, Chambers JE, Uhlemann SS, Sorensen JPR. Optimized arrays for 2-D resistivity survey lines with a large number of electrodes. J Appl Geophys. 2015b;112:136–46.10.1016/j.jappgeo.2014.11.011Search in Google Scholar
[61] Schrott L, Hufschmidt G, Hankammer M, Hoffmann T, Dikau R. Spatial distribution of sediment storage types and quantification of valley fill deposits in an alpine basin, Reintal, Bavarian Alps, Germany. Geomorphology. 2003;55:45–63.10.1016/S0169-555X(03)00131-4Search in Google Scholar
[62] Schrott L, Hoffmann T. Refraction seismics. In Hauck C, Kneisel C, editors. Applied Geophysics in Periglacial Environments. Cambridge: Cambridge University Press; 2008. p. 57–80.10.1017/CBO9780511535628.004Search in Google Scholar
[63] Valenta J, Dohnal J. 3D seismic travel time surveying a comparison of the time–term method and tomography (an example from an archaeological site). J Appl Geophys. 2007;63:46–58.10.1016/j.jappgeo.2007.04.002Search in Google Scholar
[64] Hagedoorn JG. The plus-minus method of interpreting seismic refraction sections. Geophys Prospect. 1959;7:158–81.10.1111/j.1365-2478.1959.tb01460.xSearch in Google Scholar
[65] Nolet G. A breviary of seismic tomography: Imaging the interior of the Earth and Sun. Cambridge: Cambridge University Press; 2008. p. 360.10.1017/CBO9780511984709Search in Google Scholar
[66] Schuster G, Quintusz-Bosz A. Wavepath eikonal traveltime inversion. Theory Geophys. 1993;58(9):1314–23.10.1190/1.1443514Search in Google Scholar
[67] Spetzler J, Snieder R. Tutorial. The Fresnel volume and transmitted waves. Geophysics. 2004;69:643–63.10.1190/1.1759451Search in Google Scholar
[68] Göktürkler G, Balkayav Ç, Erhan Z. Geophysical investigation of a landslide: The Altındağ landslide site, İzmir (western Turkey). J Appl Geophys. 2008;65:84–96.10.1016/j.jappgeo.2008.05.008Search in Google Scholar
[69] Davis JL, Annan AP. Ground-penetrating radar for high-resolution mapping of soil and rock stratigraphy. Geophys Prospect. 1989;37:531–51.10.1111/j.1365-2478.1989.tb02221.xSearch in Google Scholar
[70] Sass O, Wollny K. Investigations regarding alpine talus slopes using ground penetrating radar (GPR) in the Bavarian Alps, Germany. Earth Surf Process Landf. 2001;26:1071–86.10.1002/esp.254Search in Google Scholar
[71] Berthling I, Melvold K. Ground-penetrating radar. In Hauck C, Kneisel C, editors. Applied geophysics in periglacial environments. Cambridge: Cambridge University Press; 2008. p. 81–97.10.1017/CBO9780511535628.005Search in Google Scholar
[72] Sass O. The use of GPR in determining talus thickness and talus structure. In Hauck C, Kneisel C, editors. Applied geophysics in periglacial environments. Cambridge: Cambridge University Press; 2008. p. 165–71.10.1017/CBO9780511535628.012Search in Google Scholar
[73] Campbell S, Affleck RT, Sinclair S. Ground-penetrating radar studies of permafrost, periglacial, and near-surface geology at McMurdo Station, Antarctica. Cold Reg Sci Technol. 2018;148:38–49.10.1016/j.coldregions.2017.12.008Search in Google Scholar
[74] Cabalski K, Dzierżek J, Kowalczyk S. Middle Pleistocene debris flows in the low mountains: Geological and georadar surveys at the Mosty site (Holy Cross Mountains, Poland). Quat Int. 2021;589:25–38.10.1016/j.quaint.2021.03.002Search in Google Scholar
[75] van Overmeeren RA. Radar facies of unconsolidated sediments in The Netherlands: A radar stratigraphy interpretation method for hydrogeology. J Appl Geophys. 1998;40:1–18.10.1016/S0926-9851(97)00033-5Search in Google Scholar
[76] Hauck C, Guglielmin M, Isaksen K, Vonder Mühll D. Applicability of frequency-domain and time-domain electromagnetic methods for mountain permafrost studies. Permafr Periglac. 2001;12:39–52.10.1002/ppp.383Search in Google Scholar
[77] Hördt A, Hauck C. Electromagnetic methods. In Hauck C, Kneisel C, editors. Applied geophysics in periglacial environments. Cambridge: Cambridge University Press; 2008. p. 28–56.10.1017/CBO9780511535628.003Search in Google Scholar
[78] Dobinski W, Zogala B, Wzietek K, Litwin L. Results of geophysical surveys on Kasprowy Wierch, the Tatra Mountains, Poland. In Hauck C, Kneisel C, editors. Applied geophysics in periglacial environments. Cambridge: Cambridge University Press; 2008. p. 126–36.10.1017/CBO9780511535628.009Search in Google Scholar
[79] McNeill JD. Electromagnetic terrain conductivity measurement at low induction numbers. Ontario: Geonics Limited; 1980.Search in Google Scholar
[80] Andrade FCM, Fischer T. Generalised relative and cumulative response functions for electromagnetic induction conductivity meters operating at low induction numbers. Geophys Prospect. 2018;66(3):595–602.10.1111/1365-2478.12553Search in Google Scholar
[81] Bustin RM, Mathews WH. Selective weathering of granitic clasts. Can J Earth Sci. 1979;16(2):215–23.10.1139/e79-020Search in Google Scholar
[82] Pye K. Granular disintegration of gneiss and migmatites. Catena. 1985;12:191–9.10.1016/S0341-8162(85)80017-5Search in Google Scholar
[83] Hill SM. The differential weathering of granitic rocks in Victoria, Australia. AGSO J Aust Geol Geophys. 1996;16(3):271–6.Search in Google Scholar
[84] Telford WM, Geldart LP, Sheriff RE. Applied Geophysics. Cambridge: Cambridge University Press; 1990.10.1017/CBO9781139167932Search in Google Scholar
[85] Barton N. Rock quality, seismic velocity, attenuation and anisotropy. London: Taylor & Francis; 2007. p. 729.10.1201/9780203964453Search in Google Scholar
[86] Whiteley RJ, Stewart SB. Case studies of shallow marine investigations in Australia with advanced underwater seismic refraction (USR). Explor Geophys. 2008;39:34–40.10.1071/EG08009Search in Google Scholar
[87] Albers B. Linear elastic wave propagation in unsaturated sands, silts, loams and clays. Transp Porous Media. 2011;86:537–57.10.1007/s11242-010-9638-0Search in Google Scholar
[88] Reynolds JM. An introduction to applied and environmental geophysics. 2nd Edn. Chichester: Wiley; 2011. p. 720.Search in Google Scholar
[89] Kiflu H, Kruse S, Loke MH, Wilkinson PB, Harro D. Improving resistivity survey resolution at sites with limited spatial extent using buried electrode arrays. J Appl Geophys. 2016;135:338–55. 10.1016/j.jappgeo.2016.10.011.Search in Google Scholar
[90] Beauvais A, Ritz M, Parisot JC, Bantsimba C. Testing etching hypothesis for the shaping of granite dome structures beneath lateritic weathering landsurfaces using ERT method. Earth Surf Process Landf. 2003;28:1071–80.10.1002/esp.504Search in Google Scholar
[91] Chambers JE, Wilkinson PB, Wardrop D, Hameed A, Hill I, Jeffrey C, et al. Bedrock detection beneath river terrace deposits using three-dimensional electrical resistivity tomography. Geomorphology. 2012;177–178:17–25.10.1016/j.geomorph.2012.03.034Search in Google Scholar
[92] Mustasaar M, Plado J, Jõeleht A. Determination of electromagnetic wave velocity in horizontally layered sedimentary target: A ground-penetrating radar study from Silurian Limestones, Estonia. Acta Geophys. 2012;60(2):357–70.10.2478/s11600-011-0068-3Search in Google Scholar
[93] Bruno F, Martillier F. Test of high-resolution seismic reflection and other geophysical techniques on the boup landslide in the Swiss Alps. Surv Geophys. 2000;21:335–50.10.1023/A:1006736824075Search in Google Scholar
[94] Cassidy NJ. Electrical and magnetic properties of rocks, soils and fluids. In: Jol HM, editor. Ground penetrating radar: Theory and applications. Amsterdam: Elsevier; 2009. p. 41–72.10.1016/B978-0-444-53348-7.00002-8Search in Google Scholar
[95] Conyers LB. Geophysics, ground-penetrating radar and archaeology. Soc Am Archaeol Bull. 1999;17(4):26–9.Search in Google Scholar
[96] van Overmeeren RA. Hagedoorn’s plus-minus method: The beauty of simplicity. Geophys Prospect. 2001;49:687–96.10.1111/j.1365-2478.1964.tb01888.xSearch in Google Scholar
[97] Nývlt D, Engel Z, Tyráček J. Pleistocene glaciations of Czechia. In Ehlers J, Gibbard PL, Hughes PD, editors. Quaternary Glaciations - Extent and Chronology: A Closer Look. Amsterdam: Elsevier; 2011. p. 37–46.10.1016/B978-0-444-53447-7.00004-0Search in Google Scholar
[98] Mentlík P, Minár J, Břízová E, Lisá L, Tábořík P, Stacke V. Glaciation in the surroundings of Prášilské Lake (Bohemian Forest, Czech Republic). Geomorphology. 2010;117:181–94.10.1016/j.geomorph.2009.12.001Search in Google Scholar
[99] Rinaldi VA, Redolfi ER, Santamarina JC. Characterization of collapsible soils with combined geophysical and penetration testing. In Robertson PK, Mayne PW, editors. Geotechnical site characterization: Proceedings of the First International Conference on Site Characterization – ISC'98, Atlanta, Georgia, USA, 19-22 April 1998. Rotterdam: Balkema; 1998. p. 581–8.Search in Google Scholar
[100] Wang P, Wang LM, Wang Q, Wang J. Study on critical shear wave velocity of saturated loess foundation soil liquefaction under different seismic magnitudes action. Adv Mat Res. 2012;594-597:1720–6.10.4028/www.scientific.net/AMR.594-597.1720Search in Google Scholar
[101] Sheriff RE, Geldart LP. Exploration seismology. 2nd Edn. Cambridge: Cambridge University Press; 1995. p. 628.10.1017/CBO9781139168359Search in Google Scholar
[102] Sharma PV. Environmental and engineering geophysics. Cambridge: Cambridge University Press; 1997. p. 499.Search in Google Scholar
[103] Colombero C, Comina C, Gianotti F, Sambuelli L. Waterborne and on-land electrical surveys to suggest the geological evolution of a glacial lake in NW Italy. J Appl Geophys. 2014;105:191–202.10.1016/j.jappgeo.2014.03.020Search in Google Scholar
[104] Wilson P. Block/Rock Streams. In Elias SA, editor. The encyclopedia of quaternary science. vol. 3, Amsterdam: Elsevier; 2013. p. 514–22.10.1016/B978-0-444-53643-3.00102-3Search in Google Scholar
[105] Janke JR, Regmi NR, Giardino JR, Vitek JD. Rock glaciers. In Shroder J, Giardino R, Harbor J, editors. Treatise on geomorphology. San Diego: Academic Press; 2013. p. 238–73.10.1016/B978-0-12-374739-6.00211-6Search in Google Scholar
© 2023 the author(s), published by De Gruyter
This work is licensed under the Creative Commons Attribution 4.0 International License.
Articles in the same Issue
- Regular Articles
- Diagenesis and evolution of deep tight reservoirs: A case study of the fourth member of Shahejie Formation (cg: 50.4-42 Ma) in Bozhong Sag
- Petrography and mineralogy of the Oligocene flysch in Ionian Zone, Albania: Implications for the evolution of sediment provenance and paleoenvironment
- Biostratigraphy of the Late Campanian–Maastrichtian of the Duwi Basin, Red Sea, Egypt
- Structural deformation and its implication for hydrocarbon accumulation in the Wuxia fault belt, northwestern Junggar basin, China
- Carbonate texture identification using multi-layer perceptron neural network
- Metallogenic model of the Hongqiling Cu–Ni sulfide intrusions, Central Asian Orogenic Belt: Insight from long-period magnetotellurics
- Assessments of recent Global Geopotential Models based on GPS/levelling and gravity data along coastal zones of Egypt
- Accuracy assessment and improvement of SRTM, ASTER, FABDEM, and MERIT DEMs by polynomial and optimization algorithm: A case study (Khuzestan Province, Iran)
- Uncertainty assessment of 3D geological models based on spatial diffusion and merging model
- Evaluation of dynamic behavior of varved clays from the Warsaw ice-dammed lake, Poland
- Impact of AMSU-A and MHS radiances assimilation on Typhoon Megi (2016) forecasting
- Contribution to the building of a weather information service for solar panel cleaning operations at Diass plant (Senegal, Western Sahel)
- Measuring spatiotemporal accessibility to healthcare with multimodal transport modes in the dynamic traffic environment
- Mathematical model for conversion of groundwater flow from confined to unconfined aquifers with power law processes
- NSP variation on SWAT with high-resolution data: A case study
- Reconstruction of paleoglacial equilibrium-line altitudes during the Last Glacial Maximum in the Diancang Massif, Northwest Yunnan Province, China
- A prediction model for Xiangyang Neolithic sites based on a random forest algorithm
- Determining the long-term impact area of coastal thermal discharge based on a harmonic model of sea surface temperature
- Origin of block accumulations based on the near-surface geophysics
- Investigating the limestone quarries as geoheritage sites: Case of Mardin ancient quarry
- Population genetics and pedigree geography of Trionychia japonica in the four mountains of Henan Province and the Taihang Mountains
- Performance audit evaluation of marine development projects based on SPA and BP neural network model
- Study on the Early Cretaceous fluvial-desert sedimentary paleogeography in the Northwest of Ordos Basin
- Detecting window line using an improved stacked hourglass network based on new real-world building façade dataset
- Automated identification and mapping of geological folds in cross sections
- Silicate and carbonate mixed shelf formation and its controlling factors, a case study from the Cambrian Canglangpu formation in Sichuan basin, China
- Ground penetrating radar and magnetic gradient distribution approach for subsurface investigation of solution pipes in post-glacial settings
- Research on pore structures of fine-grained carbonate reservoirs and their influence on waterflood development
- Risk assessment of rain-induced debris flow in the lower reaches of Yajiang River based on GIS and CF coupling models
- Multifractal analysis of temporal and spatial characteristics of earthquakes in Eurasian seismic belt
- Surface deformation and damage of 2022 (M 6.8) Luding earthquake in China and its tectonic implications
- Differential analysis of landscape patterns of land cover products in tropical marine climate zones – A case study in Malaysia
- DEM-based analysis of tectonic geomorphologic characteristics and tectonic activity intensity of the Dabanghe River Basin in South China Karst
- Distribution, pollution levels, and health risk assessment of heavy metals in groundwater in the main pepper production area of China
- Study on soil quality effect of reconstructing by Pisha sandstone and sand soil
- Understanding the characteristics of loess strata and quaternary climate changes in Luochuan, Shaanxi Province, China, through core analysis
- Dynamic variation of groundwater level and its influencing factors in typical oasis irrigated areas in Northwest China
- Creating digital maps for geotechnical characteristics of soil based on GIS technology and remote sensing
- Changes in the course of constant loading consolidation in soil with modeled granulometric composition contaminated with petroleum substances
- Correlation between the deformation of mineral crystal structures and fault activity: A case study of the Yingxiu-Beichuan fault and the Milin fault
- Cognitive characteristics of the Qiang religious culture and its influencing factors in Southwest China
- Spatiotemporal variation characteristics analysis of infrastructure iron stock in China based on nighttime light data
- Interpretation of aeromagnetic and remote sensing data of Auchi and Idah sheets of the Benin-arm Anambra basin: Implication of mineral resources
- Building element recognition with MTL-AINet considering view perspectives
- Characteristics of the present crustal deformation in the Tibetan Plateau and its relationship with strong earthquakes
- Influence of fractures in tight sandstone oil reservoir on hydrocarbon accumulation: A case study of Yanchang Formation in southeastern Ordos Basin
- Nutrient assessment and land reclamation in the Loess hills and Gulch region in the context of gully control
- Handling imbalanced data in supervised machine learning for lithological mapping using remote sensing and airborne geophysical data
- Spatial variation of soil nutrients and evaluation of cultivated land quality based on field scale
- Lignin analysis of sediments from around 2,000 to 1,000 years ago (Jiulong River estuary, southeast China)
- Assessing OpenStreetMap roads fitness-for-use for disaster risk assessment in developing countries: The case of Burundi
- Transforming text into knowledge graph: Extracting and structuring information from spatial development plans
- A symmetrical exponential model of soil temperature in temperate steppe regions of China
- A landslide susceptibility assessment method based on auto-encoder improved deep belief network
- Numerical simulation analysis of ecological monitoring of small reservoir dam based on maximum entropy algorithm
- Morphometry of the cold-climate Bory Stobrawskie Dune Field (SW Poland): Evidence for multi-phase Lateglacial aeolian activity within the European Sand Belt
- Adopting a new approach for finding missing people using GIS techniques: A case study in Saudi Arabia’s desert area
- Geological earthquake simulations generated by kinematic heterogeneous energy-based method: Self-arrested ruptures and asperity criterion
- Semi-automated classification of layered rock slopes using digital elevation model and geological map
- Geochemical characteristics of arc fractionated I-type granitoids of eastern Tak Batholith, Thailand
- Lithology classification of igneous rocks using C-band and L-band dual-polarization SAR data
- Analysis of artificial intelligence approaches to predict the wall deflection induced by deep excavation
- Evaluation of the current in situ stress in the middle Permian Maokou Formation in the Longnüsi area of the central Sichuan Basin, China
- Utilizing microresistivity image logs to recognize conglomeratic channel architectural elements of Baikouquan Formation in slope of Mahu Sag
- Resistivity cutoff of low-resistivity and low-contrast pays in sandstone reservoirs from conventional well logs: A case of Paleogene Enping Formation in A-Oilfield, Pearl River Mouth Basin, South China Sea
- Examining the evacuation routes of the sister village program by using the ant colony optimization algorithm
- Spatial objects classification using machine learning and spatial walk algorithm
- Study on the stabilization mechanism of aeolian sandy soil formation by adding a natural soft rock
- Bump feature detection of the road surface based on the Bi-LSTM
- The origin and evolution of the ore-forming fluids at the Manondo-Choma gold prospect, Kirk range, southern Malawi
- A retrieval model of surface geochemistry composition based on remotely sensed data
- Exploring the spatial dynamics of cultural facilities based on multi-source data: A case study of Nanjing’s art institutions
- Study of pore-throat structure characteristics and fluid mobility of Chang 7 tight sandstone reservoir in Jiyuan area, Ordos Basin
- Study of fracturing fluid re-discharge based on percolation experiments and sampling tests – An example of Fuling shale gas Jiangdong block, China
- Impacts of marine cloud brightening scheme on climatic extremes in the Tibetan Plateau
- Ecological protection on the West Coast of Taiwan Strait under economic zone construction: A case study of land use in Yueqing
- The time-dependent deformation and damage constitutive model of rock based on dynamic disturbance tests
- Evaluation of spatial form of rural ecological landscape and vulnerability of water ecological environment based on analytic hierarchy process
- Fingerprint of magma mixture in the leucogranites: Spectroscopic and petrochemical approach, Kalebalta-Central Anatolia, Türkiye
- Principles of self-calibration and visual effects for digital camera distortion
- UAV-based doline mapping in Brazilian karst: A cave heritage protection reconnaissance
- Evaluation and low carbon ecological urban–rural planning and construction based on energy planning mechanism
- Modified non-local means: A novel denoising approach to process gravity field data
- A novel travel route planning method based on an ant colony optimization algorithm
- Effect of time-variant NDVI on landside susceptibility: A case study in Quang Ngai province, Vietnam
- Regional tectonic uplift indicated by geomorphological parameters in the Bahe River Basin, central China
- Computer information technology-based green excavation of tunnels in complex strata and technical decision of deformation control
- Spatial evolution of coastal environmental enterprises: An exploration of driving factors in Jiangsu Province
- A comparative assessment and geospatial simulation of three hydrological models in urban basins
- Aquaculture industry under the blue transformation in Jiangsu, China: Structure evolution and spatial agglomeration
- Quantitative and qualitative interpretation of community partitions by map overlaying and calculating the distribution of related geographical features
- Numerical investigation of gravity-grouted soil-nail pullout capacity in sand
- Analysis of heavy pollution weather in Shenyang City and numerical simulation of main pollutants
- Road cut slope stability analysis for static and dynamic (pseudo-static analysis) loading conditions
- Forest biomass assessment combining field inventorying and remote sensing data
- Late Jurassic Haobugao granites from the southern Great Xing’an Range, NE China: Implications for postcollision extension of the Mongol–Okhotsk Ocean
- Petrogenesis of the Sukadana Basalt based on petrology and whole rock geochemistry, Lampung, Indonesia: Geodynamic significances
- Numerical study on the group wall effect of nodular diaphragm wall foundation in high-rise buildings
- Water resources utilization and tourism environment assessment based on water footprint
- Geochemical evaluation of the carbonaceous shale associated with the Permian Mikambeni Formation of the Tuli Basin for potential gas generation, South Africa
- Detection and characterization of lineaments using gravity data in the south-west Cameroon zone: Hydrogeological implications
- Study on spatial pattern of tourism landscape resources in county cities of Yangtze River Economic Belt
- The effect of weathering on drillability of dolomites
- Noise masking of near-surface scattering (heterogeneities) on subsurface seismic reflectivity
- Query optimization-oriented lateral expansion method of distributed geological borehole database
- Petrogenesis of the Morobe Granodiorite and their shoshonitic mafic microgranular enclaves in Maramuni arc, Papua New Guinea
- Environmental health risk assessment of urban water sources based on fuzzy set theory
- Spatial distribution of urban basic education resources in Shanghai: Accessibility and supply-demand matching evaluation
- Spatiotemporal changes in land use and residential satisfaction in the Huai River-Gaoyou Lake Rim area
- Walkaway vertical seismic profiling first-arrival traveltime tomography with velocity structure constraints
- Study on the evaluation system and risk factor traceability of receiving water body
- Predicting copper-polymetallic deposits in Kalatag using the weight of evidence model and novel data sources
- Temporal dynamics of green urban areas in Romania. A comparison between spatial and statistical data
- Passenger flow forecast of tourist attraction based on MACBL in LBS big data environment
- Varying particle size selectivity of soil erosion along a cultivated catena
- Relationship between annual soil erosion and surface runoff in Wadi Hanifa sub-basins
- Influence of nappe structure on the Carboniferous volcanic reservoir in the middle of the Hongche Fault Zone, Junggar Basin, China
- Dynamic analysis of MSE wall subjected to surface vibration loading
- Pre-collisional architecture of the European distal margin: Inferences from the high-pressure continental units of central Corsica (France)
- The interrelation of natural diversity with tourism in Kosovo
- Assessment of geosites as a basis for geotourism development: A case study of the Toplica District, Serbia
- IG-YOLOv5-based underwater biological recognition and detection for marine protection
- Monitoring drought dynamics using remote sensing-based combined drought index in Ergene Basin, Türkiye
- Review Articles
- The actual state of the geodetic and cartographic resources and legislation in Poland
- Evaluation studies of the new mining projects
- Comparison and significance of grain size parameters of the Menyuan loess calculated using different methods
- Scientometric analysis of flood forecasting for Asia region and discussion on machine learning methods
- Rainfall-induced transportation embankment failure: A review
- Rapid Communication
- Branch fault discovered in Tangshan fault zone on the Kaiping-Guye boundary, North China
- Technical Note
- Introducing an intelligent multi-level retrieval method for mineral resource potential evaluation result data
- Erratum
- Erratum to “Forest cover assessment using remote-sensing techniques in Crete Island, Greece”
- Addendum
- The relationship between heat flow and seismicity in global tectonically active zones
- Commentary
- Improved entropy weight methods and their comparisons in evaluating the high-quality development of Qinghai, China
- Special Issue: Geoethics 2022 - Part II
- Loess and geotourism potential of the Braničevo District (NE Serbia): From overexploitation to paleoclimate interpretation