
A prediction model for Xiangyang Neolithic sites based on a random forest algorithm
-
Linzhi Li
 and
Haijia Wen
and
Haijia Wen

Abstract
The archaeological site prediction model can accurately identify archaeological site areas to enable better knowledge and understanding of human civilization processes and social development patterns. A total of 129 Neolithic site data in the region were collected using the Xiangyang area as the study area. An eight-factor index system of elevation, slope, slope direction, micromorphology, distance to water, slope position, planar curvature, and profile curvature was constructed. A geospatial database with a resolution of 30 m × 30 m was established. The whole sample set was built and trained in the ratio of 1:1 archaeological to nonarchaeological sites to obtain the prediction results. The average Gini coefficient was used to evaluate the influence of various archaeological site factors. The results revealed that the area under the curve values of the receiver operating characteristic curves were 1.000, 0.994, and 0.867 for the training, complete, and test datasets, respectively. Moreover, 60% of the historical, archaeological sites were located in the high-probability zone, accounting for 12% of the study area. The prediction model proposed in this study matched the spatial distribution characteristics of archaeological site locations. With the model assessed using the best samples, the results were categorized into three classes: low, average, and high. The proportion of low-, average-, and high-probability zones decreased in order. The high-probability zones were mainly located near the second and third tributaries and distributed at the low eastern hills and central hillocks. The random forest (RF) model was used to rank the importance of archaeological site variables. Elevation, slope, and micro-geomorphology were classified as the three most important variables. The RF model for archaeological site prediction has better stability and predictive ability in the case field; the model provides a new research method for archaeological site prediction and provides a reference for revealing the relationship between archaeological activities and the natural environment.
1 Introduction
Archaeological sites are an important source of information on ancient societies’ economic, cultural, and social patterns and can simulate and reconstruct history and its evolution. Site detection is associated with many complex environmental elements, and the extent of the regional boundaries of archaeological sites is difficult for humans to define precisely; therefore, it is necessary to develop archaeological site prediction models and better solutions to improve the prediction of the spatial probability of archaeological sites to discover them, optimize site survey design, and develop and build avoiding archaeological high-probability zone [1]. In recent years, Chinese archaeology has been upgraded from a secondary to a primary discipline in history fields. As archaeological excavations have become increasingly important, scientific predictions of the spatial extent of archaeological sites have become the focus of government and academic attention. This study elaborates on the development of archaic site selection based on predictions and examines the exploration, adaptation, and interrelationship of archaic humans to their environment, laying the foundation for a deeper understanding of archaeological civilizations.
Archaeological site prediction is fundamental to exploring the relationship between ancient human activity and the environment. Archaeological site prediction mostly uses Kohler and Parker’s description, which forecasts the location of archaeological sites or materials in a region based on a sample of the area or human behavior, i.e., it depicts the spatial distribution of the probability of occurrence of archaeological sites and determines the exact location of archaeological remains [2,3,4]. The continuous improvement in archaeological site prediction methods is conducive to improving the scientific nature of archaeological site prediction results and the effective identification of the spatial extent of archaeological sites, which in turn facilitate the high-quality development of subsequent archaeological research work. In recent years, with the new importance accorded by the state to archaeology and the flourishing of archaeological excavations, the field of archaeological site prediction has made significant progress, mainly in the following two areas. First, the study of prediction index systems. Based on traditional index systems, such as elevation, slope, and orientation, predicting archaeological sites has recently introduced other factors, such as soil, exposure, sediment, and location, in response to the specificity of the study area and the development context [5,6,7]. Second, the innovation of archaeological site prediction methods. Based on statistical analysis, evidence reasoning, fuzzy logic, and logistic regression, maximum entropy (MaxEnt), ecological modeling, and supervised learning techniques have been introduced [7,8,9,10,11,12,13]. According to previous studies, some urgent problems remain in predicting the results of archaeological sites. The construction of the index system and the setting of weights are subjective and hindered by human factors. Depending on the research background and professional ability of the forecaster, the constructed indicator system is non-universal, and there are differences in weight setting [14,15].
With the rise of big data, some machine-learning algorithms are starting to be used in archaeology, including random forest (RF), logistic regression, and neural networks [2,16]. Machine-learning algorithms are a theoretical approach based on computers and statistics, which select a small number of known data samples to build a model and obtain patterns from which the prediction of unknown data can be made [17]. These algorithms have huge advantages over traditional methods. Currently, the use of machine learning is being explored in archaeological site prediction. Märker and Heydari-Guran [18] were the first to use machine-learning approaches in the field of archaeological site prediction, employing logistic regression to forecast the location of paleolithic sites in Iran’s Zagros Mountains; Roalkvam [19] selected the factors of wind absorption, visibility, shoreline displacement, island location, sediment and infiltration capacity, proposed that RF predicts higher probability values and that sites are primarily located in open environments and in the vast open sea of refuges, and compared logistic regression with RFs to appraise formally and graphically the environmental variables underlying the position of a Mesolithic coastal site in Norway and to determine the relative importance of these variables; Castiello and Tonini [20] applied RF for archaeological predictive modelling in the Canton of Zurich, Switzerland, to evaluate the regional likelihood of the existence of Roman settlements; Caspari and Crespo [21] created a convolutional neural network using optical satellite data to detect early Iron Age tombs and conduct a quantitative overview. Machine learning in archaeological site prediction explores the relationship between the environment and the site using environmental factors and archaeological site location prediction maps. However, there have been preliminary attempts to apply machine learning to archaeological site prediction, but research in China is still lacking. Based on previous research, the RF algorithm, as a machine-learning algorithm, can improve prediction accuracy through multiple decision trees, solve the overfitting problem, and detect the interplay of factors. It also possesses a strong generalization ability and has consequently been widely used in the fields of evaluation, verification, and prediction [15].
Different from the aforementioned studies, this study also considers the validation of typical watersheds and famous sites in the model based on prediction mapping. It is relatively rare in China to utilize machine learning in archaeological site prediction. The Xiangyang region, as the hinterland of the middle reaches of the Han River plain and the birthplace of Jingchu culture, with its diverse and distinctive landscape types, is an ideal area to employ RF in the construction of archaeological site prediction models. Archaeological work has shown that the area is densely populated with Neolithic archaeological sites, such as the famous Fenghuangzui New Site and the Carved Dragon Monument Site (Figure 1). In this study, the RF algorithm was utilized to establish an archaeological site prediction model, and the results were assessed for reliability and validated for future application. The methodology of the study is presented in Figure 1. First, the data from 129 archaeological sites in the Xiangyang area and the ArcGIS10.6 platform were combined to select eight influential factors. Second, based on known archaeological sites, negative samples were randomly selected according to a ratio of 1:1 to construct a geospatial database. Third, the RF algorithm was used to train and test the archaeological site prediction model to generate archaeological site prediction maps. Fourth, specific archaeological site case areas were analyzed to verify the validity of the RF model for archaeological site prediction. Finally, the average Gini coefficient was used to ascertain the importance of the impact factors. The archaeological site prediction model developed in this article can provide a targeted reference for archaeological excavations and be employed to identify areas that merit more detailed investigation. In the future, geomorphic and higher spatial resolution digital elevation information is needed for the study area to generate more accurate predictive models locally.

Technology roadmap.
2 Overview of the research area
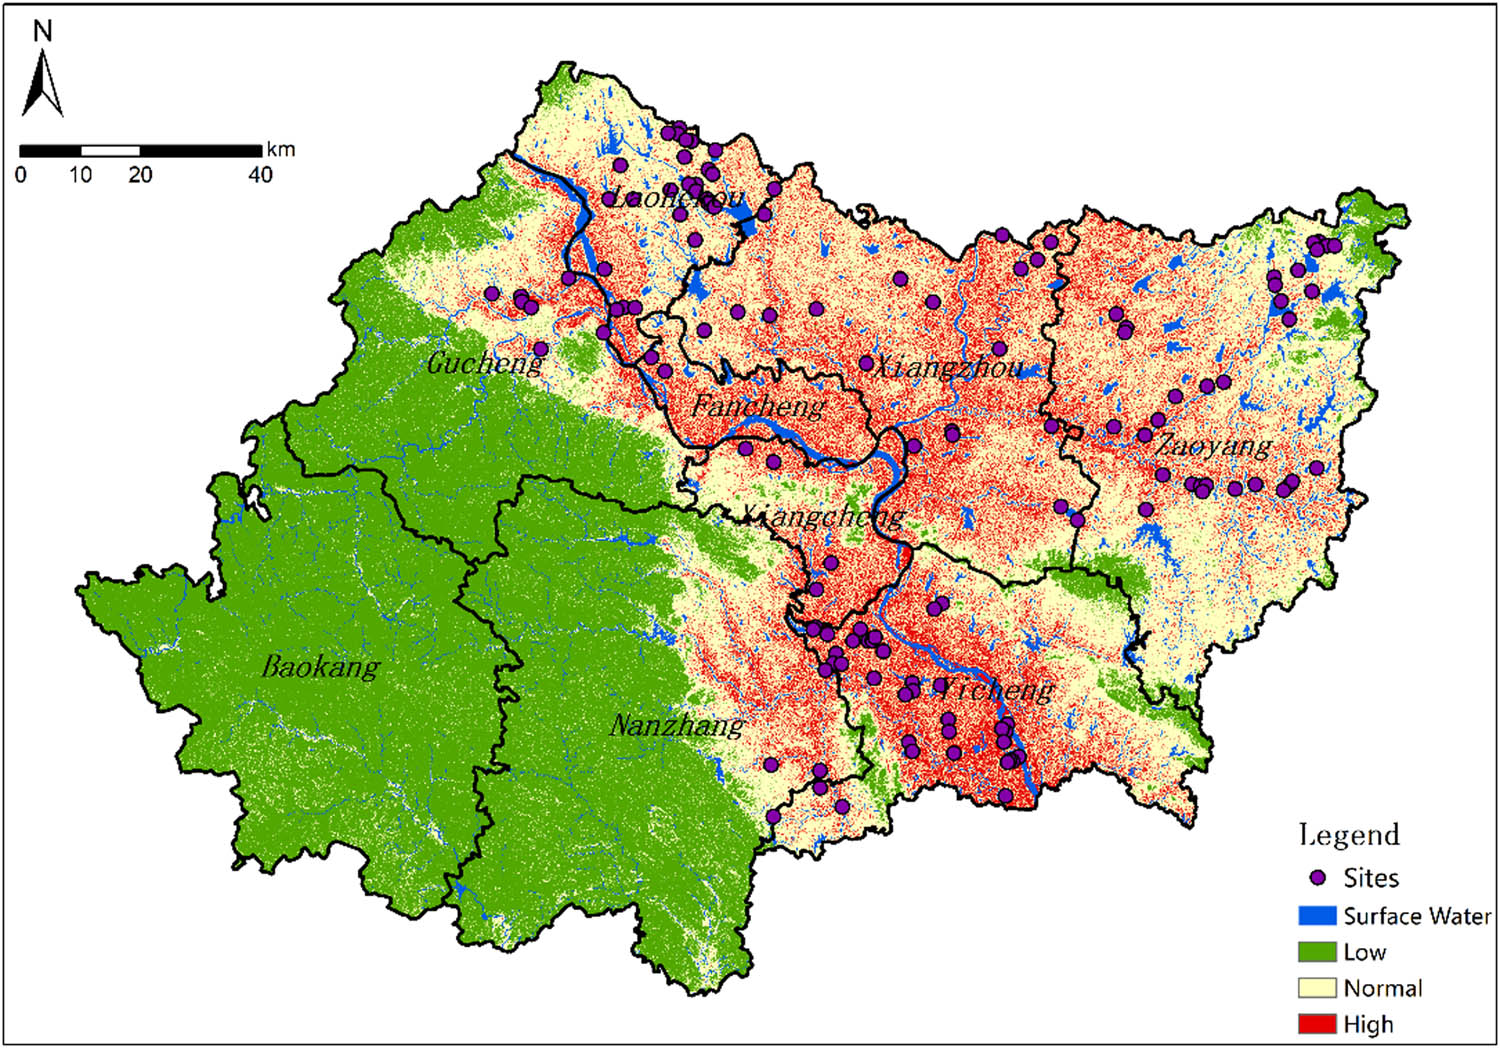
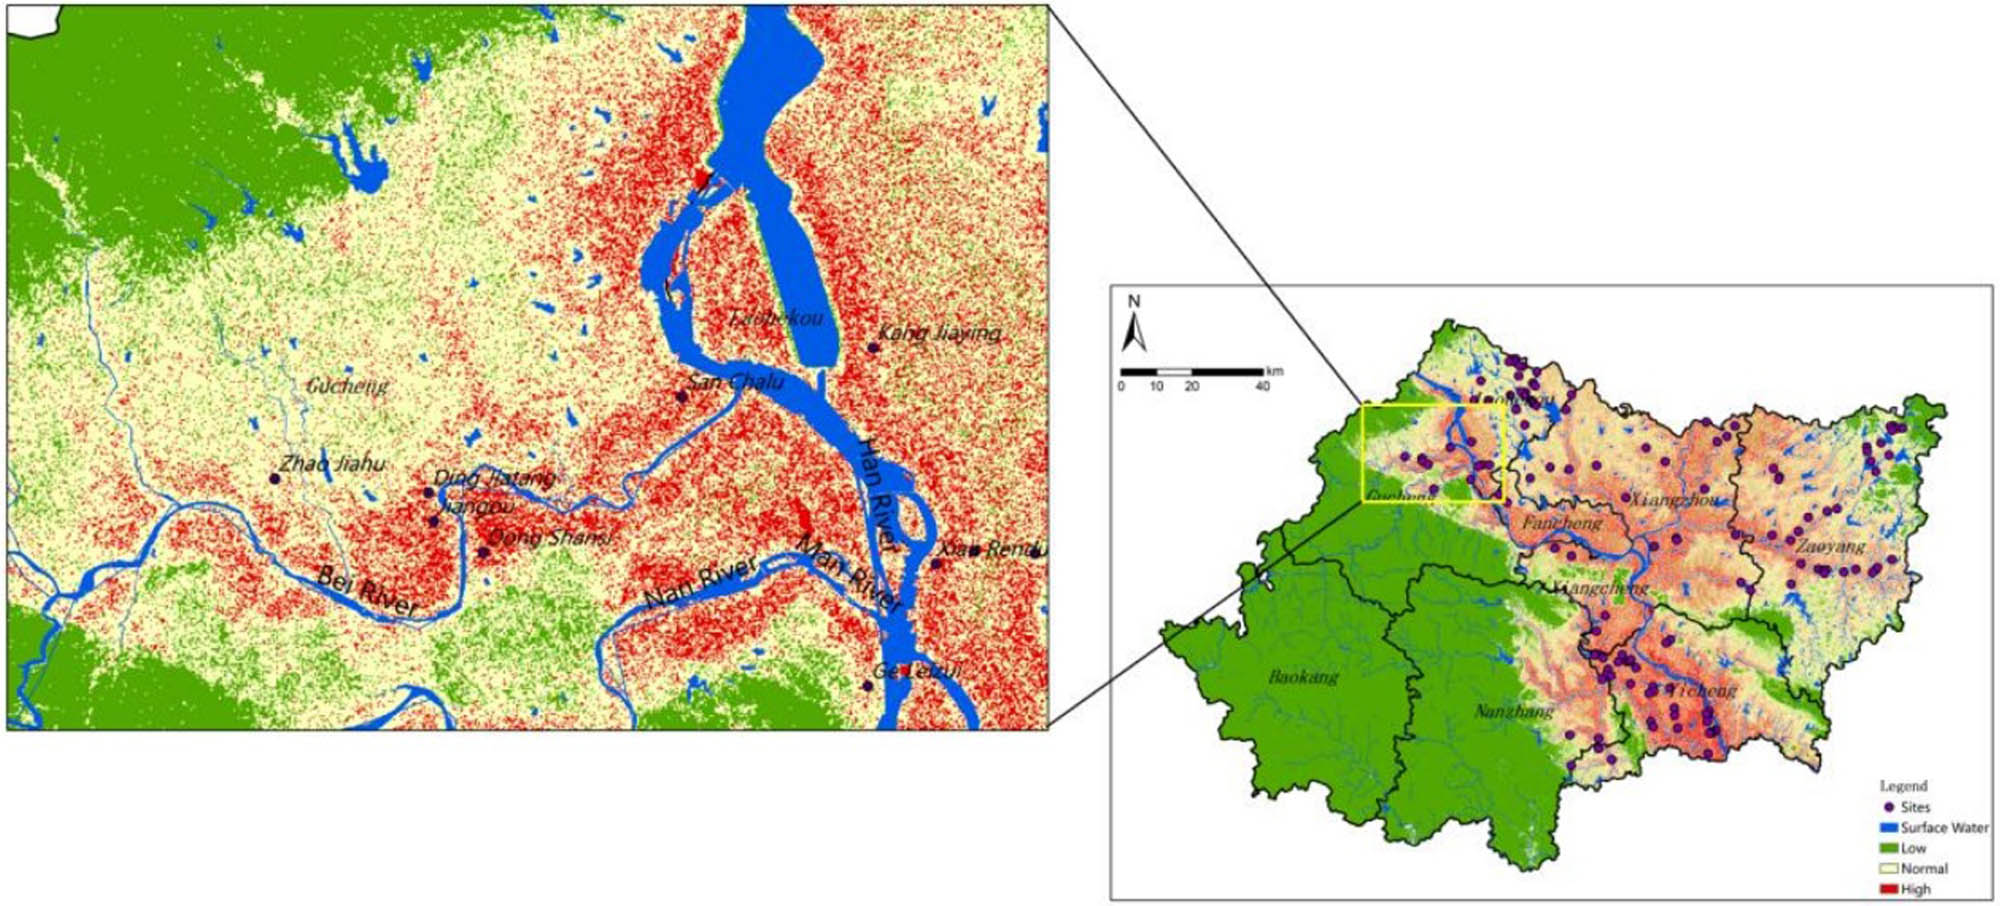
Xiangyang is located between longitude 110°45′–113°06′ East and latitude 31°13′–32°37′ North in the Han River’s middle reaches and northeastern Hubei Province. It is a transition zone from the second to the third terrain in China, with the topography being low in the east and high in the west, sloping from northwest to southeast, with hills, hills, and mountains in the east, central, and west, respectively, accounting for approximately 20, 40, and 40%. In the east are low hills, mostly between 90 and 250 m above the sea level, mainly in the eastern part of Zaoyang, such as Xinshi town, Luton town, Liu Sheng town, Wudian town, Pinglin town, and Wang town. The central element is hilly with plains, mainly in the western townships of Zaoyang, Xiangyang, Yicheng, and Laohekou and the eastern townships of Nanzhang, with Yicheng Kongwan town’s Bajiaomiao village, 44 m above the sea level, being the lowest point in the city. The western part is mountainous, including all of Baokang, most of Gucheng, and the central and western part of Nanzhang, with altitudesmostly above 400 m, and Baokang Guanshan, at 2,000 m, being the highest point in the city. Most of the archaeological sites in the research area are situated in the hinterland near the tributaries of the Han River basin. This suggests that the choice of location for ancient humans was constrained by the natural environment and that underdeveloped production methods and productivity made ancient humans dependent on the natural environment. In addition, the spatial distribution of archaeological sites is uneven; specifically, the number of places in the main streams is significantly less than the number of locations in the tributaries; see Figure 2 for details.
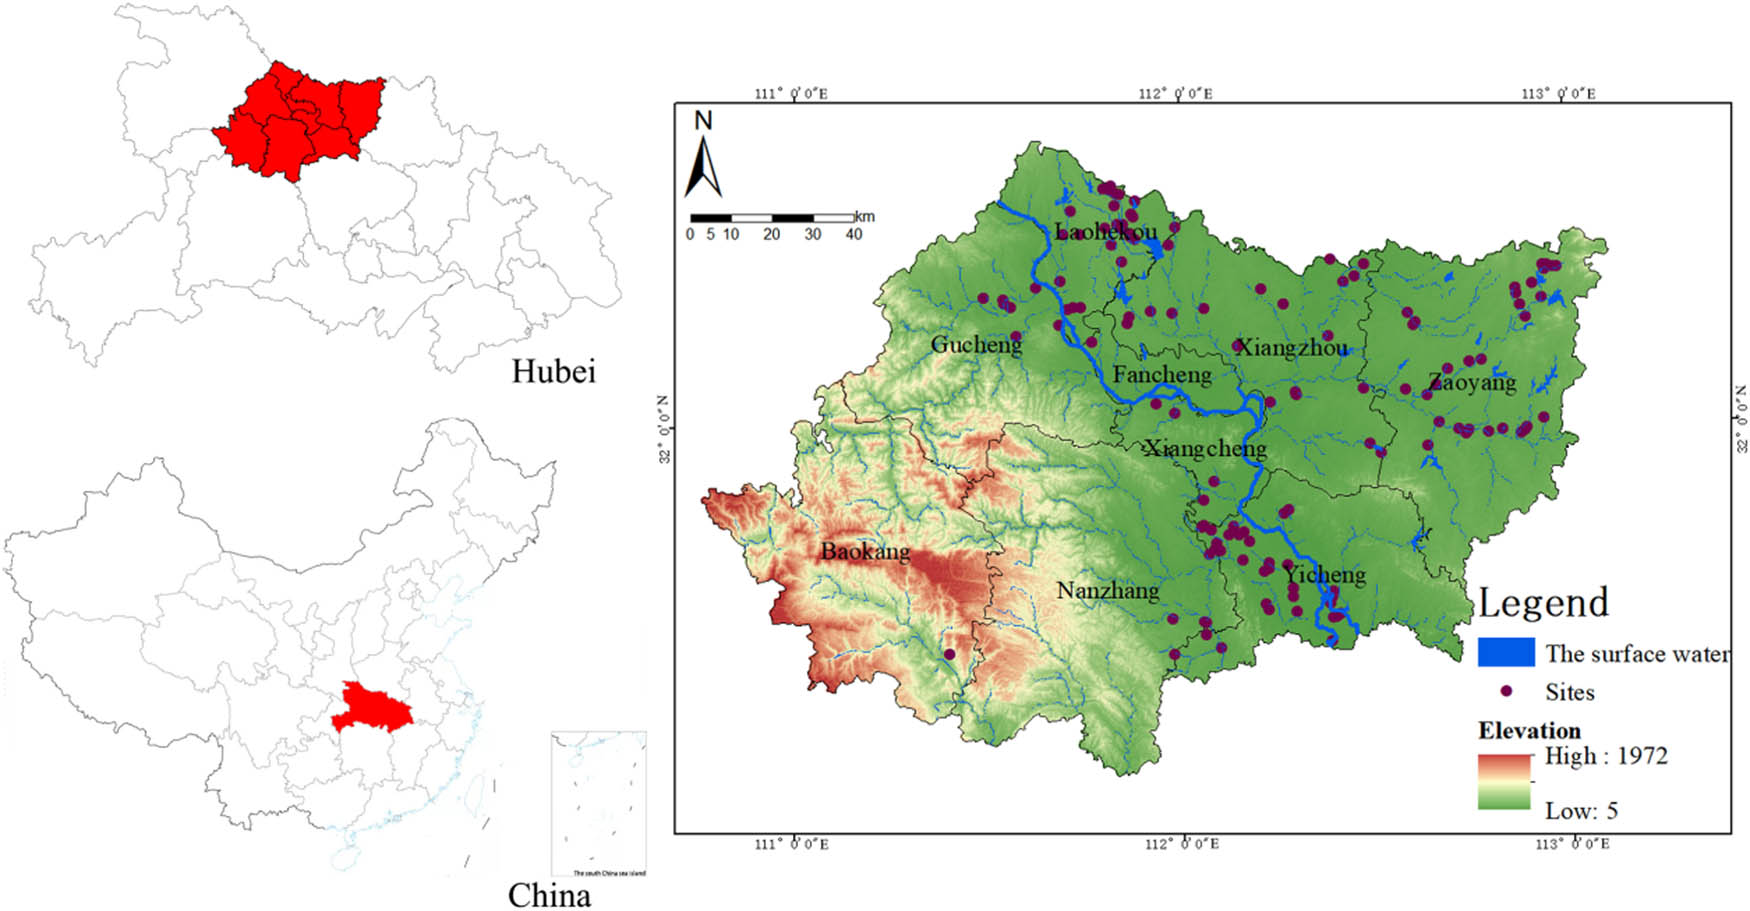
Administrative division of the research area and distribution map of ancient sites.
3 Research data and research methods
3.1 Data sources
The archaeological site data were obtained from the Hubei subvolume of the Atlas of Chinese Cultural Relics and from archaeological excavation reports [22]. The Hubei subvolume separately collects archaeological data up to December 2003, which map in detail the location, name, and other information of ancient sites. A total of 129 archaeological site locations (excluding burials) from the Neolithic period in Xiangyang were extracted for this study, a dataset that consists of the majority of notable and published Late Neolithic sites in the study area. These datasets were combined to evaluate the impact of each parameter in relation to the location of the archaeological sites. Sites of unknown date were excluded from this article based on the need for analysis and with reference to the treatment of the relevant literature. The geography of the study area is relatively stable at a macroscopic scale, and modern geographic differences still reflect the characteristics of past environments to some extent, making it feasible to study ancient sites using modern digital elevation models (DEMs), whose origin was the Geospatial Data Cloud (http://www.gscloud.cn/); see Table 1 for details.
Data types and data sources
| Data name | Data sources | Type | Accuracy |
|---|---|---|---|
| Archaeological site | Atlas of Chinese Cultural Relics – Hubei Branch, Annals of Chinese Archaeology 1982–2019, master’s theses, excavation reports, and other related research | Data atlas | |
| DEM | Geospatial Data Cloud | Raster | 30 m |
| Water bodies | Resource and Environment Science and Data Center | Vector | 1:100,000 |
| Administrative district map | Vector | 1:100,000 |
3.2 Research methodology
3.2.1 RF
The RF algorithm, first proposed by Breiman [23] and Cutler et al. [24], is a comprehensive algorithm that consists of multiple decision trees integrated into a forest to predict the outcome, thus circumventing the one-sidedness of a single decision tree. A model consisting of n unrelated decision trees was constructed [h(X, θk); k = 1…], and every decision tree in the sample model can determine or predict the categorization of a sample separately (for the classification algorithm). Each decision tree individually determines or indicates the classification of the sample (for the classification algorithm). The prediction is determined to be the highest classification in the sample. Equation 1 is as follows:
where H(x) denotes the model output, h i (x) depicts the model of a single decision tree, Z stands for the output variable, and I(·) stands for an explicit function (Sun Deliang 2019). An RF flow chart is shown in Figure 3.
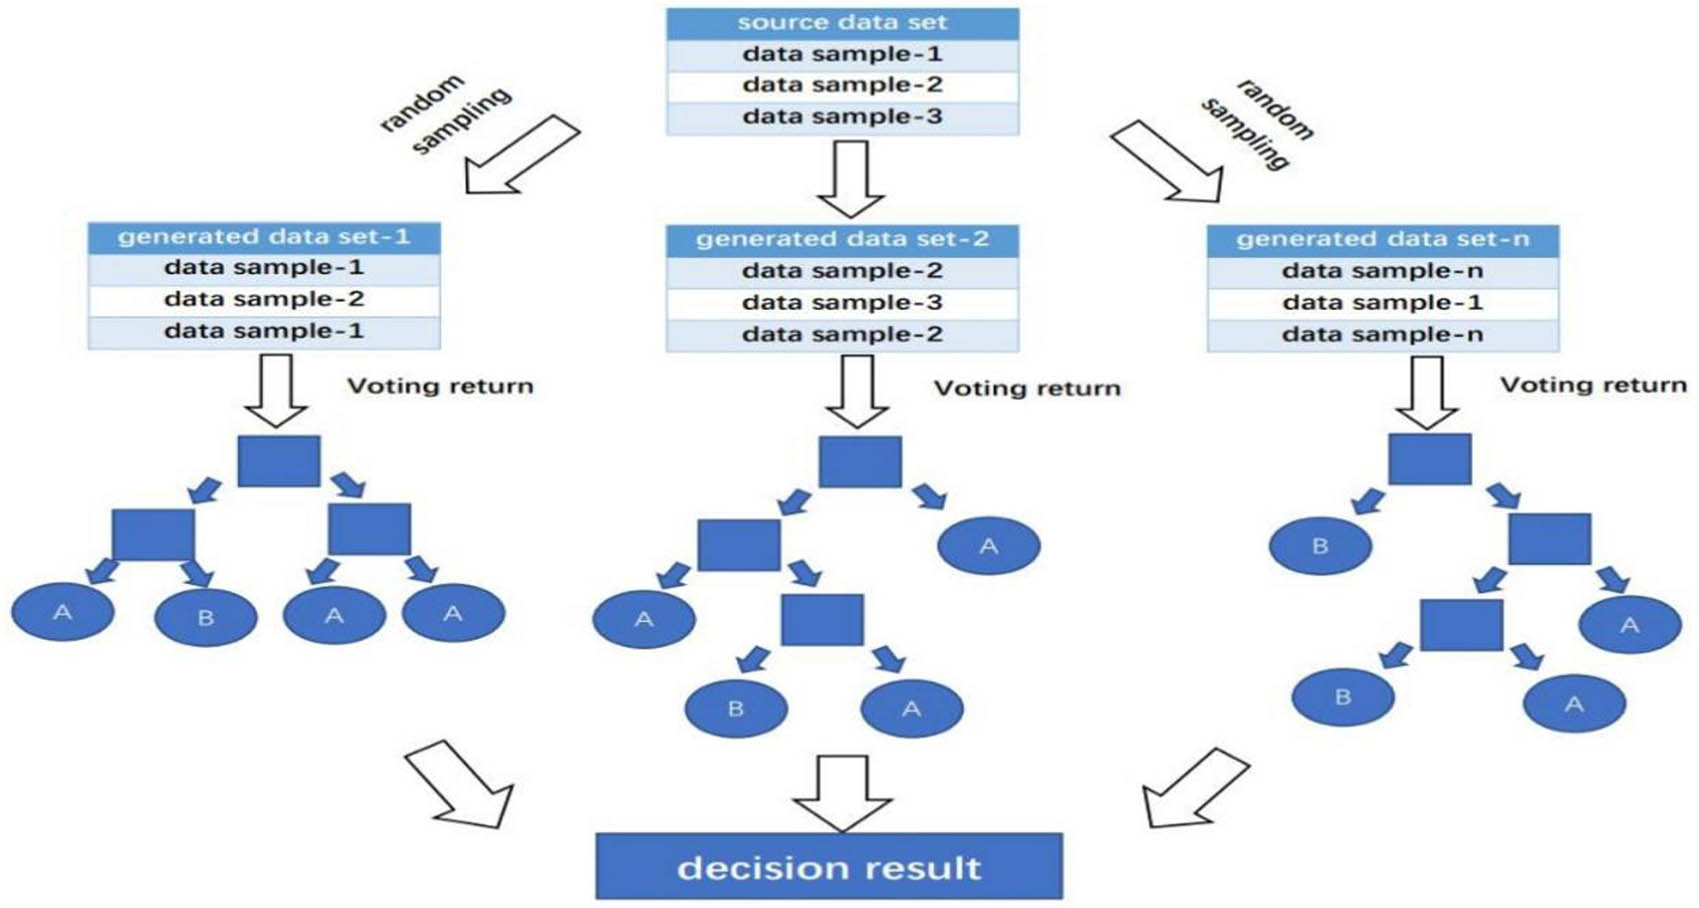
RF flow chart.
Model stability can be determined by randomly selecting training samples from two different trees, and the split nature of the nodes avoids overfitting of the model. The relative weights of the influencing factors can be determined by the Gini index of the RF, which calculates the impurity of the nodes to assess the significance of the features. Gini impurity is a measure of the probability of opposing events for a randomly selected subset of the dataset [25]. Equation (2) is as follows.
where Gini denotes the Gini coefficient, t denotes the node, p(i|t) denotes the randomly selected object assigned to class i, and p(j|t) denotes the estimated likelihood that the object belongs to class j.
3.2.2 Normalization
To eliminate the effect of different factor magnitudes [25], the original values of the eight factors were normalized to values between [0,1]. For the normalized formula, see the following equation:
where x is the normalized data result, x′ is the original data for each factor, x min represents the lowest value of the actual component, and x max represents its highest value.
4 Projections of Neolithic archaeological sites
4.1 Construction of the indicator system
The natural environment is a central element in the consideration of archaeological site selection, and an objective assessment of the relationship between the natural environment and archaeological sites is the driving mechanism for identifying the spatial distribution of archaeological sites. The factors chosen in this article are elevation, slope, slope direction, slope position, micromorphology, profile curvature, plan curvature, and proximity to water (Figure 4). It is worth noting that planar curvature and profile curvature are rarely used in archaeological site prediction probability models. To explore the spatial location of archaeological sites, ArcGIS10.6 software was used to vectorize the archaeological sites to form a spatial database of archaeological sites. Geographical environment data, such as slope, slope direction, slope position, and micromorphology, were extracted through DEM data. At the same time, the distance from the site point to the river was obtained using the point-to-line distance tool to construct the near-water distance factor. All factors were converted into a raster corresponding to the DEM resolution (with 30 m × 30 m cells), and the continuous factors were classified. The classification scheme for the continuous factors was constructed based on field surveys, expert experience, and study cases. As microtopography, slope position, and slope orientation are not continuous assignments, they were reclassified.
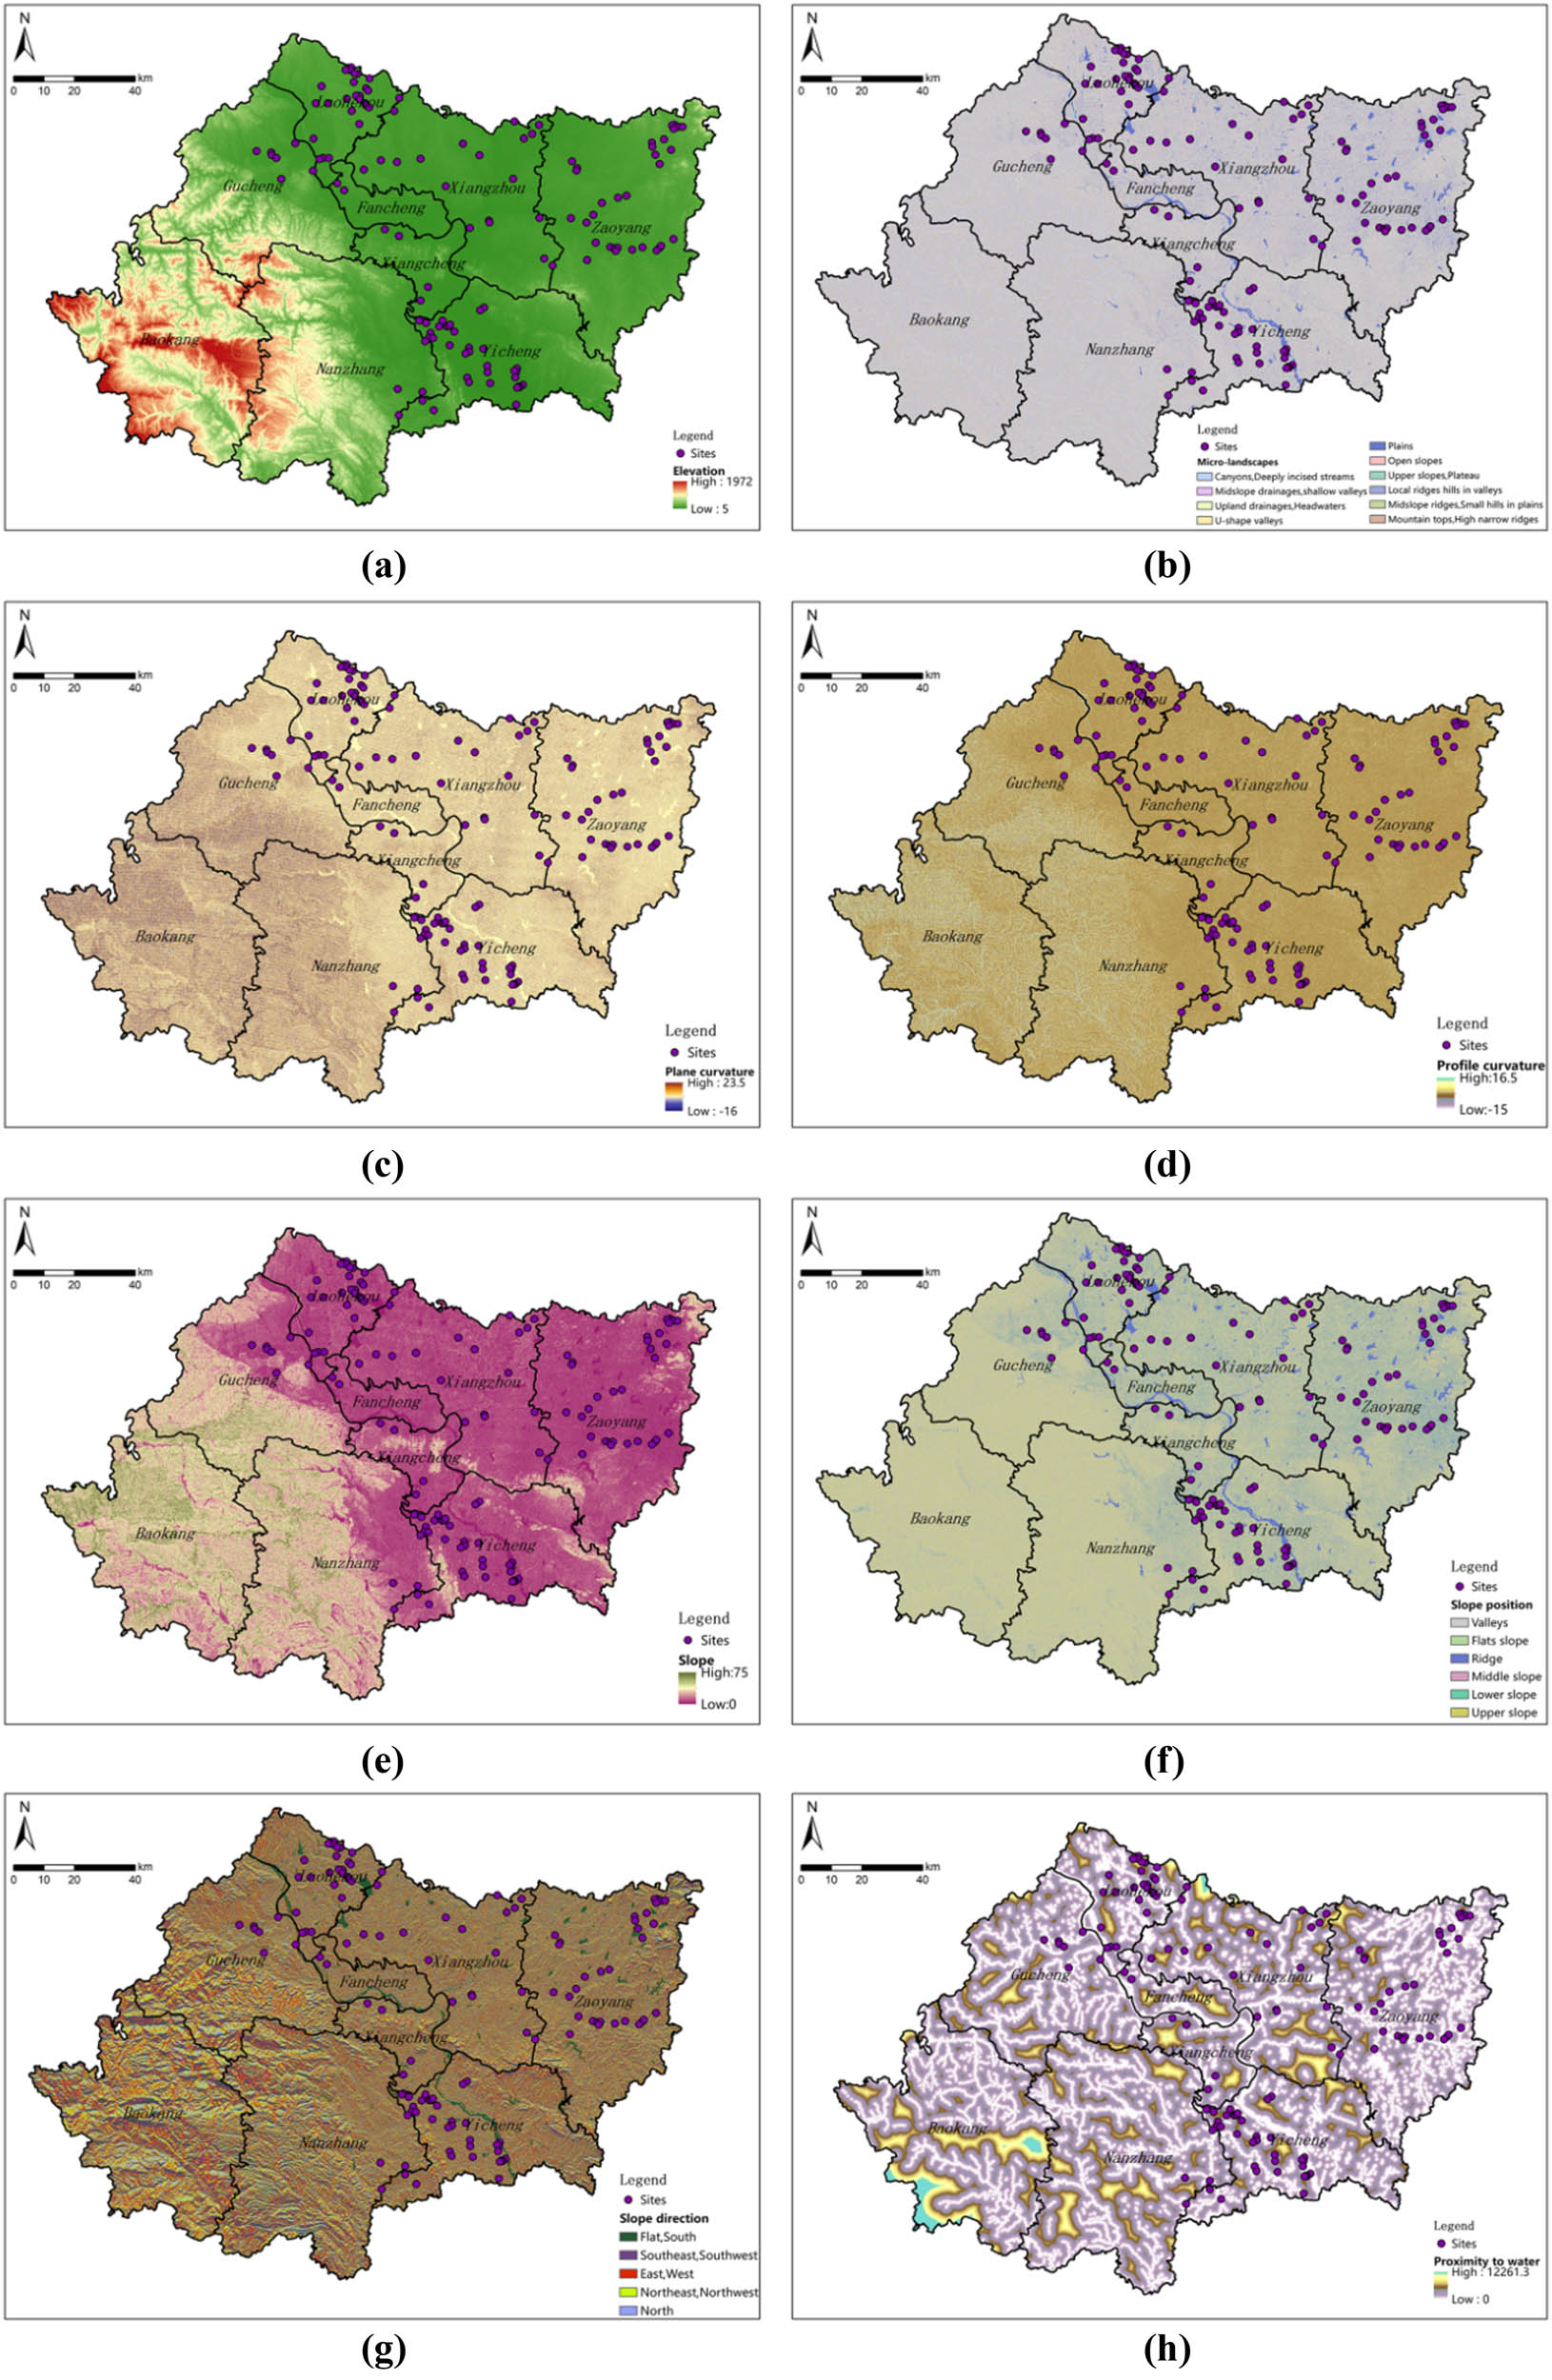
Impact factor layer. (a) Elevation, (b) microtopography, (c) plane curvature, (d) profile curvature, (e) slope, (f) slope position, (g) slope direction, and (h) distance to water.
4.2 Model training
Archaeological site points and nonarchaeological site points were used to form the archaeological site dataset for the Xiangyang area. The archaeological site sample points were set as a positive, and the nonarchaeological site sample points were set as a negative for the typical type of archaeological site points, i.e., presence or absence. The excavated Neolithic archaeological site points (129) were selected as the positive sample. Although the number of nonarchaeological site points expands the amount of data available for machine learning, there is no precise percentage or relationship between archaeological and nonarchaeological site points. Referring to the type of regression analysis by Heckmann et al., the ratio of “positive:negative” cells was determined to be typically between 1:1 and 1:10 [26,27]. Considering the number of existing archaeological sites, areas outside the 100 m buffer zone of archaeological sites were selected for this study, and nonarchaeological sites (129) were randomly selected as negative samples at a 1:1 ratio. The test dataset was utilized for testing, and the training dataset was used to train the model.
The confusion matrix can be used to analyze the accuracy of the model for the archaeological site prediction model. Table 2 shows the confusion matrix for the entire dataset of the RF model. It is evident from the confusion matrix that the generated RF model has a good level of accuracy and predictive value.
Confusion matrix for the RF model
| True value | |||
|---|---|---|---|
| RF predicted value | High | Low | Accuracy |
| High | 128 | 3 | Accuracy: 0.977 |
| Low | 0 | 126 | Accuracy: 1 |
| Recall rate: 1 | Recall rate: 0.977 | Accuracy: 0.988 | |
Due to the random nature of sampling, this article uses the ten-fold cross-validation method to select samples and conduct model training for RF. Ten-fold cross-validation randomized the entire data set into 10 nonintersecting subsets randomly and equally and usesone subset at a time for model accuracy validation and the rest for model training (129 positive and 129 negative samples). According to Table 3, the precision of the test samples for the RF model was 1.000.
Ten-fold cross-validation accuracy
| Serial number | RF precision | |
|---|---|---|
| Training | Testing | |
| 01 | 0.692 | 1.000 |
| 02 | 0.808 | 1.000 |
| 03 | 0.640 | 1.000 |
| 04 | 0.731 | 1.000 |
| 05 | 0.731 | 1.000 |
| 06 | 0.600 | 1.000 |
| 07 | 0.577 | 1.000 |
| 08 | 0.885 | 1.000 |
| 09 | 0.720 | 1.000 |
| 10 | 0.654 | 1.000 |
4.3 Model evaluation
The RF model of the archaeological site prediction model was evaluated, and the receiver operating characteristic (ROC) curve and the area under the curve (AUC) were used to test this hypothesis. The ROC curve is based on sensitivity and specificity as the horizontal and vertical axes. AUC values is the area under the curve, AUC values can be quantified. A model with a value of 1 is ideal, while a model with a value of 0 is useless. A value greater than 0.5 and closer to 1 indicates that the model has a good diagnostic effect and the model has a high prediction accuracy. Figure 5 depicts the model’s ROC curve. The AUC value of the training set of the RF model is 1.000, indicating that the constructed model has a certain stability. The AUC for the test set is 0.867, and the AUC value of the whole set is 0.994, indicating that the model has a certain prediction ability.
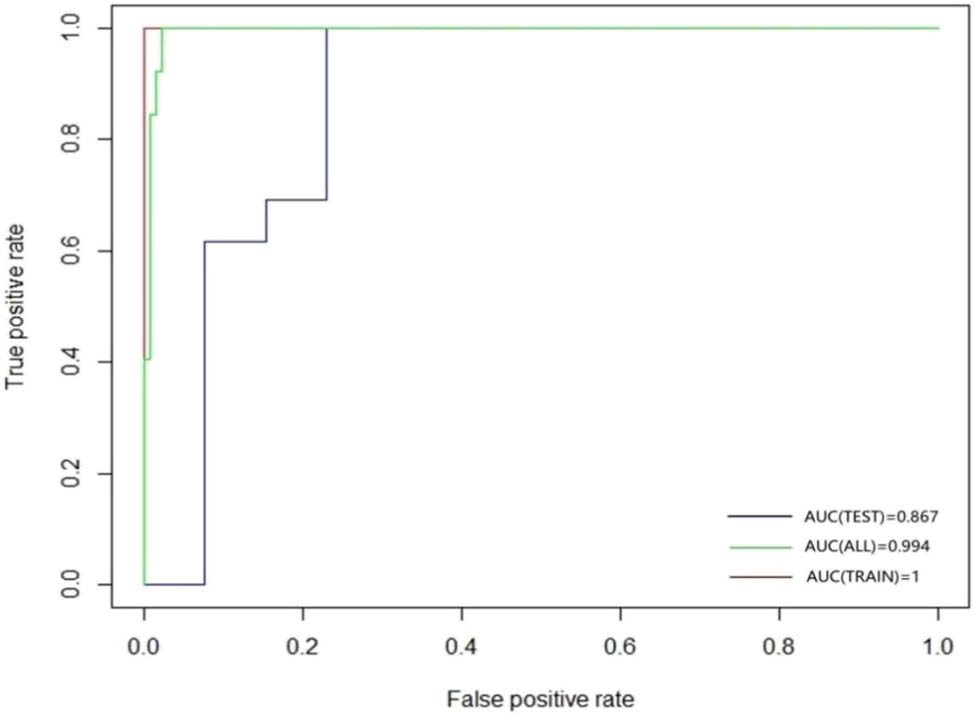
ROC curve and AUC value.
5 Archaeological site prediction results
Applying the RF archaeological site prediction model to the Xiangyang area, three categorized breakpoints were extracted based on expert empirical methods to obtain high-probability zones in the Xiangyang area, and they were divided into three categories: low-probability zones, medium-probability zones, and high-probability zones. The categorized breakpoints should be chosen to minimize the proportion of high-probability zones and be as true to the actual scenario as possible. Figure 6 shows the predicted probability of the Xiangyang area generated by the archaeological site prediction model, indicating that most of the Han River basin contains the high-likelihood locations in the Xiangyang area, the Tangbai River basin and along their tributaries, concentrated in the hilly and plain areas at lower elevations, while the western areas have a low probability of Neolithic site selection due to the large number of mountainous areas formed by steep slopes, especially in the high mountain areas. This is related to the constraints of the terrain and landscape and the wider spatial range of sites chosen by ancient humans; second, it is related to urban development and construction, with less urban development in high mountains and fewer archaeological excavations, resulting in a low amount of primary data. According to the excavated site of Mulin head in Baokang, it can be judged that alpine sites are rare, which is consistent with the predicted results. In addition, there is a high proportion of medium-probability zones with the potential for ruins and a wide coverage of the ranges addressed. In addition, the generalization ability of the model was evaluated quantitatively through statistical analysis. Table 4 shows that 46.51% of archaeological sites were placed in the 12% high-likelihood zone, 51.94% of the archaeological sites are in the 40.24% medium-likelihood area, and only 0.01% of the archaeological sites are in the 47.76% low-likelihood area. When the probability was varied, the archaeological site density increased by a factor of approximately 126.85 (from 0.0002 to 0.02537). This result suggests that the generated predictive model of archaeological sites matches the actual spatial distribution of archaeological sites.
Archaeological site projection map.
Grading statistics for the predicted probability of ancient sites
| Results | Level | Number of grids/pc | Area ratio/% | Number of sites/unit | Number of sites as a percentage/% | Density/(pcs –m−2) |
|---|---|---|---|---|---|---|
| <0.35 | Low | 3,761,875 | 47.76 | 2 | 0.01 | 0.0002 |
| 0.35–0.72 | General | 3,169,366 | 40.24 | 67 | 51.94 | 0.0085 |
| >0.72 | High | 945,944 | 12.00 | 60 | 46.51 | 0.02537 |
6 Discussion and conclusion
6.1 Discussion
6.1.1 Factor importance ranking
The mean Gini index reduction of the RF model was used as an indicator to estimate the significance of the variables, and the mean value of the indicators was used to determine the importance of the factors after the construction of the model. The following eight factors were ranked in descending order of their influence on the probability of occurrence of archaeological sites: elevation, slope, micromorphology, distance to water, slope position, profile curvature, slope direction, and plan curvature. Different influencing factors have separate degrees of influence on the predicted probability of archaeological sites. The analysis of the influence pattern of the characteristics and their importance guided the archaeological site excavation. This time, the importance of the influencing factors of RF was ranked by the average Gini index, where values greater than 0 indicate that the factor has a positive impact on the occurrence of archaeological sites; values less than 0 indicate that the element has a negative effect on the event of archaeological sites. As seen from Figure 7, except for slope direction, all other mean Gini index factors are more significant than 0, indicating that these factors have a facilitating effect on the occurrence of archaeological sites; when the absolute value of the mean Gini index is more excellent, the greater the importance of the factor’s influence on archaeological sites, such as elevation and distance to water.
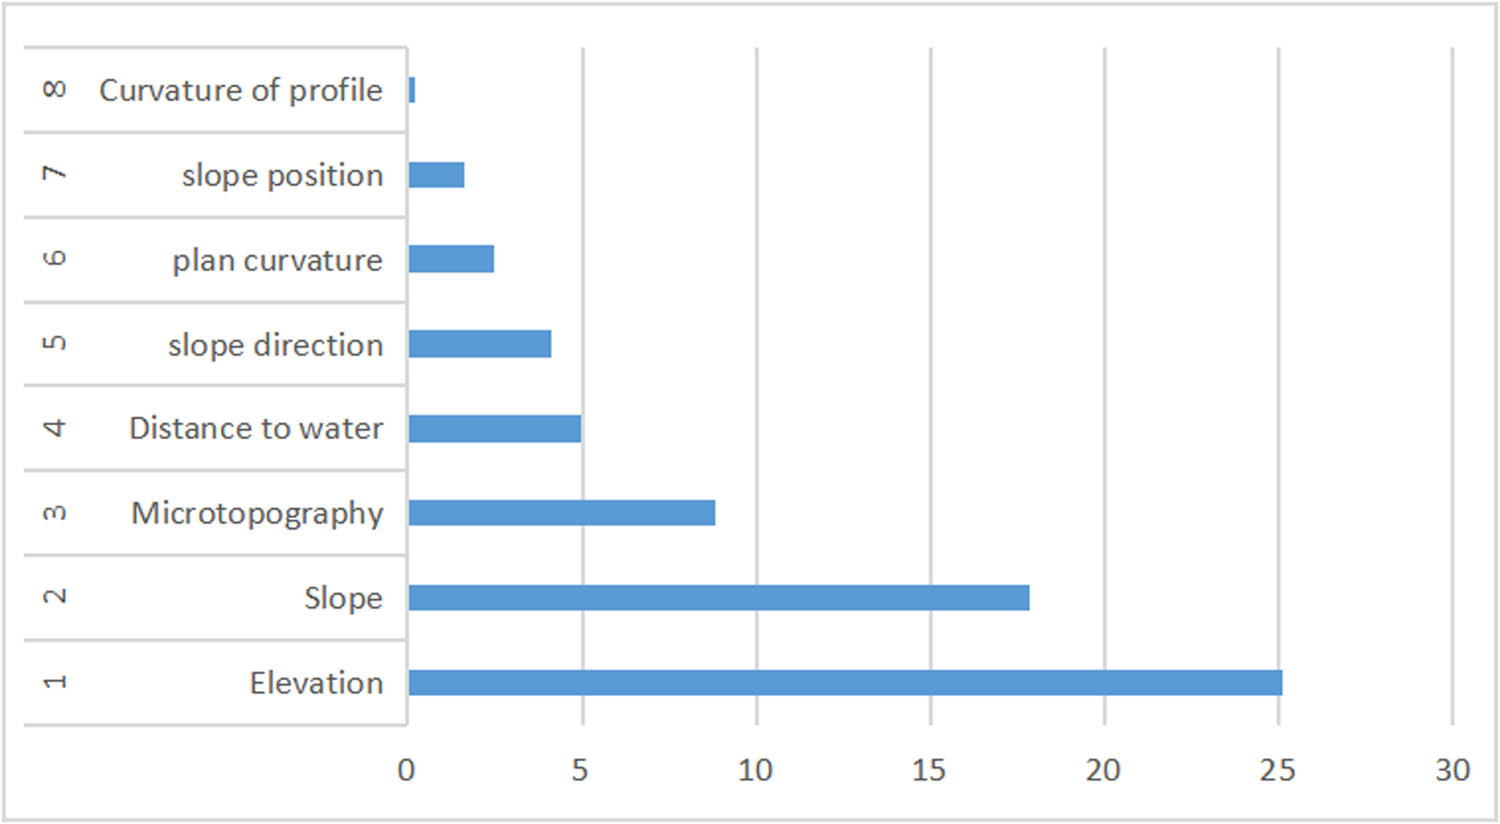
Impact factor importance ranking.
It can be found that elevation, slope, and microgeomorphic importance are in the top three, demonstrating that these three elements are the most significant for archaeological sites, which coincides with relevant research cases and suggests that the model has some validity.
The relationship between elevation, slope, microgeomorphology, and known ancient sites was calculated using ArcGIS10.6. The elevation range of the study area is 5–1,972 m, and the existing ancient sites are concentrated in the elevation range of 0–150 m, which is the area of frequent human activities; the density of ancient sites within the elevation range of 50 m is only 3%, and the density of ancient sites with elevations over 150 m is only 0.9%; ancient sites are rare in high-altitude areas. Overall, the high number of ancient sites between 50 and 150 m in elevation indicates that ancient humans in the Neolithic Xiangyang area chose relatively low-elevation areas, which is related to the low water level of rivers and lakes and the suitability of the low-elevation regions for ancient human settlement and production methods [28] (Figure 8).
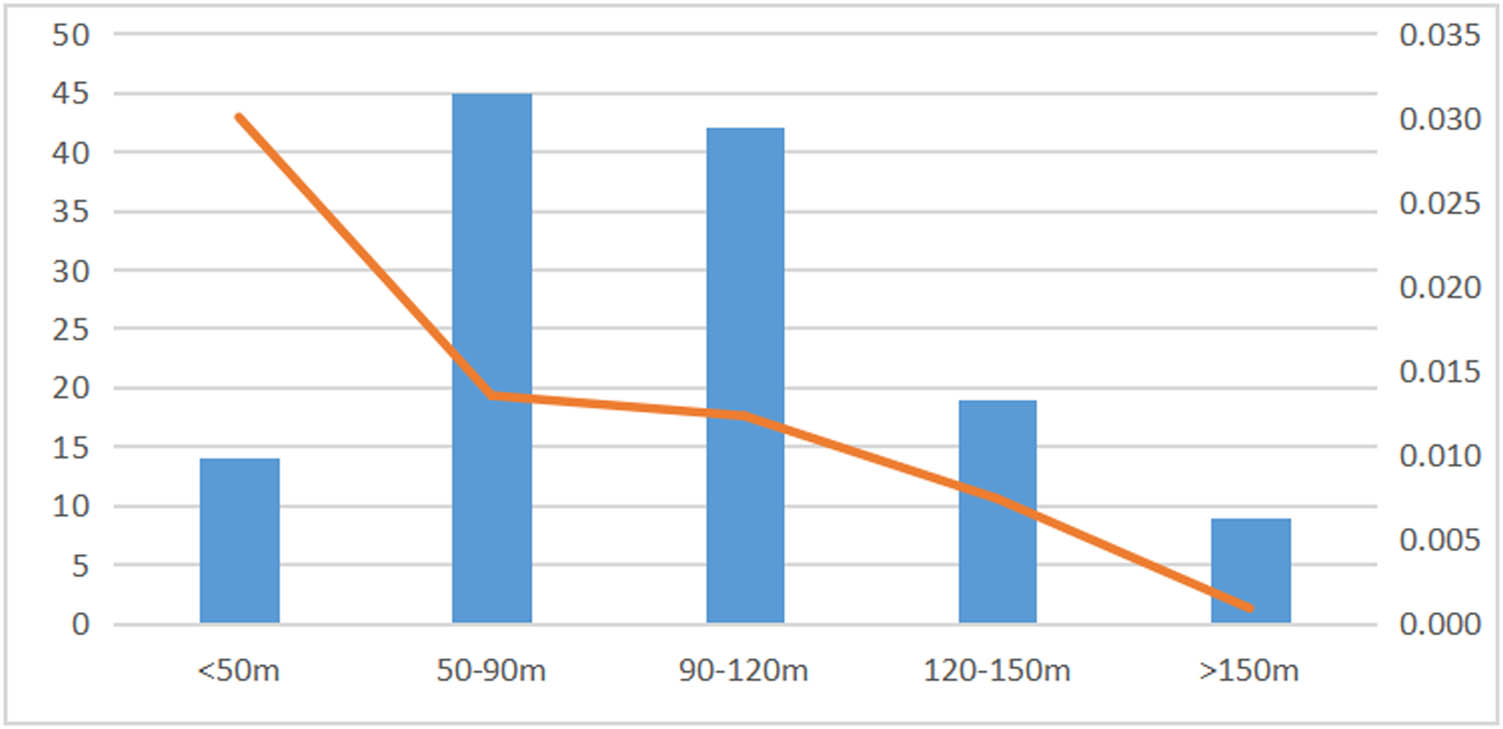
Elevation distribution of archaeological sites.
The statistics show that most of the archaeological sites are situated in areas of 0–10°, with a very small number of archaeological sites greater than 10° and the highest slope values below 3°, which is related to the size of the flat areas available in the Xiangyang area. This is evidence that ancient people tended to choose sites on flat terrain, that the natural environment of the Neolithic Xiangyang area was good, that ancient people chose a wide range of sites, and that a high-quality natural environment could further facilitate the transformation of production methods at that time (Figure 9).
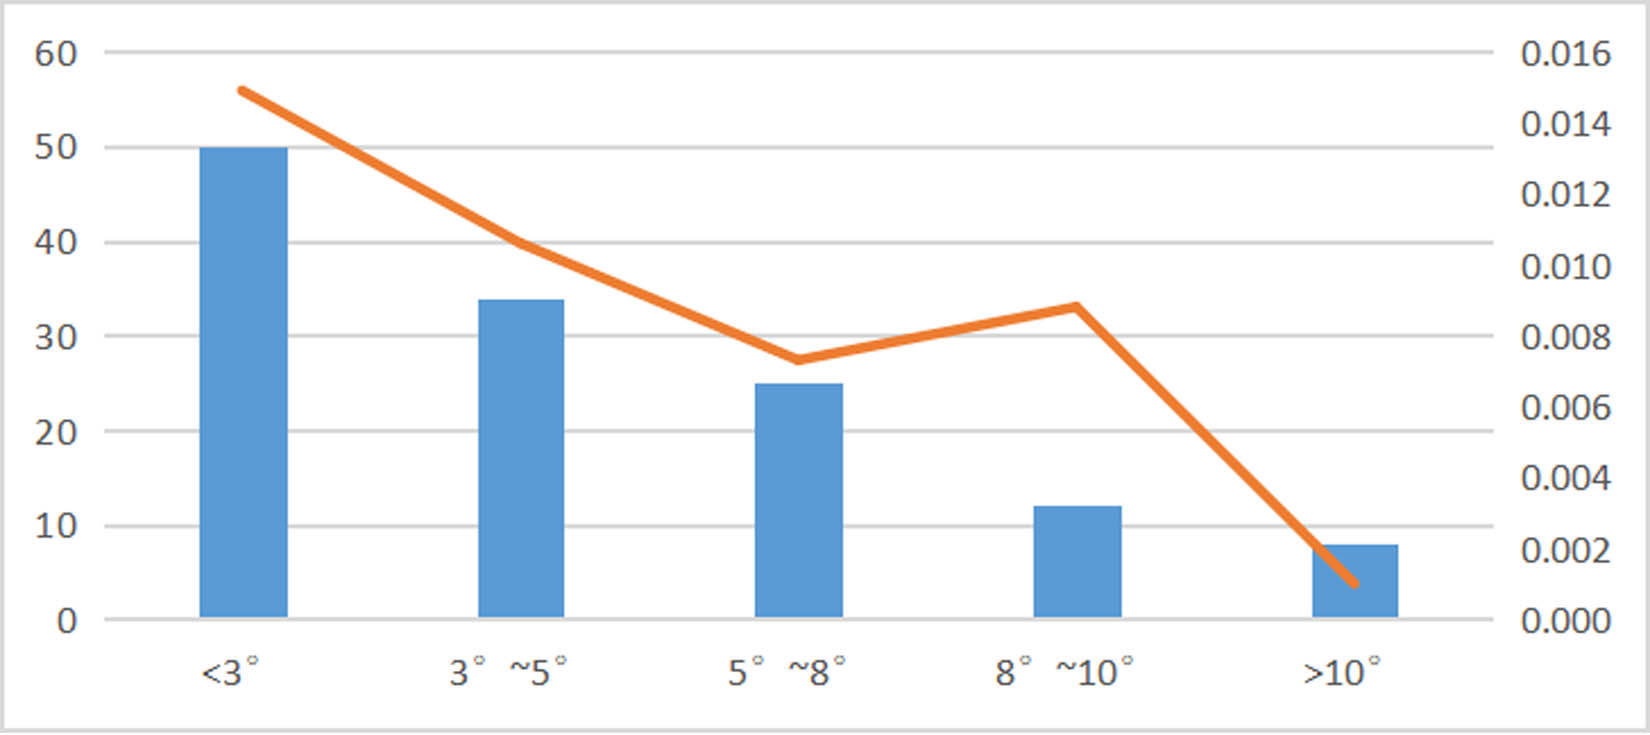
Map of the slope distribution of archaeological sites.
This article examines the importance of micro landscapes in the top three; micro landscapes influence ancient human activity [29]. Archaeological research can recognize ancient human siting preferences by identifying ancient landforms and providing a deep perspective on the interdependent human use of space, geomorphology, and environmental archaeology, and changes in landforms that affect the spatial distribution of archaeological remains. Archaeological sites are known to be distributed on hilltops, with the highest number of high ridges, such as the Liangzishang site and the Haizhai site; the next highest number of archaeological sites are found in ravines and deep streams, such as the Dajingdi site and the Zhangwa site; the density of plains and open slopes is higher, at 2.04 and 1.28%, respectively. The distribution in high- and low-water systems is 0 (Figure 10).
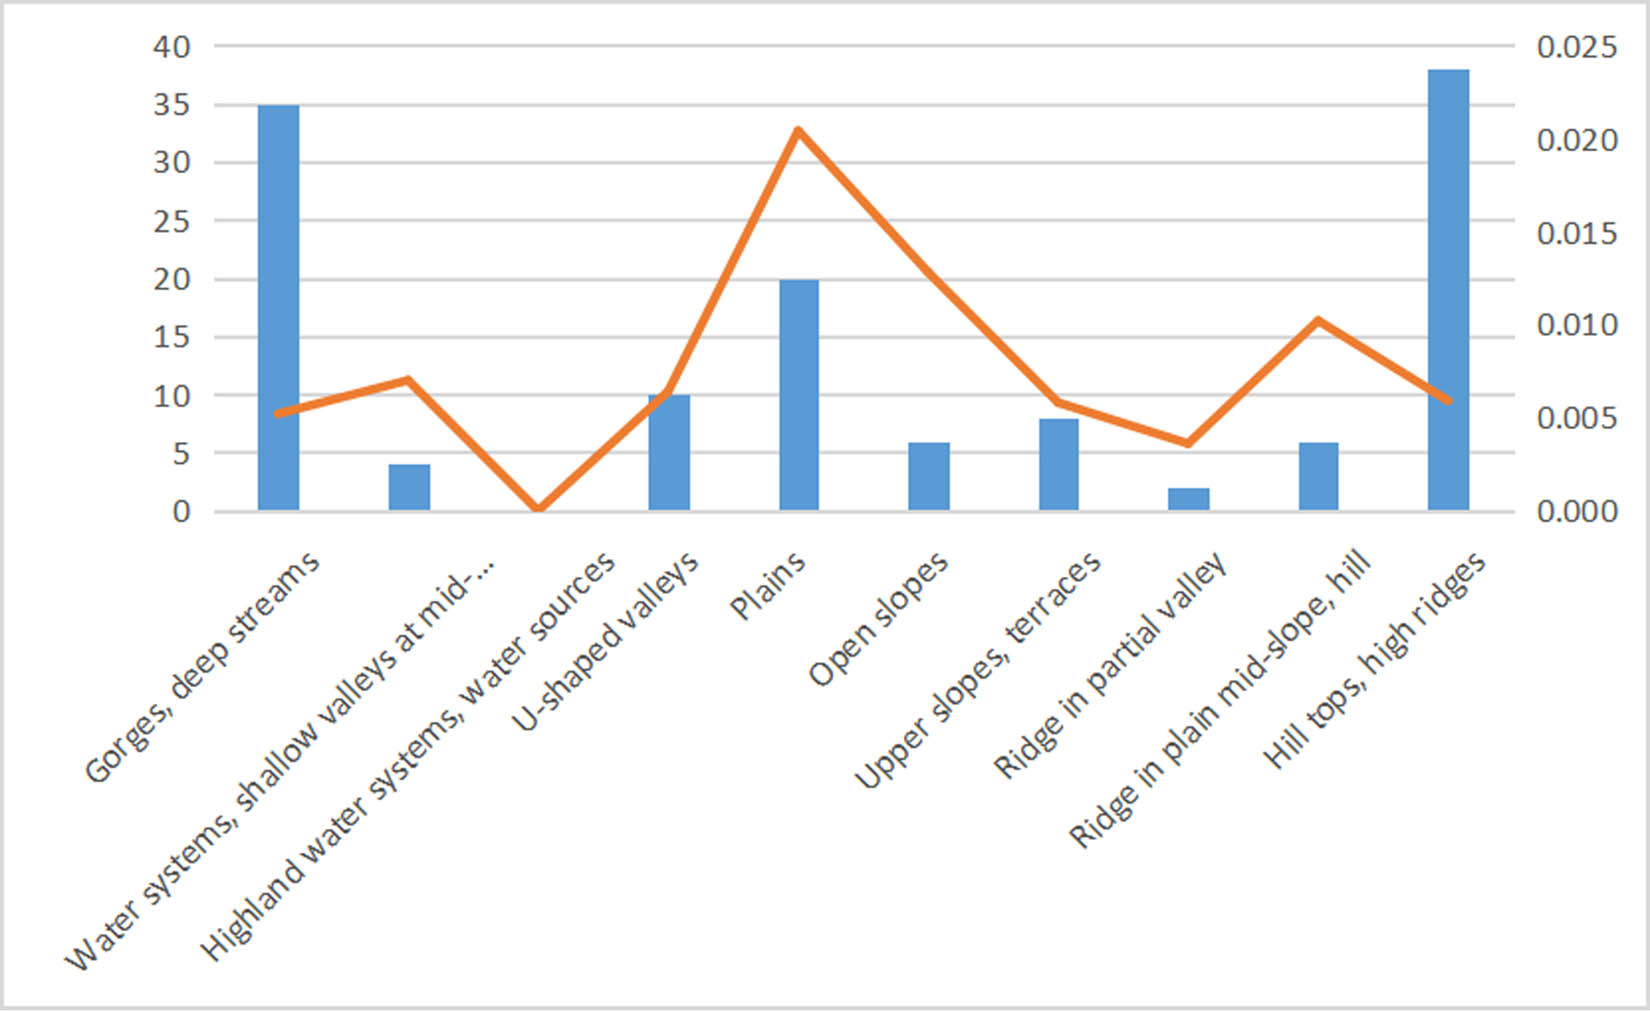
Spatial distribution of micro landscapes on archaeological sites.
Previous studies clearly show the importance of water sources for archaeological sites. They are mostly located at low altitudes. This is mostly related to the lack of ability of archaic humans to modify the natural environment and to prevent flooding. With the development of productivity, the dependence of archaic humans on proximity to water diminished. In this article, the importance of proximity to water is ranked fourth, and the importance of water sources decreases, which is mostly related to the abundance of water resources in the region and the fact that the diversion of rivers and the expansion of lake groups affected proximity to water [7].
6.1.2 Exploration of a typical archaeological site location
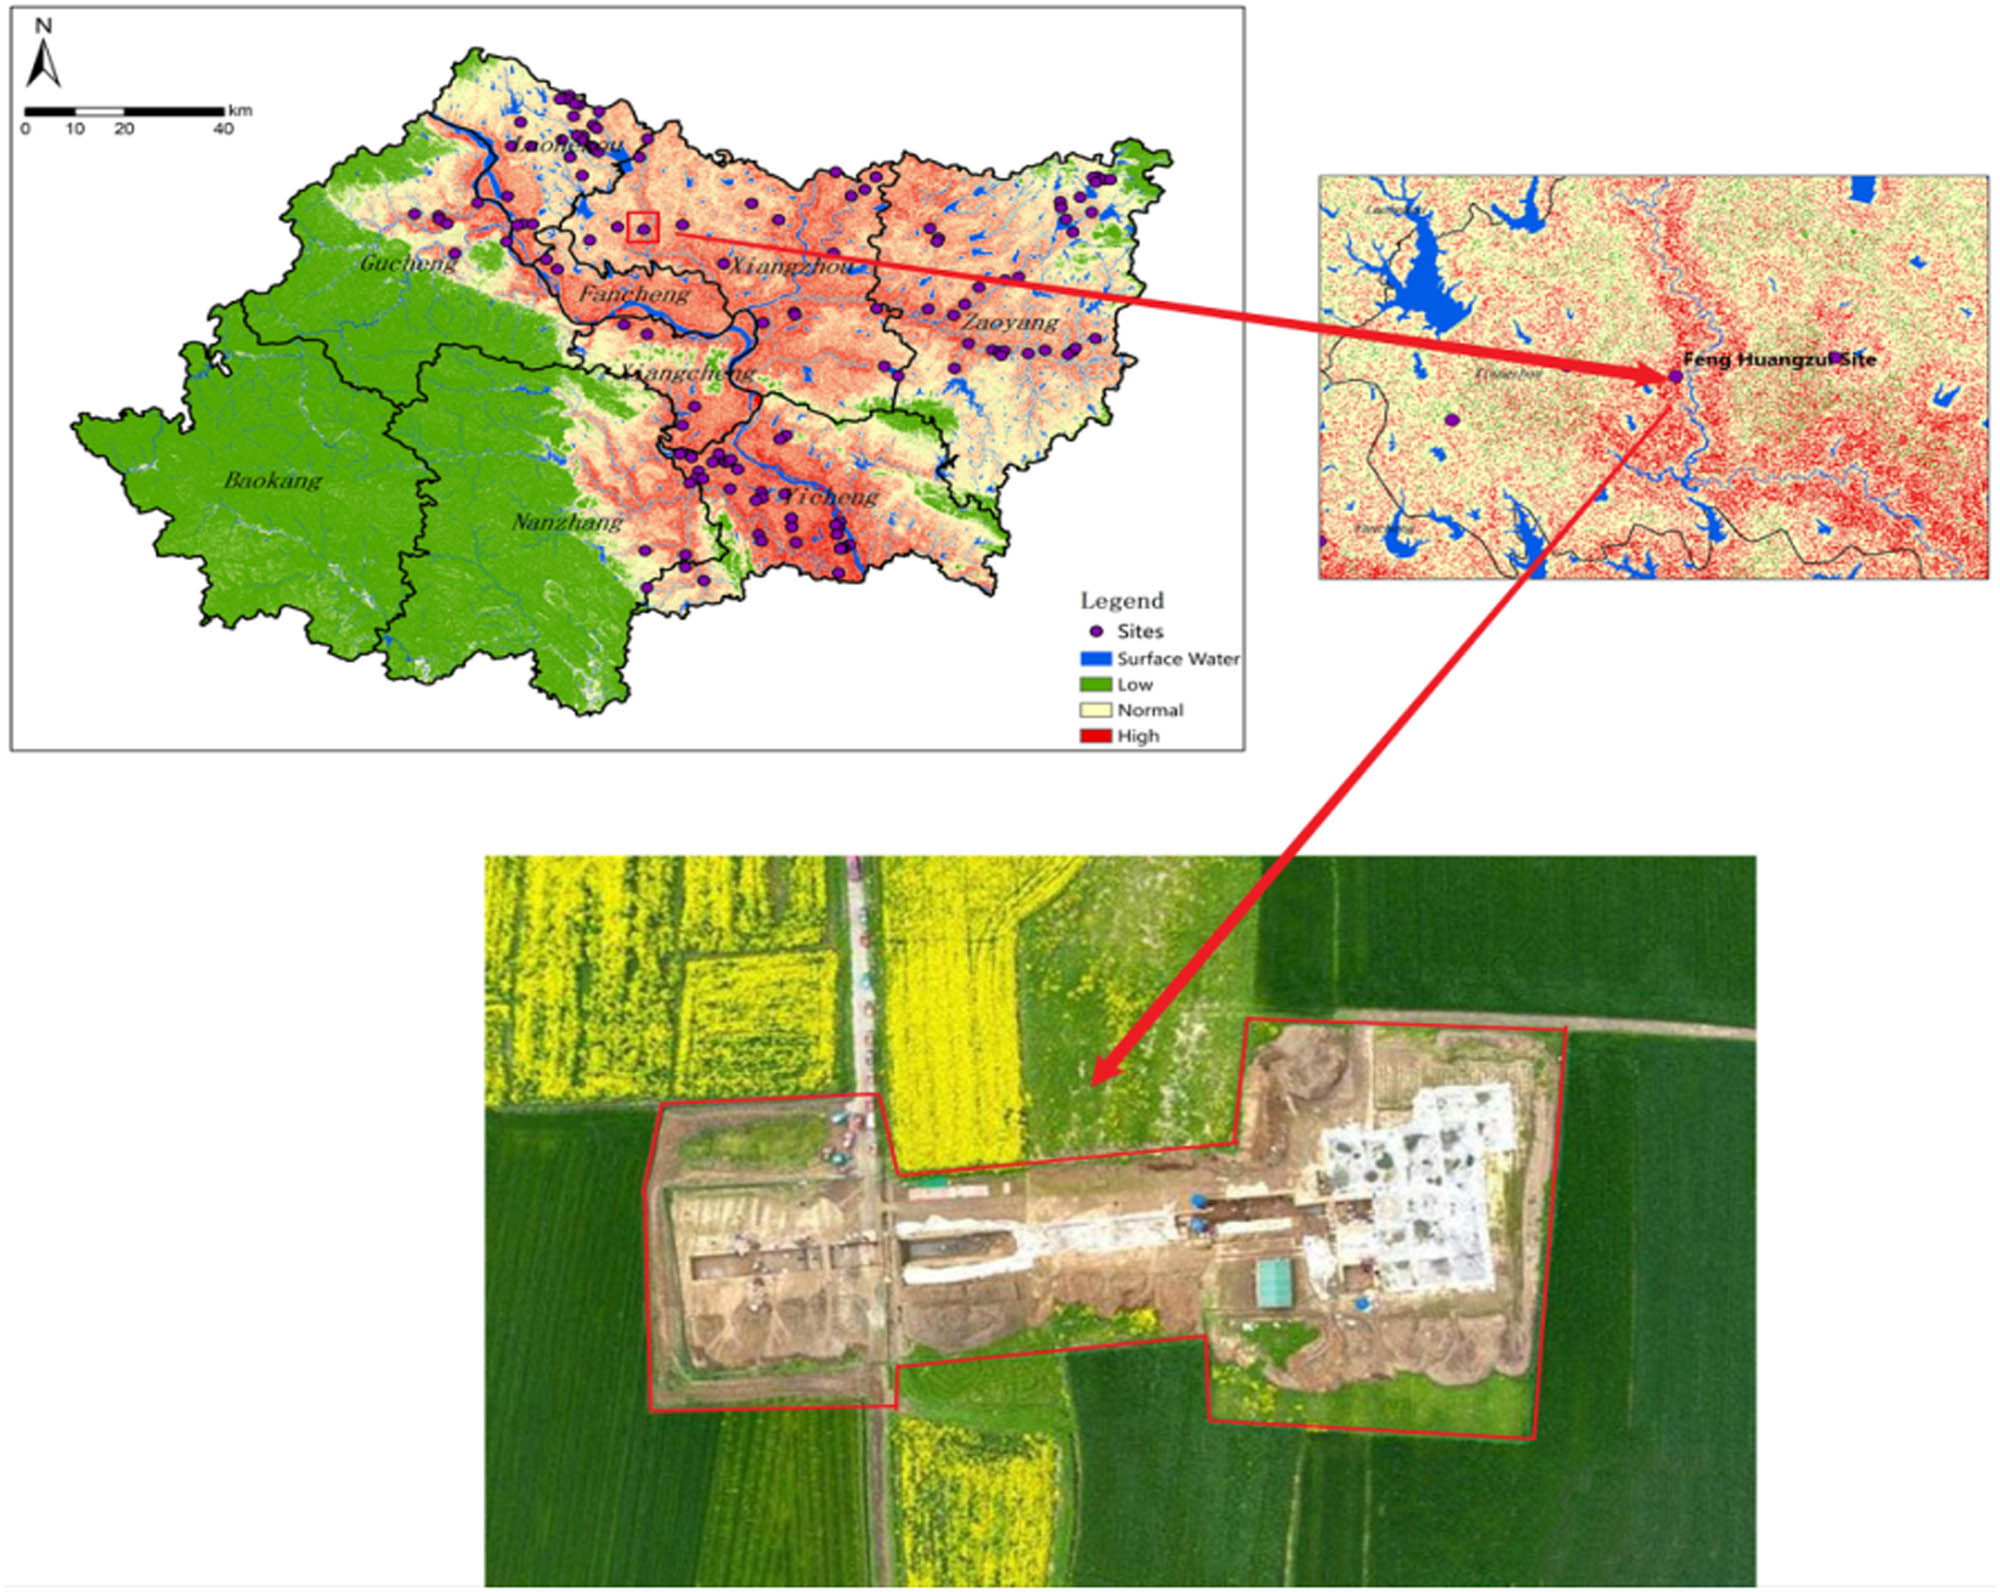
In this article, we selected the Rolling River and Sha River basins in Xiangyang, and the archaeological site points and the predicted zoning results corresponded well. The validation plots of the RF model revealed that the prediction model’s probability zones matched the distribution of the actual archaeological site points well (Figure 9), indicating that the RF model has good application in showing the prediction of archaeological sites across the region. We collected the Fenghuangzui site and the Carved Dragon Monument site details for model validation and comparison, and by overlaying the data from both sites onto the model generated by the RF model (Figure 11), we observed that both sites fall within the high-probability zone, which indicates the high predictive power of the archaeological site prediction model. One of the sites, Fenghuangzui, belongs to the middle reaches of the Han River and the southern edge of the Nanyang Basin; surrounded by water and a beautiful natural environment, it is an important central settlement of the Late Neolithic period in the Nanyang Basin, established between 5,200 and 4,200 years ago, and the total area of the city site and surrounding subsidiary settlements is approximately 500,000 m2, making it a regional center in northwest Hubei. The site is rich in cultural layers, spanning nearly a thousand years from the Qujialing to the Shijiahe cultures. The stone axes, chisels, and spinning wheels found at the site provide important historical material for the construction of a cultural genealogy of prehistoric archaeology near the Yangtze River’s middle reaches. The eggshell pottery cups indicate that Xiangyang had extensive, high-level exchanges with Shandong during the prehistoric period. The special geographical location of Fenghuangzui determines that the site was at an important node of north–south culture and was an important control node for the expansion of southern culture to the North (Figure 12).
Validation of archaeological site locations based on the RF model.
Verification of the location of the archaeological site at the Fenghuangzui site.
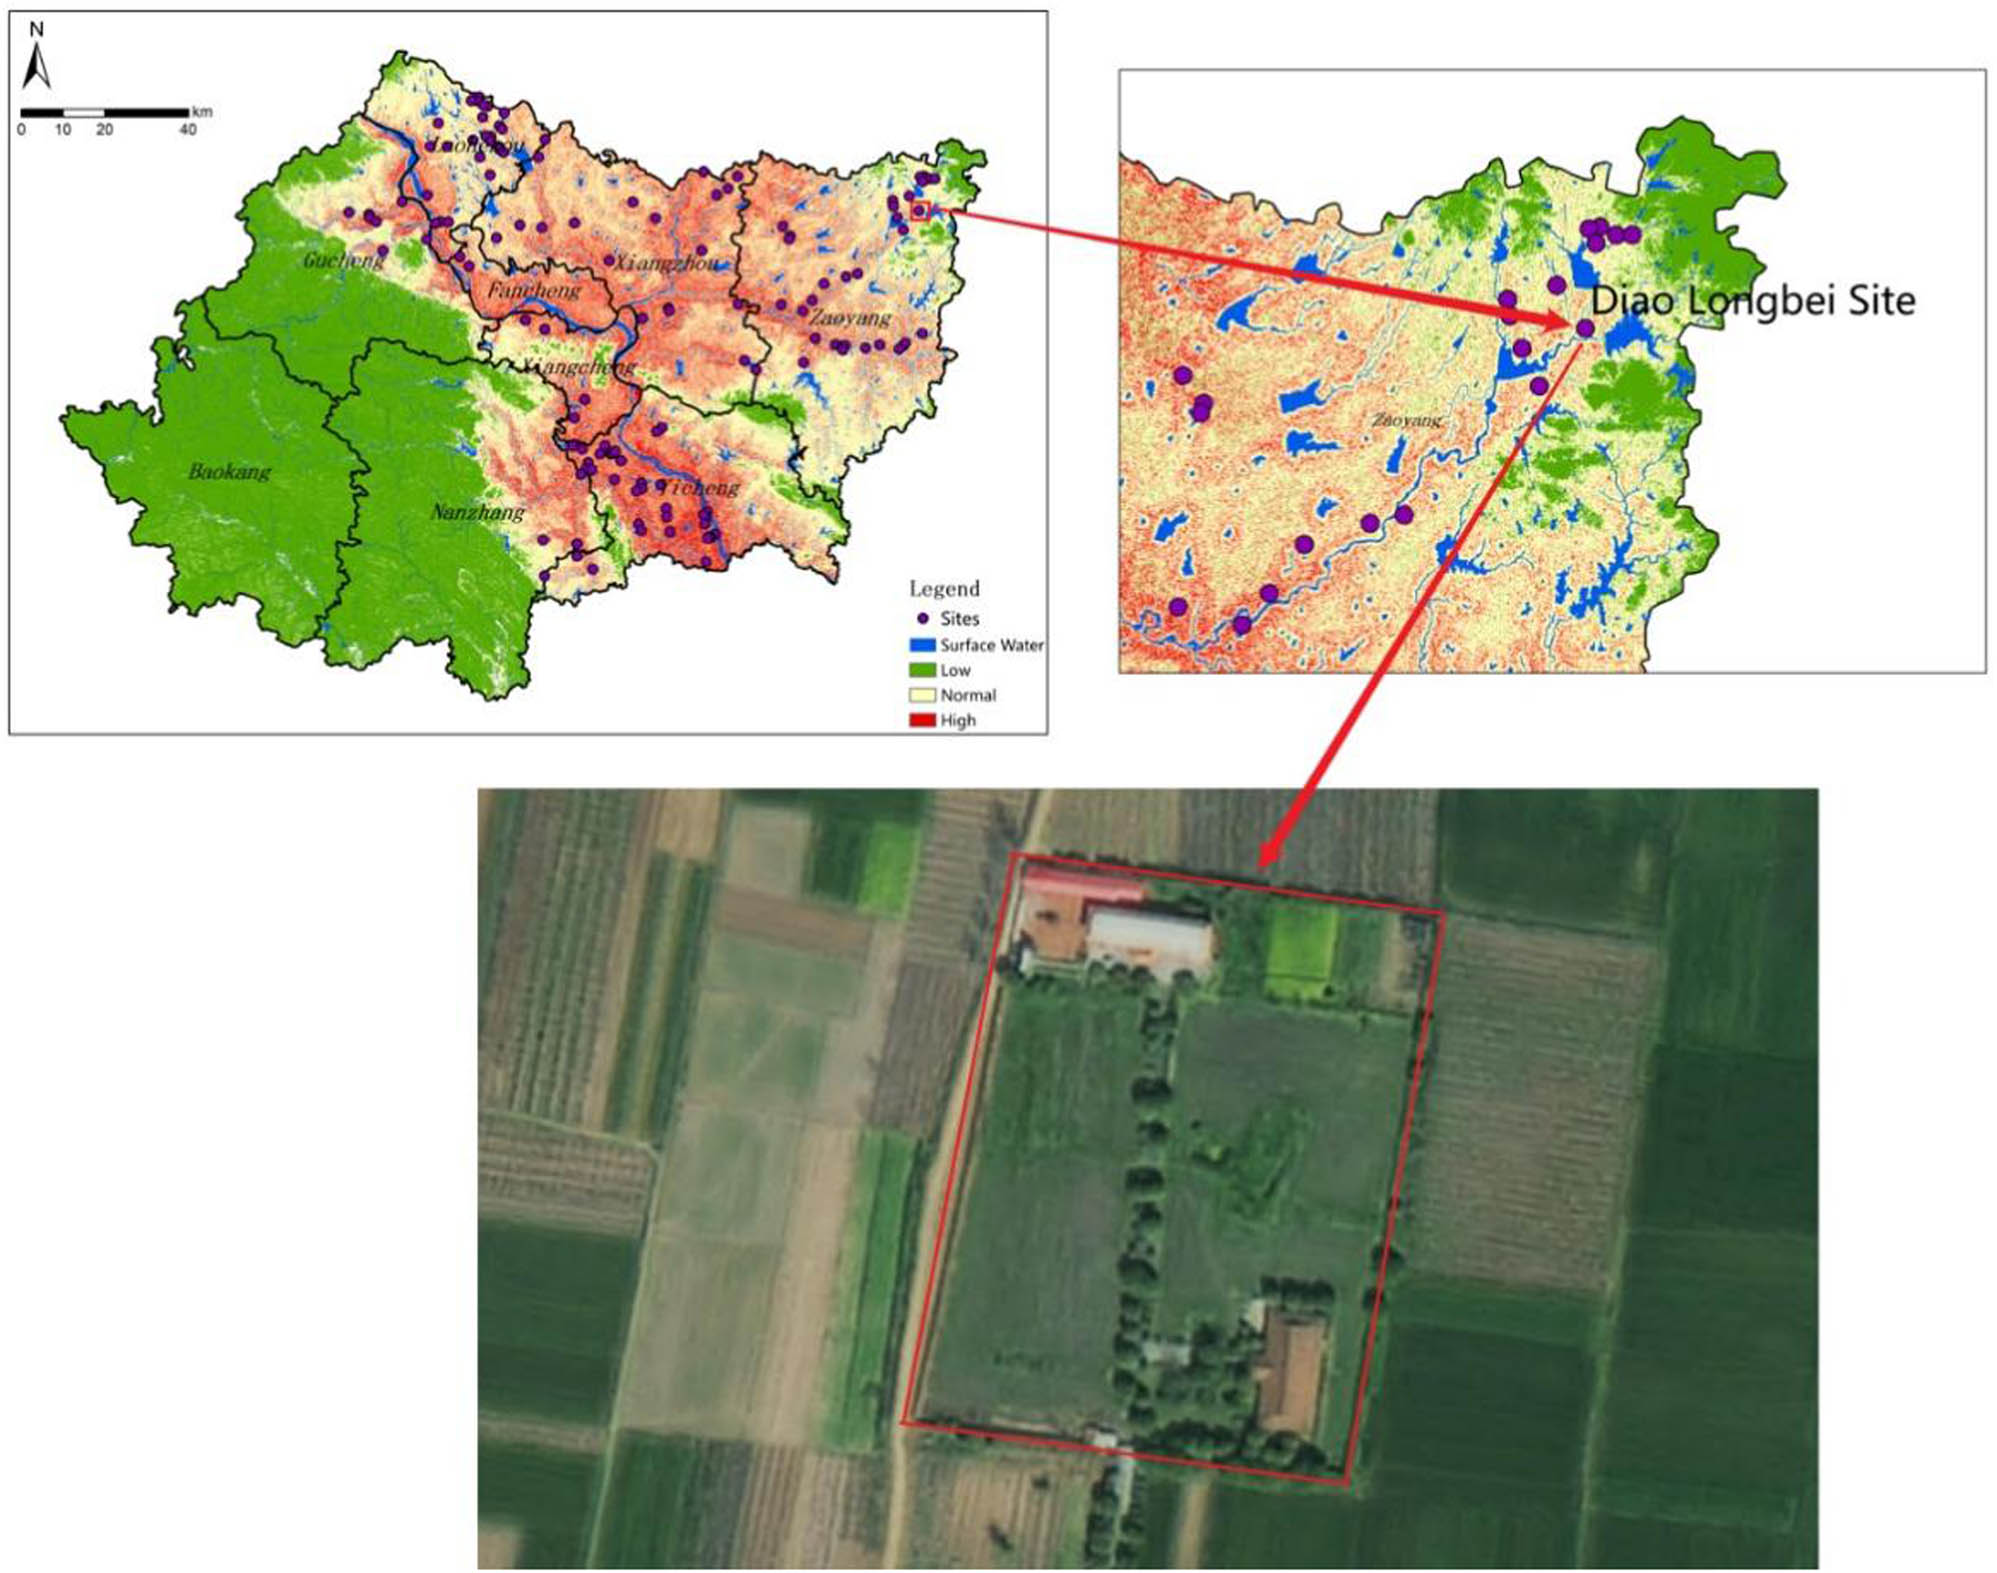
Another site, the Carved Dragon Monument, is located in the high-probability area (Figure 13). The total area of the existing site is approximately 50,000 m2, and it was established approximately 6,200 years ago. It is a better-preserved Neolithic clan residential settlement in the zone where the Yangtze and Yellow River basins meet. The eastern and northern sides of the site are surrounded by the remaining veins of the Tongbai Mountains. The highest mountain in the vicinity is Dafu Mountain. The tributaries of the Sha River and the Yellow River flow through the area. The area is surrounded by green hills in the east and a flat landscape in the west, and the river flows around, providing good conditions for ancient man to engage in fishing, hunting, and cultivation. The excavated pottery-spinning wheels, stone-spinning wheels, bone arrowheads, bone cones, and mussel tools reflect a developed textile industry during this period. Large quantities of rice grains and husks were found at the site, large quantities of corn and millet grains were stored in large pottery urns and jars, and a large number of painted pottery utensils were unearthed, fired with high fire, hardness, and quality. Improvements in the production processes indicate stable food production, secure livelihoods, and long-term stability of settled settlements at the time. The remains of rice and millets are present. The storage of grain, such as millet in urns and jars excavated from the Diao Long Bei site, suggests that there was already a surplus of grain, which was used as fodder for livestock, and that livestock rearing developed considerably [30].
Validation of the location of the archaeological site of the Carved Dragon Monument.
Typical archaeological site locations show the preference of ancient humans in the Neolithic Xiangyang area for site selection. It also reveals that the high-probability areas were mostly located in plains suitable for rice and hilly mountainous areas for grains. Thus, ancient humans preferred those areas with environmental advantages for developing agriculture [31]. Moreover, stable agricultural production provided the necessary material conditions for the culture development and prosperity, and external expansion. The low-altitude areas, fertile swampy soils, and humid environment created by low altitude, fertile swampy soil, and shallower groundwater were ideal for crop cultivation [32]. Geography had an impact on the economic patterns of the time, contributing to the region becoming an important part of the Han River basin’s middle reaches [33].
6.1.3 Contributions and shortcomings
In this study, the predicted probability of archaeological sites in the Neolithic Xiangyang area was examined by combining available materials and recent research results. As an alternative to classical statistical methods, the model proposed in this article achieved predictive tool optimization and subsequently improved the precision of archaeological site prediction. The model can predict archaeological sites from any region and era, offering an intuitive prediction map for the non-specialist reader. The advantages of archaeological site prediction using the RF algorithm can be summarized from four aspects. First, the selection of variables and weights in the archaeological site prediction model is assessed quantitatively, relinquishing the need for the reclassification or determination of thresholds [34,35]. Second, no additional test data are required; the model evaluation is part of the modeling process, and the input data are split during training, testing, and validation. Third, several geographical factors are selected to construct the indicator system, and the average Gini coefficient is employed to rank the importance of the geographical factors in the study area, thus avoiding artificial subjective factors. Fourth, the RF model improves prediction accuracy [36,37,38]. The AUCs of the ROC curves in the training dataset, full data set, and test dataset were 1.000, 0.994, and 0.867, respectively, which proves that the model is both highly accurate and stable.
This study has some implications for the field of archaeological site prediction, but some limitations still exist. First, the acquisition of data from archaeological sites is limited by the accuracy of archaeological excavations, the accuracy of the data from some archaeological sites is constrained by the research of the various archaeological teams, and the “anomalous” sampling samples impact the training of the model. Second, the availability of data from Neolithic archaeological sites is poor, the construction of the index system is constrained, and some index data cannot simulate the environmental conditions from that time. This may have a negative impact on the prediction results. Some essential indicators, such as Neolithic road traffic and the age of archaeological sites, are unavailable. Future research needs to reconstruct the Neolithic environment based on historical documentation and archaeological excavations to optimize the sample predictors and improve the prediction reliability. Furthermore, there is a need to explore the influential mechanisms of archaeological site locations thoroughly. In this study, the spatial extent of archaeological sites was predicted from the perspective of geographical factors, and their importance was explored. However, data that are not yet available or factors that are difficult to quantify affect the accuracy of the prediction results. The constraints of aspects such as the extent of ancient human activities, survival history, and livelihood patterns could not be fully addressed in this study, and additional forms of influencing factors still need to be screened and optimized in the future to explore the interrelationships between them more comprehensively.
Therefore, the acquisition of key data, the development of predictive techniques, and the convergence of multidisciplinary approaches will supply more new evidence and groundbreaking results. Future research needs to study archaeological sites in typical areas in terms of their natural, social, and economic environments and identify the influence mechanisms of archaeological sites in different epochs to conduct a comparative study of different machine-learning methods in archaeological site prediction. Furthermore, future research should explore the relationship between archaeological activities and the environment based on archaeological site prediction results.
7 Conclusions
The purpose of this research was to improve the accuracy of archaeological site predictions, to develop a model for archaeological site prediction premised on RF, and to draw the following conclusions.
The use of RF has high accuracy for archaeological site prediction, and when an archaeological site prediction model consisting of eight factors is selected, the AUC, accuracy, and precision of the test dataset are high, indicating the feasibility of machine-learning methods applied to archaeological site prediction. The AUC values of the ROC curves were 1.000, 0.994, and 0.867 for the training dataset, the full dataset, and the test dataset, respectively. This indicates that the application of the RF algorithm for archaeological site prediction in the Xiangyang area yielded good results. The model-guided field survey was more targeted than a traditional, uninformed random survey; the accuracy improved by 35.8% compared to the binary logistic regression method used by Sallie Vaughn to forecast areas of high archaeological potential in parts of northwestern Belize [9]. Wachtel et al. [9] Vaughn and Crawford [39] used logistic regression and MaxEnt methods to forecast areas of high probability, with a 15.8 and 4.8% increase in accuracy when comparing the two methods with the Galilee area (northern Israel) and 20.8 and 4.8%, respectively, when comparing the two methods with the Fuxin area (northeast China). The higher prediction accuracy can inform archaeological investigations while saving time and the effort of fieldwork.
The predicted high-probability areas for archaeological sites are closely related to the geography, with the high-potential areas hosting archaeological sites situated in the research area’s eastern and central sections, i.e., in the plains and hills of the mountains. This result is mostly related to the weak ability of Neolithic archaeologists to modify their environment. The predicted probability of archaeological sites in the western mountains was low, with only 0.01% of the ancient sites located in the low-probability zone of 47.76%. The extent of archaeological sites in the low-probability zone needs to be ascertained in relation to local legends and historical documents. The high- and low-probability prediction values for archaeological sites are consistent with local characteristics, and the predictions of the probability values corresponding to the model are consistent with the spatial distribution of archaeological sites, indicating that the RF algorithm predictions are both stable and reliable.
An importance ranking of the factors combined with the average Gini coefficient found that the elevation, slope, and micro-geomorphology are of high importance in Neolithic site selection, and the model provides evidence that prehistoric populations inhabited the areas with the most favorable geographic and environmental factors. Rivers are associated with the reduced importance of archaeological sites in this period. This can be mainly attributed to the dense river network and abundant water resources in Xiangyang. In addition, slope direction, plan curvature, and slope position also have a significant influence, which is in line with the local geography and coincides with the development reality. In the future, the index system can be screened and optimized according to different study areas and periods (or “archaeological cultures”) to create appropriate prediction models for archaeological sites.
Therefore, the selection of RF for archaeological site prediction can be used for archaeological site prediction in other similar geographical regions or countries.
-
Funding information: Thanks are due to funds from the Chongqing Graduate Research Innovation Project, Project Approval Number (CYB22264); Chongqing Municipal Education Commission Science and Technology Research Project (KJQN202000525); and China National Natural Science Foundation (No. 42071217) for assistance with the experiments.
-
Author contributions: Conceptualization, Linzhi Li; data curation, Linzhi Li and Xingyu Chen; formal analysis, Haijia Wen; funding acquisition, Linzhi Li; investigation, Linzhi Li; methodology, Linzhi Li and Xingyu Chen; resources, Linzhi Li; software, Deliang Sun; validation, Deliang Sun and Linzhi Li; visualization, Xingyu Chen; writing – original draft, Linzhi Li; writing – review and editing, Deliang Sun and Haijia Wen. All authors have read and agreed to the published version of the manuscript.
-
Conflict of interest: The authors declare no conflict of interest.
References
[1] Press C. GIS and archaeological site location modeling. GIS and archaeological site location modeling/; 2006.Search in Google Scholar
[2] Davis DS. Defining what we study: The contribution of machine automation in archaeological research. Digital Appl Archaeol Cult Herit. 2020;18:1–5. 10.1016/j.daach.2020.e00152.Search in Google Scholar
[3] Balla A, Pavlogeorgatos G, Tsiafakis D, Pavlidis G. Recent advances in archaeological predictive modeling for archeological research and cultural heritage management. Mediterr Archaeol Archaeom. 2014;14:143–53.Search in Google Scholar
[4] Leusen P. Pattern to process: Methodological investigations into the formation and interpretation of spatial patterns in archaeological landscapes. University of Groningen; 2002.Search in Google Scholar
[5] Kempf M. The application of GIS and satellite imagery in archaeological land-use reconstruction: A predictive model? J Archaeol Sci Rep. 2019;25:116–28. 10.1016/j.jasrep.2019.03.035.Search in Google Scholar
[6] Parow-Souchon H, Zickel M, Manner H. Upper palaeolithic sites and where to find them: A predictive modelling approach to assess site expectancy in the Southern Levant. Quat Int. 2021;635:53–72. 10.1016/j.quaint.2021.05.020.Search in Google Scholar
[7] Koohpayma J, Makki M, Lentschke J, Alavi Panah SK. Predicting potential locations of ancient settlements using GIS and Weights-Of-Evidence method (case study: North-East of Iran). J Archaeol Sci Rep. 2021;40:103229.Search in Google Scholar
[8] Jarosław J, Hildebrandt-Radke I. Using multivariate statistics and fuzzy logic system to analyse settlement preferences in lowland areas of the temperate zone: an example from the Polish Lowlands. J Archaeol Sci. 2009;36(10):2096–107. 10.1016/j.jas.2009.06.004.Search in Google Scholar
[9] Wachtel I, Zidon R, Garti S, Shelach-Lavi G. Predictive modeling for archaeological site locations: Comparing logistic regression and maximal entropy in north Israel and north-east China. J Archaeol Sci. 2018;92:28–36.Search in Google Scholar
[10] Custer JF, Eveleigh T, Klemas V, Wells I. Application of LANDSAT data and synoptic remote sensing to predictive models for prehistoric archaeological sites: An example from the Delaware coastal plain. Am Antiq. 1986;51(3):572–88.Search in Google Scholar
[11] Noviello M, Cafarelli B, Calculli C, Sarris A, Mairota P. Investigating the distribution of archaeological sites: Multiparametric vs probability models and potentials for remote sensing data. Appl Geogr. 2018;95:34–44. 10.1016/j.apgeog.2018.04.005.Search in Google Scholar
[12] Li L, Li Y, Chen X, Sun D. A prediction study on archaeological sites based on geographical variables and logistic regression–A case study of the neolithic era and the bronze age of Xiangyang. Sustainability. 2022;14(23):15675. 10.3390/su142315675.Search in Google Scholar
[13] Jazwa CS, Collins-Elliott SA. An ecological model of settlement expansion in northwestern Morocco. Quat Int. 2021;597:103–17. 10.1016/j.quaint.2020.12.037.Search in Google Scholar
[14] Nsanziyera A, Rhinane H, Oujaa A, Mubea K. GIS and remote-sensing application in archaeological site mapping in the awsard area (Morocco). Geosciences. 2018;8(6):1–21. 10.3390/geosciences8060207.Search in Google Scholar
[15] Verhagen J. Case studies in archaeological predictive modelling. Amsterdam University Press; 2007.Search in Google Scholar
[16] Yaworsky PM, Vernon KB, Spangler JD, Brewer SC, Codding BF. Advancing predictive modeling in archaeology: An evaluation of regression and machine learning methods on the Grand Staircase-Escalante National Monument. PLOS ONE. 2020;15(10):e0239424.Search in Google Scholar
[17] Sammut C, Webb GI. Encyclopedia of Machine Learning. Germany: Springer; 2011. 10.1007/978-0-387-30164-8.Search in Google Scholar
[18] Märker M, Heydari-Guran S. Application of data-mining technologies to predict Paleolithic. Computer Applications and Quantitative Methods in Archaeology (Proceedings of CAA); 2009. p. 1–7.Search in Google Scholar
[19] Roalkvam I. Algorithmic classification and statistical modelling of coastal settlement patterns in mesolithic South-Eastern Norway. J Comput Appl Archaeol. 2020;3(1):288–307. 10.5334/JCAA.60.Search in Google Scholar
[20] Castiello ME, Tonini M. An explorative application of random forest algorithm for archaeological predictive modeling. A Swiss case study. J Comput Appl Archaeol. 2021;4(1):110–25.Search in Google Scholar
[21] Caspari G, Crespo P. Convolutional neural networks for archaeological site detection – Finding “princely” tombs. J Archaeol Sci. 2019;110:1–9. 10.1016/j.jas.2019.104998.Search in Google Scholar
[22] State Administration of Cultural Heritage. Atlas of Chinese Cultural Heritage. Hubei Branch Book (above). Xi’an: Xi’an Map Press; 2002. p. 1067.Search in Google Scholar
[23] Breiman L. Bagging predictors. Mach Learn. 1996.Search in Google Scholar
[24] Cutler A, Cutler DR, Stevens JR. Random forests. Mach Learn. 2004;45(1):157–76.Search in Google Scholar
[25] Liao M, Wen H, Yang L. Identifying the essential conditioning factors of landslide susceptibility models under different grid resolutions using hybrid machine learning: A case of Wushan and Wuxi counties. China. Catena. 2022;217:106428. 10.1016/j.catena.2022.106428.Search in Google Scholar
[26] Heckmann T, Gegg K, Gegg A, Becht M. Sample size matters: Investigating the effect of sample size on a logistic regression susceptibility model for debris flows. Nat Hazards Earth Syst Sci. 2014;14(2):259–78. 10.5194/nhess-14-259-2014.Search in Google Scholar
[27] Sun D, Gu Q, Wen H, Xu J, Zhang Y, Shi S, et al. Assessment of landslide susceptibility along mountain highways based on different machine learning algorithms and mapping units by hybrid factors screening and sample optimization. Gondwana Res. 2022. 10.1016/j.gr.2022.07.013.Search in Google Scholar
[28] WenDuo M. Hydrological environment evolution and human activities in Jianghan-Dongting Basin in the middle reaches of Yangtze River since Holocene. Acta Geogr Sin. 2020;75(3):529–43.Search in Google Scholar
[29] Rivera-Collazo I, Ramos-Vélez M, Rodríguez-Delgado E, Cantú K. The power of archaeology to address interpretation biases in modern geomorphology. Geomorphology. 2021;389:1–15. 10.1016/j.geomorph.2021.107843.Search in Google Scholar
[30] Jie W. Archaeological harvest at the site of the Carved Dragon Stele in Zaoyang, Hubei Province. Jianghan Archaeol. 1997;4:5.Search in Google Scholar
[31] Jun C, Yuanjun Z, Huiya F. History of agricultural development in Hubei Province. Beijing: China Literature and History Publishing House; 1992.Search in Google Scholar
[32] kezhen Z. A preliminary study of climate change in China during the last five thousand years. Acta Archaeol Sin. 1997;1:15–38.Search in Google Scholar
[33] Hongbing Y. Cultural geography of Hanjiang River Basin in Neolithic Age. Cult Dev Rev. 2016;2:18.Search in Google Scholar
[34] Sun D, Xu J, Wen H, Wang D. Assessment of landslide susceptibility mapping based on Bayesian hyperparameter optimization: A comparison between logistic regression and random forest. Eng Geol. 2021;281:1–12. 10.1016/j.enggeo.2020.105972.Search in Google Scholar
[35] Zhang J, Ma X, Zhang J, Sun D, Mi C, et al. Insights into geospatial heterogeneity of landslide susceptibility based on the SHAP-XGBoost model. J Environ Manage. 2023;332:117357. 10.1016/j.jenvman.2023.117357.Search in Google Scholar
[36] Zhou X, Wen H, Zhang Y, Xu J, Zhang W. Landslide susceptibility mapping using hybrid random forest with GeoDetector and RFE for factor optimization. Geosci Front. 2021;12(5):2–19. 10.1016/j.gsf.2021.101211.Search in Google Scholar
[37] Wang Y, Wen H, Sun D, Li Y. Quantitative assessment of Landslide Risk based on susceptibility mapping using random forest and GeoDetector. Remote Sens. 2021;13(13):1–34. 10.3390/rs13132625.Search in Google Scholar
[38] Li L, Chen X, Zhang J, Sun D, Liu R. Landslide susceptibility-oriented suitability evaluation of construction land in mountainous areas. Forests 2022;13(10):1621. 10.3390/f13101621.Search in Google Scholar
[39] Vaughn S, Crawford T. A predictive model of archaeological potential: An example from northwestern Belize. Appl Geogr 2009; 29(4):542–55. 10.1016/j.apgeog.2009.01.001.Search in Google Scholar
© 2023 the author(s), published by De Gruyter
This work is licensed under the Creative Commons Attribution 4.0 International License.
Articles in the same Issue
- Regular Articles
- Diagenesis and evolution of deep tight reservoirs: A case study of the fourth member of Shahejie Formation (cg: 50.4-42 Ma) in Bozhong Sag
- Petrography and mineralogy of the Oligocene flysch in Ionian Zone, Albania: Implications for the evolution of sediment provenance and paleoenvironment
- Biostratigraphy of the Late Campanian–Maastrichtian of the Duwi Basin, Red Sea, Egypt
- Structural deformation and its implication for hydrocarbon accumulation in the Wuxia fault belt, northwestern Junggar basin, China
- Carbonate texture identification using multi-layer perceptron neural network
- Metallogenic model of the Hongqiling Cu–Ni sulfide intrusions, Central Asian Orogenic Belt: Insight from long-period magnetotellurics
- Assessments of recent Global Geopotential Models based on GPS/levelling and gravity data along coastal zones of Egypt
- Accuracy assessment and improvement of SRTM, ASTER, FABDEM, and MERIT DEMs by polynomial and optimization algorithm: A case study (Khuzestan Province, Iran)
- Uncertainty assessment of 3D geological models based on spatial diffusion and merging model
- Evaluation of dynamic behavior of varved clays from the Warsaw ice-dammed lake, Poland
- Impact of AMSU-A and MHS radiances assimilation on Typhoon Megi (2016) forecasting
- Contribution to the building of a weather information service for solar panel cleaning operations at Diass plant (Senegal, Western Sahel)
- Measuring spatiotemporal accessibility to healthcare with multimodal transport modes in the dynamic traffic environment
- Mathematical model for conversion of groundwater flow from confined to unconfined aquifers with power law processes
- NSP variation on SWAT with high-resolution data: A case study
- Reconstruction of paleoglacial equilibrium-line altitudes during the Last Glacial Maximum in the Diancang Massif, Northwest Yunnan Province, China
- A prediction model for Xiangyang Neolithic sites based on a random forest algorithm
- Determining the long-term impact area of coastal thermal discharge based on a harmonic model of sea surface temperature
- Origin of block accumulations based on the near-surface geophysics
- Investigating the limestone quarries as geoheritage sites: Case of Mardin ancient quarry
- Population genetics and pedigree geography of Trionychia japonica in the four mountains of Henan Province and the Taihang Mountains
- Performance audit evaluation of marine development projects based on SPA and BP neural network model
- Study on the Early Cretaceous fluvial-desert sedimentary paleogeography in the Northwest of Ordos Basin
- Detecting window line using an improved stacked hourglass network based on new real-world building façade dataset
- Automated identification and mapping of geological folds in cross sections
- Silicate and carbonate mixed shelf formation and its controlling factors, a case study from the Cambrian Canglangpu formation in Sichuan basin, China
- Ground penetrating radar and magnetic gradient distribution approach for subsurface investigation of solution pipes in post-glacial settings
- Research on pore structures of fine-grained carbonate reservoirs and their influence on waterflood development
- Risk assessment of rain-induced debris flow in the lower reaches of Yajiang River based on GIS and CF coupling models
- Multifractal analysis of temporal and spatial characteristics of earthquakes in Eurasian seismic belt
- Surface deformation and damage of 2022 (M 6.8) Luding earthquake in China and its tectonic implications
- Differential analysis of landscape patterns of land cover products in tropical marine climate zones – A case study in Malaysia
- DEM-based analysis of tectonic geomorphologic characteristics and tectonic activity intensity of the Dabanghe River Basin in South China Karst
- Distribution, pollution levels, and health risk assessment of heavy metals in groundwater in the main pepper production area of China
- Study on soil quality effect of reconstructing by Pisha sandstone and sand soil
- Understanding the characteristics of loess strata and quaternary climate changes in Luochuan, Shaanxi Province, China, through core analysis
- Dynamic variation of groundwater level and its influencing factors in typical oasis irrigated areas in Northwest China
- Creating digital maps for geotechnical characteristics of soil based on GIS technology and remote sensing
- Changes in the course of constant loading consolidation in soil with modeled granulometric composition contaminated with petroleum substances
- Correlation between the deformation of mineral crystal structures and fault activity: A case study of the Yingxiu-Beichuan fault and the Milin fault
- Cognitive characteristics of the Qiang religious culture and its influencing factors in Southwest China
- Spatiotemporal variation characteristics analysis of infrastructure iron stock in China based on nighttime light data
- Interpretation of aeromagnetic and remote sensing data of Auchi and Idah sheets of the Benin-arm Anambra basin: Implication of mineral resources
- Building element recognition with MTL-AINet considering view perspectives
- Characteristics of the present crustal deformation in the Tibetan Plateau and its relationship with strong earthquakes
- Influence of fractures in tight sandstone oil reservoir on hydrocarbon accumulation: A case study of Yanchang Formation in southeastern Ordos Basin
- Nutrient assessment and land reclamation in the Loess hills and Gulch region in the context of gully control
- Handling imbalanced data in supervised machine learning for lithological mapping using remote sensing and airborne geophysical data
- Spatial variation of soil nutrients and evaluation of cultivated land quality based on field scale
- Lignin analysis of sediments from around 2,000 to 1,000 years ago (Jiulong River estuary, southeast China)
- Assessing OpenStreetMap roads fitness-for-use for disaster risk assessment in developing countries: The case of Burundi
- Transforming text into knowledge graph: Extracting and structuring information from spatial development plans
- A symmetrical exponential model of soil temperature in temperate steppe regions of China
- A landslide susceptibility assessment method based on auto-encoder improved deep belief network
- Numerical simulation analysis of ecological monitoring of small reservoir dam based on maximum entropy algorithm
- Morphometry of the cold-climate Bory Stobrawskie Dune Field (SW Poland): Evidence for multi-phase Lateglacial aeolian activity within the European Sand Belt
- Adopting a new approach for finding missing people using GIS techniques: A case study in Saudi Arabia’s desert area
- Geological earthquake simulations generated by kinematic heterogeneous energy-based method: Self-arrested ruptures and asperity criterion
- Semi-automated classification of layered rock slopes using digital elevation model and geological map
- Geochemical characteristics of arc fractionated I-type granitoids of eastern Tak Batholith, Thailand
- Lithology classification of igneous rocks using C-band and L-band dual-polarization SAR data
- Analysis of artificial intelligence approaches to predict the wall deflection induced by deep excavation
- Evaluation of the current in situ stress in the middle Permian Maokou Formation in the Longnüsi area of the central Sichuan Basin, China
- Utilizing microresistivity image logs to recognize conglomeratic channel architectural elements of Baikouquan Formation in slope of Mahu Sag
- Resistivity cutoff of low-resistivity and low-contrast pays in sandstone reservoirs from conventional well logs: A case of Paleogene Enping Formation in A-Oilfield, Pearl River Mouth Basin, South China Sea
- Examining the evacuation routes of the sister village program by using the ant colony optimization algorithm
- Spatial objects classification using machine learning and spatial walk algorithm
- Study on the stabilization mechanism of aeolian sandy soil formation by adding a natural soft rock
- Bump feature detection of the road surface based on the Bi-LSTM
- The origin and evolution of the ore-forming fluids at the Manondo-Choma gold prospect, Kirk range, southern Malawi
- A retrieval model of surface geochemistry composition based on remotely sensed data
- Exploring the spatial dynamics of cultural facilities based on multi-source data: A case study of Nanjing’s art institutions
- Study of pore-throat structure characteristics and fluid mobility of Chang 7 tight sandstone reservoir in Jiyuan area, Ordos Basin
- Study of fracturing fluid re-discharge based on percolation experiments and sampling tests – An example of Fuling shale gas Jiangdong block, China
- Impacts of marine cloud brightening scheme on climatic extremes in the Tibetan Plateau
- Ecological protection on the West Coast of Taiwan Strait under economic zone construction: A case study of land use in Yueqing
- The time-dependent deformation and damage constitutive model of rock based on dynamic disturbance tests
- Evaluation of spatial form of rural ecological landscape and vulnerability of water ecological environment based on analytic hierarchy process
- Fingerprint of magma mixture in the leucogranites: Spectroscopic and petrochemical approach, Kalebalta-Central Anatolia, Türkiye
- Principles of self-calibration and visual effects for digital camera distortion
- UAV-based doline mapping in Brazilian karst: A cave heritage protection reconnaissance
- Evaluation and low carbon ecological urban–rural planning and construction based on energy planning mechanism
- Modified non-local means: A novel denoising approach to process gravity field data
- A novel travel route planning method based on an ant colony optimization algorithm
- Effect of time-variant NDVI on landside susceptibility: A case study in Quang Ngai province, Vietnam
- Regional tectonic uplift indicated by geomorphological parameters in the Bahe River Basin, central China
- Computer information technology-based green excavation of tunnels in complex strata and technical decision of deformation control
- Spatial evolution of coastal environmental enterprises: An exploration of driving factors in Jiangsu Province
- A comparative assessment and geospatial simulation of three hydrological models in urban basins
- Aquaculture industry under the blue transformation in Jiangsu, China: Structure evolution and spatial agglomeration
- Quantitative and qualitative interpretation of community partitions by map overlaying and calculating the distribution of related geographical features
- Numerical investigation of gravity-grouted soil-nail pullout capacity in sand
- Analysis of heavy pollution weather in Shenyang City and numerical simulation of main pollutants
- Road cut slope stability analysis for static and dynamic (pseudo-static analysis) loading conditions
- Forest biomass assessment combining field inventorying and remote sensing data
- Late Jurassic Haobugao granites from the southern Great Xing’an Range, NE China: Implications for postcollision extension of the Mongol–Okhotsk Ocean
- Petrogenesis of the Sukadana Basalt based on petrology and whole rock geochemistry, Lampung, Indonesia: Geodynamic significances
- Numerical study on the group wall effect of nodular diaphragm wall foundation in high-rise buildings
- Water resources utilization and tourism environment assessment based on water footprint
- Geochemical evaluation of the carbonaceous shale associated with the Permian Mikambeni Formation of the Tuli Basin for potential gas generation, South Africa
- Detection and characterization of lineaments using gravity data in the south-west Cameroon zone: Hydrogeological implications
- Study on spatial pattern of tourism landscape resources in county cities of Yangtze River Economic Belt
- The effect of weathering on drillability of dolomites
- Noise masking of near-surface scattering (heterogeneities) on subsurface seismic reflectivity
- Query optimization-oriented lateral expansion method of distributed geological borehole database
- Petrogenesis of the Morobe Granodiorite and their shoshonitic mafic microgranular enclaves in Maramuni arc, Papua New Guinea
- Environmental health risk assessment of urban water sources based on fuzzy set theory
- Spatial distribution of urban basic education resources in Shanghai: Accessibility and supply-demand matching evaluation
- Spatiotemporal changes in land use and residential satisfaction in the Huai River-Gaoyou Lake Rim area
- Walkaway vertical seismic profiling first-arrival traveltime tomography with velocity structure constraints
- Study on the evaluation system and risk factor traceability of receiving water body
- Predicting copper-polymetallic deposits in Kalatag using the weight of evidence model and novel data sources
- Temporal dynamics of green urban areas in Romania. A comparison between spatial and statistical data
- Passenger flow forecast of tourist attraction based on MACBL in LBS big data environment
- Varying particle size selectivity of soil erosion along a cultivated catena
- Relationship between annual soil erosion and surface runoff in Wadi Hanifa sub-basins
- Influence of nappe structure on the Carboniferous volcanic reservoir in the middle of the Hongche Fault Zone, Junggar Basin, China
- Dynamic analysis of MSE wall subjected to surface vibration loading
- Pre-collisional architecture of the European distal margin: Inferences from the high-pressure continental units of central Corsica (France)
- The interrelation of natural diversity with tourism in Kosovo
- Assessment of geosites as a basis for geotourism development: A case study of the Toplica District, Serbia
- IG-YOLOv5-based underwater biological recognition and detection for marine protection
- Monitoring drought dynamics using remote sensing-based combined drought index in Ergene Basin, Türkiye
- Review Articles
- The actual state of the geodetic and cartographic resources and legislation in Poland
- Evaluation studies of the new mining projects
- Comparison and significance of grain size parameters of the Menyuan loess calculated using different methods
- Scientometric analysis of flood forecasting for Asia region and discussion on machine learning methods
- Rainfall-induced transportation embankment failure: A review
- Rapid Communication
- Branch fault discovered in Tangshan fault zone on the Kaiping-Guye boundary, North China
- Technical Note
- Introducing an intelligent multi-level retrieval method for mineral resource potential evaluation result data
- Erratum
- Erratum to “Forest cover assessment using remote-sensing techniques in Crete Island, Greece”
- Addendum
- The relationship between heat flow and seismicity in global tectonically active zones
- Commentary
- Improved entropy weight methods and their comparisons in evaluating the high-quality development of Qinghai, China
- Special Issue: Geoethics 2022 - Part II
- Loess and geotourism potential of the Braničevo District (NE Serbia): From overexploitation to paleoclimate interpretation