Nutrient assessment and land reclamation in the Loess hills and Gulch region in the context of gully control
-
Panpan Zhang
 ,
Liheng Xia
,
Liheng Xia

Abstract
Soil quality is the key to the success or failure of the gully land reclamation project. Studying the variation characteristics of soil nutrients and evaluating the nutrient classes in the gully after the implementation of gully land reclamation project in the loess hilly and gully region can provide a basis for adjusting the spatial layout of gully crops, rational planning and utilization of land resources, and soil nutrient management. In this study, a typical gully in Yan’an City, Shaanxi Province, China was taken as the research object. Based on the data of soil organic matter (SOM), total nitrogen (TN), available phosphorus (AP), and available potassium (AK) before 0 year (0a) and after 2, 4, and 8 years (2a, 4a, and 8a) gully remediation. From the spatial distribution characteristics of soil nutrients and its levels, the classical statistical analysis, geostatistical analysis, and matter-element model were used to reveal the variation characteristics of soil nutrients in the gully before and after the gully land reclamation project. The results showed that (1) before remediation, except for AK which reached the level of 1–3, the rest of the nutrients content was generally low and the degree of variation was large, after remediation the degree of variation decreased and the coefficient of variation was between 0.23–0.54, the distribution tended to be uniform. (2) SOM content showed a “decrease–increase” change process, reaching the highest after remediation (8a); TN and AP increased first and then decreased; AK showed a “downward–upward–downward” change process. (3) The soil nutrient grade belongs to the appropriate level. After the implementation of the project, only the gully head is reduced to the poor level. After 4a of remediation, the soil nutrient grade is restored and has the potential to continue to improve. Compared with the slope land remediation, the soil nutrient recovery time of gully land creation is shorter, the spatial layout of crops can be adjusted according to the soil nutrient characteristics of different locations in gully, and different levels and methods of management measures can be implemented to increase food production.
1 Introduction
The Loess Plateau is the area with the most serious soil erosion and the most fragile ecological environment in China, and it also has an important agricultural production task. Although the large-scale implementation of the project of returning farmland to forest and grass has greatly improved the regional ecological environment [1], it has also led to a decrease in the area of arable land, which has led to a situation of arable land being tightly used and an imbalance between food supply and demand [2,3]. In order to solve the outstanding problems such as the local contradiction between people and food, the project of gully reclamation and land creation in Yan’an City has been piloted since 2010, and was listed as a major national land improvement project supported by the central government in 2013 [4]. The gully land reclamation project aims to increase the area of arable land, improve the quality of arable land, ensure food security, and solve the contradiction between human and land through measures such as gully land reclamation, damming and repairing gully, and mulching [5]. By the end of 2018, 33973.33 hm2 of gully land had been completed, and 6,860 hm2 of cultivated land had been added [6].
Soil nutrients are the material basis for soil fertility, and their spatial and temporal distribution characteristics have an important influence on the quality of the soil environment and the health of crops [7]. Land remediation measures such as mechanical rolling, deep soil tilling, topsoil stripping, and backfilling break the original state of the soil and may have an impact on the organic matter and fast-acting nutrient content of the soil [7]. It was found that after land reclamation, soil fertility showed a decreasing trend over a period of time, with a decrease in soil nutrients such as nitrogen, phosphorus, potassium, and organic matter, and a decrease in trace elements [8,9,10,11]. Since the implementation of the gully land reclamation project, scholars in China have conducted some studies on the changes in soil quality and nutrients in the gully of the Loess Plateau area. Wang et al. [12] analyzed and evaluated the soil nutrient characteristics of new arable land in 13 trenching projects, showing that the new arable land formed by trenching was of low quality grade, with low organic matter, fast-acting potassium, and effective phosphorus content due to the short utilization time. Fu et al. [13] showed that suitable fertilization can rapidly increase the soil organic matter (SOM), improve the physical and chemical properties of the cultivated soil and enhance the land productivity of the newly constructed land by trench treatment. Chen et al. [14] found from the study of salinization of land in different gully in northern Shaanxi that the thin soil layer in the land treatment gully, combined with the blocking effect of reservoirs or silt dams, makes the water table shallow and the soil susceptible to salinization. However, at present, there is no in-depth study on the changes in soil nutrients at a long-time scale after gully land reclamation. Therefore, this study takes the land remediation project of Jiulongquan, Nanniwan Town, Baota District, Yan’an City, Shaanxi Province, as an example, and collects soil samples from different locations of the gully in different years of remediation to study the characteristics of changes in SOM, nitrogen, phosphorus, and potassium indicators before and after remediation in different years, so as to provide effective suggestions for improving land remediation methods in this area, adopting reasonable farming management measures and improving the utilization of nutrient resources. In the past, the evaluation methods of soil nutrients were mostly simple multi-indicator comprehensive evaluation. In recent years, higher mathematical methods such as analytical hierarchy process (AHP), principal component analysis, and neural network method have been gradually tried to be used in evaluation, but AHP combined with matter-element model analysis is less used. Using AHP to calculate the weights of individual indicators, and then using matter-element model to calculate the correlation coefficients to obtain comprehensive evaluation results can reveal richer evaluation information. Through the results of this study, the spatial layout of gully crops can be reasonably adjusted and management measures of different degrees and methods can be implemented by combining the soil nutrient characteristics of gully, so as to achieve the goal of increasing grain yield.
2 Materials and methods
2.1 Study area description
Jiulongquan is located in the gully area in the south of Baota District, Yan’an City (109°36′–109°39′E and 36°14′–36°19′N) and characterized by a semi-arid climate. In these conditions, all months have average temperatures greater than 9℃ and annual precipitation greater than 562.1 mm. The gully is about 9.5 km long. The elevation of the river gully is reduced from 1,170 to 1,093 m from north to south, with an average gradient of 0.78%. The valley width is generally between 250 and 500 m, with an area of 397.35 hm2. The terrain in the area is broken, the gullies are vertical and horizontal, and are strongly cut, the terrain slope is large, and the soil erosion is serious. The dominant soil type is loessial soil.
2.2 Soil sampling
Soil data included four phases of data in 2013 (0a), 2015 (2a), 2017 (4a), and 2021 (8a). Soil samples were collected from the head of the gully in the study area, and a sampling point was set up every 800–1,300 m along the gully towards the mouth of the gully, with a total of nine fixed sample points (Figure 1). At the center of each fixed sample point, 6–8 soil sample points were randomly selected in the form of “s” shape within a 10 m radius according to the topography, and soil samples were collected from 0–30 cm soil layer by using a 40 mm diameter soil auger, each soil sample was about 1,000 g. Meanwhile, attention was paid to avoid the fertilization point when sampling and mixing the soil samples.

The map of soil sample distribution.
2.3 Soil chemical analysis
The collected soil samples were aired and dried to remove impurities and then were finely ground to determine the contents of SOM, total nitrogen (TN), available phosphorus (AP), and available potassium (AK). SOM was determined by K2CrO7–H2SO4 oxidation method, TN was determined by semi-micro Kjeldahl method, AP was determined by NaHCO3 extraction-molybdenum antimony colorimetric method, and AK was determined by CH3COONH4 extraction-flame spectrophotometry [15].
2.4 Statistical analysis and matter-element model evaluation
2.4.1 Statistical analysis
Statistical analysis was performed using SPSS18.0 (SPSS Inc., Chicago, USA). One-way analysis of variance (One-way ANOVA, LSD) was used to test the significance of differences in different remediation years.
2.4.2 Evaluation of matter-element model
The matter-element model was used to evaluate soil nutrients. Because soil nutrients are a comprehensive system affected by multiple indicators, clear evaluation criteria may lead to information omission, and the matter-element model based on extension theory shows the transition state of soil nutrients, establishes the internal structure that can be changed and decomposed, calculates the correlation between each index and the whole, and comprehensively reflects the relationship between the internal structure of soil nutrients and each index, and thus comprehensively judges the basic situation of regional soil nutrients [16,17]. The matter-element model analysis first classifies each evaluation index, defines the interval and value range, determines the classical domain and the joint domain, then calculates the soil nutrient level of a single index through the correlation function of a single index, and then obtains the comprehensive soil nutrient level of multiple indexes through model integration.
3 Results
3.1 Statistical analysis of soil nutrient index
In terms of the mean value of each index of soil nutrients, except for AK, the soil nutrient content in the study area was generally low (Table 1), and according to the soil nutrient grading standard of the second soil census of China [18], SOM belonged to the 4–5 level, TN belonged to the 2–6 level, AP belonged to the 3–6 level, and AK belonged to 1–3 level, which is relatively high. Before the land reclamation, the variation degree of soil nutrients in the gully was large, and the coefficient of variation (CV) was between 0.30 and 0.77, which belonged to the medium variation degree [19]. Among them, the variation degree of AP was the largest and the dispersion degree was high, followed by TN and SOM, and the variation degree of AK was the smallest. After the implementation of the gully land reclamation project, the CV of each nutrient in the gully has a tendency to decrease as a whole.
Characteristics of soil nutrients in gully with different remediation years
| Index | Statistical indicator | Remediation years | |||
|---|---|---|---|---|---|
| 0a | 2a | 4a | 8a | ||
| SOM | Maximum value (g/kg) | 24.61 | 19.88 | 23.10 | 20.40 |
| Minimum value (g/kg) | 8.39 | 5.56 | 7.29 | 6.94 | |
| Average value (g/kg) | 15.40 | 11.63 | 12.48 | 12.77 | |
| CV | 0.35 | 0.31 | 0.33 | 0.29 | |
| TN | Maximum value (g/kg) | 1.01 | 2.29 | 1.53 | 1.18 |
| Minimum value (g/kg) | 0.16 | 0.06 | 0.44 | 0.43 | |
| Average value (g/kg) | 0.52 | 1.11 | 0.85 | 0.74 | |
| CV | 0.45 | 0.68 | 0.29 | 0.29 | |
| AP | Maximum value (mg/kg) | 12.30 | 30.88 | 38.00 | 34.19 |
| Minimum value (mg/kg) | 1.02 | 4.11 | 1.82 | 2.36 | |
| Average value (mg/kg) | 3.73 | 10.53 | 13.25 | 7.86 | |
| CV | 0.77 | 0.63 | 0.68 | 0.54 | |
| AK | Maximum value (mg/kg) | 377.00 | 282.00 | 355.00 | 207.00 |
| Minimum value (mg/kg) | 114.00 | 84.00 | 67.00 | 83.00 | |
| Average value (mg/kg) | 206.74 | 151.18 | 191.78 | 146.30 | |
| CV | 0.30 | 0.29 | 0.38 | 0.23 | |
3.2 Spatial and temporal variation characteristics of soil nutrients
3.2.1 SOM
From Figures 2a and 3, we can see that before and after remediation, the SOM content of the gully outlet is higher than that of the gully head and the middle of gully, after the implementation of the project, the SOM in the gully showed a trend of first decreasing and then increasing with the increase in the remediation year, but the change is not obvious, especially the change in the gully head position is very small, while the change in the middle of the gully is more significant, SOM in the remediation 8a still has not returned to the level before the remediation. Before remediation, the SOM at the gully head was 12.02 g/kg, the middle of the gully was slightly higher than the gully head, and the SOM at the mouth of the gully was the highest, which was 19.27 g/kg. 2a after remediation, the SOM at the gully head decreased to 9.44 g/kg, and reached 11.75 g/kg at 8a, basically recovering to the level before remediation; In the middle of the gully, the SOM decreased significantly at 2a after remediation, decreased by about 30%, and continued to decrease at 4a, and then increased slightly in 8a, reaching 11.09 g/kg, but the change from 2a to 8a was not significant, still significantly lower than the value before remediation. The change in SOM at the gully outlet was basically the same as that at the middle of the gully, which decreased significantly at 2a after remediation and increased gradually after 2a, and was still 15.4% lower than the level before remediation at 8a after remediation. After remediation, due to the disturbance of topsoil stripping or the cover of poor soil on the side of the gully slope, the SOM of the soil surface layer was lower than that before remediation, and the soil ecosystem was adjusted after 2–3a, and the humus layer of the soil was deepened by management measures such as fertilization and the self-fertilization of crops, so that the SOM of the surface layer increased, and the soil system further stabilized when the remediation year increased to 8a, and the growth of plants and root system also improves the source of SOM in the lower layer, which promotes the formation of SOM and its content further increases.
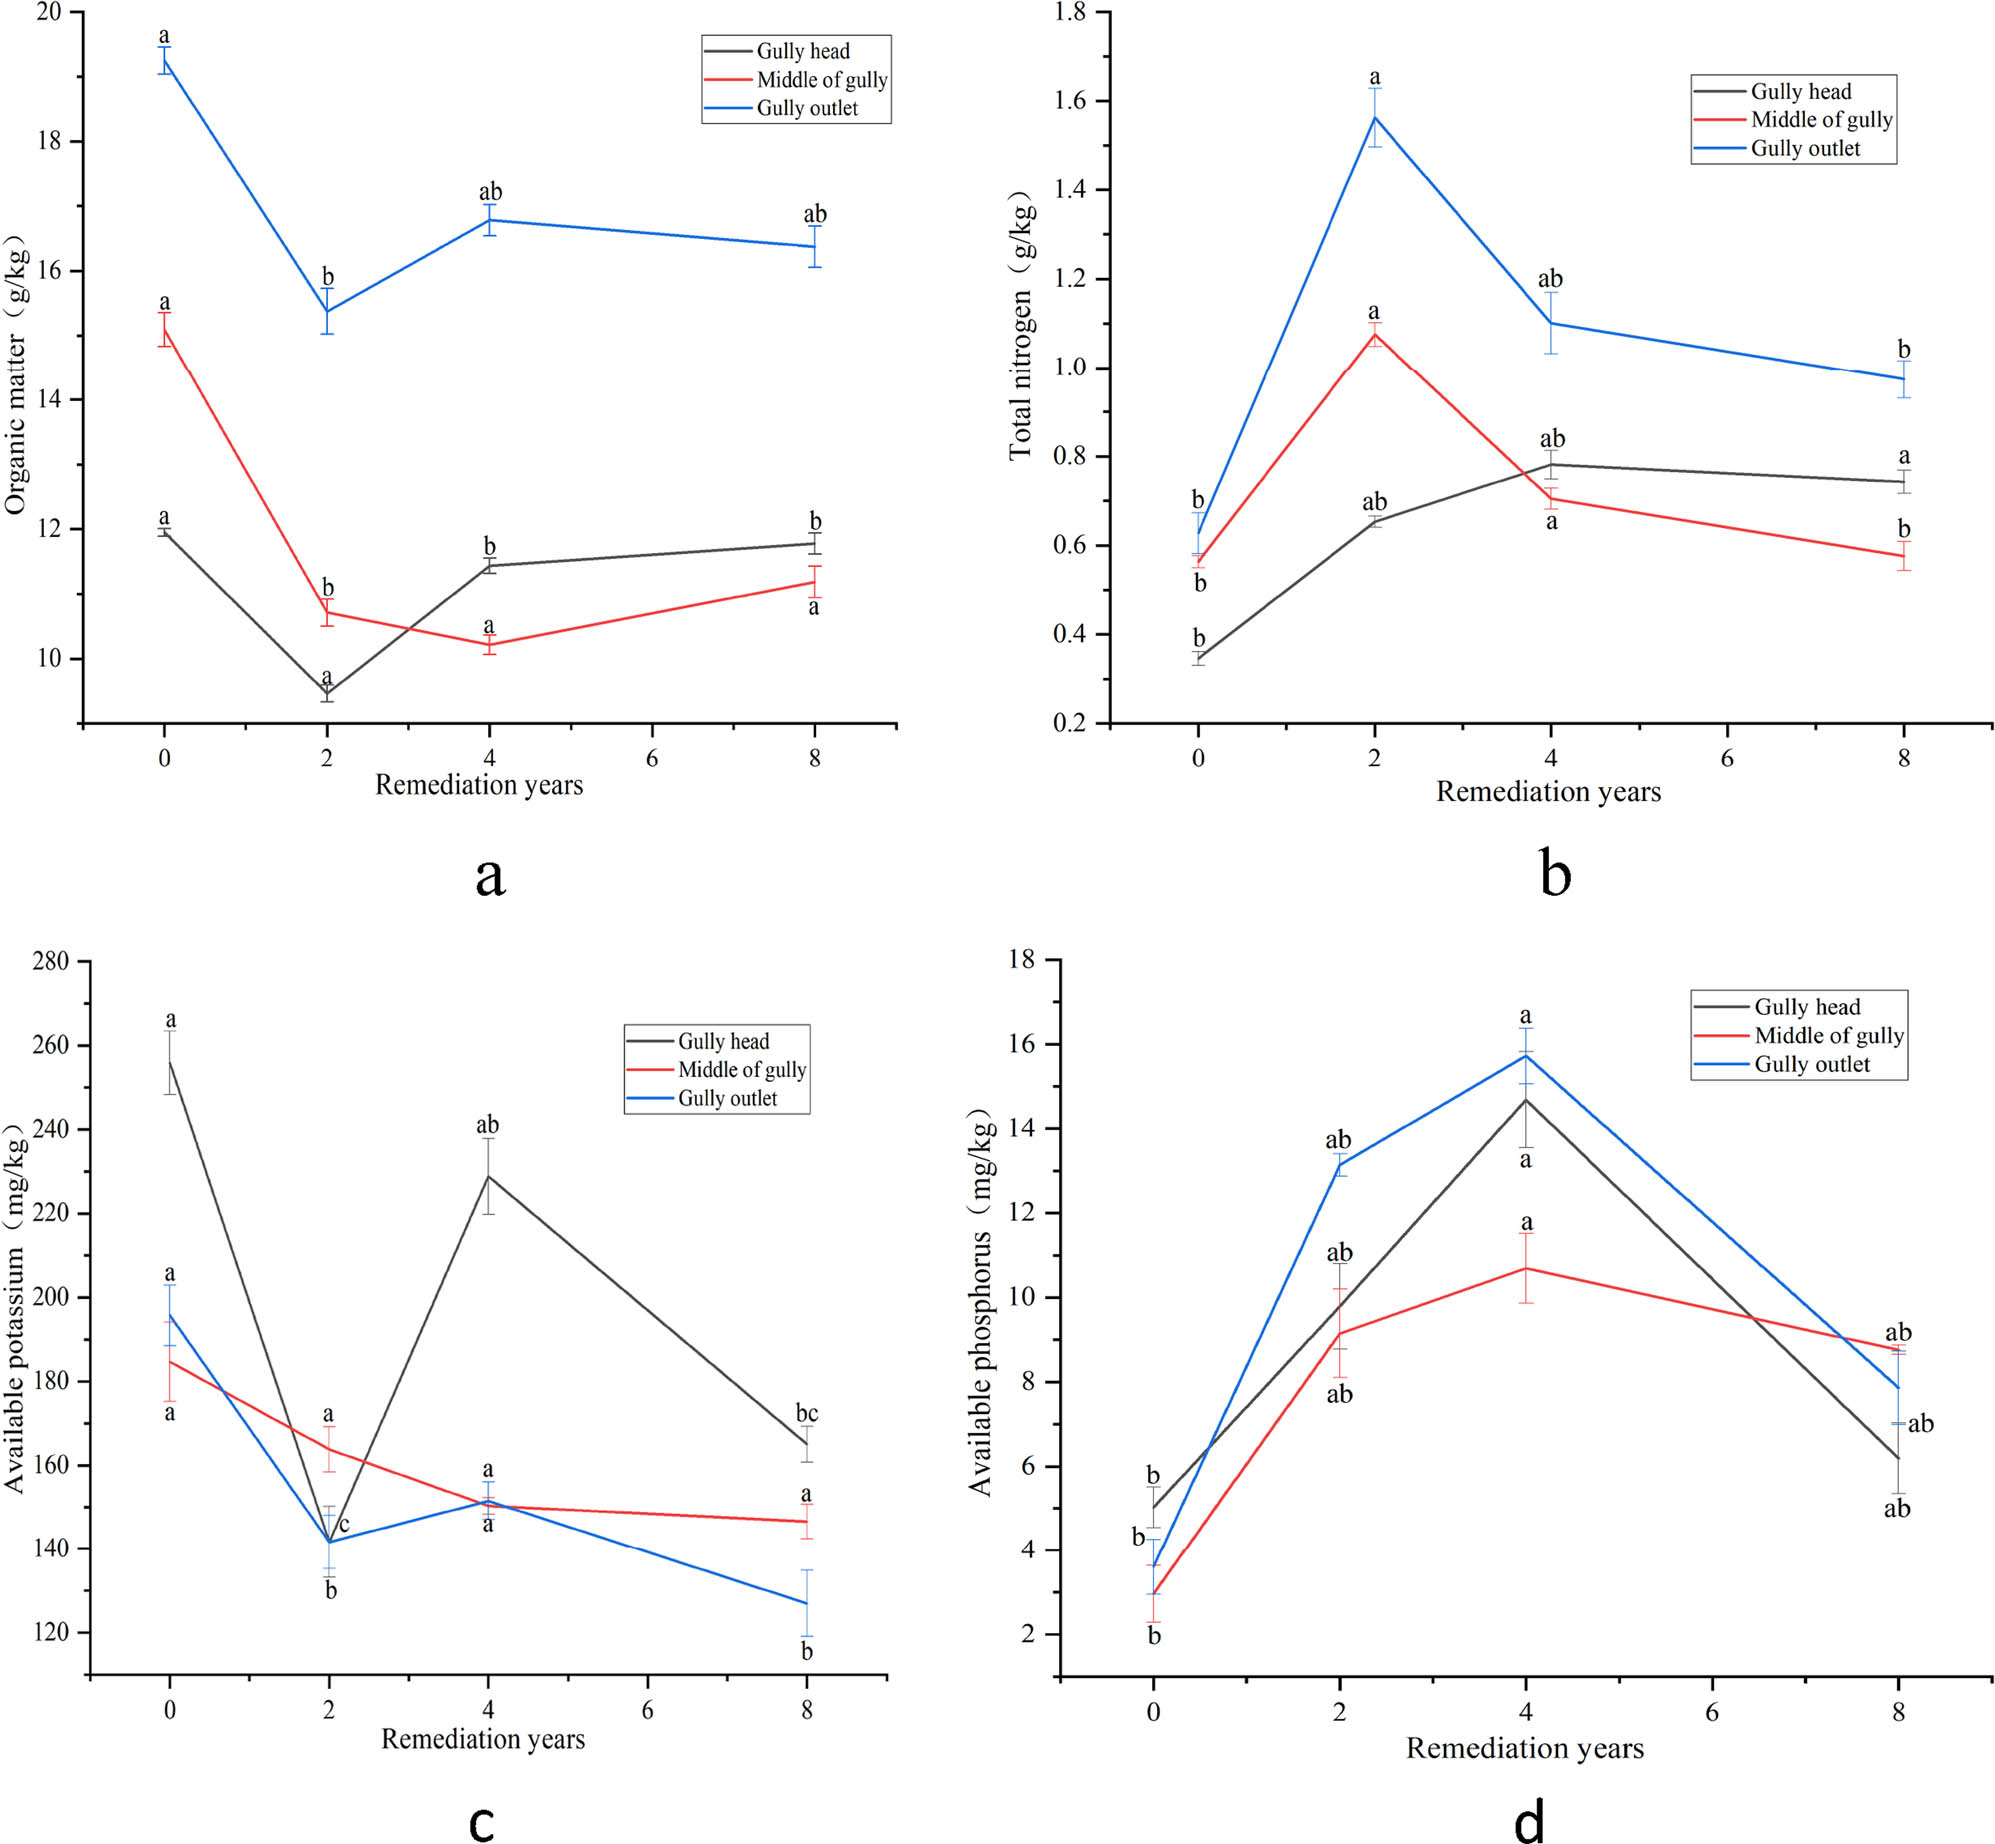
Distribution of soil nutrients in gully with different remediation years. Note: Different lowercase letters indicate significant differences between different remediation years (p < 0.05). (a) (SOM), (b) (TN), (c) (AP), and (d) (AK).
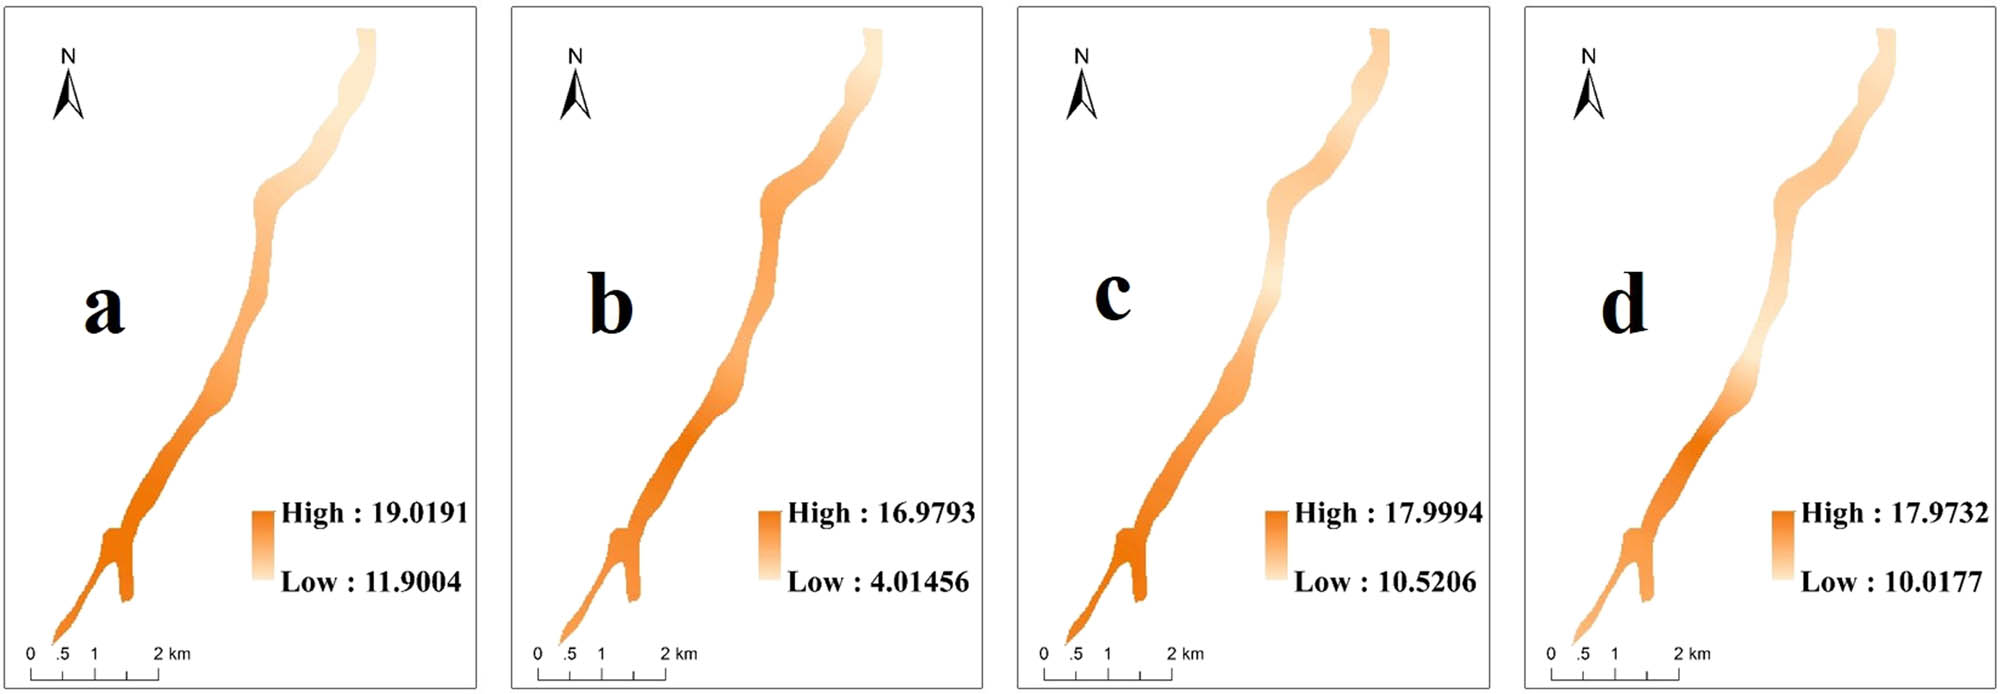
Soil SOM spatial distribution map. Note: (a) (SOM, 0a), (b) (SOM, 2a), (c) (SOM, 4a), and (d) (SOM, 8a).
3.2.2 TN
From Figures 2b and 4, overall, the TN content before remediation was: gully head < the middle of gully < gully outlet. After remediation, TN increased and then decreased with the remediation years, and all of them were higher than that before remediation. At the gully head, TN reaches the highest value of 0.78 g/kg at 4a, and then decreases slightly, and the content at 4a and 8a is significantly higher than that before the remediation, which is more than twice of that before the remediation. In the middle of the gully, TN increased significantly in 2a, then decreased gradually and dropped to the same level as before remediation in 8a. The trend of TN at the gully outlet was more consistent with that at the middle of the gully, with a significant increase at 2a, followed by a gradual decrease, and its percentage of increase was greater than that at the middle of the gully.
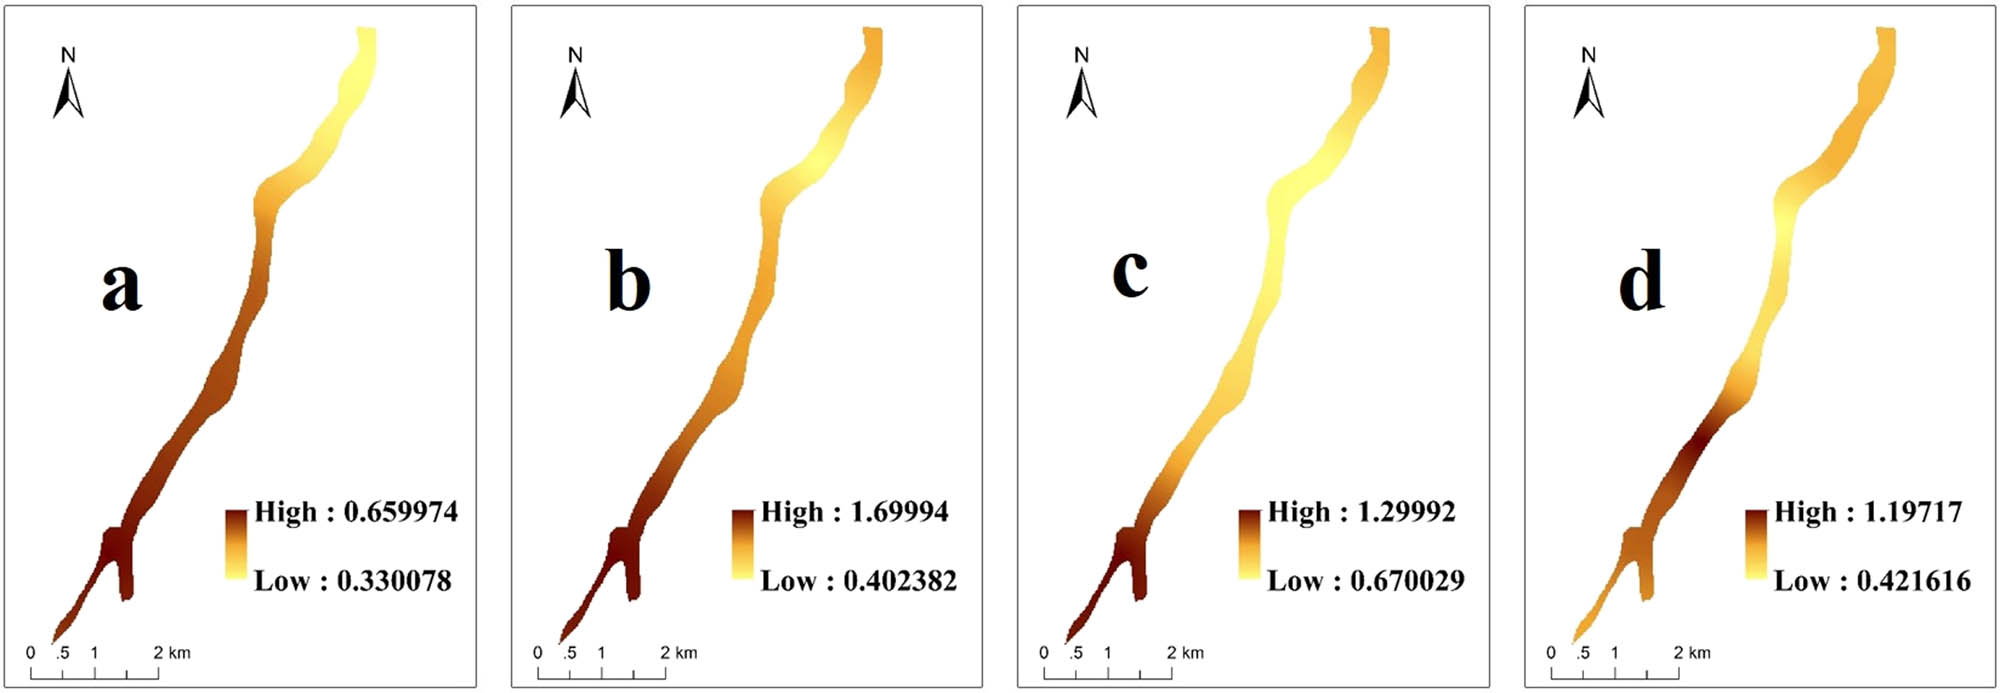
Soil TN spatial distribution map. Note: (a) (TN, 0a), (b) (TN, 2a), (c) (TN, 4a), and (d) (TN, 8a).
3.2.3 AP
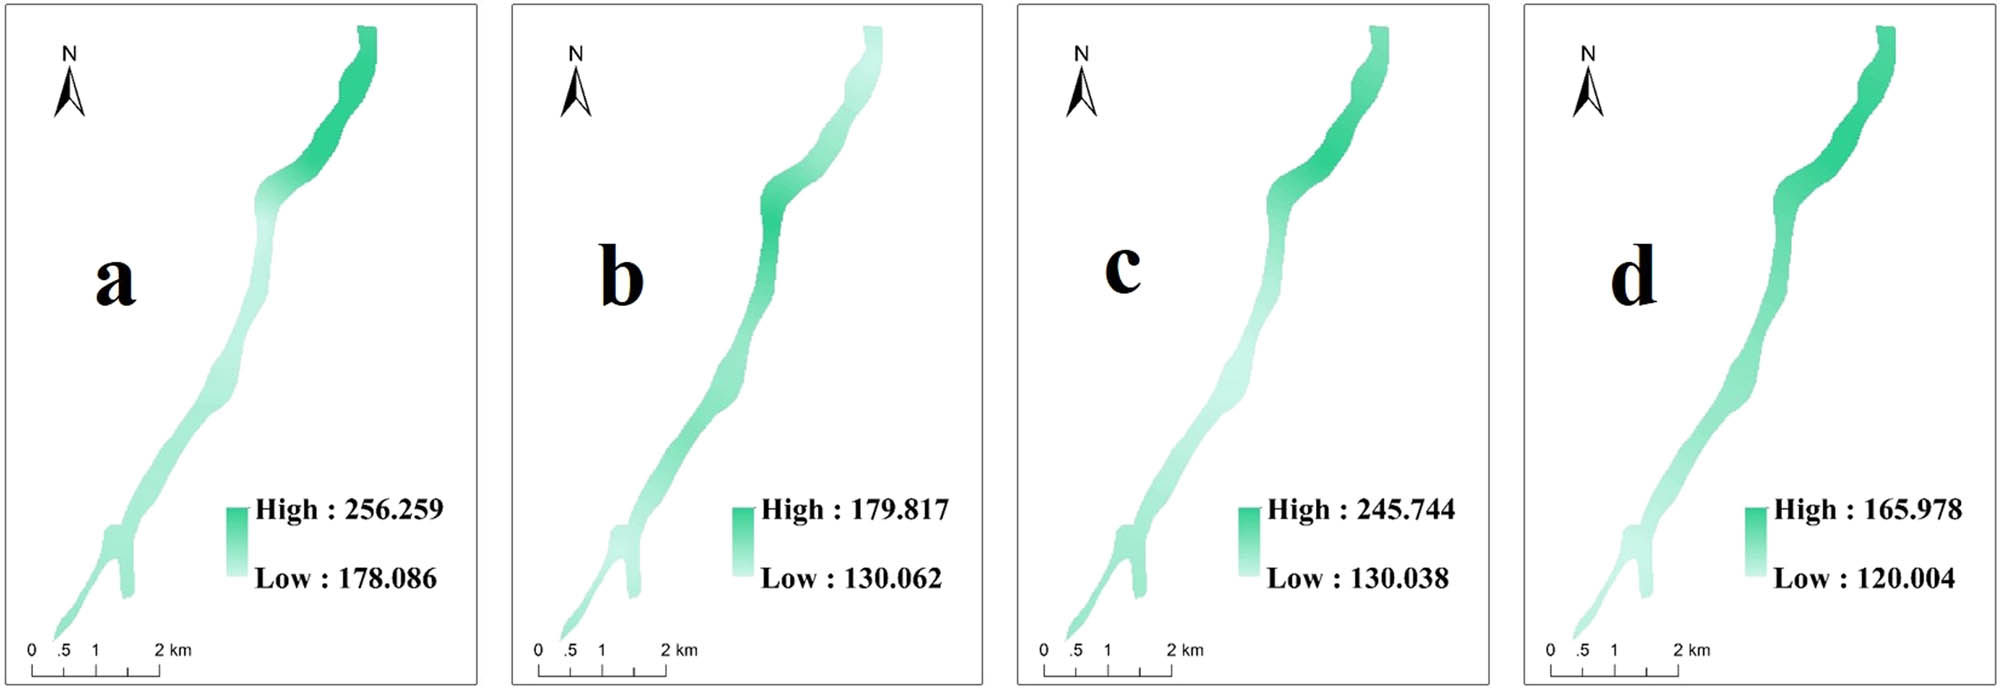
From Figures 2d and 5, the AP of the gully is consistent with the trend of change in TN content. With the change in remediation years, the AP as a whole shows the trend of first increasing and then decreasing with the remediation years, and the AP after remediation is higher than that before remediation. Before remediation, the AP at the head of the ditch was low, 5.01 mg/kg, after 2a, the AP gradually increased and reached the highest value of 14.62 mg/kg at 4a, which was nearly three times of that before remediation, and then dropped to 6.29 mg/kg at 8a, which was not much different from that before remediation. The trend of AP in the middle of the gully and gully outlet was the same as that in gully head with years of remediation, and the AP in the middle of the gully had the smallest change.
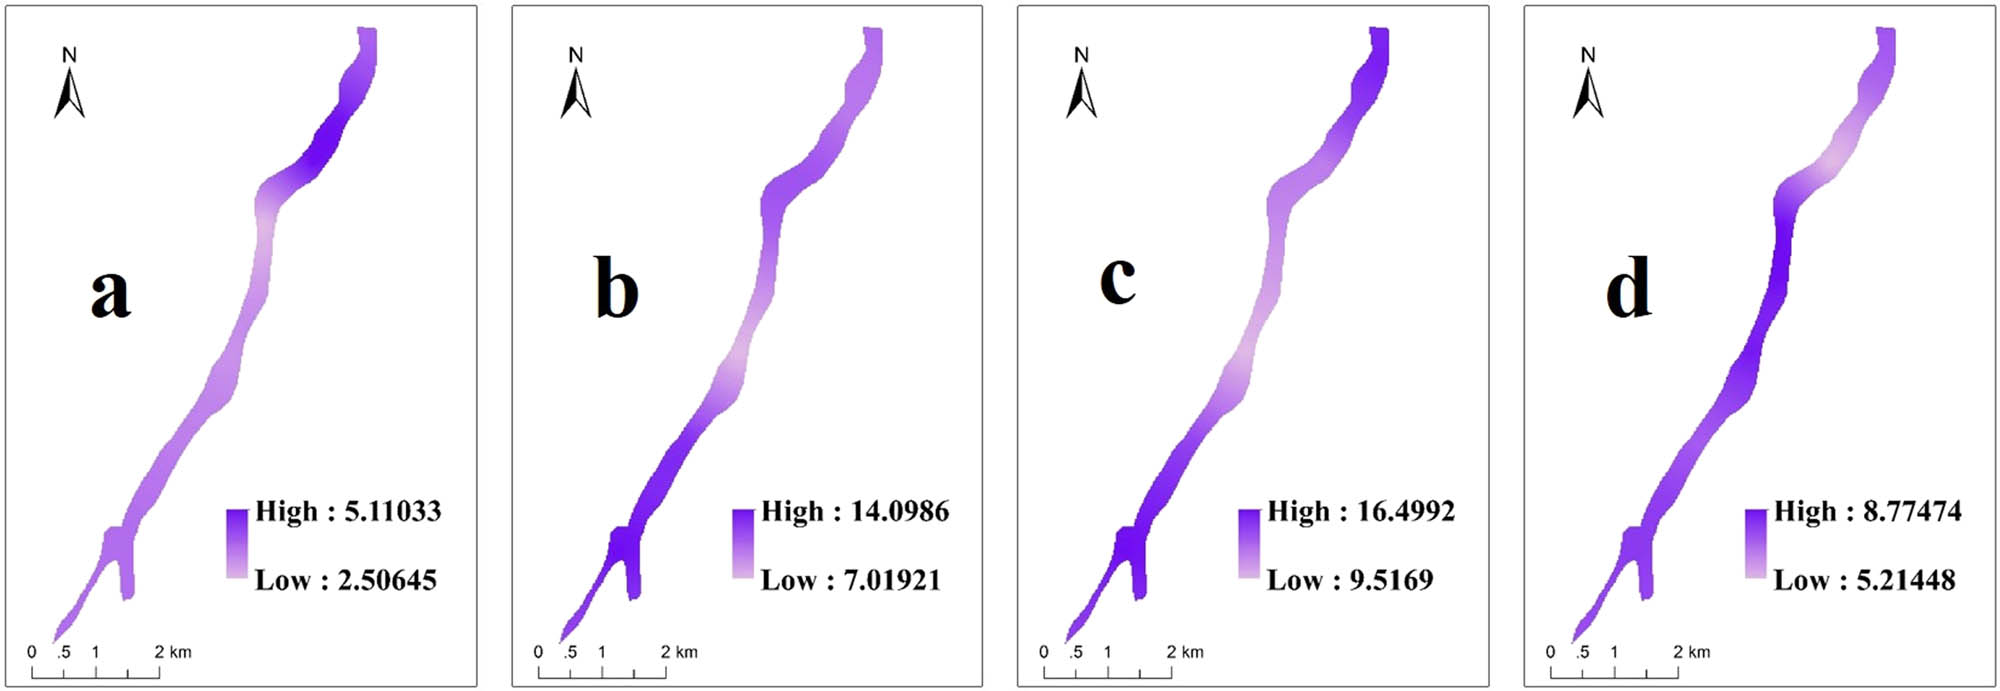
Soil AP spatial distribution map. Note: (a) (AP, 0a), (b) (AP, 2a), (c) (AP, 4a), and (d) (AP, 8a).
3.2.4 AK
From Figures 2c and 6, the AK before remediation showed that gully head > the middle of gully > gully outlet, the highest at the gully head was 255.04 mg/kg. The effect of remediation years on AK is different from TN and AP, as can be seen from the average value of AK in the gully, AK basically showed a decreasing trend after remediation. AK at gully head showed the process of “decreasing–increasing–decreasing,” and the decline was more significant in 2a after remediation, and were lower than before remediation in all the years. The AK in the middle of the gully continued to decrease from 18,467 mg/kg before remediation to 146.93 mg/kg 8a after remediation, and the change in the whole process was not significant. The change in AK at the gully outlet was similar to that at the gully head, with a significant decrease in 2a, a slight increase in 4a, and a continuous downward trend in 8a. AK was significantly lower in 2a and 8a after remediation than before remediation.
Soil AK spatial distribution map. Note: (a) (AK, 0a), (b) (AK, 2a), (c) (AK, 4a), and (d) (AK, 8a).
In general, the change patterns of AK, TN, and AP contents were different, in which AK showed a decreasing–increasing–decreasing trend after remediation, and the overall content decreased from 206.74 to 146.30 mg/kg; TN and AP showed an increasing and then decreasing trend, and the overall content increased by 0.22 and 4.13 g/kg, respectively. The main difference in the changes of these nutrient indicators is reflected in the 2a period after remediation, probably due to the fact that the AK content itself is high and measures such as agricultural fertilization after remediation do not have a significant effect on it.
3.3 Comprehensive evaluation of soil nutrients
In this study, four indexes of SOM, TN, AP, and AK were selected as evaluation indexes. The weight was determined by AHP [20], and the soil nutrient grade of gully reclamation project was evaluated by matter-element model.
3.3.1 Determination of index weight
The AHP is used to empower each index (Table 2), where λ max = 3.98, the calculated consistency index I c = 0.0026, the average random index IR = 0.9, the random consistency ratio R c = I c/IR = 0.003 < 0.1, indicating that the results pass the consistency test and have satisfactory consistency.
Weight of soil nutrient evaluation factors
| Weight factor | SOM (g/kg) | TN (g/kg) | AP (mg/kg) | AK (mg/kg) |
|---|---|---|---|---|
| Evaluation coefficient | 0.5559 | 0.2316 | 0.1371 | 0.0754 |
3.3.2 Determination of classical domain, section domain, and matter-element to be judged
According to the concept of extension set, the soil nutrients were divided into five grades: rich, relatively rich, moderate, poor, and extremely poor, which were expressed by Roman numeral I–V. First, five continuous datasets of N 1 , N 2 , N 3 , N 4, and N 5 are proposed, which correspond to five evaluation levels, respectively.
Using the classification standard of soil nutrients in the second national soil survey [18], the classical domain matter elements R 1 , R 2 , R 3 , R 4 , R 5 and nodal domain matter element R p for soil nutrient evaluation were established. Because some of the AK data are beyond the scope of the classical domain, the corresponding c 4 value range is changed accordingly.
Determination of the pending matter element. Taking the gully head before regulation as an example, the average number of points is as follows: organic matter 12.02 g/kg, TN 0.34 g/kg, AP 5.01 mg/kg, and AK 255.04 mg/kg. These data are used to determine the pending matter element of the point S 1.
3.3.3 Calculation of correlation degree and determination of quality grade
Taking the single index c
1 (organic matter) as an example (
The correlation degree and nutrient level of each grade corresponding to other indexes of S 1 can be obtained by the same method. According to the correlation degree and weight of each grade corresponding to each index, the comprehensive correlation degree of each evaluation grade corresponding to all indexes is calculated, and the soil nutrient level of each point is determined according to the judgment standard (Table 3). According to Table 3, before the gully land reclamation project, the soil nutrient grade in the Jiulongquan gully belonged to the appropriate grade. 2a after the implementation of the project, the soil nutrient evaluation grade of the gully head decreased to the poor level. However, through 4a, it returned to the appropriate level. The soil nutrient level in the middle of the gully has been maintained at an appropriate level. The soil nutrient evaluation grade of the gully mouth exceeded the pre-remediation level at 4a, reaching a richer grade, and returned to an appropriate level again at 8a.
Related calculation results of comprehensive evaluation of soil nutrients
| Position | Remediation years/a | N1 | N2 | N 3 | N4 | N5 | Nutrient level |
|---|---|---|---|---|---|---|---|
| Gully head | 0 | −0.6186 | −0.5151 | −0.0871 | −0.2283 | −0.2241 | III appropriate |
| 2 | −0.5918 | −0.4491 | −0.125 | −0.0006 | −0.3228 | IV poverty | |
| 4 | −0.4911 | −0.2804 | 0.0125 | −0.1874 | −0.3654 | III appropriate | |
| 8 | −0.7097 | −0.4309 | 0.1001 | −0.1301 | −0.4121 | III appropriate | |
| Middle of gully | 0 | −0.5384 | −0.3581 | 0.1202 | −0.1301 | −0.28 | III appropriate |
| 2 | −0.511 | −0.251 | −0.0005 | −0.1727 | −0.3543 | III appropriate | |
| 4 | −0.567 | −0.3284 | −0.0323 | −0.0563 | −0.3119 | III appropriate | |
| 8 | −0.5832 | −0.3588 | 0.0534 | −0.1235 | −0.2954 | III appropriate | |
| Gully outlet | 0 | −0.418 | −0.2231 | −0.0769 | −0.0783 | −0.3429 | III appropriate |
| 2 | −0.2774 | −0.1324 | 0.0903 | −0.3583 | −0.4457 | III appropriate | |
| 4 | −0.3662 | 0.02 | 0.0932 | −0.3182 | −0.4124 | II richer | |
| 8 | −0.4409 | −0.1222 | 0.277 | −0.2632 | −0.3761 | III appropriate |
4 Discussion
4.1 Temporal variation in soil nutrients
At present, except for AK, SOM, TN, and AP are in a state of deficiency in Jiulongquan gully. Yang Jinghan, Hao Liting, and others have shown similar results in the study of soil nutrients in this area [21,22]. The study found that soil nutrients showed a downward trend, and AK, SOM, TN, and AP decreased significantly due to topsoil stripping and soil cover. However, after a period of recovery (4–5a), combined with the application of chemical fertilizers and other measures, soil nutrient indicators have been significantly improved, even higher than before remediation [23,24,25]. In this study, TN and AP showed a higher growth trend than before in the 2–3a after remediation, indicating that gully land remediation can quickly offset the negative impact of land remediation disturbance on soil nutrients through reasonable cultivation and management measures, and have a positive impact. Because the soil conditions in the Loess Plateau are relatively barren and the content of various nutrients is low, although the disturbance of land reclamation has a negative impact on soil nutrients, after the gully land reclamation project, more convenient tillage management measures, such as machine ploughing, are adopted to increase soil pores, ensure the uniformity of topsoil, ensure that precipitation can be smoothly infiltrated and recharged, and is conducive to the accumulation of nutrients. Therefore, fertilization measures make the content of soil nutrients such as N and P increase rapidly, and after a certain period of cultivation, it tends to be stable with factors such as crop absorption. The content of SOM showed a trend of decreasing first and then increasing gradually. Because the formation and accumulation of SOM is a slow process, it cannot be rapidly improved by chemical fertilization, so it has not returned to the level before remediation until 8a after remediation. Compared with available nutrients, its growth is long-term and lagging. Therefore, in the later tillage management, measures such as applying organic fertilizer, returning straw to the field, and planting green manure should be taken to improve SOM [26], and the balance of nutrients in the soil should be ensured by optimizing fertilization methods to promote the sustainable development of agriculture. The content of AK is relatively high, which may be related to the relatively high K in loessial soil. Therefore, the effect of fertilization and other measures on K is not significant.
4.2 Spatial and temporal variation in soil nutrients
In terms of the spatial location of nutrient content, the soil nutrient content at the gully outlet is generally higher than that in the middle of the gully and the gully head, which is consistent with the results of Wang et al. and Hu et al. [27,28]. Probably due to the transport and deposition of water, the gully outlet is usually an accumulation area of nutrients in the gully. After the gully land reclamation project, Due to the land remediation measures and later cultivation management, the CV of soil nutrients in the trench tends to become smaller with the remediation time, and the distribution of soil nutrients tends to be homogeneous, which is consistent with the results of Wang et al. [29,30]. With the increase in remediation years, the nutrient differences at different positions of the gully may be further increased due to topography, soil erosion, and other reasons [21,22]. Therefore, according to the spatial variation characteristics of soil nutrients in different positions of the gully, the spatial layout of the gully crops can be adjusted, and management measures of different degrees and methods can be implemented to improve the utilization rate of nutrient resources and increase grain yield.
4.3 Gully land advantage
Due to the reduction in cultivated land area in the Loess Plateau by returning farmland to forest, the contradiction between people and land has been caused. There has been a phenomenon of reclamation of farmland, but the rapid deterioration of soil physical and chemical properties is not a good phenomenon [31]. The gully is a water-rich area in the basin. It is very suitable for agricultural cultivation after appropriate land remediation methods, and contains rich potential cultivated land resources. Studies have shown that the grain yield of gully cultivated land in the loess hilly and gully region is much larger than that of slope cultivated land. There is a saying that “planting a mu of gully rather than planting ten mu of slope” [32]. This study showed that the soil nutrient evaluation grade was restored to the same level as that before the remediation after 4a of the gully land reclamation project. Compared with the slope of terrace project in loess area, the recovery time of soil nutrient was shorter [33]. At the same time, the soil nutrient content level is appropriate, and there is the potential to continue to improve after remediation. Therefore, compared with sloping land, gully is more suitable for the construction of cultivated land, gully land reclamation project can effectively alleviate the contradiction between food security and human land in this area, and consolidate the achievements of returning farmland to forest.
5 Conclusion
The soil nutrient content in the gully was generally low, only AK reached 1–3 levels, and the CV of each nutrient decreased after remediation, between 0.23–0.54, which is a medium degree of variation, and the soil nutrient distribution developed in the direction of homogenization.
Soil SOM content showed a “decreasing–increasing” process, reaching the highest level of 12.77 g/kg after remediation (8a); TN and AP showed a trend of increasing and then decreasing, with the content increasing by 0.22 and 4.13 g/kg, respectively, after remediation; AK decreased from 206.74 to 146.30 mg/kg, showing the process of “decreasing–increasing–decreasing.”
The soil nutrient levels are all in the moderate level, and only the gully head is reduced to the depleted level after the implementation of the project. 4a after the remediation, the soil nutrient levels recover and have the potential to continue to improve.
Acknowledgements
This research was funded by Technology Innovation Center for Land Engineering and Human Settlements, Shaanxi Land Engineering Construction Group Co., Ltd, and Xi’an Jiaotong University (2021WHZ00891).
-
Author contributions: Methodology and software: P.Z. and L.X.; formal analysis, resources and data curation, investigation, and writing – original draft preparation: P.Z.; writing – review and editing: L.X.; supervision and project administration: P.Z. and N.L. All authors have read and agreed to the published version of the manuscript.
-
Conflict of interest: Authors state no conflict of interest.
-
Data availability statement: The data are obtained through experiments, if necessary, please contact the corresponding author for the data.
References
[1] Zhu XM. Land renovation on the Loess Plateau. Soil Water Conserv Bull. 1984;4(4):1–6.Search in Google Scholar
[2] Chen YP, Luo SM, Li FM, Lin WX, Yang ZL, Wang KB. Proposals on the sustainable development of agriculture in Yan'an gully regions. J Earth Environ. 2015;6(5):265–9. 10.7515/JEE201505001.Search in Google Scholar
[3] Chen Y. Balancing green and grain trade. Nat Geosci. 2015;8(10):739–41. 10.1038/ngeo2544.Search in Google Scholar
[4] Liu YS. A feasibility study report on the major project of land reclamation in Yan'an City, Shaanxi Province. Institute of Geographical Science and Resources. Beijing, China: Chinese Academy of Sciences; 2013. p. 1–5.Search in Google Scholar
[5] Li YH, Du GM, Liu YS. Transforming the Loess Plateau of China. Front Agric Sci Eng. 2016;3(3):181–5.10.15302/J-FASE-2016110Search in Google Scholar
[6] Liao K, Lai XM, Zhou ZW, Zhu Q. Applying fractal analysis to detect spatio-temporal variability of soil moisture content on two contrasting land use hillslopes. Catena. 2017;157:163–72. 10.1016/j.catena.2017.05.022.Search in Google Scholar
[7] Han L, Li R, Zhu HL. Comprehensive evaluation model of soil nutrients based on BP neural network. Agric Mach J. 2011;42(7):109–15.Search in Google Scholar
[8] Ye YM, Wu CF. Effects of land reclamation on soil properties and its reconstruction techniques. J Zhejiang Univ (Agric Life Sci). 2002;28(3):267–71.Search in Google Scholar
[9] Xu DB, Deng JQ, Liu DB, Liu GH, Peng C, Yuan JF, et al. Nutrient spatial variability of tobacco soil restoration area and fertility suitability level evaluation. Appl Ecol. 2014;25(3):790–6. 10.13287/j.1001-9332.2013.0011 Search in Google Scholar
[10] Wu Y. Effects of land reclamation and fertilization on soil quality. Taking Ningbo Forest Farm as an Example. Zhejiang Hangzhou: Zhejiang Agriculture and Forestry University; 2017. p. 9–15.Search in Google Scholar
[11] Hua Y, Wang ZF, Gao M, Qiao L, Zhang H, Deng W, et al. Effects of land reclamation on soil available trace elements. J Soil Water Conserv. 2014;28(5):253–7. 10.13870/j.cnki.stbcxb.2014.05.044.Search in Google Scholar
[12] Wang P, Duan XX, Zhao Y. Evaluation of soil quality of new cultivated land in gully control: Baota District of Yan'an as an example. West Dev (Land Dev Eng Res). 2019;4(1):45–9.Search in Google Scholar
[13] Fu W, Yong CX, Ma DH. Effects of gully land reclamation on soil rapid fertilization in loess hilly and gully region. Trans CSAE. 2019;35(21):252–61.Search in Google Scholar
[14] Chen SM, Jin Z, Zhang J. Present situation and influencing factors of land salinization in different channels in northern Shaanxi. J Earth Environ. 2020;11(1):81–9.Search in Google Scholar
[15] Chen Z, Wang L, We A, Gao J, Lu Y, Zhou J. Land-use change from arable lands to orchards reduced soil erosion and increased nutrient loss in a small catchment. Sci Total Environ. 2019;648:1097–104. 10.1016/j.scitotenv.2018.08.141.Search in Google Scholar PubMed
[16] Jing YR, Lu KX, Li P, Wang Q, Gao HD. Soil nutrient evaluation of small watersheds in loess areas of Gansu Province. Chin J Soil Sci. 2015;46(1):121–6.Search in Google Scholar
[17] Zhang ZQ, Jiao JY, Chen TD, Chen YL, Lin H, Xu Q, et al. Soil nutrient evaluation of alluvial fan in the middle and lower reaches of Lhasa River Basin. J Plant Nutr Fertil. 2022;28(11):2082–96.Search in Google Scholar
[18] Onyejekwe S, Kang X, Ge L. Evaluation of the scale of fluctuation of geotechnical parameters by autocorrelation function and semivariogram function. Eng Geol. 2016;214:43–9. 10.1016/j.enggeo.2016.09.014.Search in Google Scholar
[19] Tang J, Zhao FQ, Lin NF. Application of multiple model integration methods in soil nutrient evaluation. J Northeast Norm Univ (Nat Sci Ed). 2005;37(1):109–12.Search in Google Scholar
[20] Saaty TL. The analytic hierarchy process. New York, NY: McGraw-Hill International; 1980.10.21236/ADA214804Search in Google Scholar
[21] Yang JH, Liu MY, Zhang J, Zhang MM, Cao RS, Cao XY. Spatial variability characteristics of soil nutrients in small watersheds of the Loess Plateau gully area and its influencing factors. J Nat Resour. 2020;35(3):743–54.10.31497/zrzyxb.20200318Search in Google Scholar
[22] Hao LT, Wu FQ. Characteristics and evolution of soil nutrients in dam land and terraced fields in the loess hilly and gully region. Soil Water Conserv Bull. 2019;39(5):16–22.Search in Google Scholar
[23] Zhang WW, Li XJ, Chen LL. Soil quality evaluation of plain land reclamation project area in Tai'an City. J Agric Eng. 2008;24(7):106–9.Search in Google Scholar
[24] Xu C, Gao M, Xie DT. Effects of land reclamation years on soil quality in purple hilly region. Agric Eng. 2009;25(8):242–8.Search in Google Scholar
[25] Zhang L, Han JC, Ma ZH. Soil characteristics of hollow villages with different reclamation years in hilly areas after remediation. J Soil Water Conserv. 2015;29(5):176–80.Search in Google Scholar
[26] Dong B, Zhang DW, Guo TW. Effects of long-term fertilization on soil organic carbon and microbial biomass carbon. Soil Bull. 2012;43(6):193–8.Search in Google Scholar
[27] Wang J, Dong QG, Zhang L, Bai JQ. Change characteristics and evaluation of soil nutrient of gully cultivated land in Loess hilly and gully region. Bull Soil Land Water Conserv. 2020;40(6):64–70, 77.Search in Google Scholar
[28] Hu Y, Zhang L, Liu JB. Distribution characteristics of soil nutrients in Loess Hilly and Gully Area. J Irrig Drain. 2018;37(S2):85–8.Search in Google Scholar
[29] Wang AL, Zhao GX, Wang QF. Effects of land reclamation on soil physical and chemical properties in hilly area. J Agric Eng. 2011;27(9):311–5.Search in Google Scholar
[30] Wang HT, Jin JY, Wang B. Study on spatial variability of soil available nutrients. J Plant Nutr Fertil. 2004;10(4):349–54.Search in Google Scholar
[31] Xiao B, Wang QH, Li C. Effects of land reclamation on soil physical and chemical properties and spatial variability. J Northwest A & F Univ (Nat Sci Ed). 2011;39(7):185–92.Search in Google Scholar
[32] Liu YS, Li YR. Principles and design techniques of gully land remediation engineering in Loess hilly and gully region. J Agric Eng. 2017;33(10):1–9.Search in Google Scholar
[33] Xue L. Soil quality effect after terracing in hilly area of Loess Plateau. J Agric Eng. 2011;27(4):310–6.Search in Google Scholar
© 2023 the author(s), published by De Gruyter
This work is licensed under the Creative Commons Attribution 4.0 International License.
Articles in the same Issue
- Regular Articles
- Diagenesis and evolution of deep tight reservoirs: A case study of the fourth member of Shahejie Formation (cg: 50.4-42 Ma) in Bozhong Sag
- Petrography and mineralogy of the Oligocene flysch in Ionian Zone, Albania: Implications for the evolution of sediment provenance and paleoenvironment
- Biostratigraphy of the Late Campanian–Maastrichtian of the Duwi Basin, Red Sea, Egypt
- Structural deformation and its implication for hydrocarbon accumulation in the Wuxia fault belt, northwestern Junggar basin, China
- Carbonate texture identification using multi-layer perceptron neural network
- Metallogenic model of the Hongqiling Cu–Ni sulfide intrusions, Central Asian Orogenic Belt: Insight from long-period magnetotellurics
- Assessments of recent Global Geopotential Models based on GPS/levelling and gravity data along coastal zones of Egypt
- Accuracy assessment and improvement of SRTM, ASTER, FABDEM, and MERIT DEMs by polynomial and optimization algorithm: A case study (Khuzestan Province, Iran)
- Uncertainty assessment of 3D geological models based on spatial diffusion and merging model
- Evaluation of dynamic behavior of varved clays from the Warsaw ice-dammed lake, Poland
- Impact of AMSU-A and MHS radiances assimilation on Typhoon Megi (2016) forecasting
- Contribution to the building of a weather information service for solar panel cleaning operations at Diass plant (Senegal, Western Sahel)
- Measuring spatiotemporal accessibility to healthcare with multimodal transport modes in the dynamic traffic environment
- Mathematical model for conversion of groundwater flow from confined to unconfined aquifers with power law processes
- NSP variation on SWAT with high-resolution data: A case study
- Reconstruction of paleoglacial equilibrium-line altitudes during the Last Glacial Maximum in the Diancang Massif, Northwest Yunnan Province, China
- A prediction model for Xiangyang Neolithic sites based on a random forest algorithm
- Determining the long-term impact area of coastal thermal discharge based on a harmonic model of sea surface temperature
- Origin of block accumulations based on the near-surface geophysics
- Investigating the limestone quarries as geoheritage sites: Case of Mardin ancient quarry
- Population genetics and pedigree geography of Trionychia japonica in the four mountains of Henan Province and the Taihang Mountains
- Performance audit evaluation of marine development projects based on SPA and BP neural network model
- Study on the Early Cretaceous fluvial-desert sedimentary paleogeography in the Northwest of Ordos Basin
- Detecting window line using an improved stacked hourglass network based on new real-world building façade dataset
- Automated identification and mapping of geological folds in cross sections
- Silicate and carbonate mixed shelf formation and its controlling factors, a case study from the Cambrian Canglangpu formation in Sichuan basin, China
- Ground penetrating radar and magnetic gradient distribution approach for subsurface investigation of solution pipes in post-glacial settings
- Research on pore structures of fine-grained carbonate reservoirs and their influence on waterflood development
- Risk assessment of rain-induced debris flow in the lower reaches of Yajiang River based on GIS and CF coupling models
- Multifractal analysis of temporal and spatial characteristics of earthquakes in Eurasian seismic belt
- Surface deformation and damage of 2022 (M 6.8) Luding earthquake in China and its tectonic implications
- Differential analysis of landscape patterns of land cover products in tropical marine climate zones – A case study in Malaysia
- DEM-based analysis of tectonic geomorphologic characteristics and tectonic activity intensity of the Dabanghe River Basin in South China Karst
- Distribution, pollution levels, and health risk assessment of heavy metals in groundwater in the main pepper production area of China
- Study on soil quality effect of reconstructing by Pisha sandstone and sand soil
- Understanding the characteristics of loess strata and quaternary climate changes in Luochuan, Shaanxi Province, China, through core analysis
- Dynamic variation of groundwater level and its influencing factors in typical oasis irrigated areas in Northwest China
- Creating digital maps for geotechnical characteristics of soil based on GIS technology and remote sensing
- Changes in the course of constant loading consolidation in soil with modeled granulometric composition contaminated with petroleum substances
- Correlation between the deformation of mineral crystal structures and fault activity: A case study of the Yingxiu-Beichuan fault and the Milin fault
- Cognitive characteristics of the Qiang religious culture and its influencing factors in Southwest China
- Spatiotemporal variation characteristics analysis of infrastructure iron stock in China based on nighttime light data
- Interpretation of aeromagnetic and remote sensing data of Auchi and Idah sheets of the Benin-arm Anambra basin: Implication of mineral resources
- Building element recognition with MTL-AINet considering view perspectives
- Characteristics of the present crustal deformation in the Tibetan Plateau and its relationship with strong earthquakes
- Influence of fractures in tight sandstone oil reservoir on hydrocarbon accumulation: A case study of Yanchang Formation in southeastern Ordos Basin
- Nutrient assessment and land reclamation in the Loess hills and Gulch region in the context of gully control
- Handling imbalanced data in supervised machine learning for lithological mapping using remote sensing and airborne geophysical data
- Spatial variation of soil nutrients and evaluation of cultivated land quality based on field scale
- Lignin analysis of sediments from around 2,000 to 1,000 years ago (Jiulong River estuary, southeast China)
- Assessing OpenStreetMap roads fitness-for-use for disaster risk assessment in developing countries: The case of Burundi
- Transforming text into knowledge graph: Extracting and structuring information from spatial development plans
- A symmetrical exponential model of soil temperature in temperate steppe regions of China
- A landslide susceptibility assessment method based on auto-encoder improved deep belief network
- Numerical simulation analysis of ecological monitoring of small reservoir dam based on maximum entropy algorithm
- Morphometry of the cold-climate Bory Stobrawskie Dune Field (SW Poland): Evidence for multi-phase Lateglacial aeolian activity within the European Sand Belt
- Adopting a new approach for finding missing people using GIS techniques: A case study in Saudi Arabia’s desert area
- Geological earthquake simulations generated by kinematic heterogeneous energy-based method: Self-arrested ruptures and asperity criterion
- Semi-automated classification of layered rock slopes using digital elevation model and geological map
- Geochemical characteristics of arc fractionated I-type granitoids of eastern Tak Batholith, Thailand
- Lithology classification of igneous rocks using C-band and L-band dual-polarization SAR data
- Analysis of artificial intelligence approaches to predict the wall deflection induced by deep excavation
- Evaluation of the current in situ stress in the middle Permian Maokou Formation in the Longnüsi area of the central Sichuan Basin, China
- Utilizing microresistivity image logs to recognize conglomeratic channel architectural elements of Baikouquan Formation in slope of Mahu Sag
- Resistivity cutoff of low-resistivity and low-contrast pays in sandstone reservoirs from conventional well logs: A case of Paleogene Enping Formation in A-Oilfield, Pearl River Mouth Basin, South China Sea
- Examining the evacuation routes of the sister village program by using the ant colony optimization algorithm
- Spatial objects classification using machine learning and spatial walk algorithm
- Study on the stabilization mechanism of aeolian sandy soil formation by adding a natural soft rock
- Bump feature detection of the road surface based on the Bi-LSTM
- The origin and evolution of the ore-forming fluids at the Manondo-Choma gold prospect, Kirk range, southern Malawi
- A retrieval model of surface geochemistry composition based on remotely sensed data
- Exploring the spatial dynamics of cultural facilities based on multi-source data: A case study of Nanjing’s art institutions
- Study of pore-throat structure characteristics and fluid mobility of Chang 7 tight sandstone reservoir in Jiyuan area, Ordos Basin
- Study of fracturing fluid re-discharge based on percolation experiments and sampling tests – An example of Fuling shale gas Jiangdong block, China
- Impacts of marine cloud brightening scheme on climatic extremes in the Tibetan Plateau
- Ecological protection on the West Coast of Taiwan Strait under economic zone construction: A case study of land use in Yueqing
- The time-dependent deformation and damage constitutive model of rock based on dynamic disturbance tests
- Evaluation of spatial form of rural ecological landscape and vulnerability of water ecological environment based on analytic hierarchy process
- Fingerprint of magma mixture in the leucogranites: Spectroscopic and petrochemical approach, Kalebalta-Central Anatolia, Türkiye
- Principles of self-calibration and visual effects for digital camera distortion
- UAV-based doline mapping in Brazilian karst: A cave heritage protection reconnaissance
- Evaluation and low carbon ecological urban–rural planning and construction based on energy planning mechanism
- Modified non-local means: A novel denoising approach to process gravity field data
- A novel travel route planning method based on an ant colony optimization algorithm
- Effect of time-variant NDVI on landside susceptibility: A case study in Quang Ngai province, Vietnam
- Regional tectonic uplift indicated by geomorphological parameters in the Bahe River Basin, central China
- Computer information technology-based green excavation of tunnels in complex strata and technical decision of deformation control
- Spatial evolution of coastal environmental enterprises: An exploration of driving factors in Jiangsu Province
- A comparative assessment and geospatial simulation of three hydrological models in urban basins
- Aquaculture industry under the blue transformation in Jiangsu, China: Structure evolution and spatial agglomeration
- Quantitative and qualitative interpretation of community partitions by map overlaying and calculating the distribution of related geographical features
- Numerical investigation of gravity-grouted soil-nail pullout capacity in sand
- Analysis of heavy pollution weather in Shenyang City and numerical simulation of main pollutants
- Road cut slope stability analysis for static and dynamic (pseudo-static analysis) loading conditions
- Forest biomass assessment combining field inventorying and remote sensing data
- Late Jurassic Haobugao granites from the southern Great Xing’an Range, NE China: Implications for postcollision extension of the Mongol–Okhotsk Ocean
- Petrogenesis of the Sukadana Basalt based on petrology and whole rock geochemistry, Lampung, Indonesia: Geodynamic significances
- Numerical study on the group wall effect of nodular diaphragm wall foundation in high-rise buildings
- Water resources utilization and tourism environment assessment based on water footprint
- Geochemical evaluation of the carbonaceous shale associated with the Permian Mikambeni Formation of the Tuli Basin for potential gas generation, South Africa
- Detection and characterization of lineaments using gravity data in the south-west Cameroon zone: Hydrogeological implications
- Study on spatial pattern of tourism landscape resources in county cities of Yangtze River Economic Belt
- The effect of weathering on drillability of dolomites
- Noise masking of near-surface scattering (heterogeneities) on subsurface seismic reflectivity
- Query optimization-oriented lateral expansion method of distributed geological borehole database
- Petrogenesis of the Morobe Granodiorite and their shoshonitic mafic microgranular enclaves in Maramuni arc, Papua New Guinea
- Environmental health risk assessment of urban water sources based on fuzzy set theory
- Spatial distribution of urban basic education resources in Shanghai: Accessibility and supply-demand matching evaluation
- Spatiotemporal changes in land use and residential satisfaction in the Huai River-Gaoyou Lake Rim area
- Walkaway vertical seismic profiling first-arrival traveltime tomography with velocity structure constraints
- Study on the evaluation system and risk factor traceability of receiving water body
- Predicting copper-polymetallic deposits in Kalatag using the weight of evidence model and novel data sources
- Temporal dynamics of green urban areas in Romania. A comparison between spatial and statistical data
- Passenger flow forecast of tourist attraction based on MACBL in LBS big data environment
- Varying particle size selectivity of soil erosion along a cultivated catena
- Relationship between annual soil erosion and surface runoff in Wadi Hanifa sub-basins
- Influence of nappe structure on the Carboniferous volcanic reservoir in the middle of the Hongche Fault Zone, Junggar Basin, China
- Dynamic analysis of MSE wall subjected to surface vibration loading
- Pre-collisional architecture of the European distal margin: Inferences from the high-pressure continental units of central Corsica (France)
- The interrelation of natural diversity with tourism in Kosovo
- Assessment of geosites as a basis for geotourism development: A case study of the Toplica District, Serbia
- IG-YOLOv5-based underwater biological recognition and detection for marine protection
- Monitoring drought dynamics using remote sensing-based combined drought index in Ergene Basin, Türkiye
- Review Articles
- The actual state of the geodetic and cartographic resources and legislation in Poland
- Evaluation studies of the new mining projects
- Comparison and significance of grain size parameters of the Menyuan loess calculated using different methods
- Scientometric analysis of flood forecasting for Asia region and discussion on machine learning methods
- Rainfall-induced transportation embankment failure: A review
- Rapid Communication
- Branch fault discovered in Tangshan fault zone on the Kaiping-Guye boundary, North China
- Technical Note
- Introducing an intelligent multi-level retrieval method for mineral resource potential evaluation result data
- Erratum
- Erratum to “Forest cover assessment using remote-sensing techniques in Crete Island, Greece”
- Addendum
- The relationship between heat flow and seismicity in global tectonically active zones
- Commentary
- Improved entropy weight methods and their comparisons in evaluating the high-quality development of Qinghai, China
- Special Issue: Geoethics 2022 - Part II
- Loess and geotourism potential of the Braničevo District (NE Serbia): From overexploitation to paleoclimate interpretation