Seismotectonics of Malatya Fault, Eastern Turkey
-
Diğdem Acarel
 ,
Musavver Didem Cambaz
,
Fatih Turhan
,
Musavver Didem Cambaz
,
Fatih Turhan

Abstract
Turkey is located in a seismically active region with a complex tectonic history. In order to perform seismic risk assessment precisely, major fault zones (North Anatolian Fault Zone and East Anatolian Fault Zone) that are well defined are monitored continuously. It is a widely known fact that intraplate settings, such as Anatolian Plate, in which devastating earthquakes may occur, need to be observed densely. In this study, we investigate the seismotectonics of Malatya Fault within the Malatya Ovacık Fault Zone (MOFZ), which is one of the major agents responsible for internal deformation acting on Anatolian Plate. Recent geological and paleoseismological studies underline the necessity of comprehending the seismicity and latency of a major earthquake in this fault zone.We applied traditional techniques to investigate data of such a region. Earthquakes that occured in the vicinity of Malatya Fault between the years 2011 and mid-2019 are employed in a detailed analysis. The results of this study are constrained by the distribution of sensor networks in the region, yet allowing to define an active structure which is not included in the active fault map of Turkey, therefore, making a significant contribution to seismic hazard estimation.
1 Introduction
Precise assessment of seismic risk requires not only the understanding of kinematics and structure of major plate boundary zones but intraplate deformation zones as well. In intraplate settings, rate of strain accumulation is relatively low and the associated fault rupture occurs over longer recurrence intervals (e.g. several hundreds to thousands of years; [1, 2]) than moderate or large earthquakes occurring on plate boundaries. However, the abrupt release of accumulated stress over years may lead to destructive earthquakes (e.g.Mexico, Bulnay [3, 4]).Moreover, major plate boundary zones are monitored by quite dense sensor networks (seismic, GPS-Global Positioning Systems-and strong motion), whereas intraplate settings, like the region of interest in this study, attract less attention even though they possess a high seismic risk.
Eastern Mediterranean is an unprecedented region with intriguing tectonic processes taking place: a continental collision between stable Eurasia and northward migrating Arabian Plate along Bitlis-Zagros-Suture Zone, another collision between stable Eurasia and Nubian Plate along Hellenic-Cyprus Arc and the lateral escape of Anatolian Plate as a consequence. To compensate these motions, Anatolian plate is accommodated by two main plate boundaries; dextral strike-slip North Anatolian Fault Zone (NAFZ), sinistral strike-slip East Anatolian Fault Zone (EAFZ) (Figure 1a). Both fault zones are mapped during the 20th century and studied extensively since then [5, 6, 7, 8, 9, 10, 11, 12, 13]. Many devastating earthquakes occurred on these faults resulting in several numbers of causalities and damage. In Figure 1b, seismicity between years 1900-2019 in a greater area, can be seen. Main target region of this study, the Malatya Fault, is located to the west of EAFZ covering east of the Anatolian Plate. According to studies based on geodetic sensors, Anatolian Plate moves westward with an insignificant amount of internal deformation -less than 2mm/year- [14, 15, 16, 17] whereas geological studies and seismic activity suggest the opposite, that Anatolian Plate accommodates a considerable amount of deformation [18, 19, 20, 21, 22, 23, 24, 25, 26]. The eastern half of the Anatolian Plate is dominated by several active, dextral to sinistral strike-slip faults and related pull-apart basins [15]. Several studies exist in order to identify seismic hazard related to the intraplate deformation in eastern Anatolian Plate, however, studies related to Malatya Ovacık Fault Zone is limited to mainly geological, morphochronological and paleoseismological studies [17, 27, 28, 29].
![Figure 1 a) Tectonic map of the study area. Main fault zones in the region are; NAFZ: North Anatolian Fault Zone, EAFZ: East Anatolian Fault Zone, CAFZ: Central Anatolian Fault Zone, MOFZ: Malatya Ovacık Fault Zone. Blue inverted triangles represent seismic sensors and blue squares represent strong motion sensors operated by AFAD. Seismic sensors operated by KOERI are shown as green triangles [35]. Black lines represent the active faults [30]. b) Seismicity map of the study area. Earthquakes with magnitude above 3.0, between the years 1900 and 2019 are plotted. (Data provided from KOERI).](/document/doi/10.1515/geo-2019-0085/asset/graphic/j_geo-2019-0085_fig_001.jpg)
a) Tectonic map of the study area. Main fault zones in the region are; NAFZ: North Anatolian Fault Zone, EAFZ: East Anatolian Fault Zone, CAFZ: Central Anatolian Fault Zone, MOFZ: Malatya Ovacık Fault Zone. Blue inverted triangles represent seismic sensors and blue squares represent strong motion sensors operated by AFAD. Seismic sensors operated by KOERI are shown as green triangles [35]. Black lines represent the active faults [30]. b) Seismicity map of the study area. Earthquakes with magnitude above 3.0, between the years 1900 and 2019 are plotted. (Data provided from KOERI).
The 275 km long NE striking sinistral Malatya Ovacık Fault Zone (MOFZ) is one of the most important structures in Anatolian Plate since it is responsible for the initiation and deformation within the intraplate [27, 28, 29]. The northern branch, Ovacık Fault (OF) starts from Erzincan Basin and extends to Arapgir (Malatya) of about 110 km. It branches into several segments. The southern branch, NE striking, approx. 165 km-long Malatya Fault starts from Adatepe forming a junction with OF and terminates at Doğanşehir (Figure 1a). Malatya Fault is described in three segments in [30], namely Akçadağ, Arguvan and Doğanşehir segments, whereas [29] defined Malatya Fault in five segments, naming FS1 to FS5. Several authors [28, 29], suggest that Malatya Fault is an active fault partly accommodating the intraplate deformation of Anatolia on the contrary to the hypotheses of Malatya Fault being inactive since mid-Pliocene [31, 32]. According to recent paleoseismological studies, the average earthquake interval on Malatya Fault is 2275 ± 605 years and it may produce a M7.4 earthquake following the empirical equations of [28, 33]. Moreover, another study on the seismic potential of Malatya Fault reports that the fault passes through Quaternary units in some of parts of Akçadağ Segment; and thus, is capable to produce large earthquakes [34].
In this study, we analyze datasets obtained from seismic and strong motion sensor networks in order to identify the seismotectonics of Malatya Fault (MF). We estimate a 1-D crustal velocity model for the region. We have improved accuracy of earthquake hypocenter locations by merging data from two local networks and using all possible sensors in the region. Hypocenter locations of low-magnitude-earthquakes cannot be determined due to limitations in station distribution, therefore our results are constrained. Nevertheless, obtained focal mechanisms and stress directions are in good agreement with the tectonics of region. Moreover, we identify an active morphological component, which is not present in the active fault map of Turkey. Thus, this study has a significant contribution to the seismic hazard assessment of a region prone to large earthquakes.
2 Data
Turkey, a region exhibiting an intense seismic activity (Figure 1b), is continuously monitored with seismic, geodetic and strong motions sensors. Several M+7 earthquakes occurred in the region; therefore, a dense sensor network is necessary to investigate such a complex and seismically active landscape in order to better understand active tectonics.Moreover, precisely determined earthquake parameters are important not only for understanding the seismicity and seismotectonics of a region but also for providing an accurate estimation of seismic hazard and risk parameters. Local agencies; Kandilli Observatory and Earthquake Research Institute (KOERI) [35] and Disaster and Emergency Management Authority Presidential of Earthquake Department (AFAD) operate seismic and strong motion sensor networks (Figure 1a). Both agencies are utilizing similar type of seismic sensors mostly recording at 100 sps. In this study, we employ seismic and strong motion sensors mainly located in eastern Turkey. A total number of 123 stations are included in earthquake hypocenter determination. Even though the sensor networks seem to be robust, due to low signal to ratio waveforms or GPS clock errors, some stations are not employed in the analysis.
3 Estimation of crustal velocity of the region and surroundings
In order to determine a minimum 1-D crustal velocity model for the study area, an earthquake catalog is constructed. By merging the earthquake catalogs of KOERI and AFAD between 2008-2018, approximately 1000 earthquakes have been compiled and revised for this study in the region (37.10∘–39.10∘ E, 37.30∘–39.10∘ N). Merged catalogs are revised and relocated by using the earthquake location code HYPOCENTER [36].
A minimum 1-D velocity model can be defined as the velocity model that produces the smallest possible uniform error for the set of events with well-constrained locations [37]. For the identification of an optimum 1-D velocity model, a widely acknowledged software package VELEST code [38, 39] is used. The method simultaneously inverts P and S wave travel times for a 1-D velocity model, station delays and hypocenters of earthquakes. Simply, it solves the forward problem by tracing direct reflected and refracted rays from source to receiver and then uses the standard damped least squares in order to solve the inverse problem [37].
Generally, events are selected according to the following criteria;
The number of P and S phases should be more than 8 with at least one S phase,
The azimuthal gap should be less than 180∘,
• The RMS residual should be less than 0.5,
The distance to nearest station is less than one focal depth.
After eliminating the earthquakes according to the given criteria, 495 earthquakes are selected for inversion. In the computation of final velocity model, nine iterations performed for each test by trying 100 different initial models. We also test a number of different starting 1-D velocity models [40, 41]. Out of several iterations, using different initial velocity models, a final velocity model chosen with the minimum rms value reduced to 0.35 (Table 1).
Final 1-D P-wave velocity model obtained for the study area.
| Depth (km) | VP (km/s) | VS (km/s) |
|---|---|---|
| 0.0 | 4.85 | 2.78 |
| 2.0 | 5.72 | 3.28 |
| 8.0 | 5.77 | 3.31 |
| 12.0 | 5.84 | 3.36 |
| 16.0 | 6.08 | 3.52 |
| 20.0 | 6.19 | 3.57 |
| 24.0 | 6.28 | 3.61 |
| 28.0 | 6.40 | 3.68 |
| 32.0 | 7.40 | 4.18 |
| 34.0 | 7.55 | 4.34 |
| 38.0 | 7.84 | 4.38 |
| 42.0 | 7.95 | 4.52 |
4 Earthquake Hypocenter Determination
Precise hypocenter locations of earthquakes are essential in understanding the tectonic regime in a region. In this study, waveforms recorded on both seismic and strong motion sensors operated by two local networks; KOERI and AFAD are taken into account. P- and S-wave arrival times of a dataset of 146 events are re-picked manually. At this stage, re-picking of data is performed by one experienced person in order to provide consistency. We included a re-picked data set of events with minimum 40 P-wave (1/3 ratio S-wave) observations per event. Integrating different kinds of sensors from two different local networks significantly reduced the azimuthal gap to 20-40 degrees, which is an important parameter to provide accuracy. Even though the azimuthal gap is ensured to be as low as possible to obtain accurate hypocenter locations, still another important parameter, focal depth, needs to be constrained. Several rules of thumb exist to obtain reliable depth estimates. At least one P-wave phase is required at a station within a close proximity of the source, approximately 1.5 times the focal depth. In this study, the minimum distance between the source and station-a P-wave phase can be picked- is approximately 20 km, which is one broadband seismic sensor. For the rest of the sensors, minimum distance to source is 50 km. To determine hypocenter locations, we applied NonLinLoc (Non Linear Localization), which is an absolute probabilistic localization algorithm [42]. This algorithm follows the probabilistic inversion approach defined by [43], and the earthquake location methods of [44, 45]. Detailed information on NonLin-Loc can be found in [42].
As it can be seen in Figure 2, merging data of seismic and strong motion sensors from two networks, significantly improved the hypocenter locations and the depth resolution. Improved seismic activity focuses along Malatya Fault (MF), mainly the southern portion of MF, around Kızık Basin and near Hekimhan.
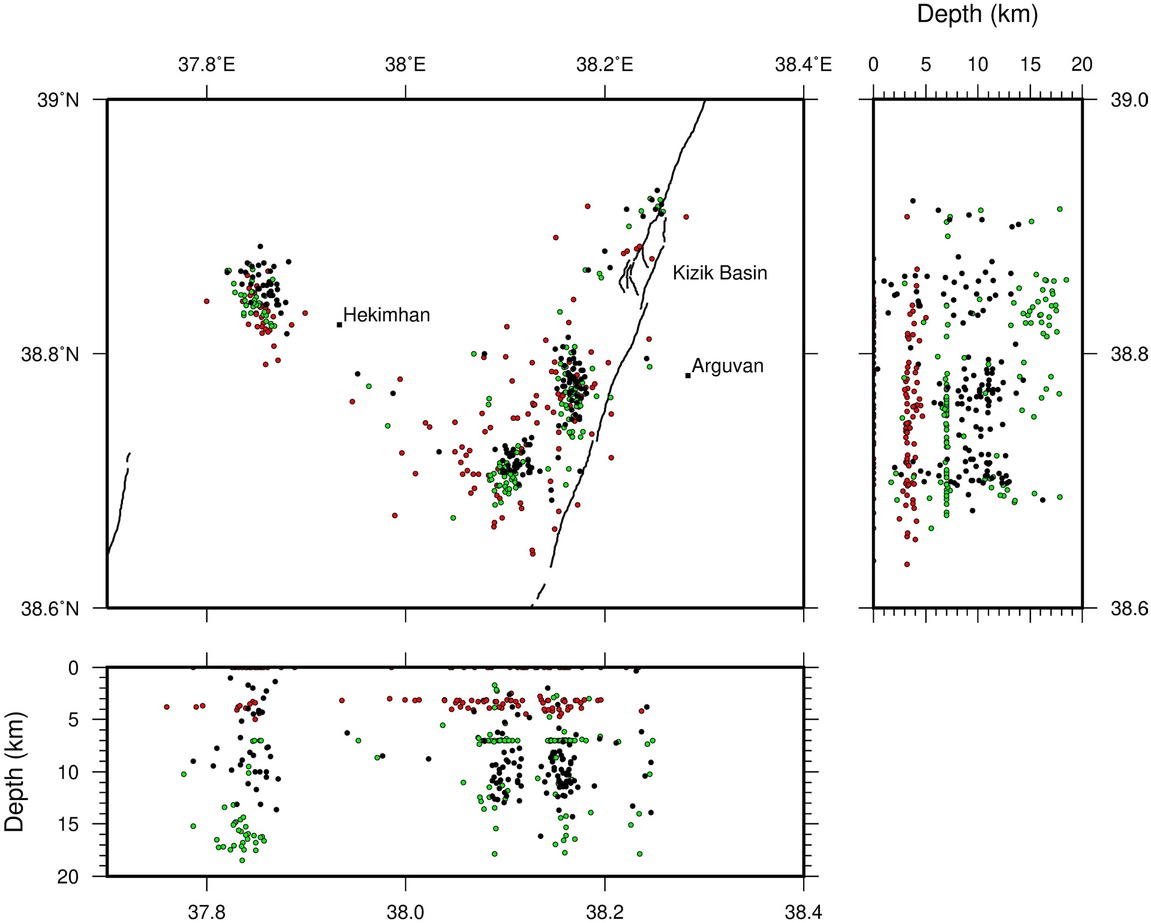
Earthquake hypocenter locations and depth cross-sections. Green dots represent hypocenter locations from AFAD catalog, red dots represent hypocenter locations from KOERI catalog. Black dots represent the hypocenter locations re-located by combining the entire data from KOERI and AFAD seismic networks.
5 Determination of Focal Mechanisms
Focal mechanism solutions are determined using a merged dataset of waveforms from AFAD and KOERI networks. The number of earthquakes employed at this stage reduced significantly due to low signal to noise ratio of waveforms and limitations of station distribution. Waveform data for 57 earthquakes (M>3.2) are selected. Focal mechanisms are calculated by using an exhaustively tested and widely used ISOLA software package [46, 47, 48]. This technique utilizes an iterative deconvolution inversion [49] to solve for the best single- or multiple-point source representation of each earthquake. Moment tensors are estimated by a least-squares minimization of mis-fits between observed and synthetic waveforms; subevent positions and relative times are calculated through grid search [47]. In order to represent a full wavefield at regional and local distances, Green’s functions are calculated using the discrete wavenumber method of [50] and [51]. Employing an accurate velocity model in computation of the Green’s function plays a crucial role in inversion process. Significance of velocity model and the corresponding variations are analyzed in several studies [52, 53, 54, 55]. Hence, our first step was to compute a site-specific model for the target region (Section 2, Table 1). Green’s functions are estimated utilizing this local velocity model.
In Figure 3a,Moment Tensor (MT) solution of the M4.9 Hekimhan-Malatya earthquake and in Figure 3b observed versus synthetic waveforms can be seen.Waveform data of 17 stations from AFAD and KOERI network are merged in order to improve station distribution. Presented results exhibit a variance reduction of 0.91 and a consistent shallow depth at 6.7 km (hypocentral depth) and 10.0 km (centroid depth).
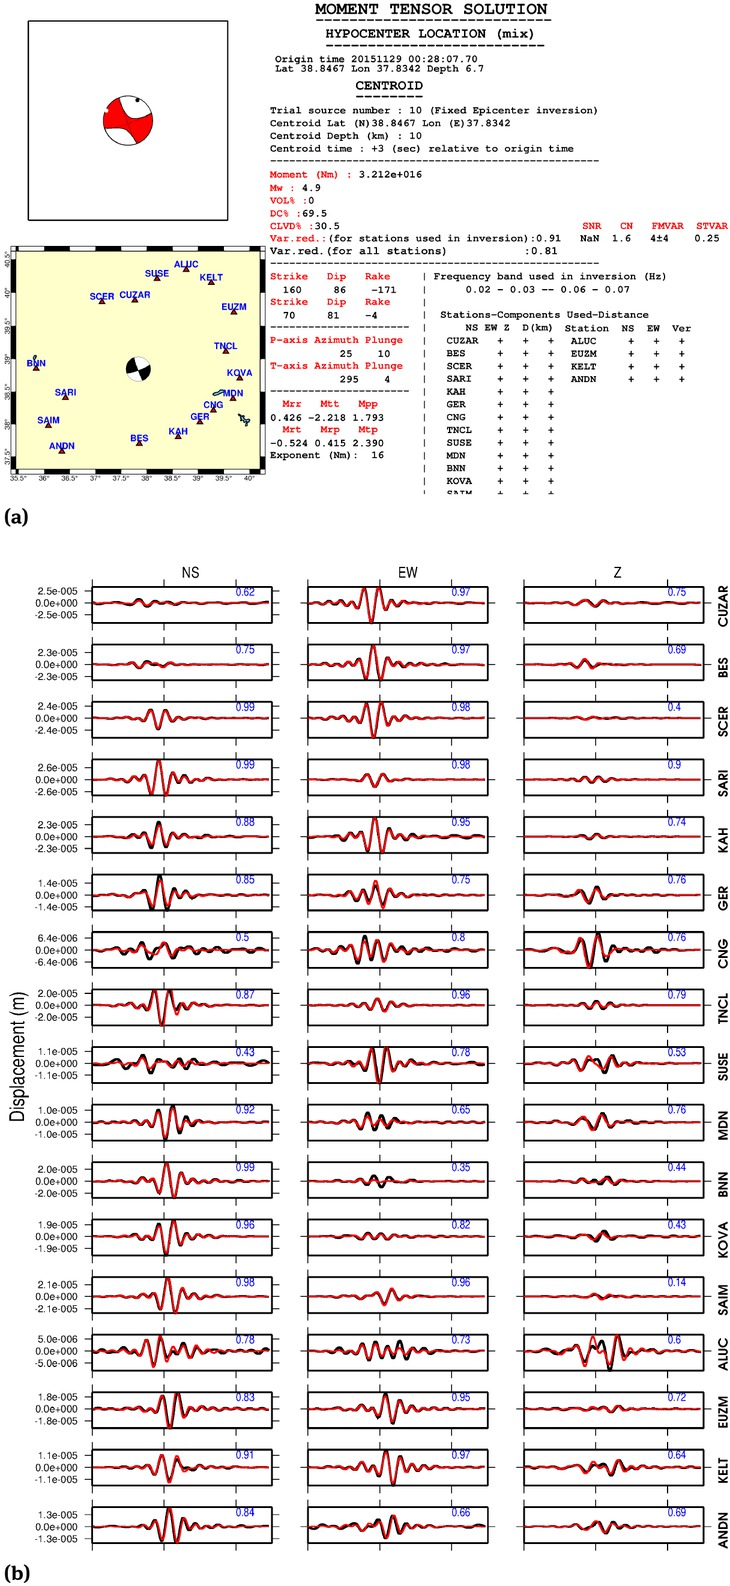
a) Moment Tensor Solutions of the M4.9 Hekimhan-Malatya earthquake and b) the observed versus synthetic waveform fits.
MT solutions obtained for the target region are presented in Figure 4 (Appendix A). Moreover, the results are plotted as a ternary diagram [56]. In Figure 5, the distribution of computed focal mechanisms can be seen in a triangular representation. At the vertices of the triangle, mechanisms with vertical T, P and B axes are plotted for thrust, normal and strike-slip faulting, respectively.
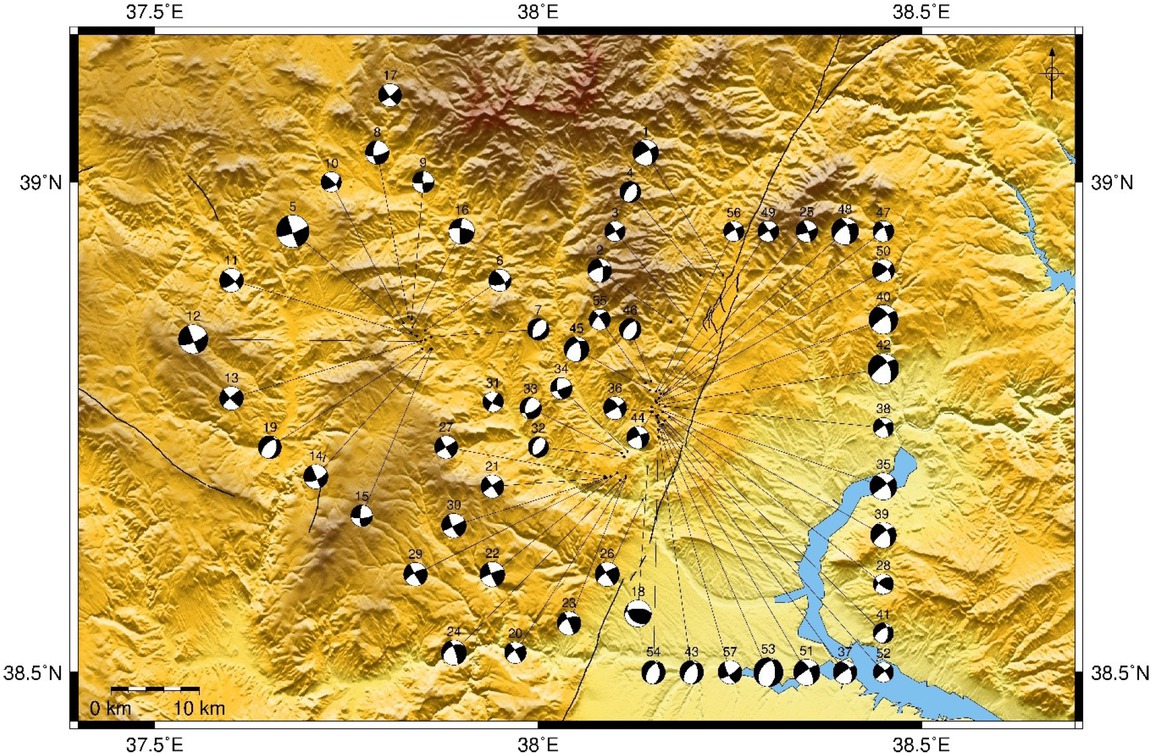
Focal mechanisms of 57 earthquakes.
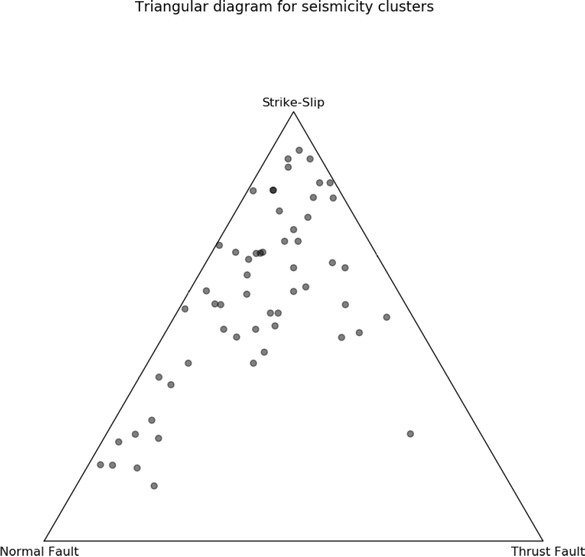
Ternary diagram, a graphical representation of focal mechanism orientations. The vertices of the triangle represent mechanisms with vertical T, P and B axes. Focal mechanism solutions obtained in this study cluster around strike-slip and normal faulting.
6 Stress Inversion Analysis
To provide a more reliable determination of the direction of released stress during the earthquake, we applied a stress inversion method by using focal mechanism solutions obtained in the previous section. The most frequently used technique is defined by [57]. This method determines the orientation of three principle stress axes and aims to find the best fit between the stress tensor and observed focal mechanisms. In this linear inversion method, nodal plane knowledge is not required. This approach performs a bootstrap re-sampling to choose fault plane randomly from nodal planes. The method assumes a uniform and invariant stress field in space and time, and slip occurs in the direction of maximum shear stress [58]. In this study, Michael’s method is preferred due to its appropriate estimate of the uncertainty and accuracy of results even with low signal to noise ratio data.
The MT solutions are inverted to obtain the principal stress directions and shape ratio. A STRESSINVERSE code by [59] is used to analyze the statistical properties of focal mechanisms with respect to tectonic stress and failure conditions. The iterative stress inversion based on Michael’s method [57] can be easily implemented with this code [59]. Stress inversion results are represented by three principal stress axes; a "o" for σ1, a “x” symbol for σ2, and a “+” symbol for σ3 (Figure 7a). The pressure (P) and tension (T) axes are well clustered (Figure 7b). The azimuth angle is measured from north and the plunge angle from the horizontal plane. The shape ratio (or stress magnitude ratio) (R) is 0.24 and describes the relative magnitudes of the principal stresses, (R = (σ1−σ2)/(σ1−σ3)) [60] (Figure 5). Inversion is performed in an iterative mode, by using grid search through the principal stress and with friction ranging from 0.4 to 1, in 0.05 increments. Accuracy of the stress inversion depends on the number of focal mechanisms and signal to noise ratio of data.
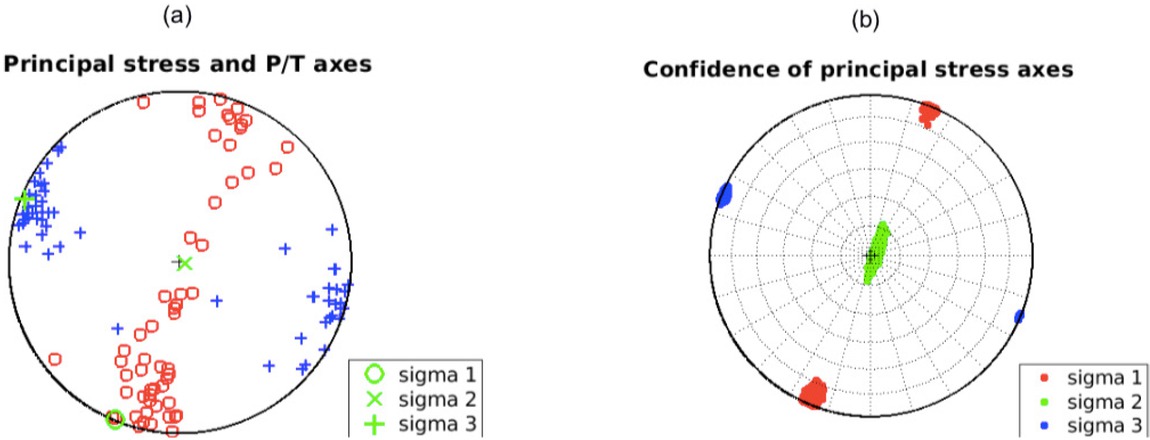
Stress inversion solutions. (a) Distribution of P-T axes orientations of individual nodal planes, (b) P and T axes shown in stereographic projection.
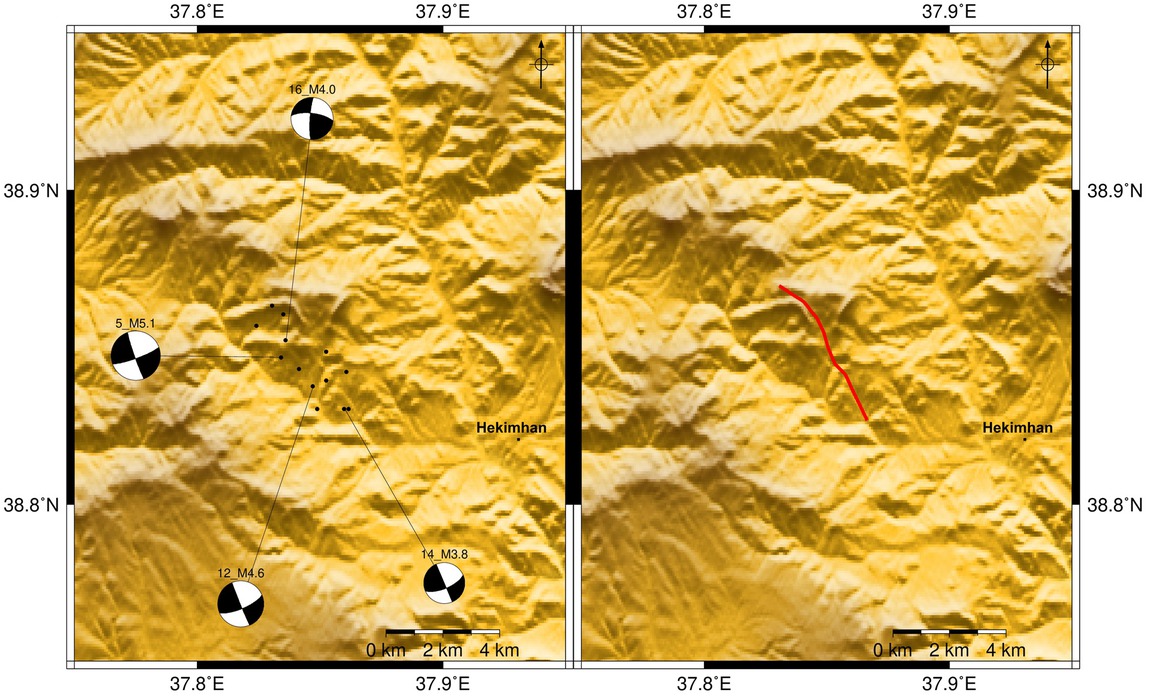
Focal mechanisms of earthquakes with magnitude above 3.8 are plotted within the shear zone identified with respect to the seismic activity focused near Hekimhan. Solid red line indicates the corresponding source fault of the observed seismicity.
The orientations of P/ T axes are nearly vertical and nearly horizontal (Figure 5), respectively, suggesting an extensional regime. In addition to this, nearly subhorizontal σ3 and nearly subvertical σ1 indicate the existence of an ongoing extensional regime within the study area. This may imply the existence of an ancient fragmented fault in the region. There are few earthquakes with pure strike slip mechanisms however our results indicate strike-slip mechanism with a normal component. Our results coincide with [18], which suggests northeast-southwest shortening and corresponding northwest-southeast extension for the Central “ova” neotectonic province of Anatolia. Nevertheless, more comprehensive analysis needs to be performed with enhanced instrumental and paleoseismological studies in the vicinity of the fault.
7 Discussion and Conclusion
In this study, seismotectonics of the Malatya Fault, eastern Turkey, is investigated by using a unified dataset of local agencies, KOERI and AFAD. A local crustal velocity model is estimated to be further employed in the analysis. Earthquakes in the study area are relocated in order to obtain more precise hypocenter parameters. Moment tensor solutions are computed utilizing these improved hypocenter locations. Focal mechanism solutions and stress inversion results of this study depict a well recovered image of the active tectonic structure in the target region.
Malatya Fault, the southern branch of MOFZ, is argued to be the plate boundary between Anatolian and Arabian Plate until the development of NAFZ and EAFZ in mid-Pliocene [31] and labeled as inactive since then. In a recent study, [28] found evidence of four earthquakes from pre-instrumental period according to their paleoseismological observations in the region with a recurrence interval of 2275+-605 years. They stated that another earthquake with a surface rupture is due. These findings are in good agreement with geological and morphological evidence [20, 26, 29] highlighting the Malatya Fault as an active fault, partly accumulating intraplate deformation of Anatolian Plate [17]. According to geodetic studies within the region, most of the strain accumulation due to westward movement of Anatolia is accommodated by EAFZ rather than Malatya Fault [17].
In the light of these arguments, we analyze seismic activity in the region between the years 2008-2019. Seismicity mainly focuses in two zones; one along the northern branch of Malatya Fault, and the second one near Hekimhan, almost oblique to Malatya Fault. The highest magnitude events are M5.1 occurred on 29.11.2015 (near Hekimhan) and another event, magnitude 4.8, occurred on 25.03.2019 (near Arguvan).We determine hypocenter locations of 146 events. In earthquake hypocenter determination, we merge datasets of seismic and strong motion sensor networks in order to reduce azimuthal gap, an important parameter to ensure accuracy. However, instrumental problems in sensors and low signal to noise ratio data limit our calculations. Focal mechanisms of only 57 events are calculated, reflecting normal and strike slip faulting. Relatively shallow depths obtained in hypocenter determinations, might be an evidence of insignificant amount of accumulated strain. In a recent study, it is reported that Tohoku-Oki earthquake rupture is terminated by the seismic activity in the adjacent segments [61]. Reliable geodetic surveys need to be conducted in this region in order to better understand whether Malatya Fault has accumulated any amount of strain to precisely determine the seismic risk.
The most striking result of this study is the identification of a NW-SE trending deformation zone, which becomes evident following the seismic activity near Hekimhan (Figure 2). In the interior parts of the Anatolian Block, all tectonic regimes including such a NW-SE trending one are suggested to be formed as a result of the activation of pre-weakness belts due to the westward motion of the Anatolian Block [18, 62]. Major shear zones such as the Malatya Ovacık Fault, are often associated with a structural pattern of faults arranged as en échelon [63, 64]. The observed seismicity may be related to an anti Riedel structure within the shear zone of the Malatya Fault (Figure 7). The solid red line in Figure 7 may be good candidate for the source fault of these seismic events, which also makes a lineament on the morphology. As a property of anti Riedel structures, a dextral strike-slip movement is expected [18], since the kinematics of the principal displacement zone is sinistral. According to the results of shear-box experiments of [63], the inclination of anti Riedel shears is approximately 78∘. We determine an inclination of 55-60∘ of the observed anti Riedel structure (Figure 7). There may be several reasons of this low inclination angle. Tchalenko [63] performed these experiments using homogeneous kaolin clay whereas the study region consists of highly heterogeneous distribution of geological units, as expected. Another reason may be the amount of data employed in this study. Limited number of earthquakes and related focal mechanisms may not be enough to address the state of stress in such a complex tectonic region.
Even though the target region is monitored with a high number of stations from two different networks, the results of this study are mainly constrained by the limitations of sensor networks along the Malatya Fault. Moreover, there is not any consensus on the active tectonic regime of the region. Therefore, it is necessary to increase the density of the station distribution along this fault and analyze the region in more detail. The results of this study underline the importance of deploying dense networks of different types of sensors to monitor earthquake prone regions as well as providing maintenance of these sensors regularly. Despite all limitations, defining an active morphological element, which is not included in recent active fault map of Turkey, prove to be noteworthy for seismic risk assessment of the target region. More detailed studies on the geological and morphological evidence of this deformation zone need to be conducted.
Acknowledgement
Data used in this study can be obtained from Kandilli Observatory and Earthquake Research Institute (KOERI; http://eida.koeri.boun.edu.tr, last accessed December 2019) and Disaster and Emergency Management Authority Presidential of Earthquake Department (AFAD; http://tdvm.afad.gov.tr, last accessed December 2019). Some of the figures are prepared using the Generic Mapping Tools v.4.2.1, (www.soest.hawaii.edu/gmt, last accessed December 2019; Wessel and Smith, 1998). We are grateful to Esen Arpat for valuable discussions on the geology and interpretation of results. We would like to thank Cengiz Zabcı for fruitful comments on the geology of the region. We would like to thank four anonymous reviewers and Krzysztof Gaidzik for their constructive comments that helped to improve the manuscript. Musavver Didem Cambaz acknowledges to Boğaziçi University, Scientific Research Projects (BAP) 9401P for supporting part of this work. Diğdem Acarel would like to thank the Scientific Council of Turkey (TUBITAK) for funding within the project 117C009.
References
[1] Fukushima Y., Toda S., Miura S., Ishimura D., Fukuda J., Demachi T., Tachibana K., Extremely early recurrence of intraplate fault rupture following the Tohoku-Oki earthquake. Nature Geoscience, 2018, 11, 777-781, doi:10.1038/s41561-018-0201-x10.1038/s41561-018-0201-xSearch in Google Scholar
[2] Kanamori H., Allen CR., Earthquake repeat time and average stress drop. In: Das S., Boatwright J., Scholz C.H. (Eds.), Earthquake Source Mechanics, Geophys. Monogr., Washington, DC: Am. Geophys. Union, 1986, 227-35Search in Google Scholar
[3] Ramirez-Herrera M.T., Corona N., Ruiz-Angolo A., Melgar D., Zavalo-Hidalgo J., The 8 September 2017 Tsunami Triggered by the M8.2 Intraplate Earthquake, Chiapas, Mexico. Pure and Applied Geophysics, 2018, 175, 25-3410.1007/s00024-017-1765-xSearch in Google Scholar
[4] Rizza M., Ritz J.F., Prentice C., Vassallo R., Braucher R., Larroque C., Arzhannikova A., Arzhannikov S., Mahan S., Massault M., Michelot J.L., Todbileg M., ASTER Team., Earthquake Geology of the Bulnay Fault (Mongolia). Bulletin of the Seismological Society of America, 2015, 105 (1), 72-93, https://doi.org/10.1785/012014011910.1785/0120140119Search in Google Scholar
[5] Ketin İ., Ub̈er die tektonisch-mechanischen Folgerungen aus den grossen anatolischen Erdbeben des letzten Dezenniums. Geol. Rund., 1948, 36, 77–8310.1007/BF01791916Search in Google Scholar
[6] Arpat E., Şaroğlu F., The East Anatolian Fault System: thoughts on its development. Bulletin of the Mineral Research and Exploration (MTA), 1972, 78, 33-39Search in Google Scholar
[7] Ambraseys N.N., Some characteristic features of the Anatolian Fault Zone. Tectonophysics, 1970, 9, 143–16510.1016/0040-1951(70)90014-4Search in Google Scholar
[8] Arpat E., Şaroğlu F., Recent tectonic activities in Turkey. Bulletin of the Geological Society of Turkey, 1975, 18, 91-101 (in Turkish with English abstract)Search in Google Scholar
[9] Şengör A.M.C., The North Anatolian transform fault its age, offset and tectonic significance. J. Geol. Soc. London, 1979, 136, 269–28210.1144/gsjgs.136.3.0269Search in Google Scholar
[10] Barka A.A., The North Anatolian fault zone. Annales Tectonicae, 1992, VI suppl., 164-195Search in Google Scholar
[11] Barka A.A., Slip distribution along the North Anatolian fault associated with the large earthquakes of the period 1939 to 1967. Bulletin of the Seismological Society of America, 1996, 86, 5, 1238-1254Search in Google Scholar
[12] Şengör A.M.C., Tüysüz O., İmren C., Sakınç M., Eyidoğan H., Görür N., Le Pichon X., Rangin C., The North Anatolian Fault: A New Look. Annu. Rev. Earth Planet. Sci., 2005, 33, 37-112, doi:10.1146/annurev.earth.32.101802.12041510.1146/annurev.earth.32.101802.120415Search in Google Scholar
[13] Öztürk S., Earthquake hazard potential in the Eastern Anatolian region of Turkey: seismotectonic b and Dc-values and precursory quiescence Z-value. Front. Earth Sci., 2018, 12(1), 215-23610.1007/s11707-017-0642-3Search in Google Scholar
[14] McClusky S., Balassanian S., Barka A., Demir C., Ergintav S., Georgiev I., Gurkan O., Hamburger M., Hurst K., Kahle H., Kastens K., Kekelidze G., King R., Kotzev V., Lenk O.,Mahmoud S., Mishin A., Nadariya M., Ouzounis A., Paradissis D., Peter Y., Prilepin M., Reilinger R., Sanli I., Seeger H., Tealeb A., Toksöz M.N., Veis G., Global positioning system constraints on plate kinematics and dynamics in the eastern Mediterranean and Caucasus. J. Geophys. Res., 2000, 105, 5695–571910.1029/1996JB900351Search in Google Scholar
[15] Reilinger R., McClusky S., Vernant P., Lawrence S., Ergintav S., Cakmak R., Özener H., Kadirov F., Guliev I., Stepanyan R., Nadariya M., Hahubia G., Mahmoud S., Sakr K., ArRajehi A., Paradissis D., al-Aydrus A., Prilepin M., Guseva T., Evren E., Dmitrotsa A., Filikov S.V., Gomez F., al-Ghazzi R., Karam G., GPS constraints on continental deformation in the Africa-Arabia-Eurasia continental collision zone and impli- cations for the dynamics of plate interactions. J. Geophys. Res., 2006 111, B05411, https://doi.org/10.1029/2005jb00405110.1029/2005JB004051Search in Google Scholar
[16] Özener H., Arpat E.,Ergintav S., Doğru A., Çakmak R., Turgut B., Doğan U., Kinematics of the eastern part of the North Anatolian Fault Zone. Journal of Geodynamics, 2010, 49, 141-15010.1016/j.jog.2010.01.003Search in Google Scholar
[17] Aktuğ B., Diken U., Doğru A., Özener H., Seismicity and strain accumulation around Karliova Triple Junction (KTJ). Journal of Geodyn., 2013, 67, 21-2910.1016/j.jog.2012.04.008Search in Google Scholar
[18] Şengör A.M.C., Görür N., Şaroğlu F., Strike slip faulting and related basin formations in zones of tectonic escape: Turkey as a case study. In: Biddle K.T., Christie-Blick N. (Eds.), Strike- slip faulting and basin formation. Society of Economic Paleontologists and Mineralogists, Tulsa, Oklahoma, special publication 1985, 37, 227–26410.2110/pec.85.37.0227Search in Google Scholar
[19] Koçyiğit A., Beyhan A., A new intra-continental transcurrent structure: the central Anatolian fault zone, Turkey. Tectonophysics, 1998, 284, 317–33610.1016/S0040-1951(97)00176-5Search in Google Scholar
[20] Kaymakçı N., İnceöz M., Ertepınar P., 3D-architecture and neogene evolution of the Malatya Basin: inferences for the kinematics of the Malatya and Ovacık Fault zones. Turkish Journal of Earth Sciences, 2006, 15, 123-154Search in Google Scholar
[21] Akyuz H.S., Ucarkus G., Altunel E., Dogan B., Dikbas A., Paleoseismological investigations on a slow-moving active fault in Central Anatolia, Tecer Fault, Sivas. Ann. Geophys., 2013, 55(5), doi:10.4401/ag-544410.4401/ag-5444Search in Google Scholar
[22] Yıldırım C., Relative tectonic activity assessment of the Tuz Gölü fault zone; Central Anatolia, Turkey. Tectonophysics, 2014, 630, 183–192, https://doi.org/10.1016/j.tecto.2014.05.02310.1016/j.tecto.2014.05.023Search in Google Scholar
[23] Yıldırım C., Sarıkaya M.A., Çiner A., Late Pleistocene intraplate extension of the central Anatolian plateau, Turkey: inferences from cosmogenic exposure dating of alluvial fan, landslide, and moraine surfaces along the Ecemiş fault zone. Tectonics, 2016,35, 1446–1464, https://doi.org/10.1002/2015TC00403810.1002/2015TC004038Search in Google Scholar
[24] Sarıkaya M.A., Yıldırım C., Çiner A., No surface breaking on the Ecemiş fault, Central Turkey, since Late Pleistocene (~64.5 ka); new geomorphic and geochronologic data from cosmogenic dating of offset alluvial fans. Tectonophysics, 2015, 649, 33–46, https://doi.org/10.1016/j.tecto.2015.02.02210.1016/j.tecto.2015.02.022Search in Google Scholar
[25] Higgins M., Schoenbohm L.M., Brocard G., Kaymakci N., Gosse J.C., Cosca M.A., New kinematic and geochronologic evidence for the quaternary evolution of the central Anatolian fault zone (CAFZ). Tectonics, 2015, 34, 2118–2141, https://doi.org/10.1002/2015TC00386410.1002/2015TC003864Search in Google Scholar
[26] Yazıcı M., Zabcı C., Sançar T., Natalin B.A., The role of intraplate strike-slip faults in shaping the surrounding morphology: the Ovacık fault (eastern Turkey) as a case study. Geomorphology, 2018, 321, 129–14510.1016/j.geomorph.2018.08.022Search in Google Scholar
[27] Taşgın C.K., Seismically generated hydroplastic deformation structures in the Late Miocene lacustrine deposits of the Malatya Basin, Eastern Turkey. Sedimentary Geology, 2011, 235, 264-27610.1016/j.sedgeo.2010.09.015Search in Google Scholar
[28] Sançar T., Zabci C., Karabacak V., Yazici M., Akyüz H.S., Geometry and Paleoseismology of the Malatya Fault (Malatya-Ovacik Fault Zone), Eastern Turkey: Implications of intraplate deformation of the Anatolian Scholle. J. Seismol, 2019, 23, 319-34910.1007/s10950-018-9808-zSearch in Google Scholar
[29] Sançar T., Zabci C., Akçar N., Karabacak V., Yeşilyurt S., Yazıcı M., Akyüz H. S., Öztüfekçi Ö.A., Ivy-Ochs S., Christl M., Vockenhuber, C., Geodynamic Importance of the Strike-Slip Faults at the Eastern Part of the Anatolian Scholle: Inferences from the Uplift and Slip Rate of the Malatya Fault (Malatya-Ovacık Fault Zone). Journal of Asian Earth Sciences, 2020, (in press)10.1016/j.jseaes.2019.104091Search in Google Scholar
[30] Emre Ö., Duman T.Y., Özalp S., Elmacı H., Olgun Ş., Şaroğlu F., Active Fault Map of Turkey, General Directorate of Mineral Research and Exploration, Ankara, Türkiye, 2013Search in Google Scholar
[31] Westaway R., Arger J., Kinematics of the Malatya-Ovacık fault zone. Geodin. Acta, 2001, 14, 103–13110.1080/09853111.2001.11432438Search in Google Scholar
[32] Westaway R., Demir T., Seyrek A., Geometry of the Turkey- Arabia and Africa-Arabia plate boundaries in the latest Miocene to mid-Pliocene: the role of the Malatya-Ovacık fault zone in eastern Turkey. eEarth, 2008, 3, 27–35 https://doi.org/10.5194/ee-3-27-200810.5194/ee-3-27-2008Search in Google Scholar
[33] Wells D.L., Coppersmith K.J., New empirical relationships among magnitude, rupture length, rupture width, rupture area, and surface displacement. Bull. Seismol. Soc. Am., 1994, 84, 974–1002Search in Google Scholar
[34] Okuyucu S., Erdag D.S., Geology and Neotectonics of Akcadag-Ören (Malatya) Section. Abstracts of the 70th Geological Congress of Turkey, 2017, 594-595Search in Google Scholar
[35] Boğaziçi University, Kandilli Observatory and Earthquake Research Institute: International Federation of Digital Seismograph Networks, Dataset/Seismic Network, https://doi.org/10.7914/SN/KO 2001Search in Google Scholar
[36] Havskov J., Ottemöller L., SeisAn Earthquake analysis software. Seis. Res. Lett., 1999, 7010.1785/gssrl.70.5.532Search in Google Scholar
[37] Kissling E., Geotomography with local earthquake data. Reviews of Geophysics, 1988, 26, 659-69810.1029/RG026i004p00659Search in Google Scholar
[38] Kissling E., Ellsworth W.L., Eberhart-Philips D., Kradolfer U., Initial reference models in seismic tomography. J. Geophys. Res., 1994, 99, 19635-1964610.1029/93JB03138Search in Google Scholar
[39] Kissling E., Kradolfer U., Maurer H., VELEST User’s Guide, 1995Search in Google Scholar
[40] Cambaz M.D., Karabulut H., Love-wave group velocity maps of Turkey and surrounding regions. Geophys. J. Int., 2010, 181, 502–52010.1111/j.1365-246X.2010.04516.xSearch in Google Scholar
[41] Gökalp H., Local earthquake tomography of the Erzincan Basin and the surrounding area in Turkey. Annals of Geophysics, 2007, 50, 707-72410.4401/ag-3052Search in Google Scholar
[42] Lomax A., Curtis A., Fast, probabilistic earthquake location in 3D models using oct-tree importance sampling. Geophys. Res. Abstr., 2001, 3, 95510.1007/978-94-015-9536-0_5Search in Google Scholar
[43] Tarantola A., Vallette B., Inverse problems = quest for information. J. Geophys., 1982, 5, 159-170Search in Google Scholar
[44] Moser T.J., van Ech T., Nolet G., Hypocenter determination in strongly heterogeneous earth models using the shortest path method, J. Geophys. Res., 1992, 97, 6536-657210.1029/91JB03176Search in Google Scholar
[45] Wittlinger G., Herquel G., Nakache T., Earthquake location in strongly heterogeneous media, Geophys. J. Int., 1993, 115, 759-77710.1111/j.1365-246X.1993.tb01491.xSearch in Google Scholar
[46] Sokos E., Zahradnik J., A MATLAB GUI for Use with ISOLA Fortran Codes User’s Guide, 2006, http://seismo.geology.upatras.gr/isola/Search in Google Scholar
[47] Sokos E., Zahradník J., ISOLA a Fortran code and a Matlab GUI to perform multiple-point source inversion of seismic data. Comput. Geosci. 2008, 34, 967-977, http://dx.doi.org/10.1016/j.cageo.2007.07.00510.1016/j.cageo.2007.07.005Search in Google Scholar
[48] Sokos E., Zahradník J., Evaluating centroid-moment tensor uncertainty in the new version of ISOLA software. Seis. Res. Lett., 2013, 84, 656-665, http://dx.doi.org/10.1785/022013000210.1785/0220130002Search in Google Scholar
[49] Kikuchi M., Kanamori H., Inversion of complex body waves-III. Bull. Seismol. Soc. Am., 1992, 81, 2335–235010.1785/BSSA0810062335Search in Google Scholar
[50] Bouchon M., A simple method to calculate Green’s functions for elastic layered media. Bull. Seismol. Soc. Am., 1981, 71, 959–97110.1785/BSSA0710040959Search in Google Scholar
[51] Coutant O., Program of numerical simulation AXITRA. Tech. rep., LGIT, Grenoble, France, 1989Search in Google Scholar
[52] Fojtikova L., Zahradnik J., A new strategy for weak events in sparse networks: the first-motion polarity solutions constrained by single-station waveform inversion. Seism. Res. Lett., 2014, 85, 1265-127410.1785/0220140072Search in Google Scholar
[53] Dias F., Zahradník J., Assumpcao M., Path-specific, dispersion-based velocity models and moment tensors of moderate events recorded at few distant stations: Examples from Brazil and Greece. Journal of South American Earth Sciences, 2016, 71, 344-35810.1016/j.jsames.2016.07.004Search in Google Scholar
[54] Turhan F., Cambaz M.D., Zahradník J., The significance of the crustal velocity model in moment tensor solutions: A case study of Yedisu earthquakes. In: D’Amico S. (Ed.), Moment Tensor Solutions - A Useful Tool for Seismotectonics, Springer Natural Hazards. Springer, Cham, 2018, 557-57210.1007/978-3-319-77359-9_24Search in Google Scholar
[55] Carvalho J., Barros L.V., Zahradnik J., Inversion for focal mechanisms usingwaveform envelopes and inaccurate velocity models: Examples from Brazil. Bull. Seism. Soc. Am., 2018, 109, 1, 138–15110.1785/0120180119Search in Google Scholar
[56] Frohlich C., Triangle diagrams: ternary graphs to display similarity and diversity of earthquake focal mechanisms. Physics of the Earth and Planetary Interiors, 1992, 75, 193–19810.1016/0031-9201(92)90130-NSearch in Google Scholar
[57] Michael A., Use of focal mechanisms to determine stress: a control study. J. Geophys. Res., 1987, 92(B1), 357-369, http://dx.doi.org/10.1029/JB092iB01p0035710.1029/JB092iB01p00357Search in Google Scholar
[58] Delvaux D., Barth A., African stress pattern from formal inversion of focal mechanism data. Tectonophysics, 2010, 482, 1, 105-128, doi: 10.1016/j.tecto.2009.05.00910.1016/j.tecto.2009.05.009Search in Google Scholar
[59] Vavryčuk V., Iterative joint inversion for stress and fault orientations from focal mechanisms. Geophys. J. Int., 2014, 199, 69–77, doi: 10.1093/gji/ggu22410.1093/gji/ggu224Search in Google Scholar
[60] Gephart J.W., Forsyth D.W., An improved method for determining the regional stress tensor using earthquake focal mechanism data: Application to the San Fernando Earthquake Sequence. Journal of Geophysical Research Atmospheres, 1984, 89, 2177-2180, doi: 10.1029/JB089iB11p0930510.1029/JB089iB11p09305Search in Google Scholar
[61] Nishikawa T.,Matsuzawa T., Ohta K., Uchida N., Nishimura T., Ide S., The slow earthquake spectrumin the Japan Trench illuminated by the S-net seafloor observatories. Science, 2019, 365, 808-81310.1126/science.aax5618Search in Google Scholar
[62] Şengör A.M.C., Zabcı C., The North Anatolian Fault and the North Anatolian Shear Zone. In: Kuzucuoğlu C., Çiner A., Kazancı N. (Eds.), Landscapes and Landforms of Turkey. World Geomorphological Landscapes. Springer, Cham, 2019, 481-49410.1007/978-3-030-03515-0_27Search in Google Scholar
[63] Tchalenko J.S., Similarities between shear zones of different magnitudes, GSA Bulletin, 1970, 81(6), 1625-164010.1130/0016-7606(1970)81[1625:SBSZOD]2.0.CO;2Search in Google Scholar
[64] Dresen G., Stress distribution and the orientation of Riedel shears. Tectonophysics, 1991, 188, 3-4, 239-24710.1016/0040-1951(91)90458-5Search in Google Scholar
Final MT solutions
| No. | Date | Time | Lat (∘N) | Lon (∘E) | M | Depth (km) | Mw | Nodal Plane 1 | |||
|---|---|---|---|---|---|---|---|---|---|---|---|
| Hypocenter | Centroid | Strike (∘) | Dip (∘) | Rake (∘) | |||||||
| 1 | 10.26.2015 | 04:43:28 | 38.9053 | 38.2407 | 4.0 | 10.39 | 7.0 | 3.8 | 240 | 86 | −32 |
| 2 | 10.26.2015 | 09:00:32 | 38.8577 | 38.1729 | 3.7 | 11.47 | 7.0 | 3.6 | 352 | 65 | −157 |
| 3 | 10.26.2015 | 09:11:53 | 38.8596 | 38.1949 | 3.2 | 6.87 | 6.0 | 3.2 | 329 | 85 | 177 |
| 4 | 11.27.2015 | 03:12:18 | 38.9053 | 38.2114 | 3.3 | 7.26 | 7.0 | 3.4 | 15 | 34 | −108 |
| 5 | 11.29.2015 | 00:28:07 | 38.8467 | 37.8342 | 5.1 | 6.73 | 10.0 | 4.9 | 160 | 86 | −171 |
| 6 | 11.29.2015 | 01:46:19 | 38.8486 | 37.8525 | 3.5 | 4.13 | 6.0 | 3.4 | 327 | 67 | 147 |
| 7 | 11.29.2015 | 08:28:57 | 38.8422 | 37.8607 | 3.4 | 7.68 | 8.0 | 3.3 | 50 | 43 | −71 |
| 8 | 11.29.2015 | 17:34:34 | 38.8632 | 37.8305 | 3.7 | 13.13 | 10.0 | 3.4 | 180 | 62 | −158 |
| 9 | 11.29.2015 | 22:06:29 | 38.8605 | 37.8351 | 3.4 | 5.14 | 8.0 | 3.2 | 178 | 86 | −171 |
| 10 | 12.1.2015 | 11:08:43 | 38.8568 | 37.8241 | 3.2 | 1.03 | 7.0 | 3.1 | 54 | 53 | 16 |
| 11 | 12.1.2015 | 15:38:57 | 38.8431 | 37.8415 | 3.7 | 11.13 | 6.0 | 3.6 | 318 | 78 | 158 |
| 12 | 12.9.2015 | 09:03:33 | 38.8376 | 37.847 | 4.6 | 4.48 | 8.0 | 4.2 | 158 | 88 | −163 |
| 13 | 12.9.2015 | 10:13:05 | 38.8394 | 37.8525 | 3.7 | 4.33 | 8.0 | 3.4 | 137 | 83 | 172 |
| 14 | 12.21.2015 | 05:49:33 | 38.8303 | 37.8598 | 3.8 | 10 | 7.0 | 3.6 | 157 | 90 | −158 |
| 15 | 1.20.2016 | 10:34:17 | 38.8303 | 37.8616 | 3.4 | 7.65 | 10.0 | 3.3 | 182 | 77 | −161 |
| 16 | 2.2.2016 | 14:21:15 | 38.8522 | 37.836 | 4.0 | 8.88 | 8.0 | 3.7 | 184 | 81 | 159 |
| 17 | 2.4.2016 | 16:34:44 | 39.0884 | 37.8067 | 3.6 | 9.46 | 9.0 | 3.3 | 143 | 81 | −172 |
| 18 | 8.17.2016 | 01:07:01 | 38.7103 | 38.1427 | 4.2 | 2.01 | 3.0 | 4.0 | 135 | 38 | 127 |
| 19 | 10.31.2016 | 13:23:30 | 38.8303 | 37.8488 | 3.6 | 10 | 6.0 | 3.4 | 8 | 40 | −122 |
| 20 | 1.31.2017 | 07:17:09 | 38.7003 | 38.1143 | 3.4 | 9.51 | 4.0 | 3.4 | 327 | 83 | −161 |
| 21 | 2.2.2017 | 15:11:46 | 38.6984 | 38.0869 | 3.6 | 12.3 | 4.0 | 3.7 | 325 | 89 | −175 |
| 22 | 2.3.2017 | 06:33:33 | 38.7039 | 38.1033 | 3.9 | 10.74 | 4.0 | 3.8 | 157 | 85 | 172 |
| 23 | 2.4.2017 | 04:42:43 | 38.6984 | 38.1143 | 3.7 | 7.75 | 4.0 | 3.7 | 243 | 55 | −6 |
| 24 | 2.8.2017 | 04:30:41 | 38.6966 | 38.107 | 3.9 | 8 | 4.0 | 3.8 | 342 | 79 | −135 |
| 25 | 5.13.2017 | 01:04:09 | 38.7845 | 38.1601 | 3.4 | 11.32 | 8.0 | 3.3 | 338 | 80 | 172 |
| 26 | 5.25.2017 | 02:58:50 | 38.6765 | 38.1363 | 3.8 | 9.51 | 3.0 | 3.7 | 146 | 89 | 163 |
| 27 | 7.9.2017 | 05:08:15 | 38.7003 | 38.0869 | 3.6 | 9.37 | 4.0 | 3.6 | 149 | 86 | 179 |
| 28 | 10.11.2017 | 06:06:49 | 38.7607 | 38.1711 | 3.2 | 6.43 | 5.0 | 3.2 | 229 | 55 | 21 |
| 29 | 6.18.2018 | 05:12:25 | 38.7003 | 38.0942 | 3.7 | 10.1 | 5.0 | 3.5 | 150 | 87 | 167 |
| 30 | 6.21.2018 | 00:33:52 | 38.6984 | 38.0887 | 3.8 | 10.49 | 4.0 | 3.7 | 154 | 78 | −177 |
| 31 | 7.21.2018 | 22:40:40 | 38.7762 | 37.9413 | 3.2 | 6.31 | 4.0 | 3.3 | 122 | 80 | 176 |
| 32 | 10.9.2018 | 15:32:02 | 38.7204 | 38.1125 | 3.2 | 11.03 | 4.0 | 3.2 | 43 | 48 | −73 |
| 33 | 10.20.2018 | 01:23:30 | 38.7241 | 38.1088 | 3.4 | 9.17 | 5.0 | 3.3 | 66 | 59 | −51 |
| 34 | 12.19.2018 | 22:33:30 | 38.7259 | 38.1161 | 3.4 | 8.78 | 8.0 | 3.4 | 71 | 84 | −32 |
| 35 | 2.5.2019 | 05:17:58 | 38.7708 | 38.1482 | 4.2 | 8.12 | 5.0 | 3.9 | 233 | 90 | −27 |
| 36 | 2.5.2019 | 13:55:40 | 38.7662 | 38.1473 | 3.6 | 8.39 | 5.0 | 3.5 | 58 | 87 | 26 |
| 37 | 2.10.2019 | 06:54:56 | 38.7534 | 38.1619 | 3.7 | 10.93 | 4.0 | 3.6 | 236 | 82 | −42 |
| 38 | 3.21.2019 | 03:48:44 | 38.7717 | 38.1656 | 3.2 | 11.91 | 6.0 | 3.3 | 331 | 70 | −169 |
| 39 | 3.21.2019 | 05:25:32 | 38.7662 | 38.1619 | 4.0 | 10.3 | 5.0 | 3.8 | 232 | 75 | −38 |
| 40 | 3.21.2019 | 05:51:07 | 38.7753 | 38.1546 | 4.5 | 11.03 | 5.0 | 4.2 | 234 | 80 | −36 |
| 41 | 3.22.2019 | 01:36:08 | 38.757 | 38.1656 | 3.2 | 9.07 | 5.0 | 3.2 | 359 | 51 | −135 |
| 42 | 3.25.2019 | 11:29:22 | 38.7735 | 38.1583 | 4.8 | 7.12 | 6.0 | 4.7 | 234 | 72 | −36 |
| 43 | 3.25.2019 | 13:53:00 | 38.7479 | 38.1564 | 3.7 | 8.44 | 4.0 | 3.7 | 356 | 44 | −125 |
| 44 | 3.26.2019 | 01:05:57 | 38.7662 | 38.1491 | 3.5 | 9.86 | 4.0 | 3.5 | 340 | 71 | −172 |
| 45 | 3.27.2019 | 00:29:16 | 38.7881 | 38.1454 | 3.9 | 8.68 | 4.0 | 3.8 | 350 | 63 | −135 |
| 46 | 3.27.2019 | 00:31:27 | 38.7973 | 38.1473 | 3.4 | 9.07 | 5.0 | 3.4 | 14 | 39 | −111 |
| 47 | 3.28.2019 | 03:32:53 | 38.7799 | 38.1573 | 3.3 | 8.85 | 6.0 | 3.3 | 337 | 72 | −150 |
| 48 | 3.28.2019 | 04:19:21 | 38.7845 | 38.1638 | 4.2 | 10.88 | 5.0 | 4.0 | 342 | 64 | −149 |
| 49 | 3.28.2019 | 11:28:23 | 38.7881 | 38.1583 | 3.3 | 11.42 | 7.0 | 3.3 | 328 | 84 | −179 |
| 50 | 4.7.2019 | 17:47:08 | 38.7772 | 38.1528 | 3.5 | 12.4 | 5.0 | 3.4 | 53 | 77 | 30 |
| 51 | 4.8.2019 | 17:38:18 | 38.7616 | 38.1537 | 4.1 | 5.82 | 6.0 | 4.1 | 332 | 67 | −168 |
| 52 | 4.12.2019 | 04:55:35 | 38.7625 | 38.1564 | 3.2 | 11.08 | 6.0 | 3.2 | 320 | 75 | 180 |
| 53 | 4.15.2019 | 04:41:28 | 38.7607 | 38.1546 | 4.6 | 8.05 | 4.0 | 4.4 | 360 | 50 | −113 |
| 54 | 4.17.2019 | 01:45:52 | 38.7405 | 38.1564 | 3.7 | 11.18 | 4.0 | 3.6 | 357 | 44 | −119 |
| 55 | 4.17.2019 | 20:37:10 | 38.7955 | 38.14 | 3.3 | 10.98 | 5.0 | 3.3 | 227 | 63 | −13 |
| 56 | 4.19.2019 | 08:54:21 | 38.7872 | 38.1537 | 3.2 | 10.81 | 7.0 | 3.1 | 333 | 71 | −171 |
| 57 | 4.19.2019 | 23:10:35 | 38.7552 | 38.1564 | 3.7 | 9.81 | 4.0 | 3.6 | 153 | 73 | −163 |
© 2019 D. Acarel et al., published by De Gruyter
This work is licensed under the Creative Commons Attribution 4.0 Public License.
Articles in the same Issue
- Regular Articles
- 2D Seismic Interpretation of the Meyal Area, Northern Potwar Deform Zone, Potwar Basin, Pakistan
- A new method of lithologic identification and distribution characteristics of fine - grained sediments: A case study in southwest of Ordos Basin, China
- Modified Gompertz sigmoidal model removing fine-ending of grain-size distribution
- Diagenesis and its influence on reservoir quality and oil-water relative permeability: A case study in the Yanchang Formation Chang 8 tight sandstone oil reservoir, Ordos Basin, China
- Evaluation of AHRS algorithms for Foot-Mounted Inertial-based Indoor Navigation Systems
- Identification and evaluation of land use vulnerability in a coal mining area under the coupled human-environment
- Hydrocarbon Generation Potential of Chia Gara Formation in Three Selected Wells, Northern Iraq
- Source Analysis of Silicon and Uranium in uranium-rich shale in the Xiuwu Basin, Southern China
- Lithologic heterogeneity of lacustrine shale and its geological significance for shale hydrocarbon-a case study of Zhangjiatan Shale
- Characterization of soil permeability in the former Lake Texcoco, Mexico
- Detrital zircon trace elements from the Mesozoic Jiyuan Basin, central China and its implication on tectonic transition of the Qinling Orogenic Belt
- Turkey OpenStreetMap Dataset - Spatial Analysis of Development and Growth Proxies
- Morphological Changes of the Lower Ping and Chao Phraya Rivers, North and Central Thailand: Flood and Coastal Equilibrium Analyses
- Landscape Transformations in Rapidly Developing Peri-urban Areas of Accra, Ghana: Results of 30 years
- Division of shale sequences and prediction of the favorable shale gas intervals: an example of the Lower Cambrian of Yangtze Region in Xiuwu Basin
- Fractal characteristics of nanopores in lacustrine shales of the Triassic Yanchang Formation, Ordos Basin, NW China
- Selected components of geological structures and numerical modelling of slope stability
- Spatial data quality and uncertainty publication patterns and trends by bibliometric analysis
- Application of microstructure classification for the assessment of the variability of geological-engineering and pore space properties in clay soils
- Shear failure modes and AE characteristics of sandstone and marble fractures
- Ice Age theory: a correspondence between Milutin Milanković and Vojislav Mišković
- Are Serbian tourists worried? The effect of psychological factors on tourists’ behavior based on the perceived risk
- Real-Time Map Matching: A New Algorithm Integrating Spatio-Temporal Proximity and Improved Weighted Circle
- Characteristics and hysteresis of saturated-unsaturated seepage of soil landslides in the Three Gorges Reservoir Area, China
- Petrographical and geophysical investigation of the Ecca Group between Fort Beaufort and Grahamstown, in the Eastern Cape Province, South Africa
- Ecological risk assessment of geohazards in Natural World Heritage Sites: an empirical analysis of Bogda, Tianshan
- Integrated Subsurface Temperature Modeling beneath Mt. Lawu and Mt. Muriah in The Northeast Java Basin, Indonesia
- Go social for your own safety! Review of social networks use on natural disasters – case studies from worldwide
- Forestry Aridity Index in Vojvodina, North Serbia
- Natural Disasters vs Hotel Industry Resilience: An Exploratory Study among Hotel Managers from Europe
- Using Monarch Butterfly Optimization to Solve the Emergency Vehicle Routing Problem with Relief Materials in Sudden Disasters
- Potential influence of meteorological variables on forest fire risk in Serbia during the period 2000-2017
- Controlling factors on the geochemistry of Al-Shuaiba and Al-Mejarma coastal lagoons, Red Sea, Saudi Arabia
- The Influence of Kaolinite - Illite toward mechanical properties of Claystone
- Two critical books in the history of loess investigation: ‘Charakteristik der Felsarten’ by Karl Caesar von Leonhard and ‘Principles of Geology’ by Charles Lyell
- The Mechanism and Control Technology of Strong Strata Behavior in Extra-Thick Coal Seam Mining Influenced by Overlying Coal Pillar
- Shared Aerial Drone Videos — Prospects and Problems for Volunteered Geographic Information Research
- Stable isotopes of C and H in methane fermentation of agriculture substrates at different temperature conditions
- Prediction of Compression and Swelling Index Parameters of Quaternary Sediments from Index Tests at Mersin District
- Detection of old scattered windthrow using low cost resources. The case of Storm Xynthia in the Vosges Mountains, 28 February 2010
- Remediation of Copper and Zinc from wastewater by modified clay in Asir region southwest of Saudi Arabia
- Sedimentary facies of Paleogene lacustrine dolomicrite and implications for petroleum reservoirs in the southern Qianjiang Depression, China
- Correlation between ore particle flow pattern and velocity field through multiple drawpoints under the influence of a flexible barrier
- Atmospheric refractivity estimation from AIS signal power using the quantum-behaved particle swarm optimization algorithm
- A geophysical and hydro physico-chemical study of the contaminant impact of a solid waste landfill (swl) in King Williams’ Town, Eastern Cape, South Africa
- Landscape characterization using photographs from crowdsourced platforms: content analysis of social media photographs
- A Study on Transient Electromagnetic Interpretation Method Based on the Seismic Wave Impedance Inversion Model
- Stratigraphy of Architectural Elements of a Buried Monogenetic Volcanic System
- Variable secondary porosity modeling of carbonate rocks based on μ-CT images
- Traditional versus modern settlement on torrential alluvial fans considering the danger of debris flows: a case study of the Upper Sava Valley (NW Slovenia)
- The Influence of Gangue Particle size and Gangue Feeding Rate on Safety and Service Life of the Suspended Buffer’s Spring
- Research on the Transition Section Length of the Mixed Workface Using Gangue Backfilling Method and Caving Method
- Rainfall erosivity and extreme precipitation in the Pannonian basin
- Structure of the Sediment and Crust in the Northeast North China Craton from Improved Sequential H-k Stacking Method
- Planning Activities Improvements Responding Local Interests Change through Participatory Approach
- GIS-based landslide susceptibility mapping using bivariate statistical methods in North-western Tunisia
- Uncertainty based multi-step seismic analysis for near-surface imaging
- Deformation monitoring and prediction for residential areas in the Panji mining area based on an InSAR time series analysis and the GM-SVR model
- Statistical and expert-based landslide susceptibility modeling on a national scale applied to North Macedonia
- Natural hazards and their impact on rural settlements in NE Romania – A cartographical approach
- Rock fracture initiation and propagation by mechanical and hydraulic impact
- Influence of Rapid Transit on Accessibility Pattern and Economic Linkage at Urban Agglomeration Scale in China
- Near Infrared Spectroscopic Study of Trioctahedral Chlorites and Its Remote Sensing Application
- Problems with collapsible soils: Particle types and inter-particle bonding
- Unification of data from various seismic catalogues to study seismic activity in the Carpathians Mountain arc
- Quality assessment of DEM derived from topographic maps for geomorphometric purposes
- Remote Sensing Monitoring of Soil Moisture in the Daliuta Coal Mine Based on SPOT 5/6 and Worldview-2
- Utilizing Maximum Entropy Spectral Analysis (MESA) to identify Milankovitch cycles in Lower Member of Miocene Zhujiang Formation in north slope of Baiyun Sag, Pearl River Mouth Basin, South China Sea
- Stability Analysis of a Slurry Trench in Cohesive-Frictional Soils
- Integrating Landsat 7 and 8 data to improve basalt formation classification: A case study at Buon Ma Thuot region, Central Highland, Vietnam
- Assessment of the hydrocarbon potentiality of the Late Jurassic formations of NW Iraq: A case study based on TOC and Rock-Eval pyrolysis in selected oil-wells
- Rare earth element geochemistry of sediments from the southern Okinawa Trough since 3 ka: Implications for river-sea processes and sediment source
- Effect of gas adsorption-induced pore radius and effective stress on shale gas permeability in slip flow: New Insights
- Development of the Narva-Jõesuu beach, mineral composition of beach deposits and destruction of the pier, southeastern coast of the Gulf of Finland
- Selecting fracturing interval for the exploitation of tight oil reservoirs from logs: a case study
- A comprehensive scheme for lithological mapping using Sentinel-2A and ASTER GDEM in weathered and vegetated coastal zone, Southern China
- Sedimentary model of K-Successions Sandstones in H21 Area of Huizhou Depression, Pearl River Mouth Basin, South China Sea
- A non-uniform dip slip formula to calculate the coseismic deformation: Case study of Tohoku Mw9.0 Earthquake
- Decision trees in environmental justice research — a case study on the floods of 2001 and 2010 in Hungary
- The Impacts of Climate Change on Maximum Daily Discharge in the Payab Jamash Watershed, Iran
- Mass tourism in protected areas – underestimated threat? Polish National Parks case study
- Decadal variations of total organic carbon production in the inner-shelf of the South China Sea and East China Sea
- Hydrogeothermal potentials of Rogozna mountain and possibility of their valorization
- Postglacial talus slope development imaged by the ERT method: comparison of slopes from SW Spitsbergen, Norway and Tatra Mountains, Poland
- Seismotectonics of Malatya Fault, Eastern Turkey
- Investigating of soil features and landslide risk in Western-Atakent (İstanbul) using resistivity, MASW, Microtremor and boreholes methods
- Assessment of Aquifer Vulnerability Using Integrated Geophysical Approach in Weathered Terrains of South China
- An integrated analysis of mineralogical and microstructural characteristics and petrophysical properties of carbonate rocks in the lower Indus Basin, Pakistan
- Applicability of Hydrological Models for Flash Flood Simulation in Small Catchments of Hilly Area in China
- Heterogeneity analysis of shale reservoir based on multi-stage pumping data