Geochemical evaluation of the carbonaceous shale associated with the Permian Mikambeni Formation of the Tuli Basin for potential gas generation, South Africa
-
George Oluwole Akintola


Abstract
The increasing demand for energy and global commitment to reduce CO2 emissions to mitigate climate change has spurred countries to pursue unconventional hydrocarbon generation for power production. The investigation of the carbonaceous shale from the Permian Mikambeni Formation of the Tuli Basin in South Africa aims to assess the potential for gas generation. The Rock-Eval 6 pyrolysis of the studied samples shows total organic carbon (TOC) content ranging from 10.10 to 37.61 wt%, indicating an excellent source rock quality since it exceeds the threshold limit of 5 wt%. The produced gas that emanated from the thermal breakup of remaining hydrocarbon (S2) ranged from 14.30 to 65.55 mg HC/g rock while the hydrogen index (HI) ranged from 56.55 to 198.22 mg/g TOC. The plot of the HI against T max indicates the predominance of type-III kerogen, prone to gas generation. The thermal maturity parameters, T max (430–466°C), and vitrinite reflectance, VRo (0.6–1.2), showed a matured organic material. The production index value (0.06) of the samples indicates a moderately mature source generating a biogenic gas. The carbon isotopic composition, δ 13C (−20.0 to −23.4‰), indicates a predominant influx of organic matter derived from a vascular higher plant. The studied samples showed relatively depleted values of oxygen isotopic composition δ 16O (14.1–18.8‰), suggesting a brackish water depositional environment. Additionally, the Ba concentration (303.15–331.27 ppm) exceeds the 200 ppm threshold for the marine environment, indicating a non-marine environment characterised by low marine paleo-productivity and high detrital influx. Based on the evaluation, the studied coaly-shale is found with a matured and type-III kerogen that is prone to gas generation in a fluvial, paleo-depositional environment.
1 Introduction
Shale gas displays signs of transitional energy generation from heavy hydrocarbon to green energy. Global energy demand is increasing and the commitment to reducing CO2 emissions from coal and petroleum has aggravated the quest for an unconventional hydrocarbon generation. Unconventional hydrocarbon is characterised by self-generation and self-storage owing to the extremely low transmissibility over a long distance unlike the traditional hydrocarbon system [1]. Given the recent technological advances in horizontal drilling and multi-stage hydraulic fracturing, commercial production of shale gas has been successful in the United States and some countries such as Canada and China [2]. With this advancement in the extraction mechanism and the 2015 Paris Global Agreement target to reduce CO2 emissions, many countries such as Australia, Poland, and South Africa have increased their efforts in the search for shale gas. Sequel to the 2015 Paris Climate Agreement, South Africa pledged an equitable contribution to the climate targets of limiting global temperature increases below 2°C because an average of 390 million metric tons of CO2 equivalent is emitted yearly [3]. In response, the country intends to aggressively reduce its carbon emissions, thus setting a target of 30% reduction to achieve a greener economy by 2040 [4].
In South Africa, the available studies on shale gas have focused on the Lower Ecca Group of the main Karoo Basin. The concentration of recent research on this region stems from the need to understand the natural gas that escapes from the Whitehill Formation at Loeriesfontein after drilling a borehole 30 years ago [5]. After characterisation of the lower Ecca Group, the Whitehill and its associated Collingham and Prince Albert formations have shale deposits that could have partly generated gas and oil hydrocarbon [6]. The underlying Prince Albert Formation of the Ecca Group has shown a type II–III kerogen shale, suggesting a gas-prone source with limited oil hydrocarbon. On the other hand, the potential gas resources of 485 trillion cubic feet (Tcf) have been deflated by about 85% [5]. The deflation was attributed to the dolerite intrusion that resulted from Cape Orogeny in 250 Ma, releasing heat flow and causing degassing of the gas resources.
Despite many decades of research, the shale gas generation potential of the Permian Tuli Basin has not been investigated. The main Karoo Basin is preserved in the northeastern region of South Africa in a separate fault-bounded basin as the Karoo-age Tuli Basin [7]. Based on sedimentary facies, the basin consists of black shale, sandstone, and coal associated with the Mikambeni formation [8,9]. Previous studies on the Tuli Basin encompass stratigraphic correlation, basin analysis, and coal quality [10,11,12]. However, there is a lack of studies on the Mikambeni Formation for unconventional generative potentials. As such, this study aims to evaluate the source rock potentials of the carbonaceous shale using the geochemical approach.
2 Geological setting
The Tuli Basin is a trans-frontier depozone that straddles the triple junction of South Africa, Zimbabwe, and Botswana situated within latitudes 29°36′22.19″E and 28° 25′23.15″E and longitudes 23°11′24.45″S and 22°43′24.54″S. The sedimentary rocks of the Tuli Basin occupy an area of about 1,000 km2, consisting of various terrigenous clastic such as conglomerates, breccias, sandstones, fine-grained sediments, and chemical deposits. This basin comprises the basal unit, Tshidzi Formation, consisting of glaciogenic diamictite up to a thickness of about 2 m [13] as shown in Figure 1. This unit correlates with the Dwyka unit of the main Karoo Basin due to the presence of glaciogenic diamictite and a similar period of deposition (∼290 Ma) [9]. The overlying lithology includes the fluvial-lacustrine coal-bearing deposit of the Madzaringwe and Mikambeni Formation, consisting of black shale, sandstone, and coal. Although the Mikambeni Formation has been the focus of geo-economic interest as coal-bearing karoo strata, new significant information on its potential for unconventional gas generation is imperative. This formation correlates with the base of the Vryheid Formation (∼258 Ma) since a Glossopteris flora leaf impression is identified in both stratigraphic units [14]. The Mikambeni is successively overlaid by the Fripp, Solitude, Klopperfontein, Bosbokpoort, and Clarens, respectively (Figure 1). Despite several theories explaining the development of the Tuli Basin, it is widely accepted that the sediments accumulate in the back-bulge setting of the Karoo retro-arc foreland system.

(a) Sedimentary sequence of the Tuli Basin, (b) carbonaceous shale core from the studied Mikambeni Formation, and (c) Limpopo Province location in the Northern Province of South Africa.
Plausible theories of Gondwana break-up, fault-controlled subsidence, crustal geophysical anomaly, and static tectonism have been used to explain the Tuli Basin development [15,16,17,18]. However, the widely accepted theory [8,9] postulates flexural subsidence of the Paleo–Pacific plate below the Gondwana plate in the late Paleozoic–early Mesozoic, resulting in a back-bulge depocentre which occurred north of Cape Fold Belt. The back bulge is a distal, craton-ward flexural subsidence caused by the combined forces of supra- and sub-lithospheric loading in the orogenic belt [19,20]. This back-bulged setting eventually migrated at a distance greater than 1,500 km as a north-dipping subduction zone.
3 Materials and methods
3.1 Samples and methods
Twenty core samples were obtained from boreholes which penetrated the carbonaceous Mikambeni Shale of the Tuli Basin as shown in Table 1. Based on the lithological and facies characteristics, ten representative samples were eventually prepared for various analyses. For sample preparation, fusion disks were prepared for X-ray fluorescence (XRF) analysis by an automatic Claisse M4 Gas Fusion instrument and ultrapure Claisse Flux, using a ratio of 1:10 for sample/flux. They were coarsely crushed and a chip of sample was mounted along with up to ten other samples in a 2.4 cm round resin disk. The mount was ground using a thin grinder and then polished to expose the interior surface for analysis. For quantification, NIST 610 glass (values from Jochum et al. [21]) was used for quantification and analysed every ten samples, along with BCR-2G and BHVO-2G values from GeoReM [21]. A fusion control standard from certified basaltic reference material with BCR-2, and BHVO-1, values (Jochum et al. [21]) is also analysed at the beginning of a sequence to verify the effective ablation of the fused material. Data processing was done using the LA-ICP-MS data reduction software package LADR from Norris Scientific [21,22,23,24]. In order to correct for variations in the ablation yield between standards and samples, an internal standard element of known concentration was used [25]. The Al2O3 content of each sample, obtained from XRF analysis, was used for this purpose. Based on the previous work [9], the inorganic and organic contents of the studied samples are described in Table 1.
Sample description
| Sample ID | Depth (m) | Lithology | Locality Long/Lat | Description |
|---|---|---|---|---|
| B1 | 370 | Fissile dark organic-rich shale | 29° 05′00″E/22°05′10″S | Inorganic constituent >50% and total organic constituent <50% |
| B2 | 380 | Fissile dark organic-rich shale | 29°10′15″E/22°15′15″S | Inorganic constituent >50% and total organic constituent <50% |
| B3 | 390 | Fissile dark organic-rich shale | 29°10′25″E/22°20′00″S | Inorganic constituent >50% and total organic constituent <50% |
| B4 | 410 | Fissile dark organic-rich shale | 29°15′10″E/22°25′10″S | Inorganic constituent >50% and total organic constituent <50% |
| B5 | 430 | Fissile dark organic-rich shale | 29°20′00″E/22°25′15″S | Inorganic constituent >50% and total organic constituent <50% |
| B6 | 440 | Fissile dark organic-rich shale | 29°25′15″E/22°30′05″S | Inorganic constituent >50% and total organic constituent <50% |
| B7 | 450 | Fissile dark organic-rich shale | 29°30′20″E/22°35′00″S | Inorganic constituent >50% and total organic constituent <50% |
| B8 | 470 | Fissile dark organic-rich shale | 29°35′05″E/22°40′ 10″S | Inorganic constituent >50% and total organic constituent <50% |
| B9 | 480 | Fissile dark organic-rich shale | 29°40′30″E/22°45′45″S | Inorganic constituent >50% and total organic constituent <50% |
| B10 | 500 | Fissile dark organic-rich shale | 29°45′15″E/22°50′00″S | Inorganic constituent >50% and total organic constituent <50% |
3.2 Rock-Eval 6 pyrolysis
The Rock-Eval 6 pure organic matter method was used to allow for pyrolysis to continue above the routine bulk rock high-temperature limit of 650°C due to the presence of high-temperature organic populations in the samples at the Activation Labs, Ontario, Canada. The samples were held isothermally at 300°C for 3 min for volatile hydrocarbon content (S1) under inert conditions. The temperature was then increased at the rate of 25°C/min to a final temperature of 800°C, probably due to the carbonaceous content, and held for 1 min for the remaining hydrocarbon generative potential (S2). During the S2 pyrolysis, a flame ionization detector was used to detect the CO2 gas effluent (S3) parameter. Based on these parameters, the hydrogen index (HI), oxygen index (OI), production index (PI), and vitrinite reflectance (VRo) were determined using equations (1)–(4) to understand the quantity, type, generative potential, and thermal maturity of the organic matter in the studied samples.
3.3 Carbon and oxygen isotopic compositions of the studied samples
A total of ten representative samples were analysed from the carbonaceous Mikambeni shale for stable isotopic composition at the Activation Laboratories, Ontario, Canada. To remove the organic matter, the core shale samples collected from a burial depth of 360–470 m were grounded to 80–100 μm grain size using agate mortar and treated with hydrochloric acid and hydrogen fluoride to remove carbonates and silicate, respectively, for about 24 h [26]. Afterwards, the residual solids were washed thoroughly with distilled water and later treated with chromium chloride to remove pyrite. Following thorough washing of the aliquot with distilled water, the OM samples were separated using a 0.6 μm filter due to their insolubility and dried in a vacuum at 60°C [27]. After the isolation of OM, a Costech ECS4010 elemental analyser was used to quantitatively combust the organic matter into CO2 over a heated copper oxide at 800°C [28] while the δ 13C/δ 12C and δO18C/δO16C isotope ratios were measured from 0.2 mg of a sample using an isotope ratio Finnigan Deltaplus mass spectrometer. The carbon compositions of the organic material are expressed as δ 13C in equation (5) and reported in per mil (‰) relative to the Pee Dee Belemnite reference standard with a precision of ±0.1‰ while oxygen isotopic compositions are reported relative to the standard mean ocean water (SMOW) [29]:
3.4 Major elemental compositions of the studied samples
Major geochemical analyses of the shale samples were quantitatively estimated using PANalytical XRF at Stellenbosch University, Cape Town. It was equipped with a 3 kW rhodium (Rh) tube and inserted glass disks containing 1 g of calcined sample, 8 g of flux composed of 35% alkali borate (LiBO2), and 64.71% lithium tetra borate (Li2B4O7) as oxidant at 1,000 °C. At this temperature, the weight loss or gain on ignition includes the total volatile content of the rock samples including the water combined with the lattice of silicate minerals, and the gain on ignition related to the oxidation of the rock mostly due to Fe. Pressed powder pellets for XRF analyses were prepared using 3 g of the sample powder and 6 g of boric acid as a binder. The mixture was fused into a steel cup and pressed at a pressure of 30 tons in a hydraulic set.
3.5 Trace elemental compositions of the studied samples
Trace elements in bulk shale samples as well as on single mineral grains were analysed using an Excimer laser ablation system (ICP-MS), at a resolution of 193 nm, connected to an Agilent 7700 Q ICP-MS at the Stellenbosch University, Cape Town. Prior to the analysis, inductively coupled plasma mass spectrometry (ICP-MS) was optimised for sensitivity and low oxide ratios of less than 0.2% by tuning both the ICP and laser parameters while ablating a line on NIST612. Ablation is performed in He gas at a flow rate of 0.35 L/min, then mixed with argon (0.9 L/min) and nitrogen (0.003 L/min) just before introduction into the ICP plasma. For traces in fusions, 2 spots of 104 µm are ablated on each sample using a frequency of 8 Hz and a fluence of ∼3.5 J/cm2.
4 Results
The Rock Eval 6 pyrolysis and the TOC contents are presented in Table 2. The average TOC content of the studied shale is 24.64 wt%, suggesting a coaly-shale with values ranging from 10.10 to 37.61 wt%. Since the TOC values exceed the threshold limit of 5.0 wt%, the quality of carbonaceous shale samples is categorised as good to excellent source rock [30,31]. The pyrolysis produces S1 which represents the volatile hydrocarbon stored within the shale pores at an average value of 1.67 mg HC/g rock. The hydrocarbon produced from the thermal break-up of remaining hydrocarbon (S2) ranged from 14.30 to 65.55 mg HC/g rock with an average value of 28.83 mg HC/g rock. The generative potential (30.49 mg HC/g rock) of the studied samples indicates an excellent hydrocarbon because it exceeds the threshold limit for poor to fair generative potential of 2 mg HC/TOC [32]. The maximum temperature, T max, corresponding to the peak of the hydrocarbon yield (S2), ranges between 430 and 466°C, suggesting a moderately mature source rock [33].
Rock Eval 6 parameters and isotopic compositions
| Spl | TOC (wt%) | S1 (mg HC/g rock) | S2 (mg HC/g rock) | S3 (mg HC/g rock) | T max (°C) | HI | OI | S2/S3 | PI | GP | BI | QI | %VRo | δ 13C (‰) | δ 16O (‰) |
|---|---|---|---|---|---|---|---|---|---|---|---|---|---|---|---|
| B1 | 26.71 | 1.62 | 15.92 | 0.90 | 456 | 59.60 | 2.0 | 17.69 | 0.09 | 17.54 | 6.07 | 65.67 | 1.0 | −23.0 | 14.5 |
| B2 | 26.70 | 1.60 | 15.10 | 0.91 | 458 | 56.55 | 2.0 | 16.59 | 0.10 | 16.7 | 6.07 | 62.55 | 1.1 | −23.0 | 14.1 |
| B3 | 26.73 | 1.76 | 17.37 | 0.92 | 466 | 64.98 | 2.0 | 18.88 | 0.09 | 19.13 | 5.99 | 71.57 | 1.2 | −23.1 | 15.1 |
| B4 | 37.01 | 3.08 | 60.50 | 2.30 | 432 | 163.47 | 4.0 | 26.30 | 0.05 | 63.58 | 6.58 | 171.79 | 0.6 | −23.1 | 15.4 |
| B5 | 37.61 | 3.27 | 50.46 | 2.23 | 430 | 134.17 | 4.0 | 22.63 | 0.06 | 53.73 | 8.32 | 142.86 | 0.6 | −23.4 | 16.2 |
| B6 | 33.07 | 3.35 | 65.55 | 2.16 | 433 | 198.22 | 4.0 | 30.35 | 0.05 | 68.9 | 8.69 | 208.35 | 0.6 | −23.4 | 16.5 |
| B7 | 15.70 | 0.55 | 16.10 | 0.20 | 450 | 102.55 | 2.0 | 80.50 | 0.03 | 16.65 | 10.13 | 106.05 | 0.9 | −22.1 | 16.1 |
| B8 | 12.73 | 0.32 | 14.30 | 0.12 | 462 | 112.33 | 2.0 | 119.17 | 0.02 | 14.62 | 3.50 | 114.85 | 1.2 | −20.0 | 16.5 |
| B9 | 10.10 | 0.47 | 15.40 | 0.15 | 435 | 152.48 | 4.0 | 102.67 | 0.03 | 15.87 | 2.51 | 157.13 | 0.7 | −20.5 | 18.3 |
| B10 | 20.05 | 0.65 | 17.55 | 1.16 | 440 | 87.53 | 4.0 | 15.13 | 0.04 | 18.2 | 4.65 | 90.77 | 0.8 | −20.8 | 18,8 |
Production index (PI) = S1/(S1 + S2); generation potential (GP) = (S1 + S2); bitumen index (BI) = (100 × S1/TOC); and quality index (QI) = 100 × (S1 + S2)/TOC.
The carbon isotopic composition, δ 13Corg, is commonly used as a provenance indicator of the organic material depositional environment [34]. The δ 13Corg (−20.0 to −23.4‰) of the studied samples showed an average value of −22.3‰, typical of terrigenous plant origin since the carbon isotopic composition is less than −22‰ limit level [35]. On the other hand, the Lower Cambrian Niutitang and Silurian Longmaxi shales have been reported to have carbon isotopic values of −31.8 and −30.3‰, respectively, typical of modern marine phytoplankton [36]. Furthermore, the studied formation showed relatively depleted values of δ 16O values, ranging from 14.1 to 18.8‰, suggesting an anoxic condition since the oxygen-rich marine environment tends to have values above 12‰ [37]. The δ 16O concentrations suggested that the organic matter was acted upon by the microbial activities in a brackish water environment [38,39]. The concentration of δ 16O progresses steadily with depth, suggesting the depletion of oxygen from the oxic conditions to anoxic conditions [40,41].
The geochemical compositions of the studied samples showed the presence of major oxides as depicted in Table 3. It showed varying amounts of alumina (19.37–20.32%), calcium oxide (0.20–0.22%), iron oxide (0.85–0.94%), potassium oxide (1.59–1.66%), magnesia (0.25–0.28%), sodium oxide (0.12–0.15%), phosphorus oxide (0.04%), silica (50.37–51.90%), and titanium oxide (0.69–0.73%) in the studied samples. In contrast to other elements, silica and alumina showed relatively higher values which average at 50.17 and 20.02%, respectively suggesting a felsic provenance [42] which is consistent with the discriminate functional plot [43]. The plot (Figure 2) showed that the studied samples were found to have both quartzose sedimentary and intermediate igneous provenances, thus explaining the exceptionally higher values of alumina and silica. The intermediate provenance was reflected by the high Fe/(Fe + Mg) values (0.5–0.83) which exceeded the limit threshold value of 0.5, as reported in a previous study [44]. The previous study indicated that the granite has calcic amphibole composed of ferro-hornblende and ferro-edenite with Fe/(Fe + Mg) values ranging from 0.53 to 0.81, while the biotite has Fe/(Fe + Mg) ratio > 0.60, suggesting a mafic input besides the felsic input. Furthermore, the oxides of Al and Ti elements have been used as a veritable tool to interpret sediments due to their immobility nature during transportation from the weathered source rock [45,46] with the elemental proxy’s ratio of Al2O3/TiO2 values > 25, indicating sedimentary and intermediate igneous sources. Additionally, the index of compositional variation (ICV) of a mature shale tends to exhibit a low ICV value (<1.0), indicating a tectonically quiescent depositional environment [47]. Contrarily, a compositionally immature shale is characterised by an ICV value >1.0, suggesting sedimentation in a tectonically active environment. As such, the studied carbonaceous shale samples have an average ICV value of 0.157 which indicates a compositionally matured shale, deposited in a tectonically quiescent environment. This explanation is comparable with the Paleogene-Neogene black shales of Arang, Nyalau Tanjong Balingian Bergih Liang Formation in Malaysia, enriched with kerogen capable of generating gas [48]. The elemental ratio K2O/Al2O3 (0.08) of the studied samples showed values ≤0.5, which suggests a highly mature shale since a significant amount of Al2O3 is typical of mineralogically immature sediments [47].
Major elemental composition of the studied shale
| Sample ID | Depth (m) | Al2O3 (%) | CaO (%) | Fe2O3 (%) | K2O (%) | MgO (%) | MnO (%) | Na2O (%) | P2O5 (%) | SiO2 (%) | TiO2 (%) | LOI (%) | K2O/Al2O3 | Fe/(Fe + Mg) (%) | ICV |
|---|---|---|---|---|---|---|---|---|---|---|---|---|---|---|---|
| B1 | 370 | 19.99 | 0.22 | 0.88 | 1.64 | 0.27 | 0.01 | 0.14 | 0,04 | 51.90 | 0.71 | 25.00 | 0.082 | 0.55 | 0.158 |
| B2 | 380 | 20.30 | 0.21 | 0.88 | 1.65 | 0.28 | 0.01 | 0.15 | 0,04 | 51.08 | 0.73 | 24.94 | 0.081 | 0.50 | 0.157 |
| B3 | 390 | 19.37 | 0.20 | 0.85 | 1.59 | 0.25 | 0.01 | 0.14 | 0,04 | 50.86 | 0.69 | 25.05 | 0.082 | 0.66 | 0.157 |
| B4 | 410 | 19.66 | 0.21 | 0.88 | 1.59 | 0.27 | 0.01 | 0.12 | 0,04 | 50.50 | 0.70 | 25.08 | 0.081 | 0.79 | 0.157 |
| B5 | 430 | 20.10 | 0.21 | 0.86 | 1.63 | 0.28 | 0.01 | 0.14 | 0,04 | 51.37 | 0.71 | 25.06 | 0.081 | 0.78 | 0.156 |
| B6 | 440 | 19.62 | 0.21 | 0.87 | 1.61 | 0.27 | 0.01 | 0.14 | 0,04 | 50.78 | 0.70 | 25.18 | 0.082 | 0.79 | 0.159 |
| B7 | 450 | 20.27 | 0.21 | 0.90 | 1.66 | 0.27 | 0.01 | 0.14 | 0,04 | 51.51 | 0.73 | 25.11 | 0.082 | 0.79 | 0.157 |
| B8 | 470 | 20.19 | 0.21 | 0.91 | 1.64 | 0.27 | 0.01 | 0.13 | 0,04 | 51.03 | 0.73 | 25.05 | 0.081 | 0.80 | 0.157 |
| B9 | 480 | 20.21 | 0.21 | 0.91 | 1.65 | 0.27 | 0.01 | 0.14 | 0,04 | 51.10 | 0.73 | 25.06 | 0.082 | 0.68 | 0.157 |
| B10 | 500 | 20.32 | 0.21 | 0.94 | 1.66 | 0.29 | 0.01 | 0.14 | 0,04 | 51.57 | 0.73 | 24.96 | 0.082 | 0.80 | 0.160 |
ICV = (Fe2O3 + K2O + Na2O + CaO + MgO + MnO)/Al2O3.
![Figure 2
Plot of discrimination functions using major elements index for felsic and mafic provenance and quartzose sedimentary provenance (Note: Discrimination Function 1: − 1.733 TiO2 + 0.607 Al2O3 + 0.76 Fe2O3 (t) − 1.5 MgO + 0.616 CaO + 0.509 Na2O − 1.224K2O −0.909. Discrimination Function 2: 0.445 TiO2 + 0.07 Al2O3 − 0.25Fe2O3 (t) − 1.142 MgO + 0.438 CaO + 1.475 Na2O + 1.426K2O − 6.861) (after Hayashi et al. [43]).](/document/doi/10.1515/geo-2022-0549/asset/graphic/j_geo-2022-0549_fig_002.jpg)
Plot of discrimination functions using major elements index for felsic and mafic provenance and quartzose sedimentary provenance (Note: Discrimination Function 1: − 1.733 TiO2 + 0.607 Al2O3 + 0.76 Fe2O3 (t) − 1.5 MgO + 0.616 CaO + 0.509 Na2O − 1.224K2O −0.909. Discrimination Function 2: 0.445 TiO2 + 0.07 Al2O3 − 0.25Fe2O3 (t) − 1.142 MgO + 0.438 CaO + 1.475 Na2O + 1.426K2O − 6.861) (after Hayashi et al. [43]).
The trace and rare earth element (REE) distributions in the studied samples are presented in Table 4. The trace element showed relatively high concentrations in Ba, Zr, Rb, Zn, Sr, V, and Cr with values above 50 ppm, while all other elements were lower. In all samples, the highest value of Ba (294.19–331.27 ppm) with an average of 301.29 ppm suggests the dissolution of mineral barite in the black shale by the action of sulphate-reducing bacteria [49,50]. In combination with Ba, the relatively high concentration of Zn (82.73–121.63 ppm) with an average of 96.92 ppm indicates paleo-productivity of abundant organic matter in the Mikambeni Formation. The association of elements such as Ba, Zn, Pb, and Cu with an abundance of organic matter has been reported in shale source rock due to high stability, thus providing an important forensic tool for paleo-productivity [51,52]. Although the concentration of Ba can be altered by hydrothermal overprint, it is precipitated in connection with organic matter and a high concentration of Zn may be related to hydrothermal activities [53,54]. The relatively high concentration of zirconium (Zr: 189.02–208.61 ppm) with an average of 202.28 ppm suggests shale deposition that is weakly affected by weathering action and diagenesis [55]. The concentrations of rubidium (Rb: 94.18–102.26 ppm) with an average of 97.52 ppm and Strontium (Sr: 92.02–99.62 ppm) with an average of 96.03 ppm are close and suggest a saline depositional environment of the organic-rich shale formation [56]. The concentration of vanadium (V: 81.24–93.72 ppm) with an average of 86.70 ppm and Chromium (Cr: 47.50–52.85 ppm) with an average of 50.86 ppm fall within the range of value, 50–250 ppm, which had been indicated for lacustrine oil shale (Frape et al., 2003). The geochemical proxies ratio of V/(V + Ni) and V/Ni for all studied samples exceed 0.54 and 4.25, respectively, suggesting anoxic conditions of the depositional environment [57].
Trace elemental composition of the studied carbonaceous shale
| Sample ID | Depth (m) | Sc (ppm) | V (ppm) | Cr (ppm) | Co (ppm) | Ni (ppm) | Cu (ppm) | Zn (ppm) | Rb (ppm) | Sr (ppm) | Y (ppm) | Zr (ppm) | Nb (ppm) | Mo (ppm) |
|---|---|---|---|---|---|---|---|---|---|---|---|---|---|---|
| B1 | 370 | 12.46 | 83.66 | 48.61 | 11.36 | 14.63 | 22.07 | 94.85 | 100.27 | 97.62 | 31.63 | 200.85 | 15.80 | 3.09 |
| B2 | 380 | 12.51 | 84.40 | 52.28 | 10.01 | 15.07 | 17.83 | 92.30 | 98.37 | 94.86 | 30.47 | 204.16 | 15.05 | 2.97 |
| B3 | 390 | 12.51 | 84.40 | 52.28 | 10.01 | 15.07 | 17.83 | 92.30 | 98.37 | 94.86 | 30.47 | 204.16 | 15.05 | 2.97 |
| B4 | 410 | 11.89 | 81.24 | 48.19 | 9.72 | 16.03 | 19.97 | 87.16 | 94.18 | 96.41 | 30.61 | 196.55 | 15.71 | 3.36 |
| B5 | 430 | 11.61 | 81.82 | 51.91 | 13.38 | 13.27 | 16.51 | 82.73 | 97.03 | 95.63 | 30.34 | 208.43 | 16.42 | 2.64 |
| B6 | 440 | 11.97 | 93.72 | 52.10 | 9.51 | 16.57 | 18.90 | 94.01 | 96.01 | 99.61 | 32.29 | 201.68 | 16.10 | 3.41 |
| B7 | 450 | 12.63 | 92.09 | 52.34 | 12.46 | 19.82 | 26.82 | 107.59 | 97.93 | 95.18 | 29.99 | 201.13 | 17.02 | 2.74 |
| B8 | 470 | 12.30 | 89.95 | 50.55 | 9.51 | 17.14 | 31.39 | 94.88 | 96.52 | 92.02 | 31.53 | 208.61 | 15.69 | 3.29 |
| B9 | 480 | 12.27 | 84.50 | 47.50 | 10.20 | 18.09 | 37.58 | 101.76 | 94.28 | 94.46 | 31.88 | 189.02 | 15.30 | 3.01 |
| B10 | 500 | 12.41 | 91.20 | 52.85 | 10.13 | 19.36 | 33.14 | 121.63 | 102.26 | 99.62 | 33.22 | 208.18 | 17.41 | 285 |
| Sample ID | Depth (m) | Cs (ppm) | Ba (ppm) | La (ppm) | Ce (ppm) | Pr (ppm) | Nd (ppm) | Sm (ppm) | Eu (ppm) | Gd (ppm) | Tb (ppm) | Dy (ppm) | Ho (ppm) | Er (ppm) |
|---|---|---|---|---|---|---|---|---|---|---|---|---|---|---|
| B1 | 370 | 7.50 | 312.95 | 52.21 | 115.79 | 13.95 | 47.31 | 8.33 | 1.55 | 6.47 | 1.01 | 5.63 | 1.18 | 3.01 |
| B2 | 380 | 7.61 | 303.15 | 50.40 | 117.57 | 12.75 | 45.82 | 7.75 | 1.58 | 6.33 | 0.91 | 5.83 | 1.09 | 2.71 |
| B3 | 390 | 7.61 | 304.15 | 50.40 | 117.57 | 12.75 | 45.82 | 7.75 | 1.58 | 6.33 | 0.91 | 5.83 | 1.09 | 2.71 |
| B4 | 410 | 7.79 | 313.82 | 50.43 | 121.55 | 12.86 | 47.42 | 8.64 | 1.64 | 7.27 | 0.99 | 5.52 | 1.07 | 3.07 |
| B5 | 430 | 7.62 | 306.95 | 50.51 | 118.91 | 13.47 | 45.06 | 8.42 | 1.57 | 6.71 | 0.91 | 5.76 | 1.23 | 3.13 |
| B6 | 440 | 8,28 | 308.03 | 51.52 | 123.88 | 13.98 | 47.63 | 9.22 | 1.71 | 6.69 | 0.92 | 5.65 | 1.19 | 2.90 |
| B7 | 450 | 7.99 | 312.71 | 52.27 | 125.11 | 13.17 | 48.61 | 8.68 | 1.40 | 7.00 | 1.03 | 6.23 | 1.18 | 3.23 |
| B8 | 470 | 7.97 | 305.90 | 51.34 | 122.01 | 13.68 | 47.17 | 9.05 | 1.38 | 6.82 | 0.97 | 5.36 | 1.17 | 2.85 |
| B9 | 480 | 7.43 | 29,416 | 49.82 | 119.57 | 13.19 | 46.87 | 8.42 | 1.45 | 7.08 | 1.11 | 5.88 | 1.11 | 2.95 |
| B10 | 500 | 8.46 | 331.27 | 54.21 | 132.09 | 13.83 | 48.15 | 9.18 | 1.54 | 6.95 | 1.13 | 6.46 | 1.14 | 3.27 |
| Sample ID | Depth (m) | Tm (ppm) | Yb (ppm) | Lu (ppm) | Hf (ppm) | Pb (ppm) | Th (ppm) | U (ppm) | V/(V + Ni) | V/Ni | (Eu/Eu*) | (Ce*) | Sr/Rb | V/Cr |
|---|---|---|---|---|---|---|---|---|---|---|---|---|---|---|
| B1 | 370 | 0.52 | 2.77 | 0.48 | 5.39 | 12.84 | 18.60 | 5.06 | 0.85 | 5.72 | 0.64 | 4.39 | 0.97 | 1.72 |
| B2 | 380 | 0.51 | 3.15 | 0.46 | 5.72 | 13.52 | 17.65 | 4.84 | 0.85 | 5.60 | 0.69 | 4.67 | 0.96 | 1.61 |
| B3 | 390 | 0.51 | 3.15 | 0.46 | 5.72 | 13.52 | 17.65 | 4.84 | 0.85 | 5.60 | 0.69 | 4.67 | 0.96 | 1.61 |
| B4 | 410 | 0.48 | 2.85 | 0.42 | 5.83 | 12.69 | 17.83 | 4.91 | 0.84 | 5.07 | 0.63 | 4.27 | 1.02 | 1.69 |
| B5 | 430 | 0.48 | 2.90 | 0.40 | 5.45 | 11.25 | 18.70 | 5.09 | 0.86 | 6.17 | 0.64 | 4.40 | 0.99 | 1.58 |
| B6 | 440 | 0.46 | 3.18 | 0.42 | 5.07 | 12.34 | 18.94 | 4.96 | 0.85 | 5.66 | 0.67 | 4.39 | 1.04 | 1.80 |
| B7 | 450 | 0.46 | 2.95 | 0.46 | 5.42 | 14.69 | 18.43 | 4.83 | 0.82 | 4.65 | 0.55 | 4.46 | 0.97 | 1.76 |
| B8 | 470 | 0.44 | 2.90 | 0.46 | 5.64 | 11.56 | 18.03 | 5.14 | 0.84 | 5.25 | 0.54 | 4.32 | 0.95 | 1.78 |
| B9 | 480 | 0.46 | 3.23 | 0.43 | 5.56 | 12.85 | 17.79 | 4.71 | 0.82 | 4.67 | 057 | 4.31 | 1.00 | 1.78 |
| B10 | 500 | 0.53 | 3.00 | 0.47 | 5.56 | 16.30 | 19.10 | 5.19 | 0.82 | 4.71 | 0.59 | 4.60 | 0.97 | 1.73 |
Eu* = (SmCN*GdCN)1/2, where CN denotes the chondrite-normalized value.
The distribution of the REE is characterised by the light rare earth elements (LREE) from lanthanum (La) to europium (Eu) and heavy rare earth elements (HREE) from gadolinium (Ga) to lutetium (Lu) as shown in Table 3 and Figure 3. All the studied samples showed low concentrations, below 50 ppm, except La and cerium (Ce) which have an average concentration of above 51.30 and 121.406 ppm, respectively, suggesting higher concentrations of LREE. The sum of LREE is significantly enriched than HREE with the ratio of ƩLREE/ƩHREE value averaging at 11.24 ppm, showing a similar concentration with the black shale of the Niuitang Formation bearing shale gas [58]. The plot of the chondrite normalised REE distribution pattern showed a similar concentration of each element with the depth of burial suggesting a syngenetic input rather than diagenetic (Figure 4). Diagenetic minerals exhibit heterogenous values or concentrations, as temperature and pressure increase with depth and hence least susceptible to diagenesis. Some previous studies [59,60,61,62] have reported the relative insolubility and immobility of REE during hydrothermal alteration, weathering, and low-grade metamorphism.
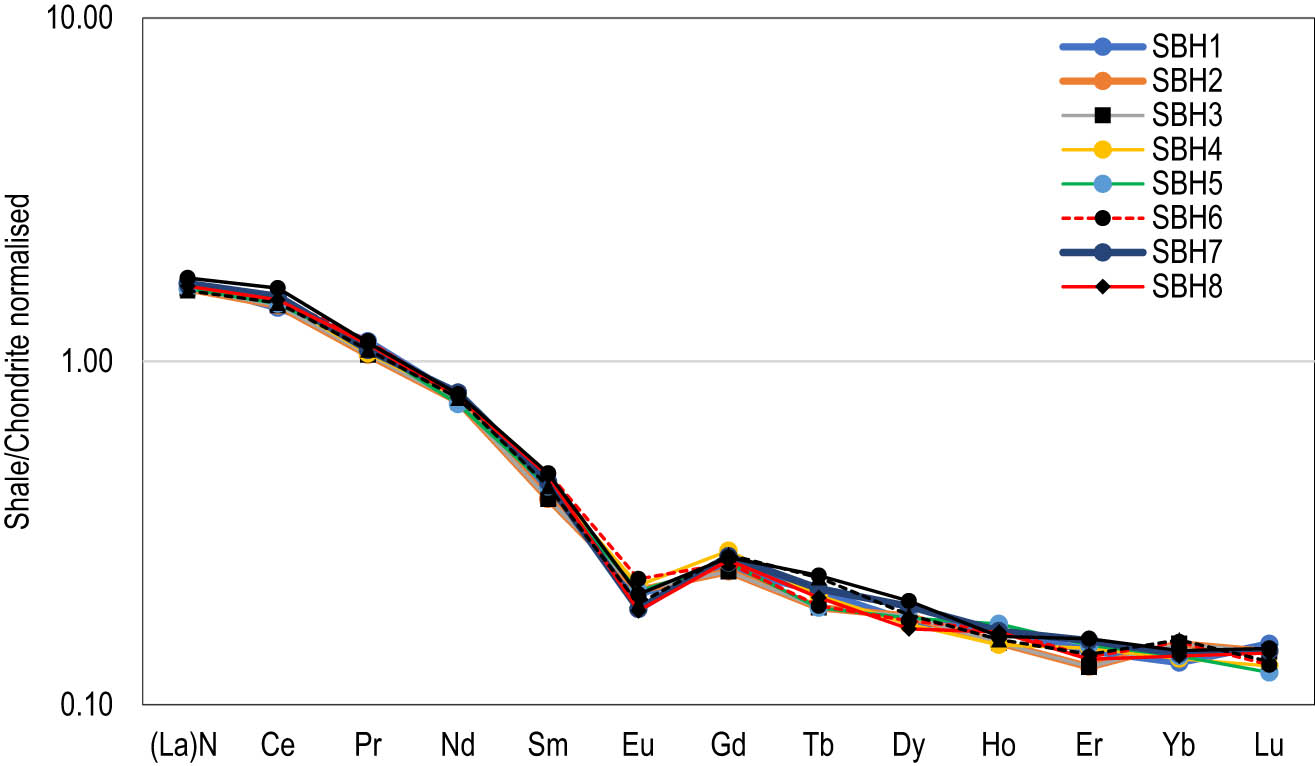
Chondrite-normalised REE pattern of the studied carbonaceous shale.
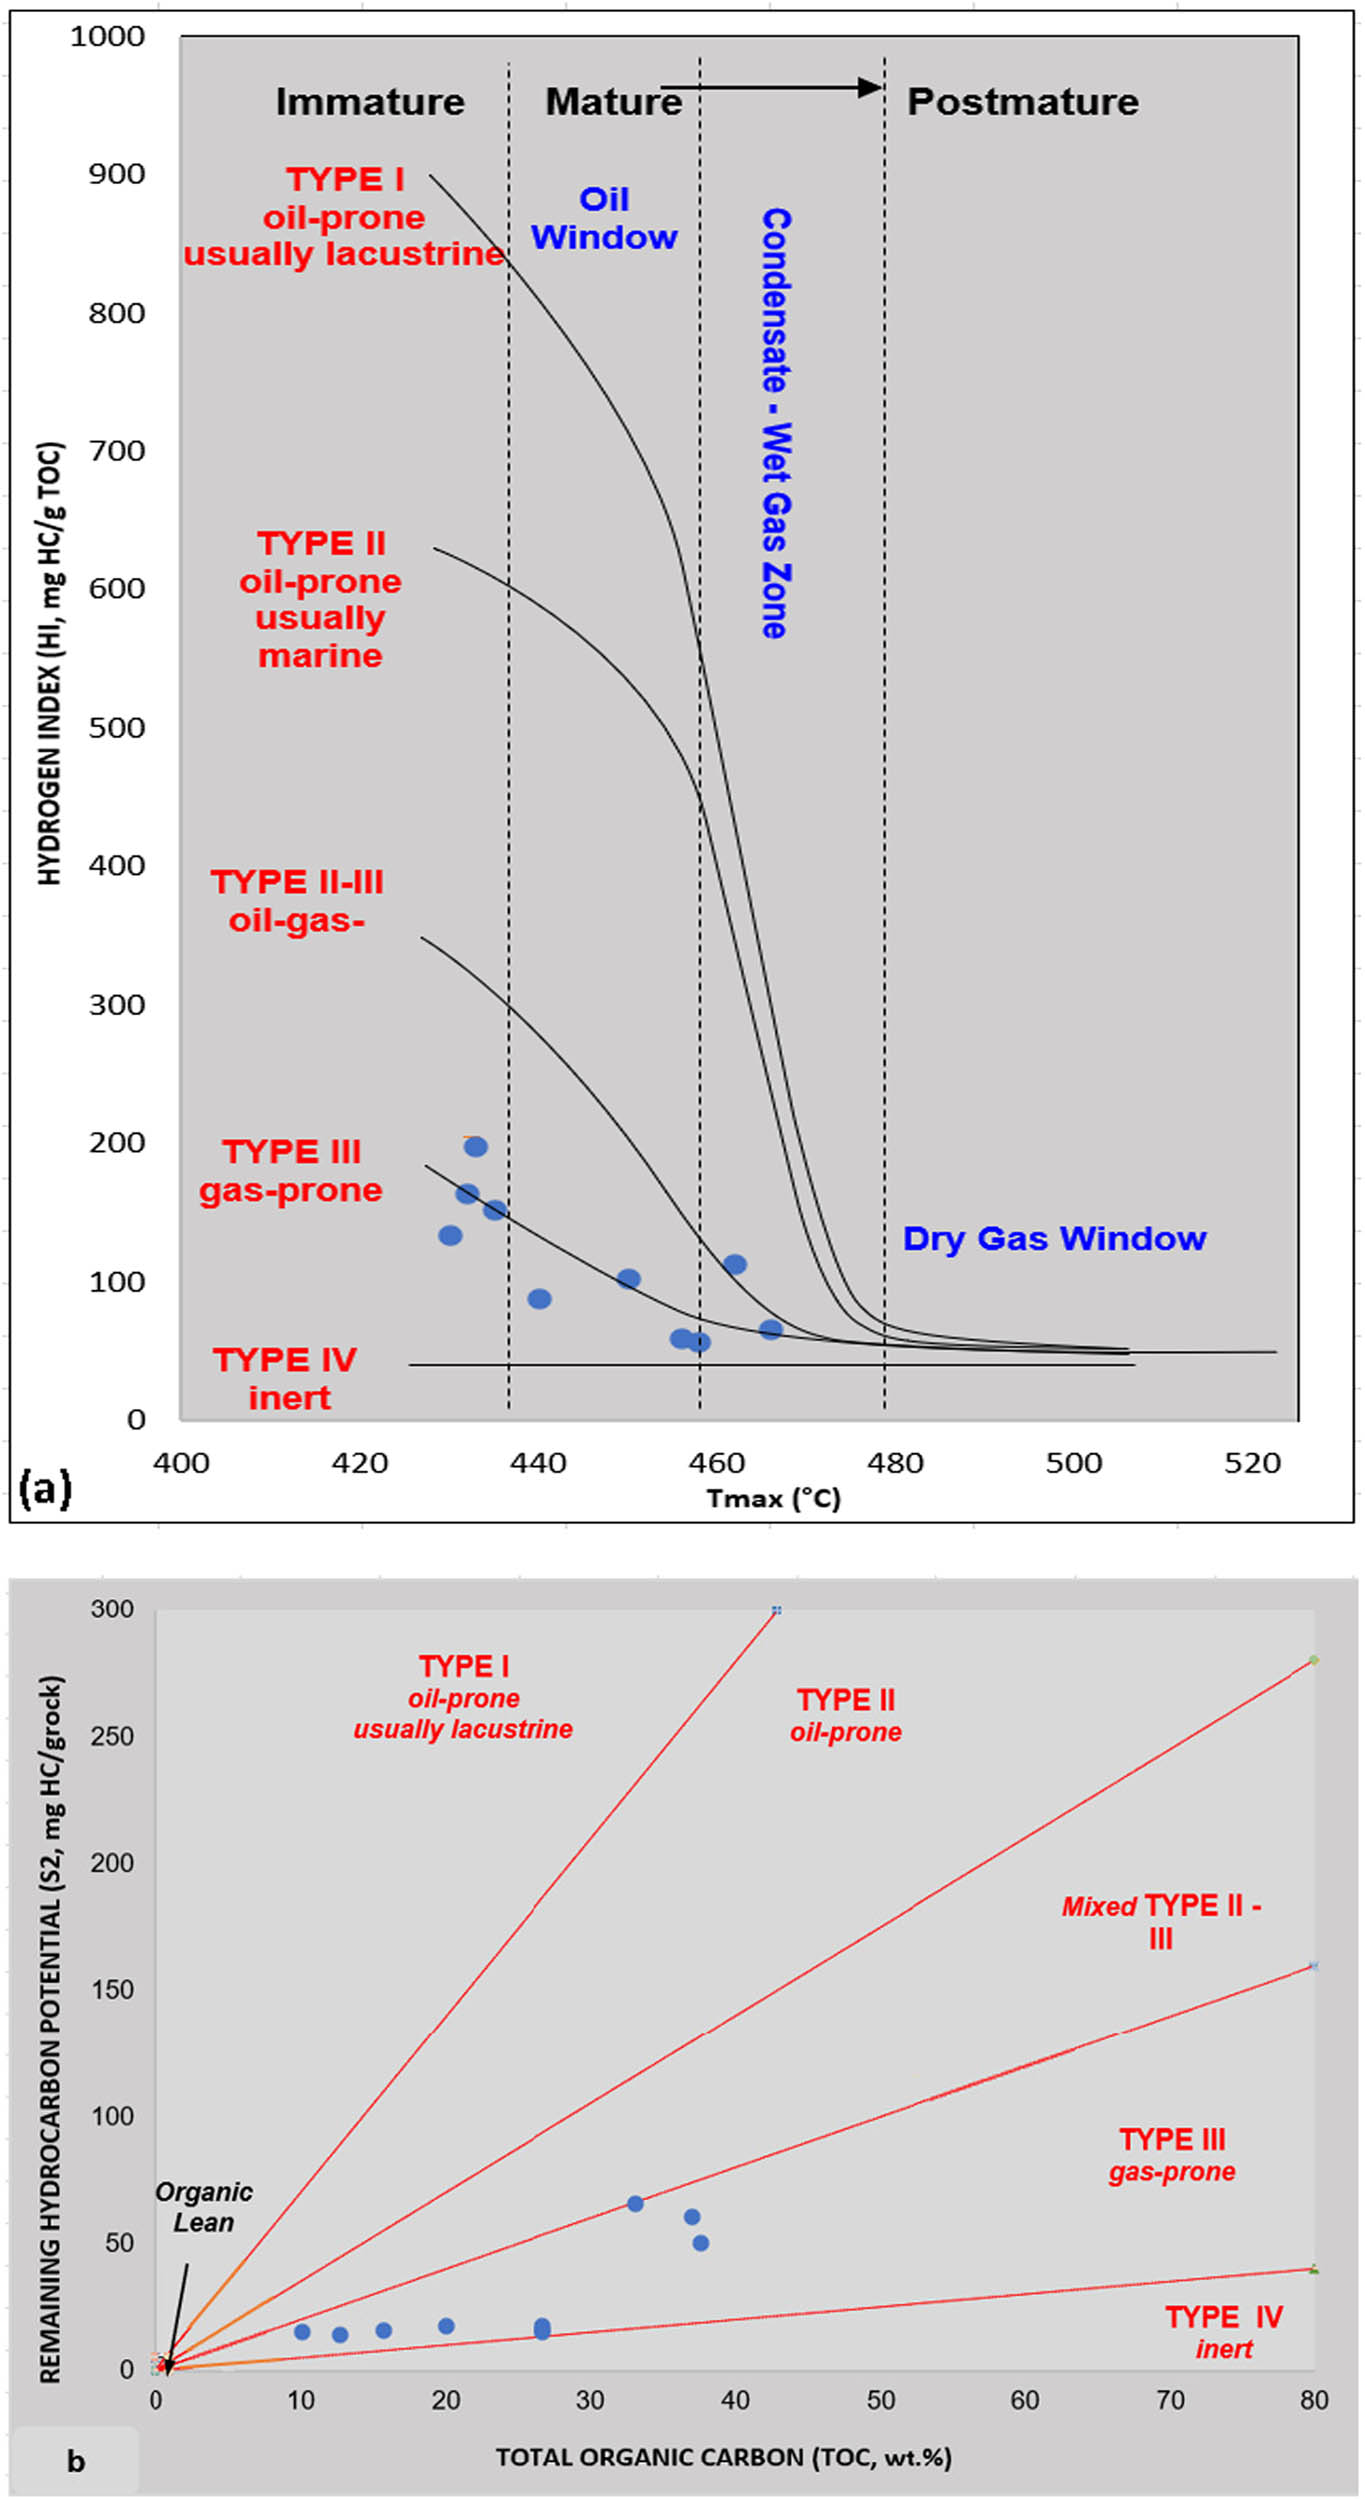
Modified van Krevelen diagram for the studied samples. (a) A plot of remaining hydrocarbon potential (S2) vs TOC showing kerogen type-III of the studied Mikambeni Shale. (b) A plot of HI vs T max showing maturity levels of the studied shale. Lines divide samples into the following: I – type I kerogen, II – type II kerogen, III – type III kerogen, and IV – type IV kerogen.
5 Discussion
5.1 Gas-prone formation
The preponderance of type-III kerogen is associated with the Permian Mikambeni shale which is prone to gas generation (Figure 4a). The type-III kerogen indicated that the organic matter was mainly derived from higher plant materials during the structural subsidence that formed the Tuli Basin [20,63,64]. The plot of HI against T max values suggests that the Mikambeni shale is prone to produce more gas hydrocarbon (Figure 4b). Although the presence of woody and inertinite may suggest a type-III kerogen, the preponderance of vitrinite input in the Mikambeni shale imparted the kerogen type-III. Meanwhile, vitrinite is composed of lignin, cellulose, and tannins of vascular plants, particularly from the periderm and xylem tissues. Based on the TOC, the quality of the organic matter indicated an excellent source rock since it exceeds the threshold limit of 5.0 wt%. It is important to note that the hydrocarbon generative potential of Mikambeni shale indicated a very good to excellent source potential since it exceeds the threshold classification [65]. The generation potential refers to the summation of free hydrocarbon (S1) and yieldable hydrocarbon (S2) exceeding 10 mg HC/TOC [66].
However, the average PI of the gaseous hydrocarbon suggested a moderately mature source that has the capacity to generate a biogenic gas (Figure 5). Some studies [67,68,69] have attributed the biogenic gas occurrence to a shallower depth where organic matter is decomposed by activities of methane-producing micro-organisms under an anaerobic condition in the absence of sulphate at a shallow burial depth.
![Figure 5
Plot of PI vs T
max showing maturity pathway at a low-level conversion stage [73].](/document/doi/10.1515/geo-2022-0549/asset/graphic/j_geo-2022-0549_fig_005.jpg)
Plot of PI vs T max showing maturity pathway at a low-level conversion stage [73].
Besides the biogenic origin, the isotopic crossplot of δ 13C and δ 16O, as shown in Figure 6, suggested a mixed origin [70]. This relationship between of δ 13C and δ 16O of the organic material suggests a bacterial reduction of organic compounds to CO2 and hydrogen through an enzymatic reaction in the absence of sulphate (Martini et al. [70]; Wang et al. [37]). The mixed-origin gases are thought to form at temperatures ranging from 80 to 160°C, while the biogenic gas mostly form below 80°C [71,72].
![Figure 6
Plot of δ
13C versus δ
16O showing the biogenic domain of the studied shale [70].](/document/doi/10.1515/geo-2022-0549/asset/graphic/j_geo-2022-0549_fig_006.jpg)
Plot of δ 13C versus δ 16O showing the biogenic domain of the studied shale [70].
5.2 Paleo-redox conditions of the depositional environment
Elemental ratios of trace elements such as V/Cr, Ni/Co, Th/U, and V/(V + Ni) can provide useful insights into understanding the paleo-redox condition. Low concentrations of the Th/U ratio typical of anoxic conditions can exhibit values <2 ppm, while dysoxic conditions can range from 2 to 4 ppm [74]. Furthermore, the elemental ratio of V/(V + Ni) with a value >0.5 has been interpreted to represent an organic-rich reducing environment, while <0.5 represents an oxidizing condition [75]. At the same time, Ross and Bustin [76] indicated that Co and Cr are not influenced by redox conditions due to their relation to detrital components. However, the elemental ratios of Ni/Co and V/Cr have been regarded to reflect dysoxic conditions, ranging from 2 to 4.25 [77]. Based on the cross-plots of elemental ratios (Figure 7), the organic-rich sediment of the studied Mikambeni Formation showed dysoxic to anoxic paleo-redox conditions. The anoxic setting is established as all the oxidants in the studied sediments are depleted due to further reduction processes relating to burial depth, thus promoting the activities of sulphide-reducing bacteria [78].
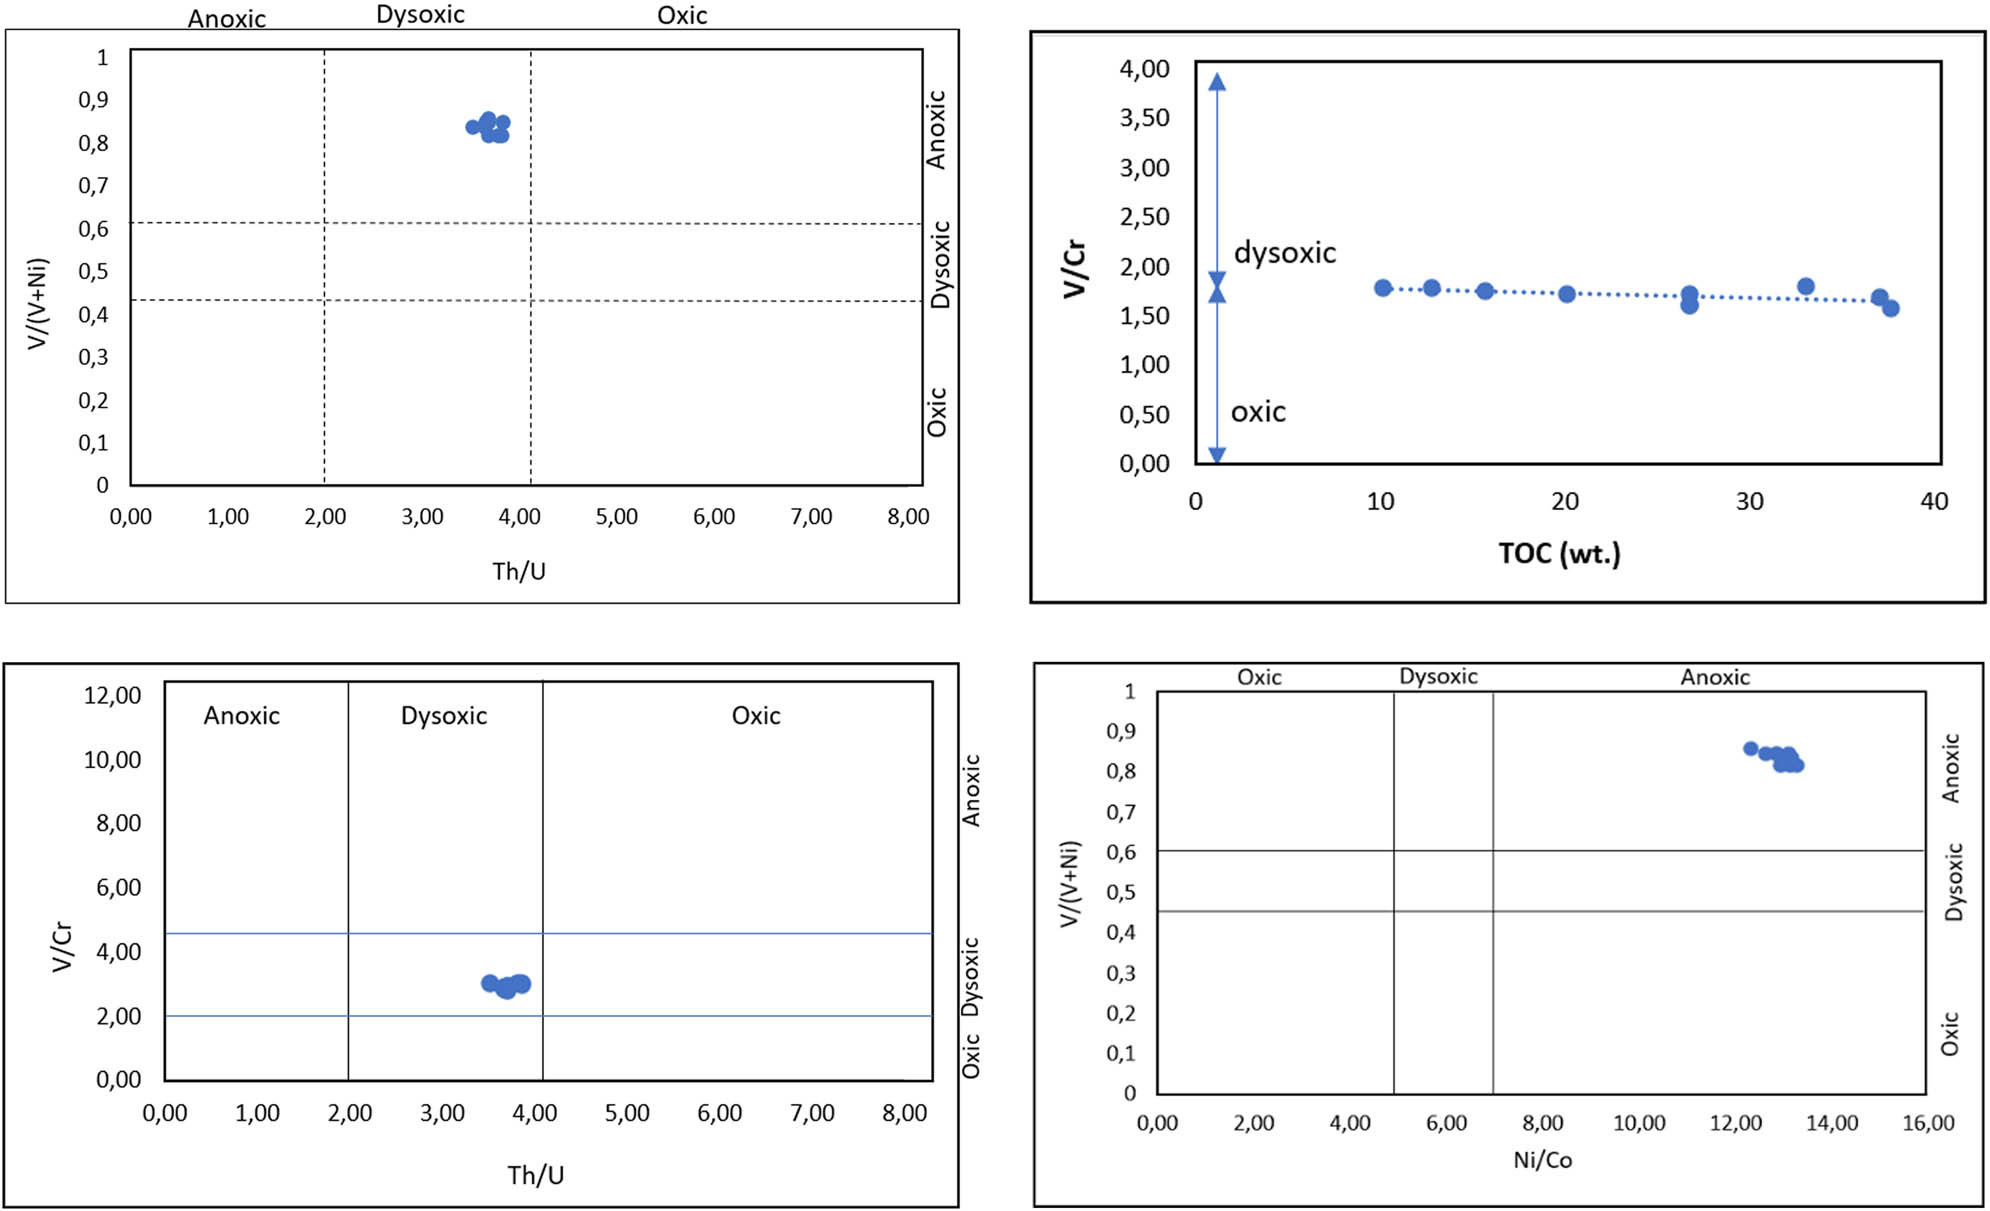
Cross-plots of elemental redox ratios.
Additionally, the Mo content with an average concentration of >30 ppm is close to that of Black Sea-reduced shale sediment [79] and is consistent with Wedepohl [80], which indicated an average concentration of Mo (ave. >10 ppm) in black shale facies. Such Mo concentration tends to favour a depositional environment with oxygen deficiency and anoxia bottom sediment–water interface. Similarly, V and Cr are more enriched in enhanced reducing conditions [81] with high V/Cr ratios revealing pronounced anoxia during OM-rich deposition. They are veritable tools to decipher and discriminate paleo-redox environments under which sedimentary deposits were formed owing to their geochemical resilience to weathering, diagenesis, and sensitivity to redox reactions [57,82]. Meanwhile, the plot of elemental ratios of V and Ni (average: 0.68 ppm) against the TOC of Mikambeni shale showed a strong positive correlation, indicating a reducing condition (Figure 8) [57].
![Figure 8
Cross-plot of V/(V + Ni) against the TOC showing paleo-redox conditions for the Mikambeni shales [57].](/document/doi/10.1515/geo-2022-0549/asset/graphic/j_geo-2022-0549_fig_008.jpg)
Cross-plot of V/(V + Ni) against the TOC showing paleo-redox conditions for the Mikambeni shales [57].
The geochemical proxy ratios of the Eu/Eu* value (0.54–0.69 ppm) with an average value of 0.65 ppm showed an enrichment relative to other concentrations on the chondrite-normalised diagram. The interpretation of the anoxic environment is consistent with the V/(V + Ni) average value of 0.84 ppm which exceeds the 0.54 limit for anoxic conditions. This result is comparable with the V/(V + Ni) average value of 0.80 ppm for Niutitang shale-bearing gas [83]. The positive anomalous concentration of Ce (115.79–132.09 ppm) and enrichment value of Ce* > 1 suggest terrigenous input in an anoxic condition [84]. In an anoxic condition, sulphate reduction may occur with increasing depth alongside concomitant precipitation of FeS2, while Mo may concentrate as a separate phase of insoluble sulphide [69,85]. This reduction reaction may have contributed to the presence of Mo with an average value of 31.25 ppm in the studied carboniferous shale samples.
5.3 Paleo-productivity and paleoclimate
The availability of some elements, including Ba, P, Zn, and sulphide-associated Fe and Cu, can be used as a reliable tool to identify and assess productivity within the bottom sediment–water column. Barium is regarded as a paleo-productivity proxy since the biogenic barite is related to phytoplankton degradation [86]. Sulphide associated with Fe and Zn has been employed by Mansour et al. [87] to reveal redox and paleo-productivity conditions. High sulphide and low Fe contents together with low-to-moderate authigenic enrichment of Zn suggest a slight nutrient supply through the water column [87]. Zinc sulphide and iron sulphide are considered evidence of the reduction process, resulting from sulphide-driven bacteria. With further increase in the burial depth below the sediment–water interface, methanogens begin to degrade the organic matter to generate biogenic gas. This is consistent with previous work [88], which argued that gaseous hydrocarbon is unlikely to form unless all sulphates are depleted while vanadium and nickel are concentrated. For Mikambeni shale, the average concentrations of Zn, Ba, and Cu indicate a strong paleo-productivity under anoxic conditions. Deficiency of oxygen can be attributed to climate and sea level changes, tectonic activities, and hydrographic factors, resulting in an insufficient supply of oxygen to oxidise the organic materials [89,90].
6 Conclusion
The evaluation of carbonaceous shale has revealed the potential to generate unconventional gaseous hydrocarbon. Hydrocarbon parameters including TOC, HI, remaining hydrocarbon potential (S2), generative potential (GP), PI, and thermal maturity indicators (T max, VRo) have shown the predominance of type-III kerogen that is prone to generate gas from matured carbonaceous shale source rock. Furthermore, the carbon isotopic compositions, δ 13C, typify a terrigenous vascular higher plant origin, while the oxygen concentration, δ 16O, suggests an anoxic depositional environment. Additionally, the elemental composition and proxy have indicated a non-marine environment having fluvial and brackish deposition. In conclusion, the carbonaceous shale has the potential to generate unconventional gas from a dominant influx of organic matter derived from terrigenous input and is prone to generate gaseous hydrocarbon without an oil mixture.
Acknowledgement
The author appreciates Prof. Amponsah-Dacosta, Francis, and Dr. Mhlongo Sphiwe Emmanuel for their meaningful and significant contributions to developing this manuscript. Additionally, the author sincerely thanks Mr. Mahlaule Ntiyiso Ally for the support provided during the sample collection. Finally, the author thanks the anonymous reviewers whose scientific inputs have greatly improved this article.
-
Conflict of interest: The author declares that there is no known conflict of interest.
References
[1] Chen L, Jiang Z, Liu Q, Jiang S, Liu K, Tan J, et al. Mechanism of shale gas occurrence: Insights from comparative study on pore structures of marine and lacustrine shales. Mar Pet Geol. 2019;104:200–16.10.1016/j.marpetgeo.2019.03.027Suche in Google Scholar
[2] Xu Y, Li X, Liu Q. Pressure performance of multi-stage fractured horizontal well with stimulated reservoir volume and irregular fractures distribution in shale gas reservoirs. J Nat Gas Sci Eng. 2020;77:103209.10.1016/j.jngse.2020.103209Suche in Google Scholar
[3] Jakob M, Steckel JC. How climate change mitigation could harm development in poor countries. Wiley Interdiscip Rev Clim Change. 2014;5(2):161–8.10.1002/wcc.260Suche in Google Scholar
[4] Altieri KE, Trollip H, Caetano T, Hughes A, Merven B, Winkler H. Achieving development and mitigation objectives through a decarbonization development pathway in South Africa. Clim Policy. 2016;16:S78–91.10.1080/14693062.2016.1150250Suche in Google Scholar
[5] De Kock MO, Beukes NJ, Adeniyi EO, Cole D, Gotz AE, Geel C, et al. Deflating the shale gas potential of South Africa’s Main Karoo basin. South Afr J Sci. 2017;113(9–10):1–12.10.17159/sajs.2017/20160331Suche in Google Scholar
[6] Geel C, Schulz HM, Booth P, deWit M, Horsfield B. Shale gas characteristics of Permian black shales in South Africa: results from recent drilling in the Ecca Group (Eastern Cape). Energy Procedia. 2013;40:256–65.10.1016/j.egypro.2013.08.030Suche in Google Scholar
[7] Watkeys M, Sweeney R. Tuli-Lebombo volcanism and Gondwana rifting. In: Extended abstracts-Geocongress; 1988.Suche in Google Scholar
[8] Bordy EM. Sedimentology of the Karoo Supergroup in the Tuli Basin. Grahamstown, South Africa: Rhodes University; 2000.Suche in Google Scholar
[9] Bordy EM, Catuneanu O. Sedimentology and palaeontology of upper Karoo aeolian strata (Early Jurassic) in the Tuli Basin, South Africa. J Afr Earth Sci. 2002;35(2):301–14.10.1016/S0899-5362(02)00103-3Suche in Google Scholar
[10] Bordy E. Lithostratigraphy of the Tshidzi Formation (Dwyka Group, Karoo Supergroup), South Africa. South Afr J Geol. 2018;121(1):109–18.10.25131/sajg.121.0008Suche in Google Scholar
[11] Denge E, Baiyegunhi C. Maceral types and quality of coal in the Tuli Coalfield: A case study of coal in the Madzaringwe Formation in the vele colliery, Limpopo province, South Africa. Appl Sci. 2021;11(5):2179.10.3390/app11052179Suche in Google Scholar
[12] Malaza N, Liu K, Zhao B. Subsidence Analysis and Burial History of the Late Carboniferous to Early Jurassic Soutpansberg Basin, Limpopo Province, South Africa. Acta Geol Sini‐Engl Ed. 2016;90(6):2000–7.10.1111/1755-6724.13017Suche in Google Scholar
[13] Chidley C. The geology of the country around Evangelina and Pontdrift (1: 50,000 sheets 2228BD and 2229A). Unpublished South African Geological Survey Report. Pietersburg, South Africa: 1985. p. 22.Suche in Google Scholar
[14] Anhaeusser CR, Maske S. Mineral deposits of southern Africa. Pretoria: Geological Society of South Africa; 1986.Suche in Google Scholar
[15] Burke K, Dewey JF. Plume-generated triple junctions: key indicators in applying plate tectonics to old rocks. J Geol. 1973;81(4):406–33.10.1086/627882Suche in Google Scholar
[16] Duguid K. Dwyka and Ecca sedimentation in the Karoo basin of the Sabi Valley, and its tectonic control. Univ Rhodesia Detritus Mennell Soc J. 1975;10:22–37.Suche in Google Scholar
[17] Tankard A, Welsink H, Aukes P, Newton R, Stettler E. Tectonic evolution of the Cape and Karoo basins of South Africa. Mar Pet Geol. 2009;26(8):1379–412.10.1016/j.marpetgeo.2009.01.022Suche in Google Scholar
[18] Turner BR. Tectonostratigraphical development of the Upper Karooforeland basin: Orogenic unloading versus thermally-induced Gondwana rifting. J Afr Earth Sci. 1999;28(1):215–38.10.1016/S0899-5362(99)00025-1Suche in Google Scholar
[19] DeCelles PG, Giles KA. Foreland basin systems. Basin Res. 1996;8(2):105–23.10.1046/j.1365-2117.1996.01491.xSuche in Google Scholar
[20] Catuneanu O. Retroarc foreland systems – evolution through time. J Afr Earth Sci. 2004;38(3):225–42.10.1016/j.jafrearsci.2004.01.004Suche in Google Scholar
[21] Jochum KP, Weis U, Stoll B, Kuzmin D, Yang Q, Raczek I, et al. Determination of reference values for NIST SRM 610–617 glasses following ISO guidelines. Geostand Geoanal Res. 2011;35(4):397–429.10.1111/j.1751-908X.2011.00120.xSuche in Google Scholar
[22] Jochum KP, Nohl U, Herwig K, Lammel E, Stoll B, Hofmann AW. GeoReM: a new geochemical database for reference materials and isotopic standards. Geostand Geoanal Res. 2005;29(3):333–8.10.1111/j.1751-908X.2005.tb00904.xSuche in Google Scholar
[23] Norris A, Danyushevsky L. Towards estimating the complete uncertainty budget of quantified results measured by LA-ICPMS. Boston, MA, USA: Goldschmidt; 2018.Suche in Google Scholar
[24] Jochum KP, Weis U, Schwager B, Stoll B, Wilson SA, Haug GH, et al. Reference values following ISO guidelines for frequently requested rock reference materials. Geostand Geoanal Res. 2016;40(3):333–50.10.1111/j.1751-908X.2015.00392.xSuche in Google Scholar
[25] Longerich HP, Jackson SE, Günther D. Laser ablation inductively coupled plasma mass spectrometric transient signal data acquisition and analyte concentration calculation. J Anal At Spectrom. 1996;11(9):899–904.10.1039/JA9961100899Suche in Google Scholar
[26] Rexer TF, Mathia EJ, Aplin AC, Thomas KM. High-pressure methane adsorption and characterization of pores in Posidonia shales and isolated kerogens. Energy Fuels. 2014;28(5):2886–901.10.1021/ef402466mSuche in Google Scholar
[27] Tang X, Jiang Z, Jiang S, Li Z. Heterogeneous nanoporosity of the Silurian Longmaxi Formation shale gas reservoir in the Sichuan Basin using the QEMSCAN, FIB-SEM, and nano-CT methods. Mar Pet Geol. 2016;78:99–109.10.1016/j.marpetgeo.2016.09.010Suche in Google Scholar
[28] Rachold V, Hubberten H-W. Carbon isotope composition of particulate organic material in East Siberian rivers. In: Land-ocean systems in the Siberian Arctic. Heidelberg: Springer Berlin; 1999. p. 223–38.10.1007/978-3-642-60134-7_21Suche in Google Scholar
[29] Zhang M, Tang Q, Cao C, Lv Z, Zhang T, Zhang D, et al. Molecular and carbon isotopic variation in 3.5 years shale gas production from Longmaxi Formation in Sichuan Basin, China. Mar Pet Geol. 2018;89:27–37.10.1016/j.marpetgeo.2017.01.023Suche in Google Scholar
[30] Broadhead RF, Gillard L. The Barnett Shale in southeastern New Mexico: Distribution, thickness, and source rock characterization. Work. 2007;1:1–57.10.58799/OFR-502Suche in Google Scholar
[31] Jarvie DM, Hill RJ, Pollastro RM, Cardott BJ. Assessment of the gas potential and yields from shales: The Barnett Shale model. Okla Geol Surv Circular. 2005;110(2005):37–50.Suche in Google Scholar
[32] Welte DH, Horsfield B, Baker DR. Petroleum and basin evolution: Insights from petroleum geochemistry, geology and basin modeling. Berlin-Heidelberg: Springer Science & Business Media; 2012.Suche in Google Scholar
[33] Cardott BJ, Landis CR, Curtis ME. Post-oil solid bitumen network in the Woodford Shale, USA – A potential primary migration pathway. Int J Coal Geol. 2015;139:106–13.10.1016/j.coal.2014.08.012Suche in Google Scholar
[34] Wei Y, Jin J, Nie Y, Chen X, Wu L, Fu P, et al. Sources of organic matter and paleo-environmental implications inferred from carbon isotope compositions of lacustrine sediments at Inexpressible Island, Ross Sea, Antarctica. Adv Polar Sci. 2016;27(4):233–44.Suche in Google Scholar
[35] Arnaboldi M, Meyers PA. Data Report: Multi-proxy geochemical characterization of OAE-related black shales at Site 1276, Newfoundland basin. In Proceedings of the Ocean Drilling Program, Scientific Results; 2006.10.2973/odp.proc.sr.210.102.2006Suche in Google Scholar
[36] Wang N, Wen L, Li M, Dai X, Xu Y, Ming Y, et al. The origin of abnormally 13C-depleted organic carbon isotope signatures in the early Cambrian Yangtze Platform. Mar Pet Geol. 2021;128:105051.10.1016/j.marpetgeo.2021.105051Suche in Google Scholar
[37] Wang F, Guo S. Upper paleozoic transitional shale gas enrichment factors: A case study of typical areas in China. Minerals. 2020;10(2):194.10.3390/min10020194Suche in Google Scholar
[38] Parkes RJ, Wellsbury P, Mather ID, Cobb SJ, Cragg BA, Hornibrook ER, et al. Temperature activation of organic matter and minerals during burial has the potential to sustain the deep biosphere over geological timescales. Org Geochem. 2007;38(6):845–52.10.1016/j.orggeochem.2006.12.011Suche in Google Scholar
[39] McCarthy K, Rojas K, Niemann M, Palmowski D, Peters K, Stankiewicz A. Basic petroleum geochemistry for source rock evaluation. Oilfield Rev. 2011;23(2):32–43.Suche in Google Scholar
[40] Gong C, Hollander DJ. Differential contribution of bacteria to sedimentary organic matter in oxic and anoxic environments, Santa Monica Basin, California. Org Geochem. 1997;26(9–10):545–63.10.1016/S0146-6380(97)00018-1Suche in Google Scholar
[41] Freixa A, Rubol S, Carles-Brangarí A, Fernàndez-Garcia D, Butturini A, Sanchez-Vila X, et al. The effects of sediment depth and oxygen concentration on the use of organic matter: An experimental study using an infiltration sediment tank. Sci Total Environ. 2016;540:20–31.10.1016/j.scitotenv.2015.04.007Suche in Google Scholar PubMed
[42] Akintola GO, Ikhane PR, Amponsah-Dacosta F, Adeagbo AF, Mhlongo SE, Edokpayi JN, et al. Geochemical evaluation of the carbonaceous shale of the upper cretaceous Anambra Basin for potential gas generation, Nigeria. Arab J Geosci. 2021;14(6):1–14.10.1007/s12517-021-06813-0Suche in Google Scholar
[43] Hayashi KI, Fujisawa H, Holland HD, Ohmoto H. Geochemistry of ∼1.9 Ga sedimentary rocks from northeastern Labrador, Canada. Geochim Cosmochim Acta. 1997;61(19):4115–37.10.1016/S0016-7037(97)00214-7Suche in Google Scholar
[44] Mesquita CJS, Dall’Agnol R, Almeida JD. Mineral chemistry and crystallization parameters of the A-type Paleoproterozoic Bannach granite, Carajás Province, Pará, Brazil. Braz J Geol. 2018;48:575–601.10.1590/2317-4889201820170082Suche in Google Scholar
[45] McLennan SM. Relationships between the trace element composition of sedimentary rocks and upper continental crust. Geochem Geophys Geosyst. 2001;2(4).10.1029/2000GC000109Suche in Google Scholar
[46] McLennan SM, Taylor SR, Hemming SR. Composition, differentiation, and evolution of continental crust: constraints from sedimentary rocks and heat flow. Heidelberg: Cambridge University Press; 2006.Suche in Google Scholar
[47] Cox R, Lowe DR, Cullers R. The influence of sediment recycling and basement composition on evolution of mudrock chemistry in the southwestern United States. Geochim Cosmochim Acta. 1995;59(14):2919–40.10.1016/0016-7037(95)00185-9Suche in Google Scholar
[48] Baiyegunhi C, Liu K, Wagner N, Gwavava O, Oloniniyi TL. Geochemical evaluation of the Permian Ecca shale in Eastern Cape Province, South Africa: Implications for shale gas potential. Acta Geol Sini‐Eng Ed. 2018;92(3):1193–217.10.1111/1755-6724.13599Suche in Google Scholar
[49] Hanor JS. Barite–celestine geochemistry and environments of formation. Rev Mineral Geochem. 2000;40(1):193–275.10.2138/rmg.2000.40.4Suche in Google Scholar
[50] Saba T. Hydraulic fracturing: Data analysis methods to identify sources of dissolved gas and chemical compounds in drinking water wells. Introduction Environ Forensics. 2015;513–29.10.1016/B978-0-12-404696-2.00014-XSuche in Google Scholar
[51] Li Y, Zhang T, Ellis GS, Shao D. Depositional environment and organic matter accumulation of Upper Ordovician–Lower Silurian marine shale in the Upper Yangtze Platform, South China. Palaeogeogr Palaeoclimatol Palaeoecol. 2017;466:252–64.10.1016/j.palaeo.2016.11.037Suche in Google Scholar
[52] Wu C, Tuo J, Zhang M, Liu Y, Xing L, Gong J, et al. Multiple controlling factors of lower Palaeozoic organic-rich marine shales in the Sichuan Basin, China: Evidence from minerals and trace elements. Energy Explor Exploit. 2017;35(5):627–44.10.1177/0144598717709667Suche in Google Scholar
[53] Hönisch B, Hemming NG. Ground‐truthing the boron isotope‐paleo‐pH proxy in planktonic foraminifera shells: Partial dissolution and shell size effects. Paleoceanography. 2004;19(4).10.1029/2004PA001026Suche in Google Scholar
[54] Charriau A, Lesven L, Gao Y, Leermakers M, Baeyens W, Ouddane B, et al. Trace metal behaviour in riverine sediments: role of organic matter and sulfides. Appl Geochem. 2011;26(1):80–90.10.1016/j.apgeochem.2010.11.005Suche in Google Scholar
[55] Huang Z, Wang X, Yang X, Zhu R, Cui J, Shi W, et al. Paleoenvironment and Organic Matter Accumulation of the Upper Ordovician-Lower Silurian, in Upper Yangtze Region, South China: Constraints from Multiple Geochemical Proxies. Energies. 2020;13(4):858.10.3390/en13040858Suche in Google Scholar
[56] Frape SK, Blyth A, Blomqvist R, Mcnutt RH, Gascoyne M. Deep fluids in continents: II Crystalline rocks, In surface and groundwater, weathering, and Soils. In: Drever JI, editor. Treatise on Geochemistry. Vol. 5. Oxford: Elsevier-Pergamon; 2003.10.1016/B0-08-043751-6/05086-6Suche in Google Scholar
[57] Ferriday T, Montenari M. Chemostratigraphy and chemofacies of source rock analogues: A high-resolution analysis of black shale successions from the Lower Silurian Formigoso Formation (Cantabrian Mountains, NW Spain). In: Stratigraphy & timescales. Madrid; 2016. p. 123–255.10.1016/bs.sats.2016.10.004Suche in Google Scholar
[58] Han S, Zhang Y, Huang J, Rui Y, Tang Z. Elemental geochemical characterization of sedimentary conditions and organic matter enrichment for Lower Cambrian shale formations in Northern Guizhou, South China. Minerals. 2020;10(9):793.10.3390/min10090793Suche in Google Scholar
[59] Armstrong-Altrin S, Montiel-Garcia C, Ramos-Vazquez A. Textural and geochemical characteristics of late Pleistocene to Holocene fine-grained deep-sea sediment cores (GM6 and GM7), recovered from southwestern Gulf of Mexico. J Palaeogeogr. 2018;7(1):3.10.1186/s42501-018-0005-3Suche in Google Scholar
[60] Jong J, Kessler FL. The Setap Shale Formation on either side of the Baram Line Divide: Facies aspects and tectonic implications. Bull Geol Soc Malays. 2019;67:53–65.10.7186/bgsm67201907Suche in Google Scholar
[61] Mclennan SM. Rare earth elements in sedimentary rocks: influence of provenance and sedimentary processes. In: Geochemistry and Mineralogy of Rare Earth Elements. Berlin; 2018. p. 169–200.10.1515/9781501509032-010Suche in Google Scholar
[62] Nagarajan R, Armstrong-Altrin JS, Kessler FL, Jong J. Petrological and geochemical constraints on provenance, paleoweathering, and tectonic setting of clastic sediments from the Neogene Lambir and Sibuti Formations, northwest Borneo. In: Sediment Provenance; 2017. p. 123–53.10.1016/B978-0-12-803386-9.00007-1Suche in Google Scholar
[63] Ayinla HA, Abdullah WH, Makeen YM, Abubakar MB, Jauro A, Yandoka BMS, et al. Source rock characteristics, depositional setting and hydrocarbon generation potential of Cretaceous coals and organic rich mudstones from Gombe Formation, Gongola Sub-basin, Northern Benue Trough, NE Nigeria. Int J Coal Geol. 2017;173:212–26.10.1016/j.coal.2017.02.011Suche in Google Scholar
[64] Tissot B. Recent advances in petroleum geochemistry applied to hydrocarbon exploration. AAPG Bull. 1984;68(5):545–63.10.1306/AD461336-16F7-11D7-8645000102C1865DSuche in Google Scholar
[65] Welte D, Tissot P. Petroleum formation and occurrence. Berlin-Heidelberg: Springer; 1984.10.1007/978-3-642-87813-8Suche in Google Scholar
[66] Hunt JM. Petroleum geochemistry and geology (2nd ed.). United Kingdom: WH Freeman Company; 1995.Suche in Google Scholar
[67] Li N, Feng Z, Huang H, Wang X, Dong Z. Lithological and diagenetic restrictions on biogenic gas generation in Songliao Basin inferred from grain size distribution and permeability measurement. Bull Can Pet Geol. 2015;63(1):66–74.10.2113/gscpgbull.63.1.66Suche in Google Scholar
[68] Stolper DA, Lawson M, Davis CL, Ferreira AA, Neto ES, Ellis GS, et al. Formation temperatures of thermogenic and biogenic methane. Science. 2014;344(6191):1500–3.10.1126/science.1254509Suche in Google Scholar PubMed
[69] Rice DD, Claypool GE. Generation, accumulation, and resource potential of biogenic gas. AAPG Bull. 1981;65(1):5–25.10.1306/2F919765-16CE-11D7-8645000102C1865DSuche in Google Scholar
[70] Martini AM, Budai JM, Walter LM, Schoell M. Microbial generation of economic accumulations of methane within a shallow organic-rich shale. Nature. 1996;383(6596):155–8.10.1038/383155a0Suche in Google Scholar
[71] Stolper DA, Martini AM, Clog M, Douglas PM, Shusta SS, Valentine DL, et al. Distinguishing and understanding thermogenic and biogenic sources of methane using multiply substituted isotopologues. Geochim Cosmochim Acta. 2015;161:219–47.10.1016/j.gca.2015.04.015Suche in Google Scholar
[72] Quigley T, Mackenzie A. The temperatures of oil and gas formation in the sub-surface. Nature. 1988;333(6173):549–52.10.1038/333549a0Suche in Google Scholar
[73] Togunwa OS, Abdullah WH, Hakimi MH, Barbeito PJ. Organic geochemical and petrographic characteristics of Neogene organic-rich sediments from the onshore West Baram Delta Province, Sarawak Basin: Implications for source rocks and hydrocarbon generation potential. Mar Pet Geol. 2015;63:115–26.10.1016/j.marpetgeo.2015.02.032Suche in Google Scholar
[74] Wignall PB, Myers KJ. Interpreting benthic oxygen levels in mudrocks: a new approach. Geology. 1988;16(5):452–5.10.1130/0091-7613(1988)016<0452:IBOLIM>2.3.CO;2Suche in Google Scholar
[75] Hatch J, Leventhal J. Relationship between inferred redox potential of the depositional environment and geochemistry of the Upper Pennsylvanian (Missourian) Stark Shale Member of the Dennis Limestone, Wabaunsee County, Kansas, USA. Chem Geol. 1992;99(1–3):65–82.10.1016/0009-2541(92)90031-YSuche in Google Scholar
[76] Ross DJ, Bustin RM. Investigating the use of sedimentary geochemical proxies for paleoenvironment interpretation of thermally mature organic-rich strata: Examples from the Devonian–Mississippian shales, Western Canadian Sedimentary Basin. Chem Geol. 2009;260(1–2):1–19.10.1016/j.chemgeo.2008.10.027Suche in Google Scholar
[77] Jones B, Manning DA. Comparison of geochemical indices used for the interpretation of palaeoredox conditions in ancient mudstones. Chem Geol. 1994;111(1–4):111–29.10.1016/0009-2541(94)90085-XSuche in Google Scholar
[78] Capotondi L, Girone A, Lirer F, Bergami C, Verducci M, Vallefuoco M, et al. Central Mediterranean Mid-Pleistocene paleoclimatic variability and its association with global climate. Palaeogeogr Palaeoclimatol Palaeoecol. 2016;442:72–83.10.1016/j.palaeo.2015.11.009Suche in Google Scholar
[79] Vine JD, Tourtelot EB. Geochemistry of black shale deposits; a summary report. Econ Geol. 1970;65(3):253–72.10.2113/gsecongeo.65.3.253Suche in Google Scholar
[80] Wedepohl K. The composition of the upper earth’s crust and the natural cycles of selected metals. Metal in natural raw materials, natural resources. Metals and their compounds in the environment, analysis and biological relevance. New York; 1991. p. 3–17.Suche in Google Scholar
[81] Tribovillard N, Algeo TJ, Lyons T, Riboulleau A. Trace metals as paleoredox and paleoproductivity proxies: an update. Chem Geol. 2006;232(1–2):12–32.10.1016/j.chemgeo.2006.02.012Suche in Google Scholar
[82] Pieta IS, Rathi A, Pieta P, Nowakowski R, Hołdynski M, Pisarek M, et al. Electrocatalytic methanol oxidation over Cu, Ni and bimetallic Cu-Ni nanoparticles supported on graphitic carbon nitride. Appl Catal B: Environ. 2019;244:272–83.10.1016/j.apcatb.2018.10.072Suche in Google Scholar
[83] Wu C, Tuo J, Zhang M, Sun L, Qian Y, Liu Y. Sedimentary and residual gas geochemical characteristics of the Lower Cambrian organic-rich shales in Southeastern Chongqing, China. Mar Pet Geol. 2016;75:140–50.10.1016/j.marpetgeo.2016.04.013Suche in Google Scholar
[84] Anawar HM, Yoshioka T, Konohira E, Akai J, Freitas MC, Tareq SM. Sources of organic carbon and depositional environment in the Bengal delta plain sediments during the Holocene period. Limnology. 2010;11(2):133–42.10.1007/s10201-009-0301-9Suche in Google Scholar
[85] Calvert S, Pedersen T. Geochemistry of recent oxic and anoxic marine sediments: implications for the geological record. Mar Geol. 1993;113(1–2):67–88.10.1016/0025-3227(93)90150-TSuche in Google Scholar
[86] Zhao J, Jin Z, Jin Z, Geng Y, Wen X, Yan C. Applying sedimentary geochemical proxies for paleoenvironment interpretation of organic-rich shale deposition in the Sichuan Basin, China. Int J Coal Geol. 2016;163:52–71.10.1016/j.coal.2016.06.015Suche in Google Scholar
[87] Mansour A, Wagreich M, Gentzis T, Ocubalidet S, Tahoun SS, Elewa AM. Depositional and organic carbon-controlled regimes during the Coniacian-Santonian event: First results from the southern Tethys (Egypt). Mar Pet Geol. 2020;115:104285.10.1016/j.marpetgeo.2020.104285Suche in Google Scholar
[88] Tourtelot HA. Black shale – its deposition and diagenesis. Clays Clay Miner. 1979;27:313–21.10.1346/CCMN.1979.0270501Suche in Google Scholar
[89] Dar S, Khan K, Birch W. Sedimentary: Phosphates. Reference Module in Earth Systems and Environmental Sciences. Netherlands: Elsevier; 2017.10.1016/B978-0-12-409548-9.10509-3Suche in Google Scholar
[90] Dean WE, Arthur MA. Iron-sulfur-carbon relationships in organic-carbon-rich sequences; I, Cretaceous Western Interior Seaway. Am J Sci. 1989;289(6):708–43.10.2475/ajs.289.6.708Suche in Google Scholar
© 2023 the author(s), published by De Gruyter
This work is licensed under the Creative Commons Attribution 4.0 International License.
Artikel in diesem Heft
- Regular Articles
- Diagenesis and evolution of deep tight reservoirs: A case study of the fourth member of Shahejie Formation (cg: 50.4-42 Ma) in Bozhong Sag
- Petrography and mineralogy of the Oligocene flysch in Ionian Zone, Albania: Implications for the evolution of sediment provenance and paleoenvironment
- Biostratigraphy of the Late Campanian–Maastrichtian of the Duwi Basin, Red Sea, Egypt
- Structural deformation and its implication for hydrocarbon accumulation in the Wuxia fault belt, northwestern Junggar basin, China
- Carbonate texture identification using multi-layer perceptron neural network
- Metallogenic model of the Hongqiling Cu–Ni sulfide intrusions, Central Asian Orogenic Belt: Insight from long-period magnetotellurics
- Assessments of recent Global Geopotential Models based on GPS/levelling and gravity data along coastal zones of Egypt
- Accuracy assessment and improvement of SRTM, ASTER, FABDEM, and MERIT DEMs by polynomial and optimization algorithm: A case study (Khuzestan Province, Iran)
- Uncertainty assessment of 3D geological models based on spatial diffusion and merging model
- Evaluation of dynamic behavior of varved clays from the Warsaw ice-dammed lake, Poland
- Impact of AMSU-A and MHS radiances assimilation on Typhoon Megi (2016) forecasting
- Contribution to the building of a weather information service for solar panel cleaning operations at Diass plant (Senegal, Western Sahel)
- Measuring spatiotemporal accessibility to healthcare with multimodal transport modes in the dynamic traffic environment
- Mathematical model for conversion of groundwater flow from confined to unconfined aquifers with power law processes
- NSP variation on SWAT with high-resolution data: A case study
- Reconstruction of paleoglacial equilibrium-line altitudes during the Last Glacial Maximum in the Diancang Massif, Northwest Yunnan Province, China
- A prediction model for Xiangyang Neolithic sites based on a random forest algorithm
- Determining the long-term impact area of coastal thermal discharge based on a harmonic model of sea surface temperature
- Origin of block accumulations based on the near-surface geophysics
- Investigating the limestone quarries as geoheritage sites: Case of Mardin ancient quarry
- Population genetics and pedigree geography of Trionychia japonica in the four mountains of Henan Province and the Taihang Mountains
- Performance audit evaluation of marine development projects based on SPA and BP neural network model
- Study on the Early Cretaceous fluvial-desert sedimentary paleogeography in the Northwest of Ordos Basin
- Detecting window line using an improved stacked hourglass network based on new real-world building façade dataset
- Automated identification and mapping of geological folds in cross sections
- Silicate and carbonate mixed shelf formation and its controlling factors, a case study from the Cambrian Canglangpu formation in Sichuan basin, China
- Ground penetrating radar and magnetic gradient distribution approach for subsurface investigation of solution pipes in post-glacial settings
- Research on pore structures of fine-grained carbonate reservoirs and their influence on waterflood development
- Risk assessment of rain-induced debris flow in the lower reaches of Yajiang River based on GIS and CF coupling models
- Multifractal analysis of temporal and spatial characteristics of earthquakes in Eurasian seismic belt
- Surface deformation and damage of 2022 (M 6.8) Luding earthquake in China and its tectonic implications
- Differential analysis of landscape patterns of land cover products in tropical marine climate zones – A case study in Malaysia
- DEM-based analysis of tectonic geomorphologic characteristics and tectonic activity intensity of the Dabanghe River Basin in South China Karst
- Distribution, pollution levels, and health risk assessment of heavy metals in groundwater in the main pepper production area of China
- Study on soil quality effect of reconstructing by Pisha sandstone and sand soil
- Understanding the characteristics of loess strata and quaternary climate changes in Luochuan, Shaanxi Province, China, through core analysis
- Dynamic variation of groundwater level and its influencing factors in typical oasis irrigated areas in Northwest China
- Creating digital maps for geotechnical characteristics of soil based on GIS technology and remote sensing
- Changes in the course of constant loading consolidation in soil with modeled granulometric composition contaminated with petroleum substances
- Correlation between the deformation of mineral crystal structures and fault activity: A case study of the Yingxiu-Beichuan fault and the Milin fault
- Cognitive characteristics of the Qiang religious culture and its influencing factors in Southwest China
- Spatiotemporal variation characteristics analysis of infrastructure iron stock in China based on nighttime light data
- Interpretation of aeromagnetic and remote sensing data of Auchi and Idah sheets of the Benin-arm Anambra basin: Implication of mineral resources
- Building element recognition with MTL-AINet considering view perspectives
- Characteristics of the present crustal deformation in the Tibetan Plateau and its relationship with strong earthquakes
- Influence of fractures in tight sandstone oil reservoir on hydrocarbon accumulation: A case study of Yanchang Formation in southeastern Ordos Basin
- Nutrient assessment and land reclamation in the Loess hills and Gulch region in the context of gully control
- Handling imbalanced data in supervised machine learning for lithological mapping using remote sensing and airborne geophysical data
- Spatial variation of soil nutrients and evaluation of cultivated land quality based on field scale
- Lignin analysis of sediments from around 2,000 to 1,000 years ago (Jiulong River estuary, southeast China)
- Assessing OpenStreetMap roads fitness-for-use for disaster risk assessment in developing countries: The case of Burundi
- Transforming text into knowledge graph: Extracting and structuring information from spatial development plans
- A symmetrical exponential model of soil temperature in temperate steppe regions of China
- A landslide susceptibility assessment method based on auto-encoder improved deep belief network
- Numerical simulation analysis of ecological monitoring of small reservoir dam based on maximum entropy algorithm
- Morphometry of the cold-climate Bory Stobrawskie Dune Field (SW Poland): Evidence for multi-phase Lateglacial aeolian activity within the European Sand Belt
- Adopting a new approach for finding missing people using GIS techniques: A case study in Saudi Arabia’s desert area
- Geological earthquake simulations generated by kinematic heterogeneous energy-based method: Self-arrested ruptures and asperity criterion
- Semi-automated classification of layered rock slopes using digital elevation model and geological map
- Geochemical characteristics of arc fractionated I-type granitoids of eastern Tak Batholith, Thailand
- Lithology classification of igneous rocks using C-band and L-band dual-polarization SAR data
- Analysis of artificial intelligence approaches to predict the wall deflection induced by deep excavation
- Evaluation of the current in situ stress in the middle Permian Maokou Formation in the Longnüsi area of the central Sichuan Basin, China
- Utilizing microresistivity image logs to recognize conglomeratic channel architectural elements of Baikouquan Formation in slope of Mahu Sag
- Resistivity cutoff of low-resistivity and low-contrast pays in sandstone reservoirs from conventional well logs: A case of Paleogene Enping Formation in A-Oilfield, Pearl River Mouth Basin, South China Sea
- Examining the evacuation routes of the sister village program by using the ant colony optimization algorithm
- Spatial objects classification using machine learning and spatial walk algorithm
- Study on the stabilization mechanism of aeolian sandy soil formation by adding a natural soft rock
- Bump feature detection of the road surface based on the Bi-LSTM
- The origin and evolution of the ore-forming fluids at the Manondo-Choma gold prospect, Kirk range, southern Malawi
- A retrieval model of surface geochemistry composition based on remotely sensed data
- Exploring the spatial dynamics of cultural facilities based on multi-source data: A case study of Nanjing’s art institutions
- Study of pore-throat structure characteristics and fluid mobility of Chang 7 tight sandstone reservoir in Jiyuan area, Ordos Basin
- Study of fracturing fluid re-discharge based on percolation experiments and sampling tests – An example of Fuling shale gas Jiangdong block, China
- Impacts of marine cloud brightening scheme on climatic extremes in the Tibetan Plateau
- Ecological protection on the West Coast of Taiwan Strait under economic zone construction: A case study of land use in Yueqing
- The time-dependent deformation and damage constitutive model of rock based on dynamic disturbance tests
- Evaluation of spatial form of rural ecological landscape and vulnerability of water ecological environment based on analytic hierarchy process
- Fingerprint of magma mixture in the leucogranites: Spectroscopic and petrochemical approach, Kalebalta-Central Anatolia, Türkiye
- Principles of self-calibration and visual effects for digital camera distortion
- UAV-based doline mapping in Brazilian karst: A cave heritage protection reconnaissance
- Evaluation and low carbon ecological urban–rural planning and construction based on energy planning mechanism
- Modified non-local means: A novel denoising approach to process gravity field data
- A novel travel route planning method based on an ant colony optimization algorithm
- Effect of time-variant NDVI on landside susceptibility: A case study in Quang Ngai province, Vietnam
- Regional tectonic uplift indicated by geomorphological parameters in the Bahe River Basin, central China
- Computer information technology-based green excavation of tunnels in complex strata and technical decision of deformation control
- Spatial evolution of coastal environmental enterprises: An exploration of driving factors in Jiangsu Province
- A comparative assessment and geospatial simulation of three hydrological models in urban basins
- Aquaculture industry under the blue transformation in Jiangsu, China: Structure evolution and spatial agglomeration
- Quantitative and qualitative interpretation of community partitions by map overlaying and calculating the distribution of related geographical features
- Numerical investigation of gravity-grouted soil-nail pullout capacity in sand
- Analysis of heavy pollution weather in Shenyang City and numerical simulation of main pollutants
- Road cut slope stability analysis for static and dynamic (pseudo-static analysis) loading conditions
- Forest biomass assessment combining field inventorying and remote sensing data
- Late Jurassic Haobugao granites from the southern Great Xing’an Range, NE China: Implications for postcollision extension of the Mongol–Okhotsk Ocean
- Petrogenesis of the Sukadana Basalt based on petrology and whole rock geochemistry, Lampung, Indonesia: Geodynamic significances
- Numerical study on the group wall effect of nodular diaphragm wall foundation in high-rise buildings
- Water resources utilization and tourism environment assessment based on water footprint
- Geochemical evaluation of the carbonaceous shale associated with the Permian Mikambeni Formation of the Tuli Basin for potential gas generation, South Africa
- Detection and characterization of lineaments using gravity data in the south-west Cameroon zone: Hydrogeological implications
- Study on spatial pattern of tourism landscape resources in county cities of Yangtze River Economic Belt
- The effect of weathering on drillability of dolomites
- Noise masking of near-surface scattering (heterogeneities) on subsurface seismic reflectivity
- Query optimization-oriented lateral expansion method of distributed geological borehole database
- Petrogenesis of the Morobe Granodiorite and their shoshonitic mafic microgranular enclaves in Maramuni arc, Papua New Guinea
- Environmental health risk assessment of urban water sources based on fuzzy set theory
- Spatial distribution of urban basic education resources in Shanghai: Accessibility and supply-demand matching evaluation
- Spatiotemporal changes in land use and residential satisfaction in the Huai River-Gaoyou Lake Rim area
- Walkaway vertical seismic profiling first-arrival traveltime tomography with velocity structure constraints
- Study on the evaluation system and risk factor traceability of receiving water body
- Predicting copper-polymetallic deposits in Kalatag using the weight of evidence model and novel data sources
- Temporal dynamics of green urban areas in Romania. A comparison between spatial and statistical data
- Passenger flow forecast of tourist attraction based on MACBL in LBS big data environment
- Varying particle size selectivity of soil erosion along a cultivated catena
- Relationship between annual soil erosion and surface runoff in Wadi Hanifa sub-basins
- Influence of nappe structure on the Carboniferous volcanic reservoir in the middle of the Hongche Fault Zone, Junggar Basin, China
- Dynamic analysis of MSE wall subjected to surface vibration loading
- Pre-collisional architecture of the European distal margin: Inferences from the high-pressure continental units of central Corsica (France)
- The interrelation of natural diversity with tourism in Kosovo
- Assessment of geosites as a basis for geotourism development: A case study of the Toplica District, Serbia
- IG-YOLOv5-based underwater biological recognition and detection for marine protection
- Monitoring drought dynamics using remote sensing-based combined drought index in Ergene Basin, Türkiye
- Review Articles
- The actual state of the geodetic and cartographic resources and legislation in Poland
- Evaluation studies of the new mining projects
- Comparison and significance of grain size parameters of the Menyuan loess calculated using different methods
- Scientometric analysis of flood forecasting for Asia region and discussion on machine learning methods
- Rainfall-induced transportation embankment failure: A review
- Rapid Communication
- Branch fault discovered in Tangshan fault zone on the Kaiping-Guye boundary, North China
- Technical Note
- Introducing an intelligent multi-level retrieval method for mineral resource potential evaluation result data
- Erratum
- Erratum to “Forest cover assessment using remote-sensing techniques in Crete Island, Greece”
- Addendum
- The relationship between heat flow and seismicity in global tectonically active zones
- Commentary
- Improved entropy weight methods and their comparisons in evaluating the high-quality development of Qinghai, China
- Special Issue: Geoethics 2022 - Part II
- Loess and geotourism potential of the Braničevo District (NE Serbia): From overexploitation to paleoclimate interpretation