
Dynamic variation of groundwater level and its influencing factors in typical oasis irrigated areas in Northwest China
-
Wenzan Wang
 ,
Bing Liu
,
Yue Pan
,
Bing Liu
,
Yue Pan

Abstract
It is essential to analyze the dynamic characteristics of regional groundwater levels and their driving factors for the rational development of groundwater in irrigated areas. This article explores the spatial distribution characteristics of the amplitude of groundwater level change in the Shihezi irrigated area by using the ArcGIS interpolation method and contrast coefficient variance method and analyzes the influence factors of dynamic change of groundwater levels by integrating the grey relational degree and path analysis methods and obtaining the sensitivity of each influencing factor to changes in groundwater levels and the relative importance of the influencing factors. The following results are obtained: (1) the groundwater level of the Shihezi irrigated area showed an overall increasing trend from 2012 to 2019, with a fluctuation range of 12.26–14.14 m. The groundwater level in the southeast of the irrigated area showed an upward trend, while the groundwater level in the northwest area showed a downward trend. (2) The groundwater level in the irrigated area first increased, then decreased, and then increased again. The variance of the contrast coefficient in the irrigated area ranged from 0.04 to 11.31, and the fluctuation range of the groundwater level in the central area was higher than that in the northern and southern areas. (3) The irrigated area of cultivated land and evaporation are the main factors affecting groundwater level change in the Shihezi irrigated area. The grey relation analysis shows that the irrigated area of cultivated land has the highest grey correlation degree with the evolution of the groundwater level, which is 0.947, and the average grey correlation index is between 0.74 and 0.95. Path analysis showed that the irrigated area of cultivated land, surface water usage, and evaporation were the main factors affecting groundwater levels. Human activities are one of the main driving forces of groundwater level change, and the research results provide a theoretical basis for the rational utilization and sustainable development of groundwater resources in the Shihezi irrigation area.
1 Introduction
As an essential storage component in the hydrological system, groundwater interacts with surface water, soil, plants, and other land waters to jointly maintain the terrestrial oasis ecosystem [1,2]. The dynamic change in groundwater levels is a result of the comprehensive action of natural and human factors on the groundwater system [3] and a quantitative reflection of the reasonable development degree of regional groundwater resources [4]. The change in groundwater levels will affect the growth of crops, the safety of life and production, and the ecological environment of groundwater. Therefore, studying the dynamic change characteristics of groundwater levels and their influencing factors can provide a theoretical basis for the rational exploitation of groundwater and is of great significance for ecological protection [5].
Domestic and foreign scholars have analyzed and studied the dynamic change in groundwater levels and its influencing factors. Based on satellite data and Google Earth Engine, Hawzhin et al. studied and found that the groundwater level of Lake Urmia Basin in northwest Iran showed a significant downward trend through the Mann–Kendall test and built the PROPHET model under time series for groundwater level prediction [6]. Lee et al. used an artificial neural network model to predict groundwater, evaluate the influencing factors, and obtain each factor’s contribution to the fluctuation of groundwater levels according to spatiotemporal changes [7]. Based on the multi-variable time series model, Li et al. established a dynamic response model of groundwater levels to environmental changes in the double irrigation area of ditch-well in Guanzhong Plain, Shaanxi Province, and concluded that precipitation, evaporation, channel-head diversion, and the proportion of water used in ditch-well were the leading external environmental factors affecting the groundwater circulation in the irrigation area [8]. It is concluded that the decrease in precipitation and groundwater replenishment and the increase in evaporation and excretion decrease the groundwater level year by year. Chang et al. clarified the variation characteristics and mechanisms of shallow groundwater levels in the Yellow River Delta region through time series analysis [9]. Zhang et al. explored the variation characteristics of the groundwater level in Huantai County, Shandong Province, and found that precipitation, mining, and river recharge were the main reasons for the variation based on the analysis of the spatiotemporal dynamic variation of the groundwater level [10].
Currently, the research on groundwater water level change in irrigated areas mainly focuses on the law and mechanism analysis of groundwater level change, the prediction of the groundwater level after water-saving measures, and the influence of the groundwater level on crop growth and soil water–salt environment. The dynamic change of groundwater levels is closely related to human and natural climate factors [11]. Various influencing factors have a particular relationship, so the water cycle process is complicated [12]. The Shihezi irrigated area is located in the hinterland of a northwest arid region in our country, and the unique mountain basin potential structure determines its unique runoff cycle characteristics. With the advancement of the oasis process, the demand for water resources in irrigated areas is increasing [13]. This article uses the Shihezi irrigated area, a typical oasis in northwest China, as the study area. The characteristics of dynamic change of groundwater levels and its sensitivity influencing factors are analyzed using contrast coefficient variance and path analysis, which provides a theoretical basis for sustainable utilization of regional groundwater.
2 Methods
2.1 Study area
Shihezi irrigation area is located in the middle of the north foot of the Tianshan Mountain and the southern margin of the Junggar Basin (Figure 1). It is located in E84°43′∼E86°35′, N43°21′∼N45°20′, belonging to the temperate continental arid climate, with scarce precipitation and intense evaporation [14]. The average annual temperature is 7.08–8.36°C, the annual precipitation is 115–200 mm, and the annual evaporation is 1,500–2,100 mm [15]. Surface water and groundwater in the irrigated area come from the same source, mainly from the precipitation and melting of snow and ice in the southern mountains [16]. Through runoff and subsurface flow, the river water flowing through the quaternary formation begins to infiltrate and recharge the groundwater in large quantities [17,18]. The drainage methods mainly include overflow springs, evaporation, and artificial mining [19]. The direction of groundwater runoff in the irrigation area is roughly from south to north, and the distribution is generally consistent with the surface topography.

Geographical location of the study area.
2.2 Data sources
In this article, meteorological data, water resource utilization, groundwater, and surface water usage are derived from the Xinjiang Statistical Yearbook (2012–2019), Shihezi City of Xinjiang Uygur Autonomous Region Groundwater Resources Development and Utilization Planning Report, and Shihezi City Water Conservancy Drip Irrigation Report of the Eighth Division (2012–2019). The groundwater table data are derived from the monitoring data of groundwater long observation wells (2012–2019). The data of the observation well are read every other day. The water level data include the longitude and latitude of the observation well, the elevation of the orifice, the elevation of the water level, the buried depth of the water level, and the air temperature.
2.3 Contrast coefficient variance analysis
As a variable volatility evaluation index, the contrast coefficient reflects the anomaly degree of sample data through the ratio between a sample value and a sample mean [20,21]. In the statistical description, variance represents the deviation degree of discrete data from the population mean and measures the difference between data and expected value. The general form is
where
Variance analysis can study the dynamic changes in the groundwater level, and the contrast coefficient reflects the abnormal degree of groundwater level data. For the groundwater level data of different monitoring wells in the study area, contrast coefficient variance analysis can transform the data series with unequal means into the data series with equal means for analysis of variance [22].
2.4 Grey relation analysis grade method
Grey relation analysis is one of the methods of grey system theory, judging the degree of correlation between sequences according to the similarity degree of geometric shapes of sequence curves to provide quantitative measurement for changing and developing systems [23]. According to the grey system theory, dimensionless processing is carried out on the original data, and grey correlation coefficient (ζ) and correlation degree (r) are obtained [24]. The general form is
where
When studying the change in the groundwater level, it is necessary to carry out the data change, eliminate the dimension, and transform different data into a comparative series [25,26]. In this article, the importance of multiple influencing factors affecting the groundwater level change system is judged by the grey relation analysis.
2.5 Path analysis
Path analysis studies the relationship between variables, aiming to show an independent variable’s direct and indirect effects on the dependent variable [27]. In 1921, Sl "MEP_L_bssected the correlation coefficient and analyzed the direct effect of each cause on the result through the path coefficient [28,29]. The path coefficient has the property of a regression coefficient and is a statistic between the regression coefficient and correlation coefficient [30]. In this article, the indirect paths of each variable are calculated by the direct path coefficient. The expression is
where
Based on the study of the influence of influencing factors on the change of the groundwater table, path analysis can reveal the relative importance between influencing factors and the groundwater table and the relative influence between each influencing factor through direct and indirect path analysis [31].
3 Results
3.1 Interannual variation of groundwater level in the Shihezi irrigation area
3.1.1 Interannual variation of the water table
The dynamic change of groundwater in the Shihezi irrigation area is shown in Figure 2. In the irrigation area, the dynamic variation of groundwater levels in monitoring wells G-5, G-13, G-16, and G-18 is less than 4 m, and the groundwater level in other monitoring wells has a considerable variation. G-7 and G-14 wells showed the most significant variation, 31.64 and 15.30 m, respectively. The groundwater level of G-3, G-9, and G-19 monitoring wells in the irrigation area showed an apparent downward trend.
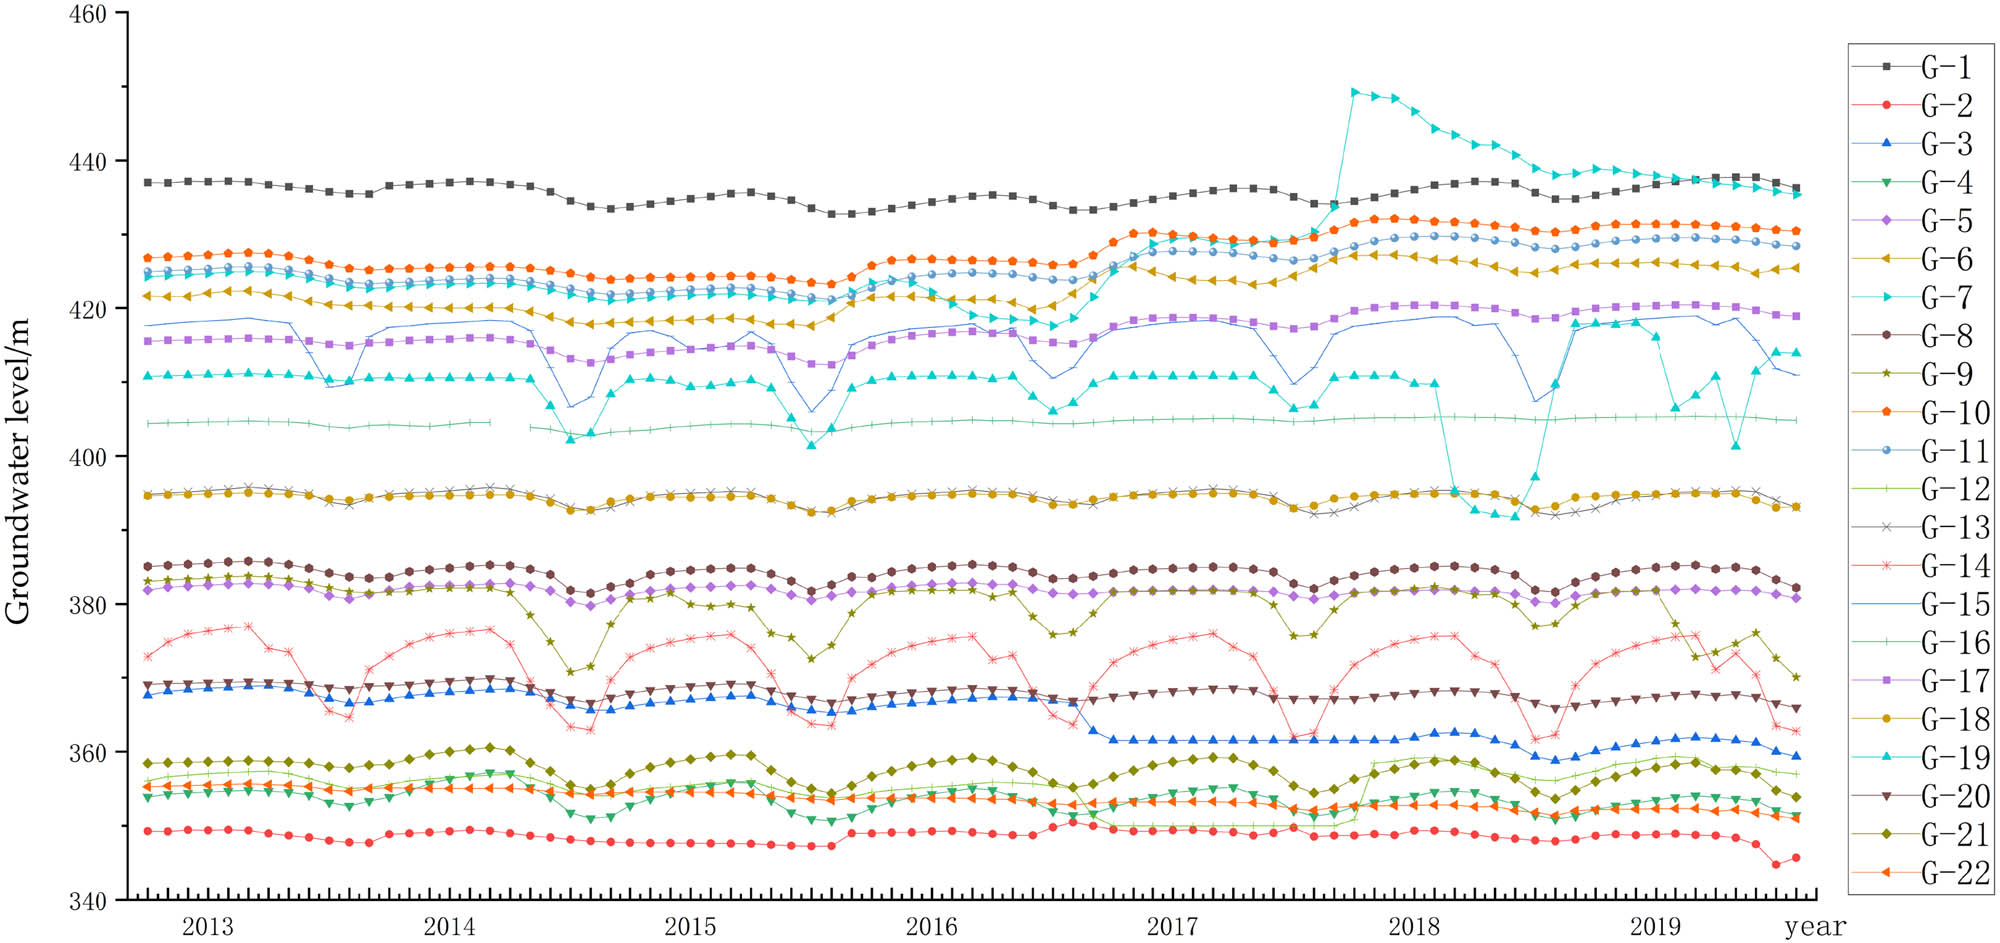
Interannual dynamic variation of the groundwater level in the Shihezi irrigation area.
The annual mean groundwater level variation in the Shihezi irrigation area was calculated by ArcGIS spatial interpolation (Figure 3). The groundwater level in the southeast of the irrigated area increased significantly, while the groundwater level in the northwest decreased greatly, with a fluctuation range of 12.26–14.14 m. The rise of the groundwater level in southeast China is more substantial than the decline in northwest China.
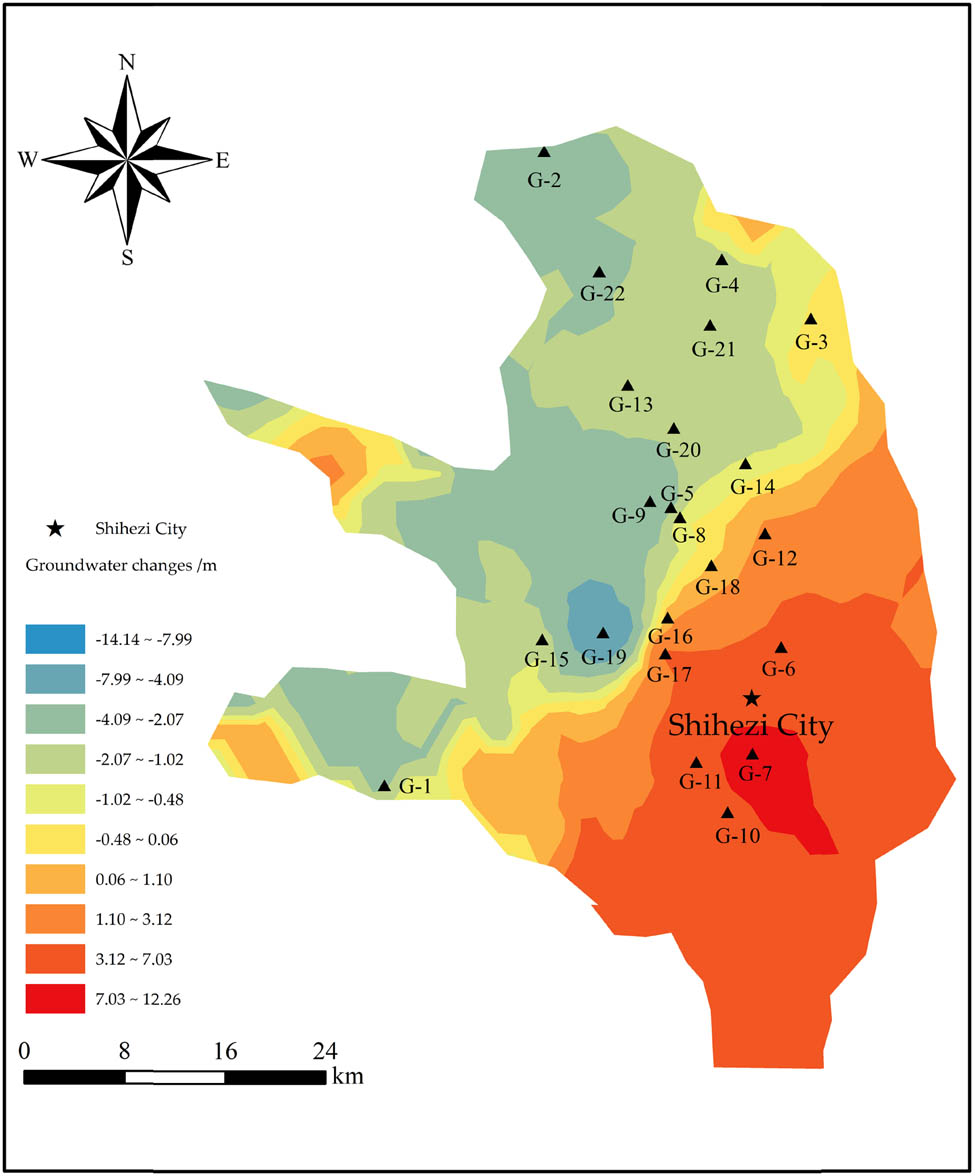
Spatial variation distribution of the groundwater table from 2012 to 2019.
3.1.2 Annual variation characteristics of the groundwater table
Six observation wells in the north direction, ten in the intermediate direction, and six in the south direction are used to divide the irrigated area’s northern, central, and southern parts. The annual dynamic variation curve of the groundwater table is obtained according to the average groundwater table in the irrigated area for many years (Figure 4). The groundwater table in the northern and central parts of the irrigated area has apparent variation law in the year: From January to March, the runoff groundwater level began to rise slightly due to the melting of alpine ice and snow in the south of the irrigated area, and the groundwater level reached a small peak in early March. From March to July and August, the groundwater level decreased gradually due to the extraction of groundwater for agricultural irrigation, which reached the lowest value in the year. With the end of the crop growth period and the irrigation return, the groundwater level rises gradually decreased. The annual variation trend of the groundwater table in the southern part of the irrigated area is the same as that in the northern and central parts, and the groundwater table fluctuates from January to May.
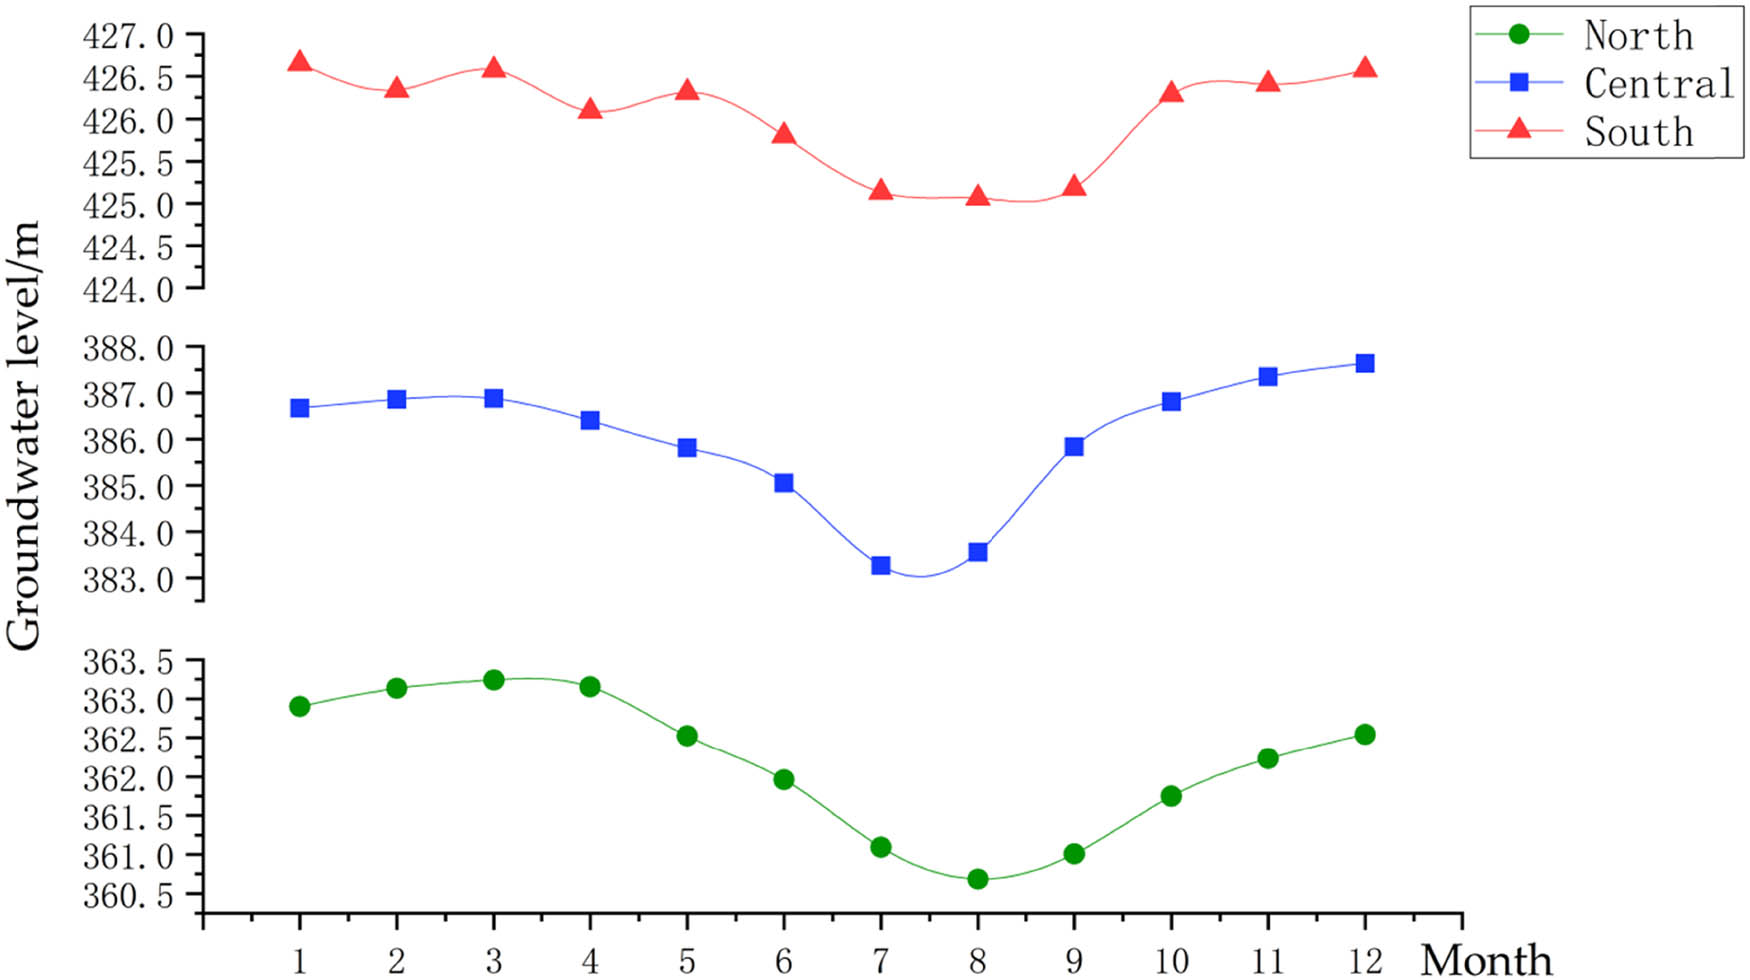
Annual groundwater level variations in different areas of the Shihezi irrigation area.
According to the variance of contrast coefficient (Formula (1)), the variance of contrast coefficient of groundwater level in the irrigation area was calculated. In order to facilitate comparative analysis, the calculated results were uniformly expanded by 105 times (Table 1).
Basic information of groundwater level monitoring well
| Well | Contrast coefficient | Well | Contrast coefficient | Well | Contrast coefficient |
|---|---|---|---|---|---|
| G-1 | 0.36 | G-9 | 3.95 | G-17 | 0.25 |
| G-2 | 0.08 | G-10 | 0.09 | G-18 | 0.21 |
| G-3 | 0.34 | G-11 | 0.14 | G-19 | 8.03 |
| G-4 | 1.42 | G-12 | 0.38 | G-20 | 0.31 |
| G-5 | 0.20 | G-13 | 0.47 | G-21 | 1.66 |
| G-6 | 0.11 | G-14 | 11.31 | G-22 | 0.08 |
| G-7 | 0.82 | G-15 | 3.88 | ||
| G-8 | 0.56 | G-16 | 0.04 |
The spatial distribution diagram of variance value information of the groundwater level contrast coefficient was obtained by ArcGIS spatial interpolation (Figure 5). The groundwater table contrast coefficient variance in the Shihezi irrigated area ranges from 0.04 to 11.31. The annual groundwater table fluctuation in the irrigated area presents regional differentiation, forming two large and one small gradient region. The maximum variance of the contrast coefficient in the center of the gradient region is 11.31, 8.03, and 3.95, respectively. Regarding spatial distribution, the fluctuation amplitude of the irrigated area increased from the surrounding area to the center area. The variance of the contrast coefficient of the groundwater level around the irrigated area was smaller than that in the interior area. The fluctuation amplitude of the groundwater level in the southeast was smaller than that in the northwest area.
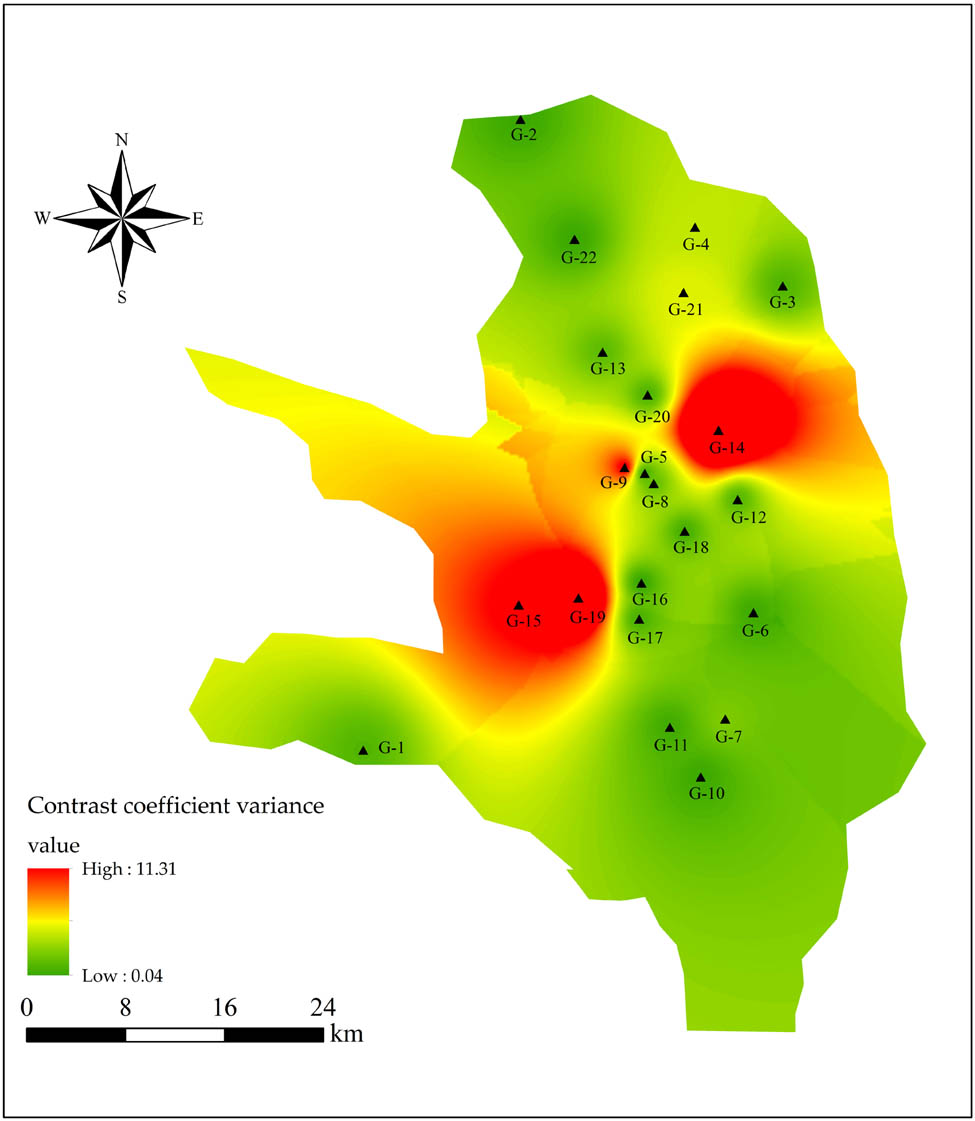
Spatial distribution of the variance of the groundwater table contrast coefficient.
3.2 Analysis of influencing factors of groundwater levels in the Shihezi irrigation area
Groundwater is an important water source for agricultural irrigation in irrigated areas. The melting of ice and snow at high altitudes in the south is the primary source of surface runoff and groundwater. The irrigated area is high in the south and low in the north. In this article, irrigated area of cultivated land X 1, groundwater usage X 2, surface water usage X 3, precipitation X 4, evaporation X 5, and air temperature X 6 are selected as influencing factors of groundwater level Y change, and driving factors of groundwater level change in irrigated areas are quantitatively analyzed.
3.2.1 Grey relational degree analysis and influence factor analysis of groundwater levels
Taking the yearly time series of groundwater levels as the reference series, the grey correlation coefficient (Table 2) is obtained by analyzing the correlation degree of the influencing factors to the groundwater level. The correlation degree between the irrigated area of cultivated land X 1 and groundwater level is the highest (0.947), followed by air temperature X 6, evaporation X 5, precipitation X 4, groundwater usage X 2, and surface water usage X 3.
Grey correlation coefficient between influence factors and groundwater levels
| Index | Influence factor | |||||
|---|---|---|---|---|---|---|
| X 1 | X 2 | X 3 | X 4 | X 5 | X 6 | |
| Maximum value | 0.988 | 0.986 | 0.960 | 0.974 | 0.999 | 1.000 |
| Minimum value | 0.883 | 0.577 | 0.334 | 0.724 | 0.753 | 0.851 |
| Mean value | 0.947 | 0.779 | 0.742 | 0.890 | 0.910 | 0.944 |
| Standard deviation | 0.022 | 0.112 | 0.164 | 0.074 | 0.065 | 0.038 |
| Grey correlation degree | 0.947 | 0.779 | 0.742 | 0.890 | 0.910 | 0.944 |
| Relational ranking | 1 | 5 | 6 | 4 | 3 | 2 |
3.2.2 Path analysis
In this article, the SPSS 25 correlation analysis tool was used to make a path analysis of groundwater level and influencing factors in the irrigation area. The direct and indirect effects of the influencing factors on the change in groundwater levels were obtained according to the direct path coefficient and correlation coefficient (Table 3). The total contribution of path coefficient P iy , determination coefficient d y,ij, and influence factor to regression equation R 2 (namely, r ij P iy ) were selected as statistical indicators. The calculation results of the determination coefficient and total contribution to R 2 are shown in Table 4.
Direct and indirect effects of influencing factors on groundwater levels
| Influence factor | Direct path coefficient | Indirect path coefficient | Correlation coefficient | ||||||
|---|---|---|---|---|---|---|---|---|---|
| X 1 | X 2 | X 3 | X 4 | X 5 | X 6 | Sum | |||
| X 1 | 1.141 | — | −0.244 | −0.048 | −0.072 | −0.453 | 0.095 | −0.722 | 0.417 |
| X 2 | 0.563 | −0.496 | — | −0.736 | 0.075 | 0.068 | −0.076 | −1.165 | −0.602 |
| X 3 | −1.086 | 0.050 | 0.382 | — | 0.505 | −0.291 | 0.009 | 0.655 | −0.429 |
| X 4 | −1.248 | 0.066 | −0.034 | 0.440 | — | 0.956 | −0.048 | 1.380 | 0.132 |
| X 5 | 1.328 | −0.389 | 0.029 | 0.238 | −0.900 | — | −0.035 | −1.057 | 0.272 |
| X 6 | −0.200 | −0.544 | 0.214 | 0.051 | −0.297 | 0.231 | — | −0.345 | −0.543 |
Influence factors for groundwater level determination coefficients and contribution to R 2
| Influence factor | Coefficient of determination d y,ij | R 2 | Total contribution to R 2 | |||||
|---|---|---|---|---|---|---|---|---|
| X 1 | X 2 | X 3 | X 4 | X 5 | X 6 | |||
| X 1 | 1.302* | 0.908 | 0.476 | |||||
| X 2 | −0.559 | 0.317* | −0.339 | |||||
| X 3 | −0.110 | −0.829 | 1.179* | 0.466 | ||||
| X 4 | −0.165 | 0.085 | −1.098 | 1.558* | −0.165 | |||
| X 5 | −1.034 | 0.076 | 0.632 | −2.387 | 1.764* | 0.361 | ||
| X 6 | 0.218 | −0.086 | −0.021 | 0.119 | −0.093 | 0.040* | 0.109 | |
-
*Determination coefficient of a single influence factor on the groundwater level.
The direct and indirect effects of each factor are different. The maximum determination coefficient of a single aspect on the groundwater level is 1.764, evaporation X 5. The absolute value of the comprehensive determination coefficient of precipitation X 4 and evaporation X 5 is the largest, which is 2.387. Among the total contribution of influence factors to R 2, the irrigated area of cultivated land X 1 is the largest, 0.476. In conclusion, the total contribution of X 1, X 3, and X 5 to R 2 is 0.476, 0.466, and 0.361, respectively. The independent determination coefficients of the groundwater level are 1.302, 1.179, and 1.764, and the direct path coefficients are 1.141, −1.086, and 1.328, respectively. Compared with other influencing factors, the absolute values of the three statistical indicators are all larger. Therefore, the irrigated area of cultivated land X 1, surface water use amount X 3, and evaporation amount X 5 are essential factors affecting the groundwater level. The absolute values of the total contribution, independent determination coefficient, and direct path coefficient of air temperature X 6 to R 2 are the smallest, which are 0.109, 0.040, and −0.200, respectively, indicating that air temperature has a minor influence on the groundwater level.
3.2.3 Sensitivity analysis of influencing factors
To analyze the relative importance of each influencing factor, a quantitative approach was employed to investigate the causal relationship between the influencing factors and the groundwater level. One influencing factor was eliminated at a time, and path analysis was conducted on the remaining five factors to calculate their direct and indirect effects (Table 5). The reduction of the number and type of influencing factors resulted in the corresponding changes in groundwater’s coefficient of determination (d ye) and R 2 (Table 6).
Analysis of the influence of factor reduction on the path analysis of the groundwater table
| Number of influence factors | 6 | 5 (remove X 1) | 5 (remove X 2) | 5 (remove X 3) | 5 (remove X 4) | 5 (remove X 5) | 5 (remove X 6) | |
|---|---|---|---|---|---|---|---|---|
| X 1 | Direct path coefficient | 1.141 | — | 0.777 | 0.436 | 0.301 | 0.150* | 1.270 |
| Indirect path coefficient sum | −0.722 | — | −0.360 | −0.019 | 0.116 | 0.267* | −0.853 | |
| X 2 | Direct path coefficient | 0.563 | −0.311* | — | −0.396* | −0.134 | −0.134 | 0.538 |
| Indirect path coefficient sum | −1.165 | −0.291* | — | −0.206* | −0.468 | −0.468 | −1.140 | |
| X 3 | Direct path coefficient | −1.086 | −0.218* | −0.595 | — | −0.285 | −0.330 | −1.926 |
| Indirect path coefficient sum | 0.655 | −0.211* | 0.166 | — | −0.144 | −0.099 | 0.668 | |
| X 4 | Direct path coefficient | −1.248 | −0.198* | −0.885 | −0.435 | — | 0.090* | −2.415 |
| Indirect path coefficient sum | 1.380 | 0.330* | 1.017 | 0.567 | — | 0.042* | 1.519 | |
| X 5 | Direct path coefficient | 1.328 | 0.464 | 1.075 | 0.793 | 0.394 | — | 1.436 |
| Indirect path coefficient sum | −1.057 | −0.192 | −0.803 | −0.521 | −0.122 | — | −1.164 | |
| X 6 | Direct path coefficient | −0.200 | −0.469 | −0.178 | −0.220 | −0.431 | −0.458 | — |
| Indirect path coefficient sum | 0.345 | −0.074 | −0.365 | −0.323 | −0.112 | −0.085 | — | |
*Significant variation of direct and indirect effects after excluding the individual influence factors.
Analysis of the influence of the increase or decrease of influence factors on the total contribution to R 2 in the path analysis of the groundwater table
| Number of indicators | d ye | The total contribution of each influence factor to R 2 | R 2 | |||||
|---|---|---|---|---|---|---|---|---|
| X 1 | X 2 | X 3 | X 4 | X 5 | X 6 | |||
| 6 | 0.092 | 0.476 | −0.339 | 0.466 | −0.165 | 0.361 | 0.109 | 0.908 |
| 5 (remove X 1) | 0.364 | — | 0.187 | 0.094 | −0.026 | 0.126 | 0.255 | 0.636 |
| 5 (remove X 2) | 0.148 | 0.324 | — | 0.255 | −0.117 | 0.292 | 0.097 | 0.852 |
| 5 (remove X 3) | 0.302 | 0.182 | 0.238 | — | −0.057 | 0.216 | 0.119 | 0.698 |
| 5 (remove X 4) | 0.330 | 0.126 | 0.081 | 0.122 | — | 0.107 | 0.234 | 0.670 |
| 5 (remove X 5) | 0.454 | 0.063 | 0.081 | 0.142 | 0.012 | — | 0.249 | 0.546 |
| 5 (remove X 6) | 0.115 | 0.530 | −0.324 | 0.471 | −0.183 | 0.391 | — | 0.885 |
According to the analysis in Table 5, the direct and indirect effects of X 2, X 3, and X 4 changed significantly when removing the irrigated area of cultivated land (X 1); the direct and indirect effects of X 2 and X 4 changed considerably when removing the surface water usage (X 3); and the direct and indirect effects of X 1 and X 4 changed greatly when removing the evaporation (X 5). This indicates that the sensitivity and importance of the irrigated area of cultivated land (X 1), surface water usage (X 3), and evaporation (X 5) have a significant influence on the groundwater level. Similarly, it can be seen from Table 6 that after removing the influencing factors X 1, X 3, and X 5, the coefficient of determination (d ye) of an error on the groundwater level rose to 0.364, 0.302, and 0.454, respectively, which have enormous variation compared with the d ye value under the six influencing factors, indicating that changes in the irrigated area of cultivated land X 1, surface water usage X 3, and evaporation X 5 could cause significant changes in the groundwater level. These are essential factors affecting the evolution of the groundwater table.
A sensitivity analysis was conducted using a stepwise elimination method to determine the sensitivity order of six influencing factors on groundwater level changes by progressively removing the less sensitive influence factor. Based on the analysis results of path coefficient, determination coefficient, the contribution of an influence factor to regression equation R 2 on groundwater level, and the sensitivity analysis under the single removal of an influencing factor, it demonstrates that the temperature X 6 has a minor influence on the groundwater level. Although X 4 has a large indirect path coefficient in the remaining influence factors, the total contribution of X 4 to R 2 and the direct path coefficient of X 4 is relatively tiny compared with other influence factors, so X 4 is removed. By analogs, Tables 7 and 8 show the path analysis that gradually eliminated the least sensitive influence factors. X 2’s direct path coefficient and total contribution to R 2 are much larger than X 1, and it can determine that the sensitivity of X 2 is greater than that of X 1. The sensitivity of influencing factors to the change of the groundwater level is in the order of groundwater usage X 2 > irrigated area of cultivated land X 1 > evaporation X 5 > surface water usage X 3 > precipitation X 4 > air temperature X 6.
Path analysis of the gradual removal of insensitive factors to the change of the groundwater level
| Number of influence factors | 6 | 5 (remove X 6) | 4 (remove X 4 again) | 3 (remove X 3 again) | 2 (remove X 5 again) | |
|---|---|---|---|---|---|---|
| X 1 | Direct path coefficient | 1.141 | 1.270 | 0.390 | 0.356 | 0.192 |
| Indirect path coefficient sum | −0.722 | −0.853 | 0.027 | 0.061 | 0.225 | |
| X 2 | Direct path coefficient | 0.563 | 0.538 | −0.391 | −0.469 | −0.519 |
| Indirect path coefficient sum | −1.165 | −1.140 | −0.211 | −0.133 | −0.083 | |
| X 3 | Direct path coefficient | −1.086 | −1.097 | −0.093 | ||
| Indirect path coefficient sum | 0.655 | 0.668 | −0.336 | |||
| X 4 | Direct path coefficient | −1.248 | −1.087 | |||
| Indirect path coefficient sum | 1.380 | 1.519 | ||||
| X 5 | Direct path coefficient | 1.328 | 1.436 | 0.405 | 0.417 | |
| Indirect path coefficient sum | −1.057 | −1.164 | −0.133 | −0.145 | ||
| X 6 | Direct path coefficient | −0.200 | ||||
| Indirect path coefficient sum | −0.345 | |||||
Influence of gradually eliminate insensitive factors for the R 2 contribution
| Number of influence factors | d ye | Impact analysis of the total contribution of each influence factor to R 2 | R 2 | |||||
|---|---|---|---|---|---|---|---|---|
| X 1 | X 2 | X 3 | X 4 | X 5 | X 6 | |||
| 6 | 0.092 | 0.476 | −0.339 | 0.466 | −0.165 | 0.361 | 0.109 | 0.908 |
| 5 (remove X 6) | 0.115 | 0.530 | −0.324 | 0.471 | −0.183 | 0.391 | 0.885 | |
| 4 (remove X 4 again) | 0.452 | 0.163 | 0.235 | 0.040 | 0.110 | 0.548 | ||
| 3 (remove X 3 again) | 0.456 | 0.148 | 0.282 | 0.113 | 0.544 | |||
| 2 (remove X 5 again) | 0.607 | 0.080 | 0.312 | 0.393 | ||||
If the absolute value of d ye is large, it indicates that there may be some reasons (influencing factors) that have a significant influence on the result (groundwater level) that have not been taken into account. In the analysis of phasing out insensitive influencing factors, the d ye value of the six influencing factors was 0.092, indicating that this article considered the factors that significantly impact groundwater levels. The d ye value increases gradually with the decrease of the number of influencing factors, and it shows that the groundwater level change is the result of the comprehensive action of multiple influencing factors, and each influencing factor is interrelated.
4 Discussion
The Shihezi irrigated area is a typical irrigated area in a northwest arid area; with the advancement of the oasisization process, the demand for groundwater resources in the irrigated area is increasing daily [32]. Therefore, studying the various characteristics and influencing factors of groundwater levels is an important research topic [33]. The usage and evaporation of groundwater in the irrigated area show a slightly decreasing trend. At the same time, the precipitation increases slightly, and the groundwater level shows an upward trend. Since the implementation of the strictest water resources management system in 2012, the groundwater level in the southeast of the irrigated area has shown an upward trend, indicating that human activities are an essential driving force affecting the change in the groundwater level. The annual variation of the groundwater level in the irrigated area first shows a trend of rising, then declining, and then rising; this is consistent with the conclusion of Wang’s research on the Manas River basin [34]. There are many methods to analyze the driving force of groundwater level change. Ji et al. analyzed the dynamic characteristics and influencing factors of groundwater depth in the Mosuowan Valley irrigation area by applying the water balance method and the Manner–Kendall mutation test [35]. Zhang et al. analyzed the influencing factors of groundwater level change in Huantai County, Shandong Province, using trend analysis, the M–K test, and Pearson correlation analysis [10]. All the studies showed that human activities are one of the main driving forces of groundwater level change.
As a method to measure the degree of correlation among factors, grey relational degree analysis is suitable for the dynamic time history analysis of small sample data [36]. It can analyze and calculate the primary and secondary influencing factors of groundwater levels [37]. Path analysis is an extension of correlation and regression analysis, and it can decompose correlation coefficients to reveal the relative importance of influence factors to groundwater levels [38]. Different analysis methods may present inconsistent results due to their different principles and data requirements. This article used two different methods, namely, gray correlation degree and path analysis, to analyze the same data, but the conclusions are inconsistent, which is similar to the study of Yan et al., who obtained different conclusions on the relationship between morphological characteristics and body mass of rock carp based on different analysis methods [39]. The two methods show that the key factors affecting the groundwater level include the irrigated area of cultivated land X 1 and evaporation X 5, which is similar to the previous research conclusions and has a certain reference value. Therefore, it is necessary to adopt various methods to determine the critical impact factors in practical hydrogeological work [40].
5 Conclusions
The groundwater level in the irrigated area shows an upward trend on the whole, and the difference between the north and south of the region is noticeable, with a fluctuation range of 12.26–14.14 m. Compared with the northern and southern regions, the central part of the irrigated area shows a more extensive fluctuation range of groundwater levels.
Grey relational degree analysis shows that the irrigated area of cultivated land X 1, evaporation X 5, and air temperature X 6 are the main influencing factors of groundwater levels. Path analysis shows that the irrigated area of cultivated land X 1, surface water usage X 3, and evaporation X 5 are the main factors affecting groundwater level change in irrigated areas.
Sensitivity analysis shows that the irrigated area of cultivated land X 1, surface water usage X 3, and evaporation X 5 affect groundwater levels. The sensitivity factors are successively groundwater usage X 2, irrigated area of cultivated land X 1, evaporation X 5, surface water use X 3, precipitation X 5, and air temperature X 6.
According to the results of the grey correlation degree, path analysis, and sensitivity analysis, the irrigated area of cultivated land X 1 and evaporation X 5 are the main influencing factors of groundwater level change in the Shihezi irrigated area.
Acknowledgments
This research was funded by the Xinjiang Production and Construction Corps Project (grant numbers 2022BC001, 2021AB021, and 2022DB023), the National Natural Science Foundation of China (grant number 52269006), the Third Comprehensive Scientific Investigation Project in Xinjiang (grant numbers 2021xjkk0804 and 2022xjkk0902), and Shihezi University Project (RCZK202026). The work was also supported by the Key Laboratory of Cold and Arid Regions Eco-Hydraulic Engineering of Xinjiang Production & Construction Corps.
-
Author contributions: Conceptualization, GY and GD; methodology, WW; software, WW; validation, GD; formal analysis, WW; investigation, YP and XX; resources, BL; data curation, HT and YG; writing – original draft preparation, WW; writing – review and editing, HT, YD and MC; supervision, GY; project administration, GY All authors have read and agreed to the published version of the manuscript.
-
Conflict of interest: Authors state no conflict of interest.
References
[1] Xue T, Xue X, Long S, Chen Q, Lu S, Zeng C. Effect of pre-existing underground structures on groundwater flow and strata movement induced by dewatering and excavation. Water. 2023;15(4):814.10.3390/w15040814Suche in Google Scholar
[2] Du Y, He X, Yang G, Wang Z, Huang D, Wang W. An evaluation of groundwater resources of Mosuowan irrigation district of the Manas river by using the water balance. China Rural Water Hydropower. 2012;(9):63–5.Suche in Google Scholar
[3] Deng M. Current situation and its potential analysis of exploration and utilization of groundwater resources of Xinjiang. Arid Land Geogr. 2009;32(5):647–54. 10.13826/j.cnki.cn65-1103/x.2009.05.001.Suche in Google Scholar
[4] Qiu Y, Chen J, Shu L, Yuan Y, Zhang F, Lu C. Response of groundwater level to precipitation and river stage in the typical district of Sanjiang Plain. South-to-North Water Transf Water Sci Technol. 2022;20(6):1076–83 + 1127. 10.13476/j.cnki.nsbdqk.2022.0106.Suche in Google Scholar
[5] Cai Y, Huang R, Xu J, Xing J, Yi D. Dynamic response characteristics of shallow groundwater level to hydro-meteorological factors and well irrigation water withdrawals under different conditions of groundwater buried depth. Water. 2022;14(23):3937.10.3390/w14233937Suche in Google Scholar
[6] Hawzhin Z, Taheri TA, Fryar AE, Khodamorad PM, Rojin F. Prediction of groundwater level variations based on gravity recovery and climate experiment (GRACE) satellite data and a time-series analysis: a case study in the Lake Urmia basin, Iran. Environ Earth Sci. 2022;81(6):180.10.1007/s12665-022-10296-xSuche in Google Scholar
[7] Lee S, Lee K-K, Yoon H. Using artificial neural network models for groundwater level forecasting and assessment of the relative impacts of influencing factors. Hydrogeol J. 2019;27(2):567–79.10.1007/s10040-018-1866-3Suche in Google Scholar
[8] Li P, Wei X, Jian Y, Feng D. Response of groundwater cycle to environmental changes in Guanzhong Plain irrigation district. Trans Chin Soc Agric Eng. 2014;30(18):123–31.Suche in Google Scholar
[9] Chang M, Shi J, Ye S, Wang X, Li G. Dynamic characteristics and causes of shallow groundwater level intra-annual changes in the Yellow River Delta. Mar Sci. 2021;45(10):20–31.Suche in Google Scholar
[10] Zhang Y, Wang X, Zhang Y, Zhang Q, Fu T. An analysis of the dynamic change characteristics and influencing factors of groundwater level in Huantai County. China Rural Water Hydropower. 2022;7:110–5 + 121.Suche in Google Scholar
[11] Wang Z, He X, Yang G. Sustainable strategies and status of development and utilization of unconventional water resources in the Manas River Basin. China Rural Water Hydropower. 2010;08:99–101.10.4028/www.scientific.net/AMR.113-116.565Suche in Google Scholar
[12] Li M, Cao K, Fu Q, Liu W, Hu Y, Chang Y. Efficient allocation of multiple water sources in irrigation areas considering water cycle process under uncertainty. Trans Chin Soc Agric Eng. 2021;37(18):62–73.Suche in Google Scholar
[13] Gong Y, Zou W, Yuan X, Yang X, Chen Y. Study on water quantity allocation optimization for single main canal in large-scale irrigation area based on DP method. Water. 2022;14(23):3917.10.3390/w14233917Suche in Google Scholar
[14] Xu B, Zhang Y. Assessment of groundwater ecosystem security in Arid Oasis Shihezi reclamation area in Xinjiang. Res Environ Sci. 2018;31(5):919–26.Suche in Google Scholar
[15] Dong X, Deng M. Groundwater resources in Xinjiang. Xinjiang science and Technology Press; 2005.Suche in Google Scholar
[16] Li L, Wang X. Analysis of water resources utilization and agricultural sustainable development in Xinjiang. Water Conserv China. 2003;(3):54–7.Suche in Google Scholar
[17] Du Y, He X, Li X, Li X, Gu X, Yang G, et al. Changes in landscape pattern and ecological service value as land use evolves in the Manas River Basin. Open Geosci. 2022;14(1):1092–112.10.1515/geo-2022-0414Suche in Google Scholar
[18] Yang G, Liu S, Yan K, Tian L, Li P, Li X, et al. Effect of drip irrigation with brackish water on the soil chemical properties for a typical desert plant (Haloxylon ammodendron) in the Manas River Basin. Irrig Drain. 2020;69(3):460–71.10.1002/ird.2419Suche in Google Scholar
[19] Ma B, Jin M, Liang X, Li J. Groundwater mixing and mineralization processes in a mountain–oasis–desert basin, northwest China: Hydrogeochemistry and environmental tracer indicators. Hydrogeol J. 2017;26:233–50.10.1007/s10040-017-1659-0Suche in Google Scholar
[20] Meng F, Liang X, Hao Y, Wang Y, Lou Y, Li H. Dynamic characteristics of groundwater in Taoer River Fan. Water Sav Irrig. 2016;4:65–8.Suche in Google Scholar
[21] Sun Q, Sun Z, Tian H, Guo X, Yu H, Li X, et al. dynamic characteristics and difference analysis of the groundwater in Changchun New District. Geol Resour. 2020;29(4):369–73.Suche in Google Scholar
[22] Wang G, Xiao C, Liang X, Qi Z, Ran C. Analysis and prediction of dynamic characteristics of groundwater level in Naoli River Basin. Water Resour Power. 2017;12:144–7.10.1016/j.advwatres.2016.10.016Suche in Google Scholar
[23] Yang C, Li X, Zhang D, Wang H, Shao Y, Fang B, et al. Grey relational analysis and path analysis on wheat yield and its three key factors. J Henan Agric Sci. 2016;45(10):19–23.Suche in Google Scholar
[24] Ratković J, Polomčić D, Gligorić Z, Bajić D. Imputing missing data using grey system theory and the biplot method to forecast groundwater levels and yields. Geol Croatica. 2022;75(2):235–47.10.4154/gc.2022.14Suche in Google Scholar
[25] Yin L, Wang Y, Yu T, Zhang H, Wang H, Chen D. Study on micromechanisms of macro evaluation indexes for asphalt based on grey relation analysis. Int J Pavement Eng. 2022;23(14):5186–97.10.1080/10298436.2021.2001812Suche in Google Scholar
[26] Zhou Z, Zhou Y, Liu Z. Analysis of influencing factors on dynamic modulus of porous asphalt. Mater Rev. 2022;36(13):121–7.Suche in Google Scholar
[27] Li Y. Analysis of influencing factors of water consumption based on stepwise regression and path analysis. Water Resour Power. 2020;38(7):42–4.Suche in Google Scholar
[28] Deng L, Yuan K. Which method is more powerful in testing the relationship of theoretical constructs? A meta comparison of structural equation modeling and path analysis with weighted composites. Behav Res Methods. 2022;55(3):1–20.10.3758/s13428-022-01838-zSuche in Google Scholar PubMed
[29] Bai Y, Li X, Liu X. Impact of land use change on the ecosystem service value based on path analysis —— A case study in Xifeng District, Qingyang City. J Gansu Agric Univ. 2017;52(6):120–6.Suche in Google Scholar
[30] Chen D, Lu Y, Jia D. Land deformation associated with exploitation of groundwater in Changzhou City measured by COSMO-SkyMed and Sentinel-1A SAR data. Open Geosci. 2018;10(1):678–87.10.1515/geo-2018-0054Suche in Google Scholar
[31] Li H, Xu J, Li C, Xu Z. Path analysis on the impacts of ecological land allocation on landintensive use: A case of the development zones in Zhejiang Province. China Land Sci. 2011;25(9):42–7.Suche in Google Scholar
[32] Yang M, Yang G, He X, Wang C, Li X. Analysis of water supply and demand balance in Manas River irrigation areabased on system dynamics. J Arid Land Resour Environ. 2018;32(1):174–80.Suche in Google Scholar
[33] Lin D, Gong S, Zhang Y. Analysis of influencing factors of groundwater level variation at Donglutian coal industrial ground of Pingshuo. Strateg Stud CAE. 2012;14(2):49–53.Suche in Google Scholar
[34] Wang S, Wang J, Yang G, Li X, Qiao C, Liu B, et al. Variation characteristics of groundwater level and influencing factors in Manas River Basin. Pearl River. 2022;43(4):101–9.Suche in Google Scholar
[35] Ji L, Liu B, He X, Tang K, Peng F, Zhang Y. Changing characteristics and influencing causes of groundwater depth in irrigation areas in the lower reaches of the Manas river. J Irrig Drain. 2015;34(9):59–65.Suche in Google Scholar
[36] Yu G, Li Z, Zhang X, Li P, Liu H. Dynamic simulation of soil water-salt using BP neural network model and grey correlation analysis. Trans Chin Soc Agric Eng. 2009;25(11):74–9.Suche in Google Scholar
[37] Yeh Y-L, Chen T-C. Application of grey correlation analysis for evaluating the artificial lake site in Pingtung Plain, Taiwan. Can J Civ Eng. 2004;31(1):56–64.10.1139/l03-074Suche in Google Scholar
[38] Shao G, Yu S, Liu N, Chen L, Guo R. Application of path analysis in sensitivity analysis on stress indicator from subsurface water logging of winter wheat. J Basic Sci Eng. 2011;19(4):527–34.Suche in Google Scholar
[39] Yan H, Dong Z, Li Y, Ma T, Luo H, Ye H, et al. Relationship between morphological traits and body weight of procypris rabaudi by path analysis and grey correlation analysis. J Southwest Univ (Nat Sci). 2022;44(5):74–81.Suche in Google Scholar
[40] Liu Y, Liu Y, Zhou Q, Gao L, Fang H, Han G, et al. Grey relational analysis between main growth traits and body weight in Japanese flounder (Paralichthys olivaceus). J Fish Sci China. 2014;21(2):205–13.Suche in Google Scholar
© 2023 the author(s), published by De Gruyter
This work is licensed under the Creative Commons Attribution 4.0 International License.
Artikel in diesem Heft
- Regular Articles
- Diagenesis and evolution of deep tight reservoirs: A case study of the fourth member of Shahejie Formation (cg: 50.4-42 Ma) in Bozhong Sag
- Petrography and mineralogy of the Oligocene flysch in Ionian Zone, Albania: Implications for the evolution of sediment provenance and paleoenvironment
- Biostratigraphy of the Late Campanian–Maastrichtian of the Duwi Basin, Red Sea, Egypt
- Structural deformation and its implication for hydrocarbon accumulation in the Wuxia fault belt, northwestern Junggar basin, China
- Carbonate texture identification using multi-layer perceptron neural network
- Metallogenic model of the Hongqiling Cu–Ni sulfide intrusions, Central Asian Orogenic Belt: Insight from long-period magnetotellurics
- Assessments of recent Global Geopotential Models based on GPS/levelling and gravity data along coastal zones of Egypt
- Accuracy assessment and improvement of SRTM, ASTER, FABDEM, and MERIT DEMs by polynomial and optimization algorithm: A case study (Khuzestan Province, Iran)
- Uncertainty assessment of 3D geological models based on spatial diffusion and merging model
- Evaluation of dynamic behavior of varved clays from the Warsaw ice-dammed lake, Poland
- Impact of AMSU-A and MHS radiances assimilation on Typhoon Megi (2016) forecasting
- Contribution to the building of a weather information service for solar panel cleaning operations at Diass plant (Senegal, Western Sahel)
- Measuring spatiotemporal accessibility to healthcare with multimodal transport modes in the dynamic traffic environment
- Mathematical model for conversion of groundwater flow from confined to unconfined aquifers with power law processes
- NSP variation on SWAT with high-resolution data: A case study
- Reconstruction of paleoglacial equilibrium-line altitudes during the Last Glacial Maximum in the Diancang Massif, Northwest Yunnan Province, China
- A prediction model for Xiangyang Neolithic sites based on a random forest algorithm
- Determining the long-term impact area of coastal thermal discharge based on a harmonic model of sea surface temperature
- Origin of block accumulations based on the near-surface geophysics
- Investigating the limestone quarries as geoheritage sites: Case of Mardin ancient quarry
- Population genetics and pedigree geography of Trionychia japonica in the four mountains of Henan Province and the Taihang Mountains
- Performance audit evaluation of marine development projects based on SPA and BP neural network model
- Study on the Early Cretaceous fluvial-desert sedimentary paleogeography in the Northwest of Ordos Basin
- Detecting window line using an improved stacked hourglass network based on new real-world building façade dataset
- Automated identification and mapping of geological folds in cross sections
- Silicate and carbonate mixed shelf formation and its controlling factors, a case study from the Cambrian Canglangpu formation in Sichuan basin, China
- Ground penetrating radar and magnetic gradient distribution approach for subsurface investigation of solution pipes in post-glacial settings
- Research on pore structures of fine-grained carbonate reservoirs and their influence on waterflood development
- Risk assessment of rain-induced debris flow in the lower reaches of Yajiang River based on GIS and CF coupling models
- Multifractal analysis of temporal and spatial characteristics of earthquakes in Eurasian seismic belt
- Surface deformation and damage of 2022 (M 6.8) Luding earthquake in China and its tectonic implications
- Differential analysis of landscape patterns of land cover products in tropical marine climate zones – A case study in Malaysia
- DEM-based analysis of tectonic geomorphologic characteristics and tectonic activity intensity of the Dabanghe River Basin in South China Karst
- Distribution, pollution levels, and health risk assessment of heavy metals in groundwater in the main pepper production area of China
- Study on soil quality effect of reconstructing by Pisha sandstone and sand soil
- Understanding the characteristics of loess strata and quaternary climate changes in Luochuan, Shaanxi Province, China, through core analysis
- Dynamic variation of groundwater level and its influencing factors in typical oasis irrigated areas in Northwest China
- Creating digital maps for geotechnical characteristics of soil based on GIS technology and remote sensing
- Changes in the course of constant loading consolidation in soil with modeled granulometric composition contaminated with petroleum substances
- Correlation between the deformation of mineral crystal structures and fault activity: A case study of the Yingxiu-Beichuan fault and the Milin fault
- Cognitive characteristics of the Qiang religious culture and its influencing factors in Southwest China
- Spatiotemporal variation characteristics analysis of infrastructure iron stock in China based on nighttime light data
- Interpretation of aeromagnetic and remote sensing data of Auchi and Idah sheets of the Benin-arm Anambra basin: Implication of mineral resources
- Building element recognition with MTL-AINet considering view perspectives
- Characteristics of the present crustal deformation in the Tibetan Plateau and its relationship with strong earthquakes
- Influence of fractures in tight sandstone oil reservoir on hydrocarbon accumulation: A case study of Yanchang Formation in southeastern Ordos Basin
- Nutrient assessment and land reclamation in the Loess hills and Gulch region in the context of gully control
- Handling imbalanced data in supervised machine learning for lithological mapping using remote sensing and airborne geophysical data
- Spatial variation of soil nutrients and evaluation of cultivated land quality based on field scale
- Lignin analysis of sediments from around 2,000 to 1,000 years ago (Jiulong River estuary, southeast China)
- Assessing OpenStreetMap roads fitness-for-use for disaster risk assessment in developing countries: The case of Burundi
- Transforming text into knowledge graph: Extracting and structuring information from spatial development plans
- A symmetrical exponential model of soil temperature in temperate steppe regions of China
- A landslide susceptibility assessment method based on auto-encoder improved deep belief network
- Numerical simulation analysis of ecological monitoring of small reservoir dam based on maximum entropy algorithm
- Morphometry of the cold-climate Bory Stobrawskie Dune Field (SW Poland): Evidence for multi-phase Lateglacial aeolian activity within the European Sand Belt
- Adopting a new approach for finding missing people using GIS techniques: A case study in Saudi Arabia’s desert area
- Geological earthquake simulations generated by kinematic heterogeneous energy-based method: Self-arrested ruptures and asperity criterion
- Semi-automated classification of layered rock slopes using digital elevation model and geological map
- Geochemical characteristics of arc fractionated I-type granitoids of eastern Tak Batholith, Thailand
- Lithology classification of igneous rocks using C-band and L-band dual-polarization SAR data
- Analysis of artificial intelligence approaches to predict the wall deflection induced by deep excavation
- Evaluation of the current in situ stress in the middle Permian Maokou Formation in the Longnüsi area of the central Sichuan Basin, China
- Utilizing microresistivity image logs to recognize conglomeratic channel architectural elements of Baikouquan Formation in slope of Mahu Sag
- Resistivity cutoff of low-resistivity and low-contrast pays in sandstone reservoirs from conventional well logs: A case of Paleogene Enping Formation in A-Oilfield, Pearl River Mouth Basin, South China Sea
- Examining the evacuation routes of the sister village program by using the ant colony optimization algorithm
- Spatial objects classification using machine learning and spatial walk algorithm
- Study on the stabilization mechanism of aeolian sandy soil formation by adding a natural soft rock
- Bump feature detection of the road surface based on the Bi-LSTM
- The origin and evolution of the ore-forming fluids at the Manondo-Choma gold prospect, Kirk range, southern Malawi
- A retrieval model of surface geochemistry composition based on remotely sensed data
- Exploring the spatial dynamics of cultural facilities based on multi-source data: A case study of Nanjing’s art institutions
- Study of pore-throat structure characteristics and fluid mobility of Chang 7 tight sandstone reservoir in Jiyuan area, Ordos Basin
- Study of fracturing fluid re-discharge based on percolation experiments and sampling tests – An example of Fuling shale gas Jiangdong block, China
- Impacts of marine cloud brightening scheme on climatic extremes in the Tibetan Plateau
- Ecological protection on the West Coast of Taiwan Strait under economic zone construction: A case study of land use in Yueqing
- The time-dependent deformation and damage constitutive model of rock based on dynamic disturbance tests
- Evaluation of spatial form of rural ecological landscape and vulnerability of water ecological environment based on analytic hierarchy process
- Fingerprint of magma mixture in the leucogranites: Spectroscopic and petrochemical approach, Kalebalta-Central Anatolia, Türkiye
- Principles of self-calibration and visual effects for digital camera distortion
- UAV-based doline mapping in Brazilian karst: A cave heritage protection reconnaissance
- Evaluation and low carbon ecological urban–rural planning and construction based on energy planning mechanism
- Modified non-local means: A novel denoising approach to process gravity field data
- A novel travel route planning method based on an ant colony optimization algorithm
- Effect of time-variant NDVI on landside susceptibility: A case study in Quang Ngai province, Vietnam
- Regional tectonic uplift indicated by geomorphological parameters in the Bahe River Basin, central China
- Computer information technology-based green excavation of tunnels in complex strata and technical decision of deformation control
- Spatial evolution of coastal environmental enterprises: An exploration of driving factors in Jiangsu Province
- A comparative assessment and geospatial simulation of three hydrological models in urban basins
- Aquaculture industry under the blue transformation in Jiangsu, China: Structure evolution and spatial agglomeration
- Quantitative and qualitative interpretation of community partitions by map overlaying and calculating the distribution of related geographical features
- Numerical investigation of gravity-grouted soil-nail pullout capacity in sand
- Analysis of heavy pollution weather in Shenyang City and numerical simulation of main pollutants
- Road cut slope stability analysis for static and dynamic (pseudo-static analysis) loading conditions
- Forest biomass assessment combining field inventorying and remote sensing data
- Late Jurassic Haobugao granites from the southern Great Xing’an Range, NE China: Implications for postcollision extension of the Mongol–Okhotsk Ocean
- Petrogenesis of the Sukadana Basalt based on petrology and whole rock geochemistry, Lampung, Indonesia: Geodynamic significances
- Numerical study on the group wall effect of nodular diaphragm wall foundation in high-rise buildings
- Water resources utilization and tourism environment assessment based on water footprint
- Geochemical evaluation of the carbonaceous shale associated with the Permian Mikambeni Formation of the Tuli Basin for potential gas generation, South Africa
- Detection and characterization of lineaments using gravity data in the south-west Cameroon zone: Hydrogeological implications
- Study on spatial pattern of tourism landscape resources in county cities of Yangtze River Economic Belt
- The effect of weathering on drillability of dolomites
- Noise masking of near-surface scattering (heterogeneities) on subsurface seismic reflectivity
- Query optimization-oriented lateral expansion method of distributed geological borehole database
- Petrogenesis of the Morobe Granodiorite and their shoshonitic mafic microgranular enclaves in Maramuni arc, Papua New Guinea
- Environmental health risk assessment of urban water sources based on fuzzy set theory
- Spatial distribution of urban basic education resources in Shanghai: Accessibility and supply-demand matching evaluation
- Spatiotemporal changes in land use and residential satisfaction in the Huai River-Gaoyou Lake Rim area
- Walkaway vertical seismic profiling first-arrival traveltime tomography with velocity structure constraints
- Study on the evaluation system and risk factor traceability of receiving water body
- Predicting copper-polymetallic deposits in Kalatag using the weight of evidence model and novel data sources
- Temporal dynamics of green urban areas in Romania. A comparison between spatial and statistical data
- Passenger flow forecast of tourist attraction based on MACBL in LBS big data environment
- Varying particle size selectivity of soil erosion along a cultivated catena
- Relationship between annual soil erosion and surface runoff in Wadi Hanifa sub-basins
- Influence of nappe structure on the Carboniferous volcanic reservoir in the middle of the Hongche Fault Zone, Junggar Basin, China
- Dynamic analysis of MSE wall subjected to surface vibration loading
- Pre-collisional architecture of the European distal margin: Inferences from the high-pressure continental units of central Corsica (France)
- The interrelation of natural diversity with tourism in Kosovo
- Assessment of geosites as a basis for geotourism development: A case study of the Toplica District, Serbia
- IG-YOLOv5-based underwater biological recognition and detection for marine protection
- Monitoring drought dynamics using remote sensing-based combined drought index in Ergene Basin, Türkiye
- Review Articles
- The actual state of the geodetic and cartographic resources and legislation in Poland
- Evaluation studies of the new mining projects
- Comparison and significance of grain size parameters of the Menyuan loess calculated using different methods
- Scientometric analysis of flood forecasting for Asia region and discussion on machine learning methods
- Rainfall-induced transportation embankment failure: A review
- Rapid Communication
- Branch fault discovered in Tangshan fault zone on the Kaiping-Guye boundary, North China
- Technical Note
- Introducing an intelligent multi-level retrieval method for mineral resource potential evaluation result data
- Erratum
- Erratum to “Forest cover assessment using remote-sensing techniques in Crete Island, Greece”
- Addendum
- The relationship between heat flow and seismicity in global tectonically active zones
- Commentary
- Improved entropy weight methods and their comparisons in evaluating the high-quality development of Qinghai, China
- Special Issue: Geoethics 2022 - Part II
- Loess and geotourism potential of the Braničevo District (NE Serbia): From overexploitation to paleoclimate interpretation