Urbanization and forecast possibilities of land use changes by 2050: New evidence in Ho Chi Minh city, Vietnam
-
Nguyen Tran Tuan
 ,
Gábor Hegedűs
,
Gábor Hegedűs

Abstract
Research on land use change (LUC) is considered as one of the important studies contributing to the assessment of land use efficiency and the development of appropriate policies for sustainable land use in the current urbanization period. Modeling is a method of simulating changes based on the understanding of LUC laws and forecasting future LUC. This study uses Markov chains to simulate the probability of the transition matrix to forecast LUC in Ho Chi Minh (HCM) city by 2050. The research results show that the three main land groups in HCM city were agricultural land, residential land, and water. The agricultural land group occupied the largest area, but it has decreased by nearly 10% from 2000 to 2020. In contrast, the urban land group had a strong increasing trend, with an increase of nearly 25% after 20 years. In terms of spatial distribution, HCM city tended to develop in three main directions: east, southwest, and northwest. With an accuracy of 91%, the study predicts that by 2030, agricultural land will still account for more than half of HCM city’s area, but by 2050, this land group will only account for less than 40%. In contrast, by 2050, residential land is projected to become the largest land group in the city with more than 50%. As a result, this forecast shows a difference from HCM city’s land use target by 2030.
1 Introduction
Urbanization is an unavoidable trend and a universal social development process that is present in all nations of the world and is intensifying [1]. Depending on the research perspective, the definition of urbanization shows differences. According to demographics and economic geography, urbanization is defined as the movement of individuals from rural to urban areas, resulting in an increase in the number of people residing in urban areas [2], while it is understood as the process of reorganizing human living environment from a sociological perspective [3]. Urbanization significantly transforms the distribution of the population and the physical environment, while also reshaping the socioeconomic patterns of life, bringing urban culture to rural areas. Thus, the urbanization process encompasses both quantitative aspects, such as population growth and territorial expansion [4], and productivity growth [5], as well as qualitative aspects, including improvements in living standards and overall quality of life [6].
Urbanization and industrialization go hand in hand [7] in many fast-developing countries, such as Vietnam, and urbanization impacts urban development in both positive and negative ways [8]. Urbanization brings many benefits, such as promoting economic development [9], technological and infrastructural advancement [10], improved transportation and communication [10], educational facilities [11], and quality of health-care [12]. Additionally, urbanization causes areas to change their organizational form from rural to urban, thereby changing their management forms, policy mechanisms, and other activities [13]. Urbanization also promotes production development and increases the dynamics of production activities [14]. Lack of control over the urbanization process, however, will exacerbate issues like environmental pollution, social ills, and poor planning [15]. These issues have a significant impact on the lives and civilizations of the city and society [16].
The need for land use is growing due to rapid urbanization [17]. This calls for expanding the scope of land use and making the most of every available square foot of land. However, a variety of factors influence the land-use process [18]. Natural circumstances often manifest as laws, influencing the use of land, especially in agricultural production [19]. Natural conditions have a direct and indirect impact on business operations such as the food processing industry and non-agricultural production [20]. Socioeconomic factors also influence the modes of land use [21]. For example, improper land fund allocation can result in land pollution and arable land loss [22]. Meanwhile, land use fluctuation is the shift in a land use type over time because of human exploitation and use, as well as natural and socioeconomic factors [23]. The interactions between the various elements of nature are what keep everything in the natural world constantly fluctuating rather than being constant. Therefore, it is essential to understand land fluctuations in order to efficiently exploit an area’s land resources, safeguard this priceless resource, and preserve the natural environment. Landscape change, ecosystem change, climate change, urbanization, environment, and sustainable development are some of the groups of land use change (LUC) that are studied [24]. In other words, one of the challenges presented by the process of urbanization in newly developed regions is identifying fluctuations and trends in LUC [25].
Following the implementation of Vietnam’s renovation policy, the urbanization process experienced significant acceleration and development. The accelerated urbanization rate has significantly contributed to socio-economic growth, facilitating economic restructuring toward industrialization and modernization [26]. The urban system has expanded significantly, resulting in the emergence of two major urban centers (Hanoi and Ho Chi Minh [HCM] city) that hold a crucial role and status within the regional urban cluster. As one of two special urban areas in Vietnam, the pace of urbanization in HCM city is very fast [27]. This helps bring this city outstanding economic growth, creating motivation for the development of the southern key economic region. According to the HCM city regional planning for 2030 and vision for 2050, the total area of the region will expand to 30,404 km2, the population is forecast to be about 24–25 million people in 2030 and the urbanization rate will reach 70–75% [28]. The plan sets the goal of developing the HCM city region into a dynamic, sustainable urban development. However, along with development, HCM city is facing many challenges of becoming a modern city as well as maintain sustainable economic, social, and environmental development. In HCM city, the land use plan for the period 2021–2025 in the area has been approved. The city will allocate 102,191 ha of agricultural land, 106,750 ha of non-agricultural land, and 598 ha of unused land [29]. For the plan to change land use purposes, the city sets a target of converting 684 ha of non-agricultural land to residential land, 9,867 ha of agricultural land to non-agricultural land, and the use structure of 4,480 ha of land within agricultural land [29]. This study will use GIS technology and Markov chain to answer the following questions: (1) What is the trend of LUC in HCM city through the two periods 2000–2010 and 2010–2020? and (2) What is the forecast of LUC in HCM city for 2050?
The following section of the article presents the research techniques used in the article, then the research findings, to address these two questions. Finally, the authors answer the research questions in the conclusion. The research results aim to contribute to existing research. Besides, the aim of this study is to compare the difference between the results of land use conversion forecasts and land use planning in HCM city until 2030. From there, the research can provide more data to support the adjustment of the city’s land use planning in the future.
2 Overview of some land use conversion forecasting models
Monitoring and analyzing changes in land conversion are necessary to provide information on existing land use patterns and changes [30]. It assists decision-makers in promoting sustainable development. Therefore, we use land use conversion models to enhance the understanding of changes in land use resulting from human activities [31]. In addition, geographic information systems and remote sensing are powerful tools for LUC analysis and simulation [32]. They are applied to understand land changes through the identification of past and present conditions. Accurate analyses of past and present conditions play an important role in the quality of the predicted changes. Moreover, rapid advances in geospatial models have made the simulation of urban growth increasingly feasible.
Numerous studies have proposed various models and discussed their advantages and disadvantages. The land transformation model, although showing good predictive ability at high resolution, involves complex operational steps, making it one of the least popular applications [33]. The Weights of Evidence model requires rich data and detailed maps, making it more difficult to collect all the necessary data [34]. Many researchers have also applied the combination of Markov chains and cellular automata (CA) [35,36,37]. However, the realistic simulation of this combination requires consideration of social, environmental, and economic dynamics. Therefore, to assume linear trends in space and time, it is necessary to deploy models that avoid these limitations. The combination of Markov chain and artificial neural network (ANN) models can address these issues. ANN can capture non-linear relationships between factors and handle complex patterns such as urban growth and LUC with high efficiency [38,39,40].
In summary, the above analysis reveals that LUC represents a complex process, and the Markov-ANN model for prediction offers a comprehensive understanding of the complexity of the spatial system’s components. Limited experimental research on this issue has been conducted in Vietnam so far. This study utilizes the Markov chain and ANN to predict LUCs in one of Vietnam’s two largest urban areas up to 2050. In addition, the Markov chain model has a relatively simple and intuitive logic system. This model offers an attractive alternative to complex land use models. It helps planners obtain an overview of land use information in a timely manner. The simulation results for future urbanized areas can support authorities and urban planners in making policies related to land use and management to address rapid economic development and population growth.
3 Study area and methods
3.1 Study area
HCM city, also known as Saigon before 1975, is one of Vietnam’s two “special urban” areas. Roads from the city center of Hanoi in Northern Vietnam reach this city at a distance of approximately 1,730 km. Because of its location in Southeast Asia’s geographic center, HCM city serves as a significant traffic hub, not only on land but also on waterways and in the air (Figure 1). As a result, the city has played a significant role in connecting the provinces in the surrounding area, emerging as an extremely important international gateway.
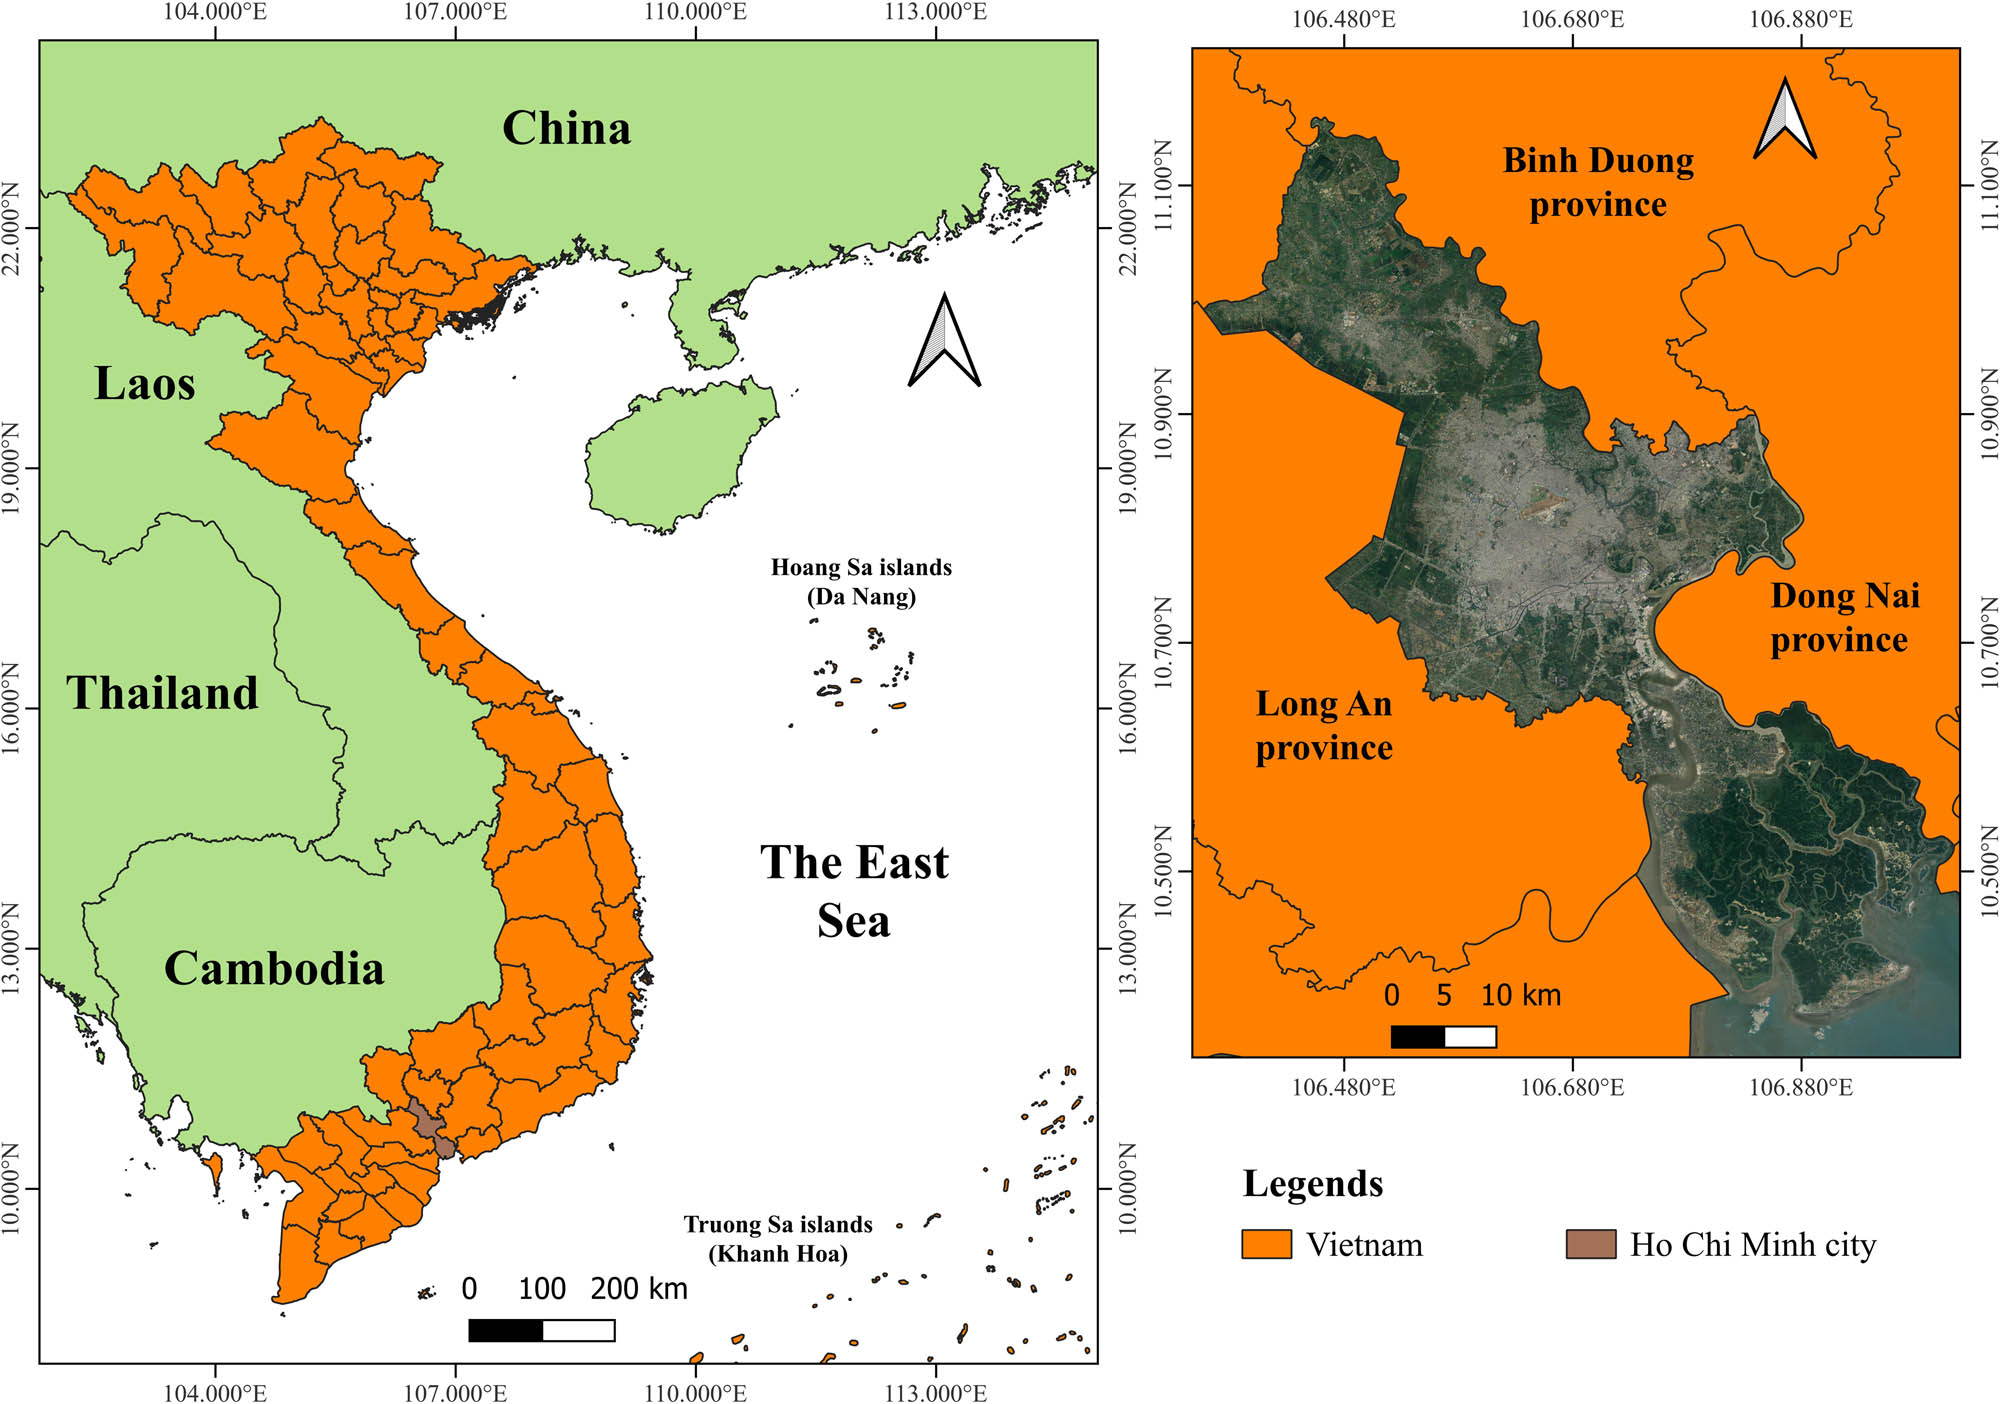
The location of HCM city. Source: authors’ compilation from GADM, 2024.
HCM city’s topography situates it in a transition zone between the Mekong Delta and the Southeast region. This phenomenon affects the city’s lower terrain, which stretches from north to south and from west to east. HCM City is the most populous and urbanized city in Vietnam. It is also the country’s financial and commercial hub. According to the census results, by the end of 2021, the city’s population was greater than 9.1 million people, and the average population density was 4,375 people per km2. In terms of economy, the GDP in 2022 of HCM city reached about 1,479 trillion VND, an increase of 9.03% compared to 2021 [41]. According to estimates, this region contributes the most to the national GDP in 2022, accounting for 15.55% (Tien, 2023). Regarding administrative division, HCM City currently has 16 districts, 1 city (Thu Duc City), and 5 counties. Thu Duc City is located at the eastern gateway of HCM city and has an important position in the key economic region of the South of Vietnam. Thu Duc city is the first city in Vietnam to establish an administrative unit under a centrally-governed city.
3.2 Research method
3.2.1 Research model
Various studies worldwide have utilized the Markov chain model to forecast changes in land usage within specific regions, particularly in developing nations like Pakistan [42], China [43], Cambodia [44,45], and Laos [46]. In Vietnam, certain academics have also forecast variations in certain regions, such as Hanoi [47], Nam Dinh [48], and Long An [49]. However, a significant drawback is that no one has studied the transition of a large urban region like HCM city to forecast this change. Consequently, this study employs the Markov chain model to predict land use alterations in HCM city up to 2050. We consider the Markov chain model’s logic structure to be reasonably straightforward and understandable regarding the aims of our research. This model provides planners with a quick overview of land use data, making it an appealing alternative to more complex land use models. The relevant model forecasts the distribution of future land uses, as well as the likelihood of LUC. According to Kulkarni [50], this Markov chain that predicts a future event essentially calculates the expected probability value of that random event based on the probability matrix of the previous random event sequence. The Markov chain says that we can figure out what will happen to a system at a certain time if we know what it was like at a previous time. The assumption is that the simulation period will match the calibration period’s change rate. The Markov model produces a matrix representing the odds of transition between different land use types. This probability matrix is related to the areal scale matrix and the number of transition pixels. This geographical model for land use/land cover forecasting is accessible and based on the analysis of complex system dynamics [42]. Scholars acknowledge it as a legitimate two-dimensional method for depicting the spatial and temporal dynamics of a specific region. The model has demonstrated effective performance in both temperate and hot climates, as well as at different scales [51]. As a result, the primary advantage of this model is its simplicity, while effectively demonstrating the capacity to modify the specifics of various land use types. In the Markov chain model, the spatial distribution of land types remains indeterminate. The following formula uses the Markov chain to forecast land use area:
From formula (1), it can see that the Markov chain model examines land use zoning images and generates an output comprising a potential change matrix and a resultant image derived from this matrix for the last year. A potential change matrix illustrates the probability of each category of land use classification transitioning to another land use in the future.
This formula is rewritten as a generalization for the prediction matrix as follows:
In which, P t1…P tN is the area of land types at the time of year t2.
A t1 … A tN is the area of land types at the time of year t1.
P 11…P NN is the probability of the change in land use types in the period t1 – t2.
The accuracy of the forecast results of LUC is calculated based on the error between the difference area and the total area of all types of land through the following formula:
3.2.2 Input data and data processing
As one of its inputs, the model relies on data about land use. We inherited these data from the processed Advanced Land Observing Satellite (ALOS) data, which had map accuracy of 86, 89, and 92% for the years 2000, 2010, and 2020. This is also the first 30 m annual land cover dataset across Vietnam from 1990 to 2020. This dataset used ground data as well as all freely available remote sensing images, such as Sentinel-1, Sentinel-2, and Landsat, and used random forest-based algorithms for analysis. The data gathered by ALOS categorize the land in HCM into ten distinct land classes. However, based on the 2024 land law recently promulgated in Vietnam, we have synthesized and grouped land groups with similar properties to form 5 land groups. These include agricultural land, residential land, forests, barren land, and water. This study uses the spatial analysis function of the QGIS software to overlay pairs of maps covering the time periods of 2000–2010 and 2010–2020 to evaluate changes in land use. In the meantime, the research follows these five primary steps to predict changes in land use in 2050.
In the first step, we created a map of LUC over the two periods of 2000–2010 and 2010–2020. In this step, we used the map overlay algorithm to determine the transition matrix between land classes in the two periods. We were also able to observe the extent of land area transfer from one land class to another.
The second step of the study was to construct a state matrix, also known as a probability matrix. We formed a state matrix from the transition matrix in the first step to forecast the land use area in the following year.
Then, we ran a test model to predict LUC. This is the third step of the research model. Formula (1) applies a Markov chain to this prediction. This prediction will show the differences in land use area with the statistical data.
From there, we apply formula (2) to evaluate the reliability of the Markov chain model. If the accuracy of the forecasting model is greater than 70%, the model is accepted to calculate the land use area in HCM city by 2050 (Figure 2).
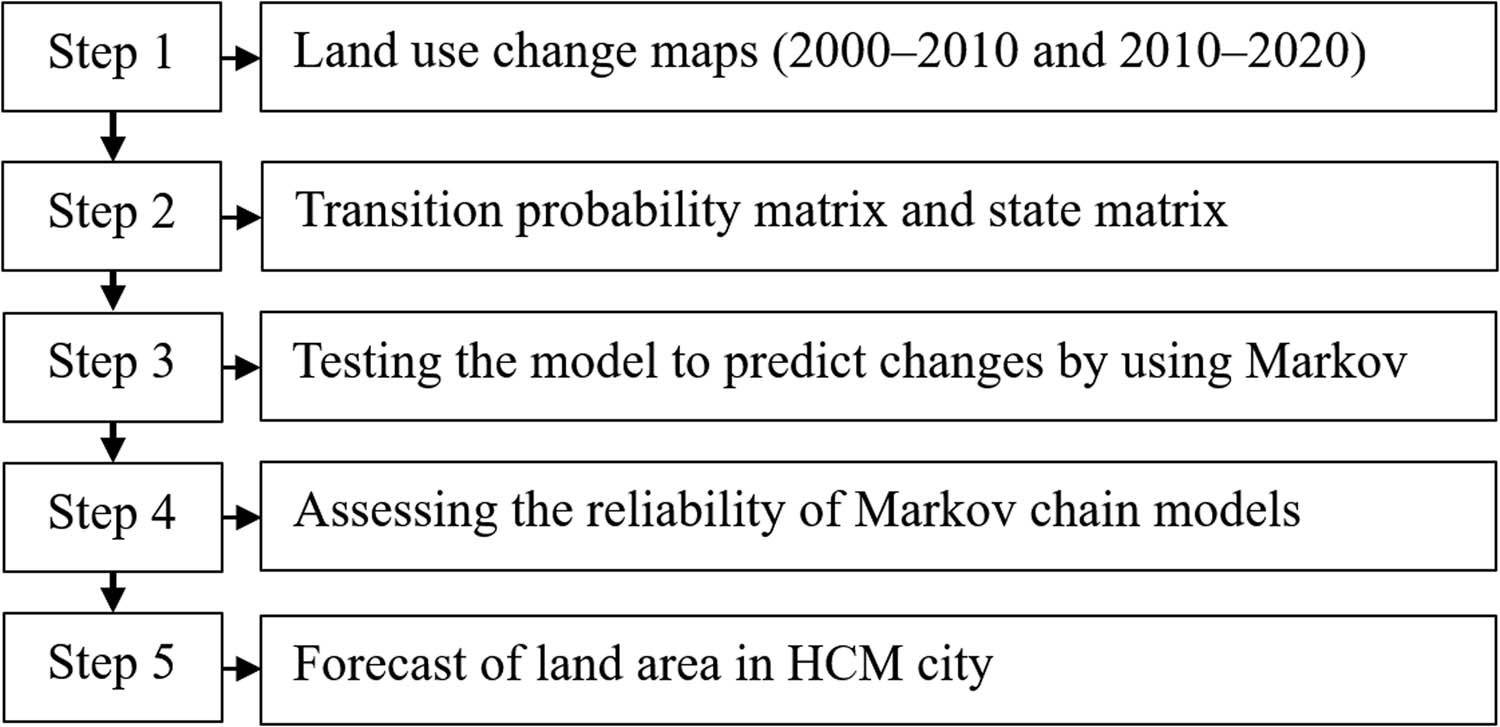
Steps to forecast land use conversion. Source: authors’ compilation, 2024.
Finally, we forecast the land area through formula (1). Unlike some other studies, assuming the transition probability of each land use type does not change over time, this study recalculates the probability matrices according to the forecast data of the previous forecast years. This appears to produce more accurate forecast results than the probability matrix, which does not change.
This study uses the ANN approach to predict the spatial distribution of land use. This is an ANN, a mathematical model constructed based on biological neurons. The creation of forecast maps via the ANN approach provides policymakers with a novel insight into LUCs informed by previous data. These maps show how a variety of environmental and socioeconomic factors influence land use transformation. This strategy has numerous advantages for representing urban expansion.
4 Research results
4.1 Statistics of land use areas in HCM city
Figure 3 shows the land use situation in HCM city in the years 2000, 2010, and 2020. HCM city’s three main land groups are agricultural land, residential land, and water. The agricultural land group took up most of the space, accounting for over half of the city’s total area. However, this was also the land group that witnessed the largest decrease, with nearly 10% after 20 years. In particular, the agricultural land group experienced the largest decrease in the first 10 years of this study. In contrast, the urban land group tended to increase sharply, with a growth rate of nearly 25% after 20 years. Similar to the agricultural land group, the period with the largest urban land conversion was 2000–2010. Forests were another land group that experienced a significant decline. However, in contrast to the two previously mentioned land groups, the forest land group experienced a more significant decline from 2010 to 2020.
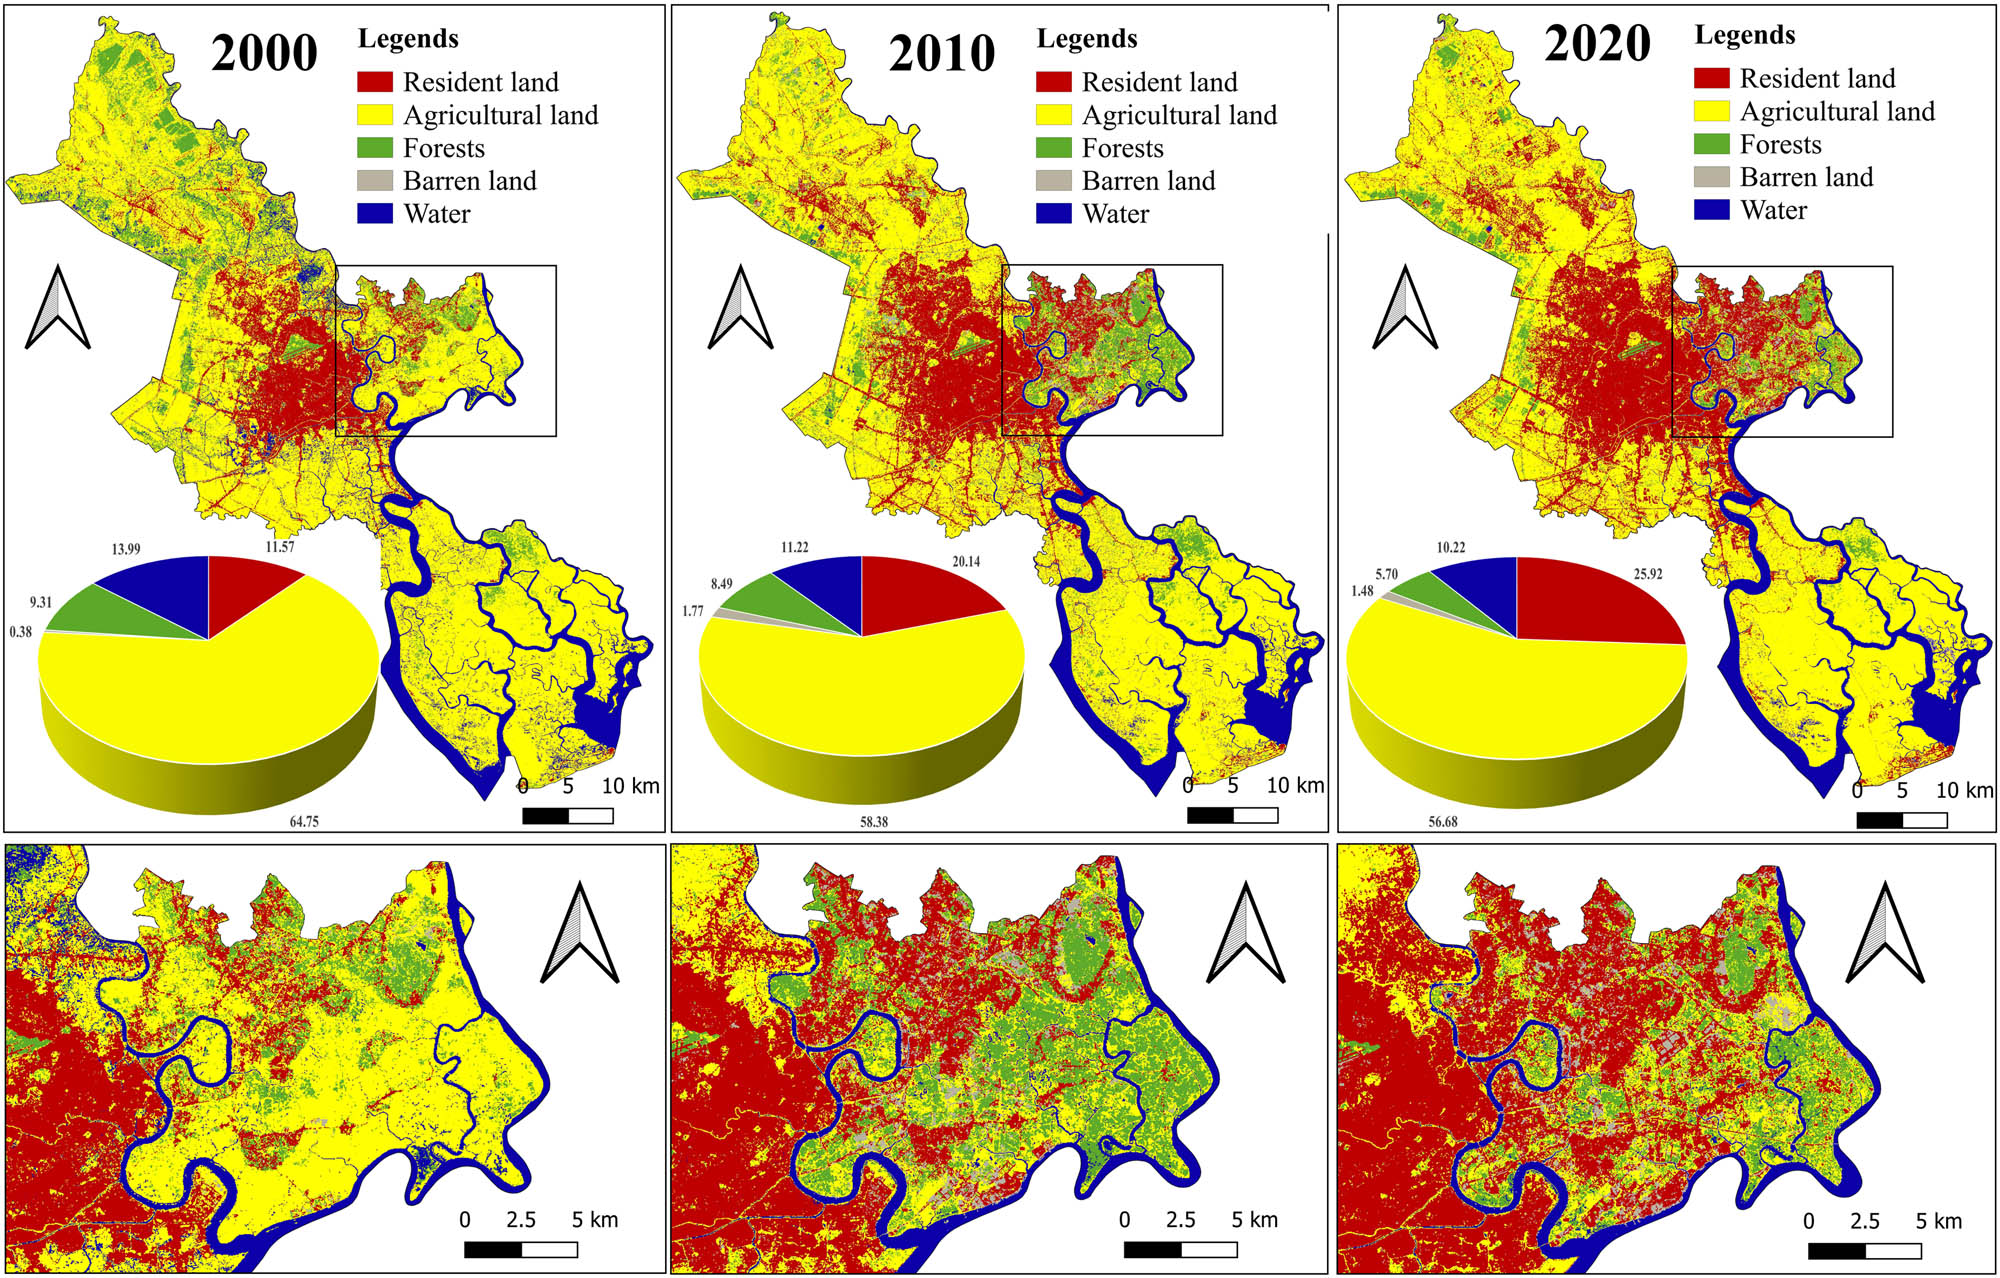
Land use/land cover in HCM city in 2000, 2010, and 2020. Source: authors’ compilation from ALOS, 2024.
In terms of spatial distribution, HCM city tended to develop in three main directions. These include the east, southwest, and northwest of the city center. Specifically, the period 2000–2010 witnessed urban development to the east and northwest of the city, with the red stripe being more prominent in these two areas. Meanwhile, the period 2010–2020 saw bolder red strips in the east and southwest areas. In particular, there was more urban land expansion along the Saigon River. After 20 years, it is evident that the city was developing more urban areas to the east. This shift in direction is due to the concentration of many newly emerging industrial parks in the southeast region, in Dong Nai and Binh Duong.
4.2 Reliability of the research model
Table 1 shows the land use conversion matrix between groups during the period 2000–2010. The results indicate that the agricultural land group has the largest tendency to convert to urban land with more than 14,000 ha, followed by the conversion of this land group to forests with nearly 12,000 ha. The forest land group also experienced a significant conversion to other land groups. Urban land accounted for over 2,000 ha, while agricultural land occupied 11,800 ha.
Matrix of LUC in the period 2000–2010
| Unit: ha | 2010 | ||||||
|---|---|---|---|---|---|---|---|
| Resident | Agriculture | Barren | Forests | Water | Total 2000 | ||
| 2000 | Resident | 24097.32 | 0.63 | 2.52 | 0.09 | 0.00 | 24100.56 |
| Agriculture | 14077.35 | 102971.25 | 2872.53 | 11994.39 | 2913.93 | 134829.45 | |
| Barren | 212.04 | 328.05 | 86.04 | 136.08 | 19.53 | 781.74 | |
| Forests | 2051.46 | 11794.95 | 530.19 | 4838.76 | 168.66 | 19384.02 | |
| Water | 1504.80 | 6470.73 | 188.19 | 713.43 | 20250.99 | 29128.14 | |
| Total 2010 | 41942.97 | 121565.61 | 3679.47 | 17682.75 | 23353.11 | 208223.91 | |
Source: Authors’ compilation, 2024.
After constructing a land area conversion matrix in HCM city in the period 2000–2010, the study uses formula (1) to forecast LUC using Markov chains. This is to determine the probability value of LUC for each type of land use. The results in Table 2 show that the conversion probability of barren land to the remaining land groups had a more uniform value than that of other land groups. This means that the conversion from barren land was more evenly distributed than other land groups. If the conversion probability values of the same land type after 10 years are not considered, the probability value of agricultural land to forests was the largest with 0.61 units. The probability value of agricultural land to barren land, at 0.42 units, follows closely. Meanwhile, the residential land conversion rate to other land groups was very low, resulting in an estimated probability value of 0.
Probability matrix of LUC over the period 2000–2010
| Resident | Agriculture | Barren | Forests | Water | |
|---|---|---|---|---|---|
| Resident | 1.00 | 0.00 | 0.00 | 0.00 | 0.00 |
| Agriculture | 0.10 | 0.76 | 0.02 | 0.09 | 0.02 |
| Barren | 0.27 | 0.42 | 0.11 | 0.17 | 0.02 |
| Forests | 0.11 | 0.61 | 0.03 | 0.25 | 0.01 |
| Water | 0.05 | 0.22 | 0.01 | 0.02 | 0.70 |
Source: Authors’ compilation, 2024.
Table 3 displays the outcomes of land area forecasting in 2020 using the Markov chain. The forecast results indicate that we expect to use more residential land, barren land, and forests than the statistics, while we expect to use less agricultural land and water areas than the actual data. The largest difference comes from the agricultural land group with over 7,500 ha, followed by the residential and forest land group with over 4,500 ha. The land area with the largest projected conversion is agricultural land, with this group projected to convert over 27,000 ha to residential land from 2010 to 2020. The projection also indicates that the agricultural land group converts over 12,700 ha to forest land, only to reclaim over 12,200 ha in the reverse conversion process.
Forecast results of changes in land area in 2020
| Unit: ha | Resident | Agriculture | Barren | Forests | Water |
|---|---|---|---|---|---|
| Resident | 24094.84 | 2.22 | 2.81 | 0.61 | 0.08 |
| Agriculture | 27025.62 | 87792.24 | 2858.32 | 12725.86 | 4427.41 |
| Barren | 285.01 | 373.79 | 20.33 | 78.61 | 24.00 |
| Forests | 3947.30 | 12212.32 | 443.30 | 2353.59 | 427.52 |
| Water | 3352.94 | 9953.62 | 309.08 | 1282.49 | 14230.01 |
| Total 2020 (prediction) | 58705.71 | 110334.18 | 3633.84 | 16441.16 | 19109.02 |
| Total 2020 (statistical) | 53965.44 | 118029.06 | 3084.66 | 11870.10 | 21279.87 |
| Differential area | 4740.27 | −7694.88 | 549.18 | 4571.06 | −2170.85 |
Source: Authors’ compilation, 2024.
This study assesses the reliability of the forecast results by comparing them to actual data using the accuracy criterion. The accuracy serves as a basis for verifying the model’s forecast results for the upcoming period. When comparing the forecast area in 2020 with the statistical area in 2020, according to the image interpretation results from Table 1, the forecast area of the Markov model is only slightly different from the actual area. Formula (2) calculates the error, which Table 3 reveals to be 9.47%. Thus, the forecast model’s accuracy of 91.53% demonstrates the full application of the Markov chain in forecasting LUC in HCM city.
4.3 Forecast of LUC by 2050
Applying the Markov chain, the study predicted the land area of HCM city by 2050, as shown in Table 4. The results show that the two land groups with the largest change trends are urban land and agricultural land. Forecasts indicate that by 2030, agricultural land will still make up more than half of the HCM city’s area, but by 2050, this land group will contribute less than 40% to the city’s total natural area. In contrast, the resident land group’s strong rise has led it to become the city’s largest land group, accounting for more than 50% of the total land area. By 2050, it appears that the city of HCM will utilize all unused vacant land groups, while the area of forest land is expected to decrease to approximately 3%.
Forecast results of land areas by 2050
| Categories | Resident | Agriculture | Barren | Forests | Water | |
|---|---|---|---|---|---|---|
| Resident | 39450.97 | 2225.13 | 192.38 | 69.95 | 6.79 | |
| Agriculture | 18243.65 | 94537.63 | 1312.11 | 6524.30 | 950.70 | |
| Barren | 1710.76 | 1176.10 | 542.99 | 201.63 | 48.18 | |
| Forests | 4257.94 | 10380.26 | 374.85 | 2536.83 | 132.86 | |
| Water | 589.42 | 3897.48 | 293.50 | 309.75 | 18262.96 | |
| Total 2030 (prediction) | ha | 64252.74 | 112216.60 | 2715.83 | 9642.46 | 19401.50 |
| % | 30.86 | 53.89 | 1.30 | 4.63 | 9.32 | |
| Total 2040 (prediction) | ha | 81346.43 | 100440.13 | 2354.87 | 7919.05 | 16168.65 |
| % | 39.07 | 48.24 | 1.13 | 3.80 | 7.76 | |
| Total 2050 (prediction) | ha | 105967.98 | 82500.43 | 2052.35 | 6320.31 | 11388.05 |
| % | 50.89 | 39.62 | 0.99 | 3.04 | 5.47 | |
Source: Authors’ compilation, 2024.
Results of Table 4 also show the forecast results of land use conversion between land groups by 2030 and the forecast results of land use conversion by 2040 and 2050. The agricultural to urban land group accounts for the majority of the conversion area, with an area of over 18,000 ha, while the forest land group follows with a conversion area 4.5 times lower, at just over 4,000 ha. Conversely, the conversion of forest land to agricultural land accounts for nearly twice as much as the opposite trend, with over 10,200 and 6,500 ha, respectively. Furthermore, we expect the barren land group to allocate a larger portion of its area to residential land, with agricultural production following closely behind.
4.4 Forecasting spatial transformation in HCM city
Figure 4 shows the results of land use conversion forecasts in terms of spatial distribution in HCM city in 2030, 2040, and 2050. According to the prediction results from the Markov model, by 2050, there will be very minimal forest land left in HCM city, and the agricultural land group will also show a lot of loss. Instead, there is a red color of residential land in Figure 3. Specifically, during the period 2020–2030, the city will continue to trend toward the east; concurrently, the trend toward the north will become more evident. In the next 10 years, the east of the city will continue to expand, but the north and southwest will show a more pronounced expansion in urban land. By 2050, urban land (indicated by red color in the map) will almost completely cover the east side of the city. The city’s three directions – the north, southwest, and south – will also exhibit increased urban expansion.
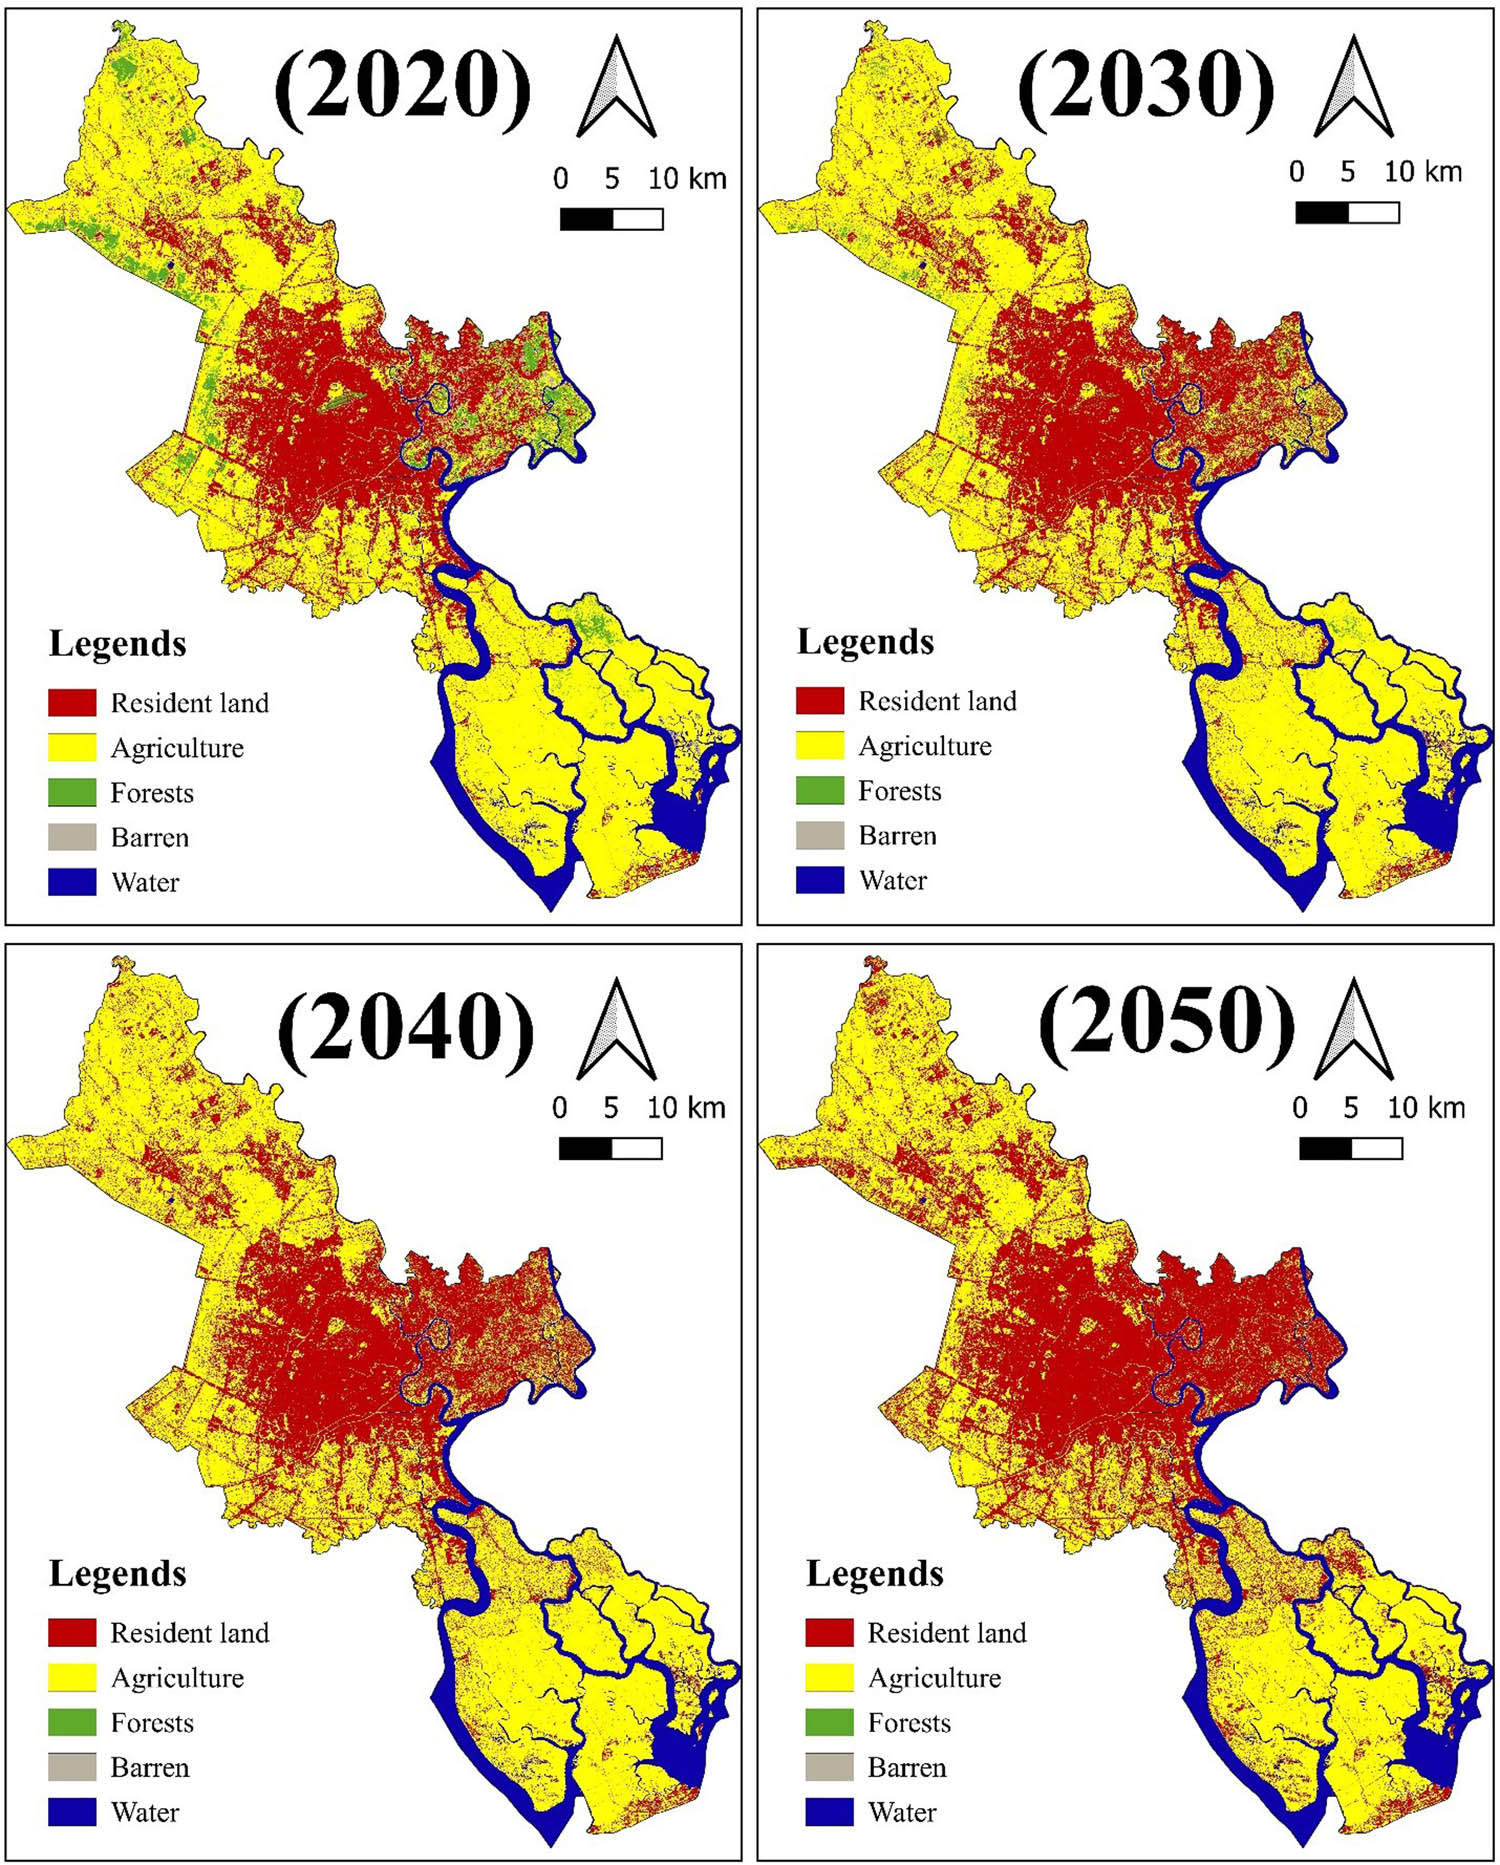
Forecasting the transformation of land use spatial distribution in HCM city. Source: Authors’ compilation by ANN approach, 2024.
5 Discussion and recommendations
The geographical location of HCM city is of particular importance from the perspective of natural geography, geo-economics, geopolitics, and terraforming. This provides a solid foundation for the city’s international and regional development. The socio-cultural context of HCM city also has many advantages, the most important of which are a large, diverse population, highly skilled labor, unique culture, and an open, friendly, flexible, and dynamic social atmosphere. Furthermore, the convergence of many favorable conditions in HCM city has resulted in a surplus of technical and social infrastructure, as well as an increase in environmental pollution. Therefore, land use conversion is inevitable. This study forecasted the land use conversion process to determine whether HCM city’s planning in the period 2021–2030 has met expectations or not.
The planning indicates that HCM city’s agricultural, non-agricultural, and unused land areas will span 86,733, 125,186, and 309 ha, respectively, by 2030. However, the study’s forecast results show that the land use planning target in HCM city by 2030 will be difficult to meet expectations. To reach the level of over 86,000 ha of agricultural land, HCM city can achieve it by 2050, not as planned by the city, while the goal of increasing the urban land area to over 125,000 ha will probably take a long time. HCM city aims to convert 25,723 ha of agricultural land to non-agricultural purposes by 2030, but we have calculated and forecasted that the city can only convert about one-tenth of the proposed target. We can point out that Vietnam continues to experience suspended planning [52]. In fact, suspended planning and projects are not new problems in HCM city [53]. By the end of 2023, the city has more than 600 unimplemented projects with a total area of more than 20,000 ha [54].
Therefore, in order to implement the proposed planning, HCM city needs to resolve the situation of suspended planning for each area and project. In certain areas, the abandonment of planning is necessary to safeguard the legitimate rights of the people involved in projects that have been on hold for 20–30 years without any new opportunities [55]. In the future, when the state wants to plan a project, the most important thing to determine from the beginning is feasibility, especially the investor’s financial capacity. The government must consider the economic, social, and environmental impacts on residents during project implementation, including the feasibility of resettlement, compensation, and site clearance. Planning should exclude issues that are difficult to resolve in the near future. Planning is the state’s authority, but it must serve the people’s interests. Hence, first and foremost, it is necessary to ensure the right to stabilize people’s lives in the planning area. In addition, unsynchronized land use planning and overlapping between management agencies are among the main causes of project suspension. Therefore, urban planning in HCM city in particular and Vietnam in general should be built based on actual needs and should not follow short-term GDP growth targets. The legal system needs to be clearer and more transparent to ensure that projects are implemented on schedule. Measures such as high taxes on abandoned land, shortening legal procedures, and creating conditions for investors to redevelop projects are necessary. In addition, the application of big data technology and the digitization of land information can help the government better control land use. Technology helps increase transparency in planning, minimizing the risk of project delays.
Our research findings, which indicate increased urban expansion to the east region of HCM city, align with the city’s developmental strategy. This is the region where Thu Duc city, a subdivision of HCM city, was built in 2020. Thu Duc city represents a novel paradigm in Vietnam, implemented for the first time as a city directly subordinate to the central municipality. Consequently, the plan designates Thu Duc city as a multi-centered urban area, serving as a core for innovation and the advancement of digital infrastructure within the HCM city region. This development is anticipated to serve as the catalyst for the advancement of the entire Southeast area. Consequently, the HCM city government must utilize land to enhance the productive potential of socio-economic sectors. This aims to facilitate economic restructuring and prioritize land distribution for industrial, commercial, and service sectors. Additionally, increased urban growth to the east necessitates that communities prioritize the allocation of sufficient land for the construction of integrated infrastructure. Infrastructure construction must occur concurrently with the development of residential areas, industrial zones, and urban expansion, taking into account the integration of infrastructure that supports both economic activities and the cultural life of the population.
This study has some limitations due to the Markov model’s application. The Markov chain forecasting relies on the probability of past fluctuations. The greater the variation in land types, the lower the Markov model’s accuracy, and vice versa. Besides, forecasting LUC by Markov chain needs to meet two conditions, i.e., the probability of events occurring in the future and the past is constant, and the probability matrix must satisfy the normal matrix. In practice, satisfying both of the above conditions is very rare. Therefore, if we accept the forecasting quality at a moderate level, we can use the Markov chain to predict the time when these fluctuations reach a steady state. In addition, combining multiple time-lapse and high-precision images to predict LUC can provide long-term and accurate forecasts for the future. In addition, the study focuses on forecasting LUC in HCM city until 2050, so this study has not delved into the impacts of urban expansion, such as environmental pollution. We plan to incorporate it into our future research.
6 Conclusion
Assessing LUC through the application of GIS technology gives detailed results, analyzing the conversion between each type of land and the increase or decrease in the same type of land at different time points. According to the study on LUC in HCM city, agricultural land, resident land, and water were the three main land groups. The agricultural land group, which accounted for more than half of the city’s total area, has experienced a significant decline of nearly 10% over the past 20 years. In contrast, the urban land group had a strong increasing trend, with a growth of nearly 25% after 20 years. The forest land group also experienced a significant decline. However, the decline in the forest land group was more pronounced between 2010 and 2020. In terms of spatial distribution, HCM city tended to develop in three main directions, namely, east, southwest, and northwest. The period 2000–2010 witnessed urban development in the east and northwest of the city, while the period 2010–2020 saw strong development in the east and southwest areas. In particular, there was more urban land expansion along the Saigon River. This indicates that the city has been developing more urban areas in the east over the past 20 years.
We have tested and evaluated the Markov chain model on data to forecast future land resource changes. The results show that the model’s accuracy is high, with an accuracy of over 91% compared to reality. The results of using the Markov chain model with the LUC probability matrix and the land status matrix have predicted the land use area by 2030, 2040, and 2050. The research results show that the two land groups with the largest change trends are urban land and agricultural land. Forecasts indicated that by 2030, HCM city’s agricultural land will still make up more than half of the city’s total area, but by 2050, this land group will contribute less than 40%. In contrast, the significant increase in the resident land group has made it the largest land group in the city, accounting for more than 50%. By 2050, it appears that HCM city will utilize all vacant land groups, while the area of forest land is expected to decrease to approximately 3%. This forecast shows the difference compared to HCM city’s land use target by 2030. An analysis reveals that HCM city’s current state of suspended planning is the reason for this gap. As a result, the city’s land use targets may only be implemented on paper and cannot be put into practice.
Our research findings indicate that the Markov model guarantees precision, efficiency, and practicality. As a result, this method is sufficiently reliable for short-term land use conversion forecasting in HCM city, specifically, and Vietnam as a whole. To enhance efficiency, the Markov model needs to be employed in regions of Vietnam characterized by minimal fluctuations in land use conversion. To predict the moment when land use attains equilibrium, it is essential to analyze the original data to construct a normal probability matrix prior to the forecast. Furthermore, to enhance the application of the Markov chain model in projecting LUC, future studies should concentrate on the following two primary aspects. Initially, it is essential to assess and validate the model’s correctness. Second, it is essential to ascertain the best duration for using the Markov model by augmenting the sample size and the land use conversion timeframe. The study also analyzed the need for innovative and thoughtful structures and systems in urban planning to ensure a sustainable urban future. This will help HCM city in particular and cities in Vietnam in general become livable and competitive in the sustainable urban model.
Acknowledgements
The authors would like to thank the reviewers’ comments and editing of this work, which helped in making this article more complete.
-
Funding information: This research is funded by National Economics University, Vietnam.
-
Author contributions: All authors accepted the responsibility for the content of the manuscript and consented to its submission, reviewed all the results, and approved the final version of the manuscript. N.T.T.: conceptualization, funding acquisition, methodology, and writing – original draft. G.H.: formal analysis and writing – review and editing. N.T.T.P.: writing – review and editing and funding acquisition.
-
Conflict of interest: Authors state no conflict of interest.
-
Data availability statement: All data generated or analyzed during this study are included in this published article and its supplementary information files.
References
[1] Turok I, McGranahan G. Urbanization and economic growth: the arguments and evidence for Africa and Asia. Environ Urbanization. 2013;25(2):456–82. 10.1177/0956247813490908.Search in Google Scholar
[2] Wineman A, Alia DY, Anderson CL. Definition of “rural” and “urban” and understanding of economic transformation: Evidence from Tanzania. J Rural Stud. 2020;79:254–68. 10.1016/j.jrurstud.2020.08.014.Search in Google Scholar PubMed PubMed Central
[3] Zhang J-X, Cheng J-W, Philbin SP, Ballesteros-Perez P, Skitmore M, Wang G. Influencing factors of urban innovation and development: a grounded theory analysis. Environ Dev Sustainability. 2022;25:2079–104. 10.1007/s10668-022-02151-7.Search in Google Scholar PubMed PubMed Central
[4] Kim H, Kim D. Changes in urban growth patterns in Busan Metropolitan City, Korea: Population and urbanized areas. Land. 2022;11(8):1319. 10.3390/land11081319.Search in Google Scholar
[5] Brunt L, Garcia-Penalosa C. Urbanisation and the onset of modern economic growth. Econ J. 2022;132(642):512–45. 10.1093/ej/ueab050.Search in Google Scholar
[6] Mouratidis K. Urban planning and quality of life: A review of pathways linking the built environment to subjective well-being. Cities. 2021;115:103229. 10.1016/j.cities.2021.103229.Search in Google Scholar
[7] Li M, Li L, Strielkowski W. The impact of urbanization and industrialization on energy security: A case study of China. Energies. 2019;12:2194. 10.3390/en12112194.Search in Google Scholar
[8] Gu C. Urbanization: positive and negative effects. Sci Bull. 2019;64(5):281–3. 10.1016/j.scib.2019.01.023.Search in Google Scholar PubMed
[9] Shaban A, Kourtit K, Nijkamp P. Causality between urbanization and economic growth: Evidence from the Indian States. Front Susta Cities. 2022;4:901346. 10.3389/frsc.2022.901346.Search in Google Scholar
[10] Pradhan RP, Arvin MB, Nair M. Urbanization, transportation infrastructure, ICT, and economic growth: A temporal causal analysis. Cities. 2021;115:103213. 10.1016/j.cities.2021.103213.Search in Google Scholar
[11] Campos PBR, de Almeida CM, de Queiroz AP. Educational infrastructure and its impact on urban land use change in a peri-urban area: a cellular-automata based approach. Land Use Policy. 2018;79:774–88. 10.1016/j.landusepol.2018.08.036.Search in Google Scholar
[12] Nnadi HC, Ossai OG, Nwokocha VC. Urbanization factors and the vagaries of the rural health care industry in Nigeria: an analysis of the accessibility of healthcare services by older adults in the Nsukka Local Government Area. Humanit Soc Sci Commun. 2024;11:1355. 10.1057/s41599-024-03799-4.Search in Google Scholar
[13] Streule M, Karaman O, Sawyer L, Schmid C. Popular urbanization: Conceptualizing urbanization processes beyond informality. Int J Urban Reg Res. 2020;44(4):652–72. 10.1111/1468-2427.12872.Search in Google Scholar
[14] Mehmood R, Ullah Z, Lal I. Human capital, urbanization and dynamics of economic growth and development. J Human Earth Future. 2021;2(4):382–94. 10.28991/HEF-2021-02-04-06.Search in Google Scholar
[15] Fan P, Ouyang Z, Nguyen DD, Nguyen TTH, Park H, Chen J. Urbanization, economic development, environmental and social changes in transitional economies: Vietnam after Doi Moi. Landsc Urban Plan. 2019;187:145–55. 10.1016/j.landurbplan.2018.10.014.Search in Google Scholar
[16] Bapari Y, Haque E, Chowdhury MKI, Islam J. Impacts of unplanned urbanization on the socio-economic conditions and environment of Pabna Munucipality, Bangladesh. J Environ Earth Sci. 2016;6(9):105–14.Search in Google Scholar
[17] Nuissl H, Siedentop S. Urbanisation and land use change. In: Weith T, Barkmann T, Gaasch N, Rogga S, StrauB C, Zscheischler J, editors. Sustainable land management in a European context. Human-environment interactions. Vol. 8, Cham: Springer; 2021. 10.1007/978-3-030-50841-8_5.Search in Google Scholar
[18] Prayitno G, Surjono, Hidayat ART, Subagiyo A, Paramasasi NK. Factors that effect to land use change in Pandaan District. IOP Conf Series: Earth Environ Sci. 2018;202:012006. 10.1088/1755-1315/202/1/012006.Search in Google Scholar
[19] Ma L, Zhang Y, Chen S, Yu L, Zhu Y. Environmental effects and their causes of agricultural production: Evidence from the farming regions of China. Ecol Indic. 2022;144:109549. 10.1016/j.ecolind.2022.109549.Search in Google Scholar
[20] Rasvanis E, Tselios V. Do geography and institutions affect entrepreneurs’ future business plans? Insights from Greece. J Innov Entrepreneurship. 2023;12:3. 10.1186/s13731-023-00266-3.Search in Google Scholar PubMed PubMed Central
[21] Handavu F, Chirwa PWC, Syampungani S. Socio-economic factors influencing land-use and land-cover changes in the Miombo woodlands of the Copperbelt province in Zambia. For Policy Econ. 2019;100:75–94. 10.1016/j.forpol.2018.10.010.Search in Google Scholar
[22] AbdelRahman MAE. An overview of land degradation, desertification and sustainable land management using GIS and remote sensing application, Rendiconti Lincei. Sci Fis Nat. 2023;34:767–808. 10.1007/s12210-023-01155-3.Search in Google Scholar
[23] Tuan NT. Urbanization and land use change: A study in Vietnam. Environ Socio-Econ Stud. 2022;10(2):19–29. 10.2478/environ-2022-0008.Search in Google Scholar
[24] Nath B, Wang Z, Ge Y, Islam KP, Singh R, Niu Z. Land use and land cover change modeling and future potential landscape risk assessment using Markov-CA model and analytical hierarchy process. Int J Geo-Information. 2020;9(2):134. 10.3390/ijgi9020134.Search in Google Scholar
[25] Hegazy IR, Kaloop MR. Monitoring urban growth and land use change detection with GIS and remote sensing techniques in Daqahlia governarate Egypt. Int J Sustain Built Environ. 2015;4:117–24. 10.1016/j.ijsbe.2015.02.005.Search in Google Scholar
[26] Tuan NT. Comparing the process of converting land use purposes between socio-economic regions in Vietnam from 2007 to 2020. Environ Socio-econ Stud. 2024;12(3):51–62. 10.2478/environ-2024-0019.Search in Google Scholar
[27] Hoi HT. Impacts of urbanization on the environment of Ho Chi Minh City. IOP Conference Series: Earth and Environmental Science. Vol. 505, 2020. p. 012035. 10.1088/1755-1315/505/1/012035.Search in Google Scholar
[28] Van H. New urban planning: Ho Chi Minh City to develop 5 satellite cities; 2024. https://vietnamnet.vn/en/new-urban-planning-ho-chi-minh-city-to-develop-5-satellite-cities-2294244.html.Search in Google Scholar
[29] Nuong C. TP.HCM đặt chỉ tiêu chuyển 648ha đất phi nông nghiệp sang đất ở (Ho Chi Minh City sets a target of converting 648 hectares of non-agricultural land into residential land); 2023. https://tuoitre.vn/tp-hcm-dat-chi-tieu-chuyen-648ha-dat-phi-nong-nghiep-sang-dat-o-20230515135608748.htm.Search in Google Scholar
[30] Ha TV, Tuohy M, Irwin M, Tuan PV. Monitoring and mapping rural urbanization and land use changes using Landsat data in the northeast subtropical region of Vietnam. Egypt J Remote Sens Space Sci. 2020;23(1):11–9. 10.1016/j.ejrs.2018.07.001.Search in Google Scholar
[31] Tesfayem W, Elias E, Warkineh B, Tekalign M, Abede G. Modeling of land use and land cover changes using Google Earth Engine and machine learning approach: implications for landscape management. Environ Syst Res. 2024;13:31. 10.1186/s40068-024-00366-3.Search in Google Scholar
[32] Sharma S, Beslity JO, Rustad L, Shelby LJ, Manos PT, Khanal P, et al. Remote sensing and GIS in natural resource management: Comparing tools and emphasizing the importance of in-situ data. Remote Sens. 2024;16(22):4161. 10.3390/rs16224161.Search in Google Scholar
[33] Pijanowski BC, Brown DG, Shellito BA, Manik GA. Using neural networks and GIS to forecast land use changes: a land transformation model. Comput Environ Urban Syst. 2002;26(6):553–75. 10.1016/S0198-9715(01)00015-1.Search in Google Scholar
[34] Amato F, Pontrandolfi P, Murgante B Using spatiotemporal analysis in urban sprawl assessment and prediction. In: Murgante B, et al. Computational Science and Its Applications – ICCSA 2014. ICCSA 2014. Lecture Notes in Computer Science. Cham: Springer; 2014. 8580. 10.1007/978-3-319-09129-7_55.Search in Google Scholar
[35] Hua AK. Application of CA-Markov model and land use/land cover change in Malacca River watershed, Malaysia. Appl Ecol Environ Res. 2017;15(4):605–22. 10.15666/aeer/1504_605622.Search in Google Scholar
[36] Mathanraj S, Rusli N, Ling GHT. Applicability of the CA-Markov model in land-use/land cover change prediction for urban sprawling in Batticaloa Municipal Council, Sri Lanka. IOP Conference Series: Earth and Environmental Science. Vol. 620, 2021. p. 012015. 10.1088/1755-1315/620/1/012015.Search in Google Scholar
[37] Al-Shaar W, Adjizian Gérard J, Nehme N, Lakiss H, Barakat LB. Application of modified cellular automata Markov chain model: forecasting land use pattern in Lebanon. Model Earth Syst Environ. 2021;7:1321–35. 10.1007/s40808-020-00971-y.Search in Google Scholar
[38] Gharaibeh A, Shaamala A, Obeidat R, Al-Kofahi S. Improving land-use change modeling by integrating ANN with Cellular Automata-Markov Chain model. Heliyon. 2020;6:e05092. 10.1016/j.heliyon.2020.e05092.Search in Google Scholar PubMed PubMed Central
[39] Girma R, Furst C, Moges A. Land use land cover change modeling by integrating artificial neural network with cellular Automata-Markov chain model in Gidabo river basin, main Ethiopian rift. Environ Chall. 2022;6:100419. 10.1016/j.envc.2021.100419.Search in Google Scholar
[40] Xu T, Zhou D, Li Y. Integrating ANNs and cellular automata-Markov chain to simulate urban expansion with annual land use data. Land. 2022;11(7):1074. 10.3390/land11071074.Search in Google Scholar
[41] Thu M. 5 thành phố trực thuộc TW đóng góp 35.04% vào tăng trưởng GDP cả nước (5 centrally-run cities contribute 35.04% to the country’s GDP growth); 2024. https://www.vietnamplus.vn/nam-thanh-pho-truc-thuoc-trung-uong-dong-gop-3504-vao-tang-truong-gdp-ca-nuoc-post933544.vnp.Search in Google Scholar
[42] Asif M, Kazmi JH, Tariq A, Zhao N, Guluzade R, Soufan W, et al. Modelling of land use and land cover changes and prediction using CA-Markov and Random Forest. Geocarto Int. 2023;38(1):2210532. 10.1080/10106049.2023.2210532.Search in Google Scholar
[43] Han Y, Jia H. Simulating the spatial dynamics of urban growth with an integrated modeling approach: A case study of Foshan, China. Ecol Model. 2017;353:107–16. 10.1016/j.ecolmodel.2016.04.005.Search in Google Scholar
[44] Chim K, Tunnicliffe J, Shamseldin A, Ota T. Land use change detection and prediction in upper Siem Reap River, Cambodia. Hydrology. 2019;6(3):64. 10.3390/hydrology6030064.Search in Google Scholar
[45] Teck V, Poortinga A, Riano C, Dahal K, Legaspi RMB, Ann V, et al. Land use and land cover change implications on agriculture and natural resource management of Kaoh Nheaek, Mondulkiri province, Cambodia. Remote Sens Appl: Soc Environ. 2023;29:100895. 10.1016/j.rsase.2022.100895.Search in Google Scholar
[46] Faichia C, Tong Z, Zhang J, Liu X, Kazuva E, Ullah K, et al. Using RS data-based CA–Markov model for dynamic simulation of historical and future LUCC in Vientiane, Laos. Sustainability. 2020;12(20):8410. 10.3390/su12208410.Search in Google Scholar
[47] Nguyen TV, Nguyen NV, Le HTT, La HP, Tien Bui D. Detection and prediction of urban expansion of Hanoi Area (Vietnam) Using SPOT-5 Satellite Imagery and Markov Chain Model. In: Tien Bui D, Ngoc Do A, Bui HB, Hoang ND, editors. Advances and Applications in Geospatial Technology and Earth Resources. GTER 2017. Cham: Springer; 2018. 10.1007/978-3-319-68240-2_8.Search in Google Scholar
[48] Nguyen VT, Le TTH, La PH. Predicting land use change affected by population growth by integrating logistic regression, Markov Chain and cellular automata models. J Korean Soc Surv Geod Photogramm Cartogr. 2017;35(4):221–30. 10.7848/ksgpc.2017.35.4.221.Search in Google Scholar
[49] Cuong NH, Cuong NV. Urban sprawl prediction using CA-Markov model: A case study of Tan An city, Long An province. Tạp chí Khoa học Đại học Cần Thơ. 2024;60(3):1–11. 10.22144/ctujos.2024.297.Search in Google Scholar
[50] Kulkarni VG. Discrete-time Markov models. In Introduction to modeling and analysis of stochastic systems. Springer texts in statistics. New York, NY: Springer; 2011. 10.1007/978-1-4419-1772-0_2.Search in Google Scholar
[51] Ghalehteimouri KJ, Shamsoddini A, Mousavi MN, Che Ros FB, Khedmatzadeh A. Predicting spatial and decadal of land use and land cover change using integrated cellular automata Markov chain model based scenarios (2019–2049) Zarriné-Rūd River Basin in Iran. Environ Chall. 2022;6:100399. 10.1016/j.envc.2021.100399.Search in Google Scholar
[52] Thanhnien Newspaper. Don’t repeat suspended planning. 2024. https://www.vietnam.vn/en/dung-lap-lai-quy-hoach-treo/.Search in Google Scholar
[53] Thanhnien Newspaper. Ho Chi Minh City opens up land resources. 2023. https://www.vietnam.vn/en/tp-hcm-khoi-thong-nguon-luc-dat-dai/.Search in Google Scholar
[54] Dung P. Xoá quy hoạch treo tại TPHCM: Giải pháp của quận Thủ Đức (Removing suspended planning in Ho Chi Minh City: Thu Duc district’s solution); 2024. https://radanhadat.vn/edutech/xoa-quy-hoach-treo-tai-tphcm-thuc-trang-va-giai-phap-thao-go.Search in Google Scholar
[55] Tuan NT. Land tenure and land acquisition enforcement in Vietnam. SAGE Open. 2023;13(1):21582440231163102. 10.1177/21582440231163102.Search in Google Scholar
© 2025 the author(s), published by De Gruyter
This work is licensed under the Creative Commons Attribution 4.0 International License.
Articles in the same Issue
- Research Articles
- Optimization of sustainable corn–cattle integration in Gorontalo Province using goal programming
- Competitiveness of Indonesia’s nutmeg in global market
- Toward sustainable bioproducts from lignocellulosic biomass: Influence of chemical pretreatments on liquefied walnut shells
- Efficacy of Betaproteobacteria-based insecticides for managing whitefly, Bemisia tabaci (Hemiptera: Aleyrodidae), on cucumber plants
- Assessment of nutrition status of pineapple plants during ratoon season using diagnosis and recommendation integrated system
- Nutritional value and consumer assessment of 12 avocado crosses between cvs. Hass × Pionero
- The lacked access to beef in the low-income region: An evidence from the eastern part of Indonesia
- Comparison of milk consumption habits across two European countries: Pilot study in Portugal and France
- Antioxidant responses of black glutinous rice to drought and salinity stresses at different growth stages
- Differential efficacy of salicylic acid-induced resistance against bacterial blight caused by Xanthomonas oryzae pv. oryzae in rice genotypes
- Yield and vegetation index of different maize varieties and nitrogen doses under normal irrigation
- Urbanization and forecast possibilities of land use changes by 2050: New evidence in Ho Chi Minh city, Vietnam
- Organizational-economic efficiency of raspberry farming – case study of Kosovo
- Application of nitrogen-fixing purple non-sulfur bacteria in improving nitrogen uptake, growth, and yield of rice grown on extremely saline soil under greenhouse conditions
- Digital motivation, knowledge, and skills: Pathways to adaptive millennial farmers
- Investigation of biological characteristics of fruit development and physiological disorders of Musang King durian (Durio zibethinus Murr.)
- Enhancing rice yield and farmer welfare: Overcoming barriers to IPB 3S rice adoption in Indonesia
- Simulation model to realize soybean self-sufficiency and food security in Indonesia: A system dynamic approach
- Gender, empowerment, and rural sustainable development: A case study of crab business integration
- Metagenomic and metabolomic analyses of bacterial communities in short mackerel (Rastrelliger brachysoma) under storage conditions and inoculation of the histamine-producing bacterium
- Fostering women’s engagement in good agricultural practices within oil palm smallholdings: Evaluating the role of partnerships
- Increasing nitrogen use efficiency by reducing ammonia and nitrate losses from tomato production in Kabul, Afghanistan
- Physiological activities and yield of yacon potato are affected by soil water availability
- Vulnerability context due to COVID-19 and El Nino: Case study of poultry farming in South Sulawesi, Indonesia
- Wheat freshness recognition leveraging Gramian angular field and attention-augmented resnet
- Suggestions for promoting SOC storage within the carbon farming framework: Analyzing the INFOSOLO database
- Optimization of hot foam applications for thermal weed control in perennial crops and open-field vegetables
- Toxicity evaluation of metsulfuron-methyl, nicosulfuron, and methoxyfenozide as pesticides in Indonesia
- Fermentation parameters and nutritional value of silages from fodder mallow (Malva verticillata L.), white sweet clover (Melilotus albus Medik.), and their mixtures
- Five models and ten predictors for energy costs on farms in the European Union
- Effect of silvopastoral systems with integrated forest species from the Peruvian tropics on the soil chemical properties
- Transforming food systems in Semarang City, Indonesia: A short food supply chain model
- Understanding farmers’ behavior toward risk management practices and financial access: Evidence from chili farms in West Java, Indonesia
- Optimization of mixed botanical insecticides from Azadirachta indica and Calophyllum soulattri against Spodoptera frugiperda using response surface methodology
- Mapping socio-economic vulnerability and conflict in oil palm cultivation: A case study from West Papua, Indonesia
- Exploring rice consumption patterns and carbohydrate source diversification among the Indonesian community in Hungary
- Determinants of rice consumer lexicographic preferences in South Sulawesi Province, Indonesia
- Effect on growth and meat quality of weaned piglets and finishing pigs when hops (Humulus lupulus) are added to their rations
- Healthy motivations for food consumption in 16 countries
- The agriculture specialization through the lens of PESTLE analysis
- Combined application of chitosan-boron and chitosan-silicon nano-fertilizers with soybean protein hydrolysate to enhance rice growth and yield
- Stability and adaptability analyses to identify suitable high-yielding maize hybrids using PBSTAT-GE
- Phosphate-solubilizing bacteria-mediated rock phosphate utilization with poultry manure enhances soil nutrient dynamics and maize growth in semi-arid soil
- Factors impacting on purchasing decision of organic food in developing countries: A systematic review
- Influence of flowering plants in maize crop on the interaction network of Tetragonula laeviceps colonies
- Bacillus subtilis 34 and water-retaining polymer reduce Meloidogyne javanica damage in tomato plants under water stress
- Vachellia tortilis leaf meal improves antioxidant activity and colour stability of broiler meat
- Evaluating the competitiveness of leading coffee-producing nations: A comparative advantage analysis across coffee product categories
- Application of Lactiplantibacillus plantarum LP5 in vacuum-packaged cooked ham as a bioprotective culture
- Evaluation of tomato hybrid lines adapted to lowland
- South African commercial livestock farmers’ adaptation and coping strategies for agricultural drought
- Spatial analysis of desertification-sensitive areas in arid conditions based on modified MEDALUS approach and geospatial techniques
- Meta-analysis of the effect garlic (Allium sativum) on productive performance, egg quality, and lipid profiles in laying quails
- Review Articles
- Reference dietary patterns in Portugal: Mediterranean diet vs Atlantic diet
- Evaluating the nutritional, therapeutic, and economic potential of Tetragonia decumbens Mill.: A promising wild leafy vegetable for bio-saline agriculture in South Africa
- A review on apple cultivation in Morocco: Current situation and future prospects
- Quercus acorns as a component of human dietary patterns
- CRISPR/Cas-based detection systems – emerging tools for plant pathology
- Short Communications
- An analysis of consumer behavior regarding green product purchases in Semarang, Indonesia: The use of SEM-PLS and the AIDA model
- Effect of NaOH concentration on production of Na-CMC derived from pineapple waste collected from local society