A comparative assessment and geospatial simulation of three hydrological models in urban basins
-
Evangelina Avila-Aceves
 ,
Sergio A. Monjardin-Armenta
,
Sergio A. Monjardin-Armenta
 ,
Wenseslao Plata-Rocha
und
Yedid G. Zambrano-Medina
,
Wenseslao Plata-Rocha
und
Yedid G. Zambrano-Medina

Abstract
The risk of flooding is a destructive natural hazard, and it is increasing due to heavy rainfall and anthropogenic factors. Hydrologic–hydraulic models serve as valuable tools for flood forecasting and predicting future flow patterns. These models evaluate and simplify processes in ungauged basins. In this study, three hydrologic models (soil conservation service [SCS], Snyder, and Temez) were used to calculate synthetic unit hydrographs for the Humaya and Tamazula River (H-T-R) basin. Additionally, the flows derived from the three models were simulated in Hydrological Engineering Center River Analysis System for various return periods (2, 5, 10, 25, 50, and 100 years). The accuracy of the models SCS, Snyder, and Temez was evaluated using the root-mean-square error (1162.44, 144.76, and 2890.6); Nash–Sutcliffe efficiency (−51.12, 0.19, and −312.28); R 2 (0.97, 0.94, and 0.94), and kappa index (0.8534, 0.9895, and 0.7155), respectively. The data used in this study were obtained from a hydrometric station located on the Culiacan River. The main findings indicate that the Snyder model demonstrated a better predictive capability compared to the Temez and SCS models, albeit with a tendency to overestimate. Simulated flood depths are deeper in the upstream areas, particularly upstream from the Musala Island bifurcation on the Tamazula River, with values of 11.82 m for SCS, 9.76 m for Snyder, and 13.5 m for Temez. The simulation revealed potential overflow zones along the Tamazula River, particularly at the channel bifurcation and near the confluence with the Humaya River, during the 100 year return period simulation.
Graphical abstract

1 Introduction
Natural events, such as heavy rainfall, combined with anthropogenic factors like changes in land cover, contribute to various risks [1], including floods. Water resources have been essential for human survival since ancient times [2], but they also pose a latent threat. Floods are among the most destructive natural hazards, caused by factors such as river overflow, reservoir breaches, and intense rainfall of both short and long durations [3].
Floods can cause the destruction of property, disrupt the economy, damage the environment, and pose health risks, as contaminated water supplies can cause wound infections and disease [4]. Therefore, monitoring and predicting their magnitude is crucial to mitigate further damage [5]. Geographic Information Systems and hydrological–hydraulic models have advanced flood hazard and risk assessments [6].
Hydrological models are valuable tools for studying the impact of climate change and implementing flood prediction measures [7,8]. These models predict the future flow patterns and represent hydrological processes [9]. Concentrated hydrological models treat the study basin as a single unit, using average values for calculations [7]. By doing so, these models account for the spatial and temporal variability in large watersheds [10].
Hydrological models play a crucial role in understanding historical changes in water systems [11]. Concentrated hydrological models are commonly used in non-gauged watersheds as they require less data, typically on a monthly or yearly basis [10]. Pereira et al. [12] evaluated an IPH II concentrated hydrological model and found that it outperformed semi-distributed models when using Clark’s method for the Pompa River in Brazil. In another study, Vargas and Monroy [13] assessed the behavior and uncertainty of soil conservation service (SCS), Snyder, and Clark synthetic unit hydrographs for three watersheds in the Cauca Valley. The unit hydrographs exhibited similar combinations, and the peak flow calculation closely matched the observed values. Similarly, in the Cunculen and Tutuven watersheds in Chile, Pizarro-Tapia et al. [14] compared three synthetic unit hydrographs and found that the Snyder and Temez hydrographs displayed similar timing and peak flows.
Regarding the hydraulic simulation of floods, Quiroga et al. [15] conducted flood simulations in Hydrological Engineering Center River Analysis System (HEC-RAS) using data from a hydrometric station and a 90 m digital elevation model (DEM). Ongdas et al. [16] simulated floods using a 10 m DEM, historical flood data, and images. Elkhrachy et al. [17] performed flood simulations with a 30 m DEM and used rainfall images at a resolution of 0.1° for flow data. The objective of this study was to identify flood hazard zones in Culiacan, Mexico, using three hydrological models in the H-T-R basin. This has focused on investigating the predictive behavior of established models and assessing the extent of flooding at the river confluence in a 1D within a network of rivers and validate them geospatially.
2 Study area
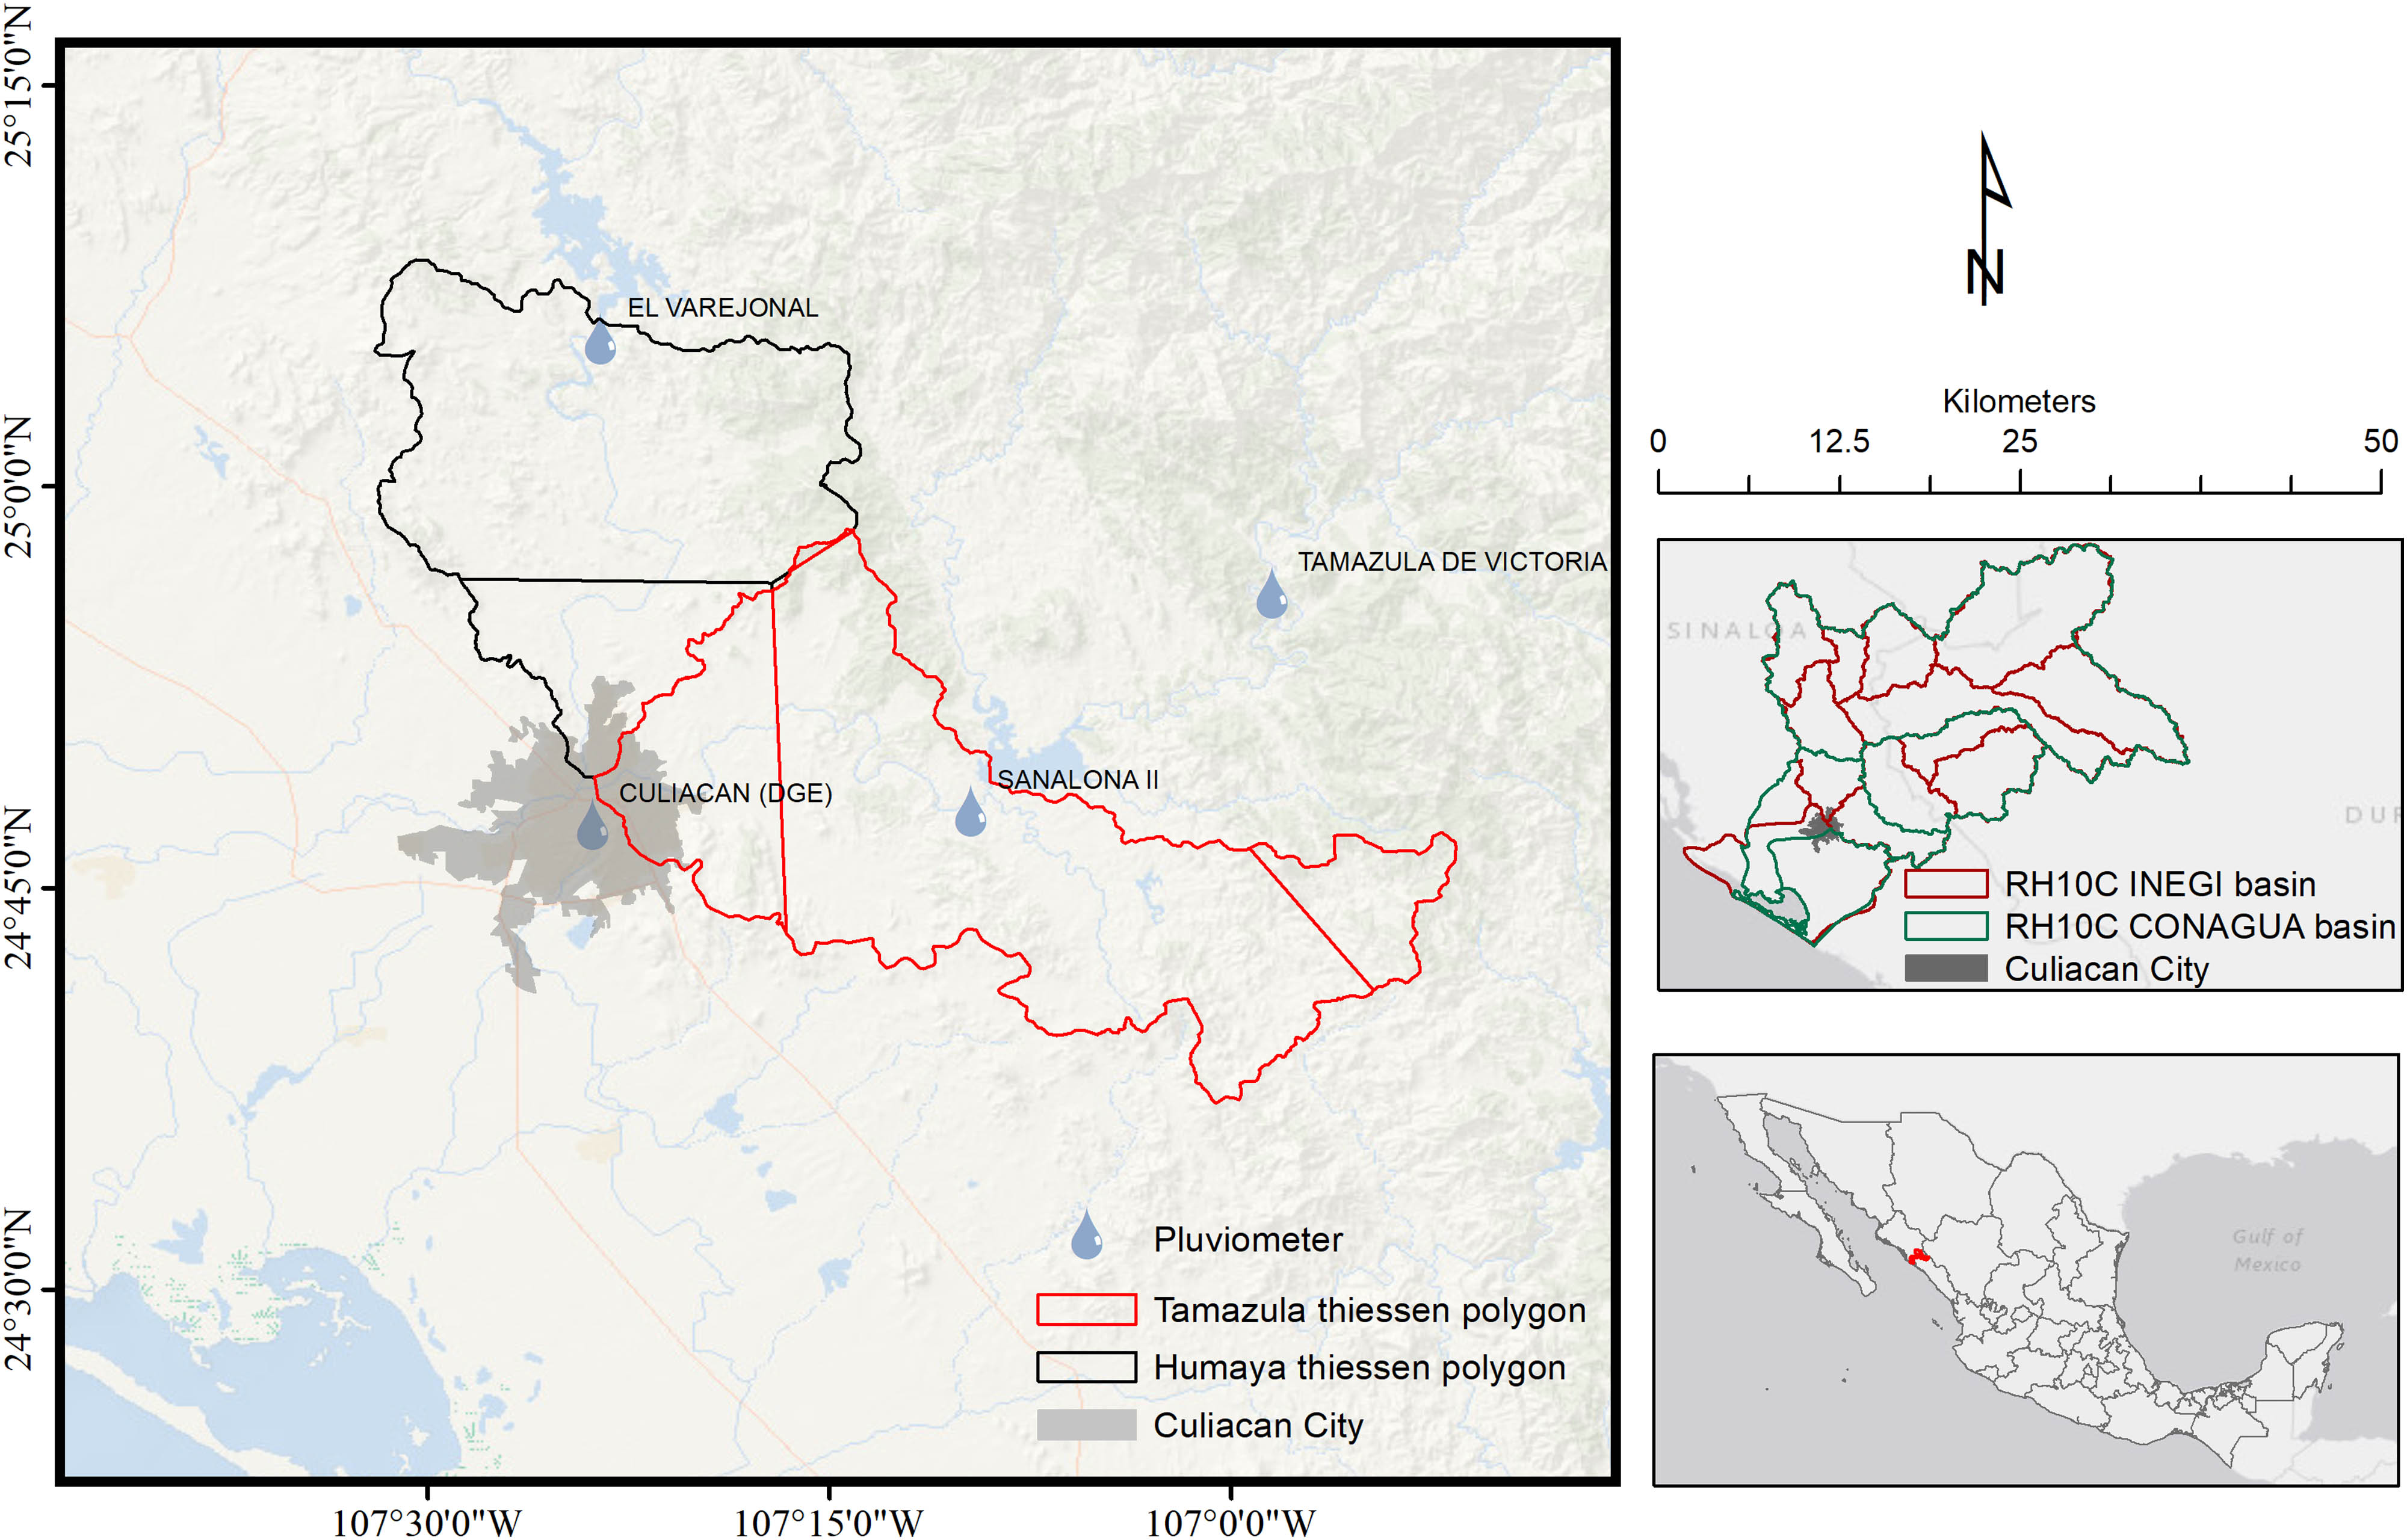
The Culiacan River (CR) basin is located in northwestern Mexico and covers an approximate area of 15,731 km2.
It has an average watershed length of 875 km and is situated between the coordinates of 105°41′ and 108°4′ West longitude, and 24°24′ to 26°24′ North latitude. This basin is the second most significant watershed in hydrological region No. 10 within the northwest administrative region of Mexico. It consists of three main tributaries: H-T-R and the CR.
The Tamazula River originates in the Sierra Madre Occidental in the state of Durango and flows for 107 km until it reaches the Sanalona hydrometric station. In the lower part of the watershed, it joins the Humaya River, forming the CR in the city of the same name.
Starting since 1991, the Tres Rios Urban Development (TRUD) project in Culiacan has led to transformations in the river and its banks, including dredging, deforestation, and construction in flood-prone zones for roads, bridges, housing, tourist facilities, and commercial areas [18]. The confluence of H-T-R gives rise to the CR, which passes through the center of Culiacan city. The CR stretches for 621 meters from the confluence to the diversion dam “Ing. Carlos Carvajal Zarazua.” Figure 1 depicts the location of the tributaries section in the city center, where the one-dimensional flood simulation was conducted.
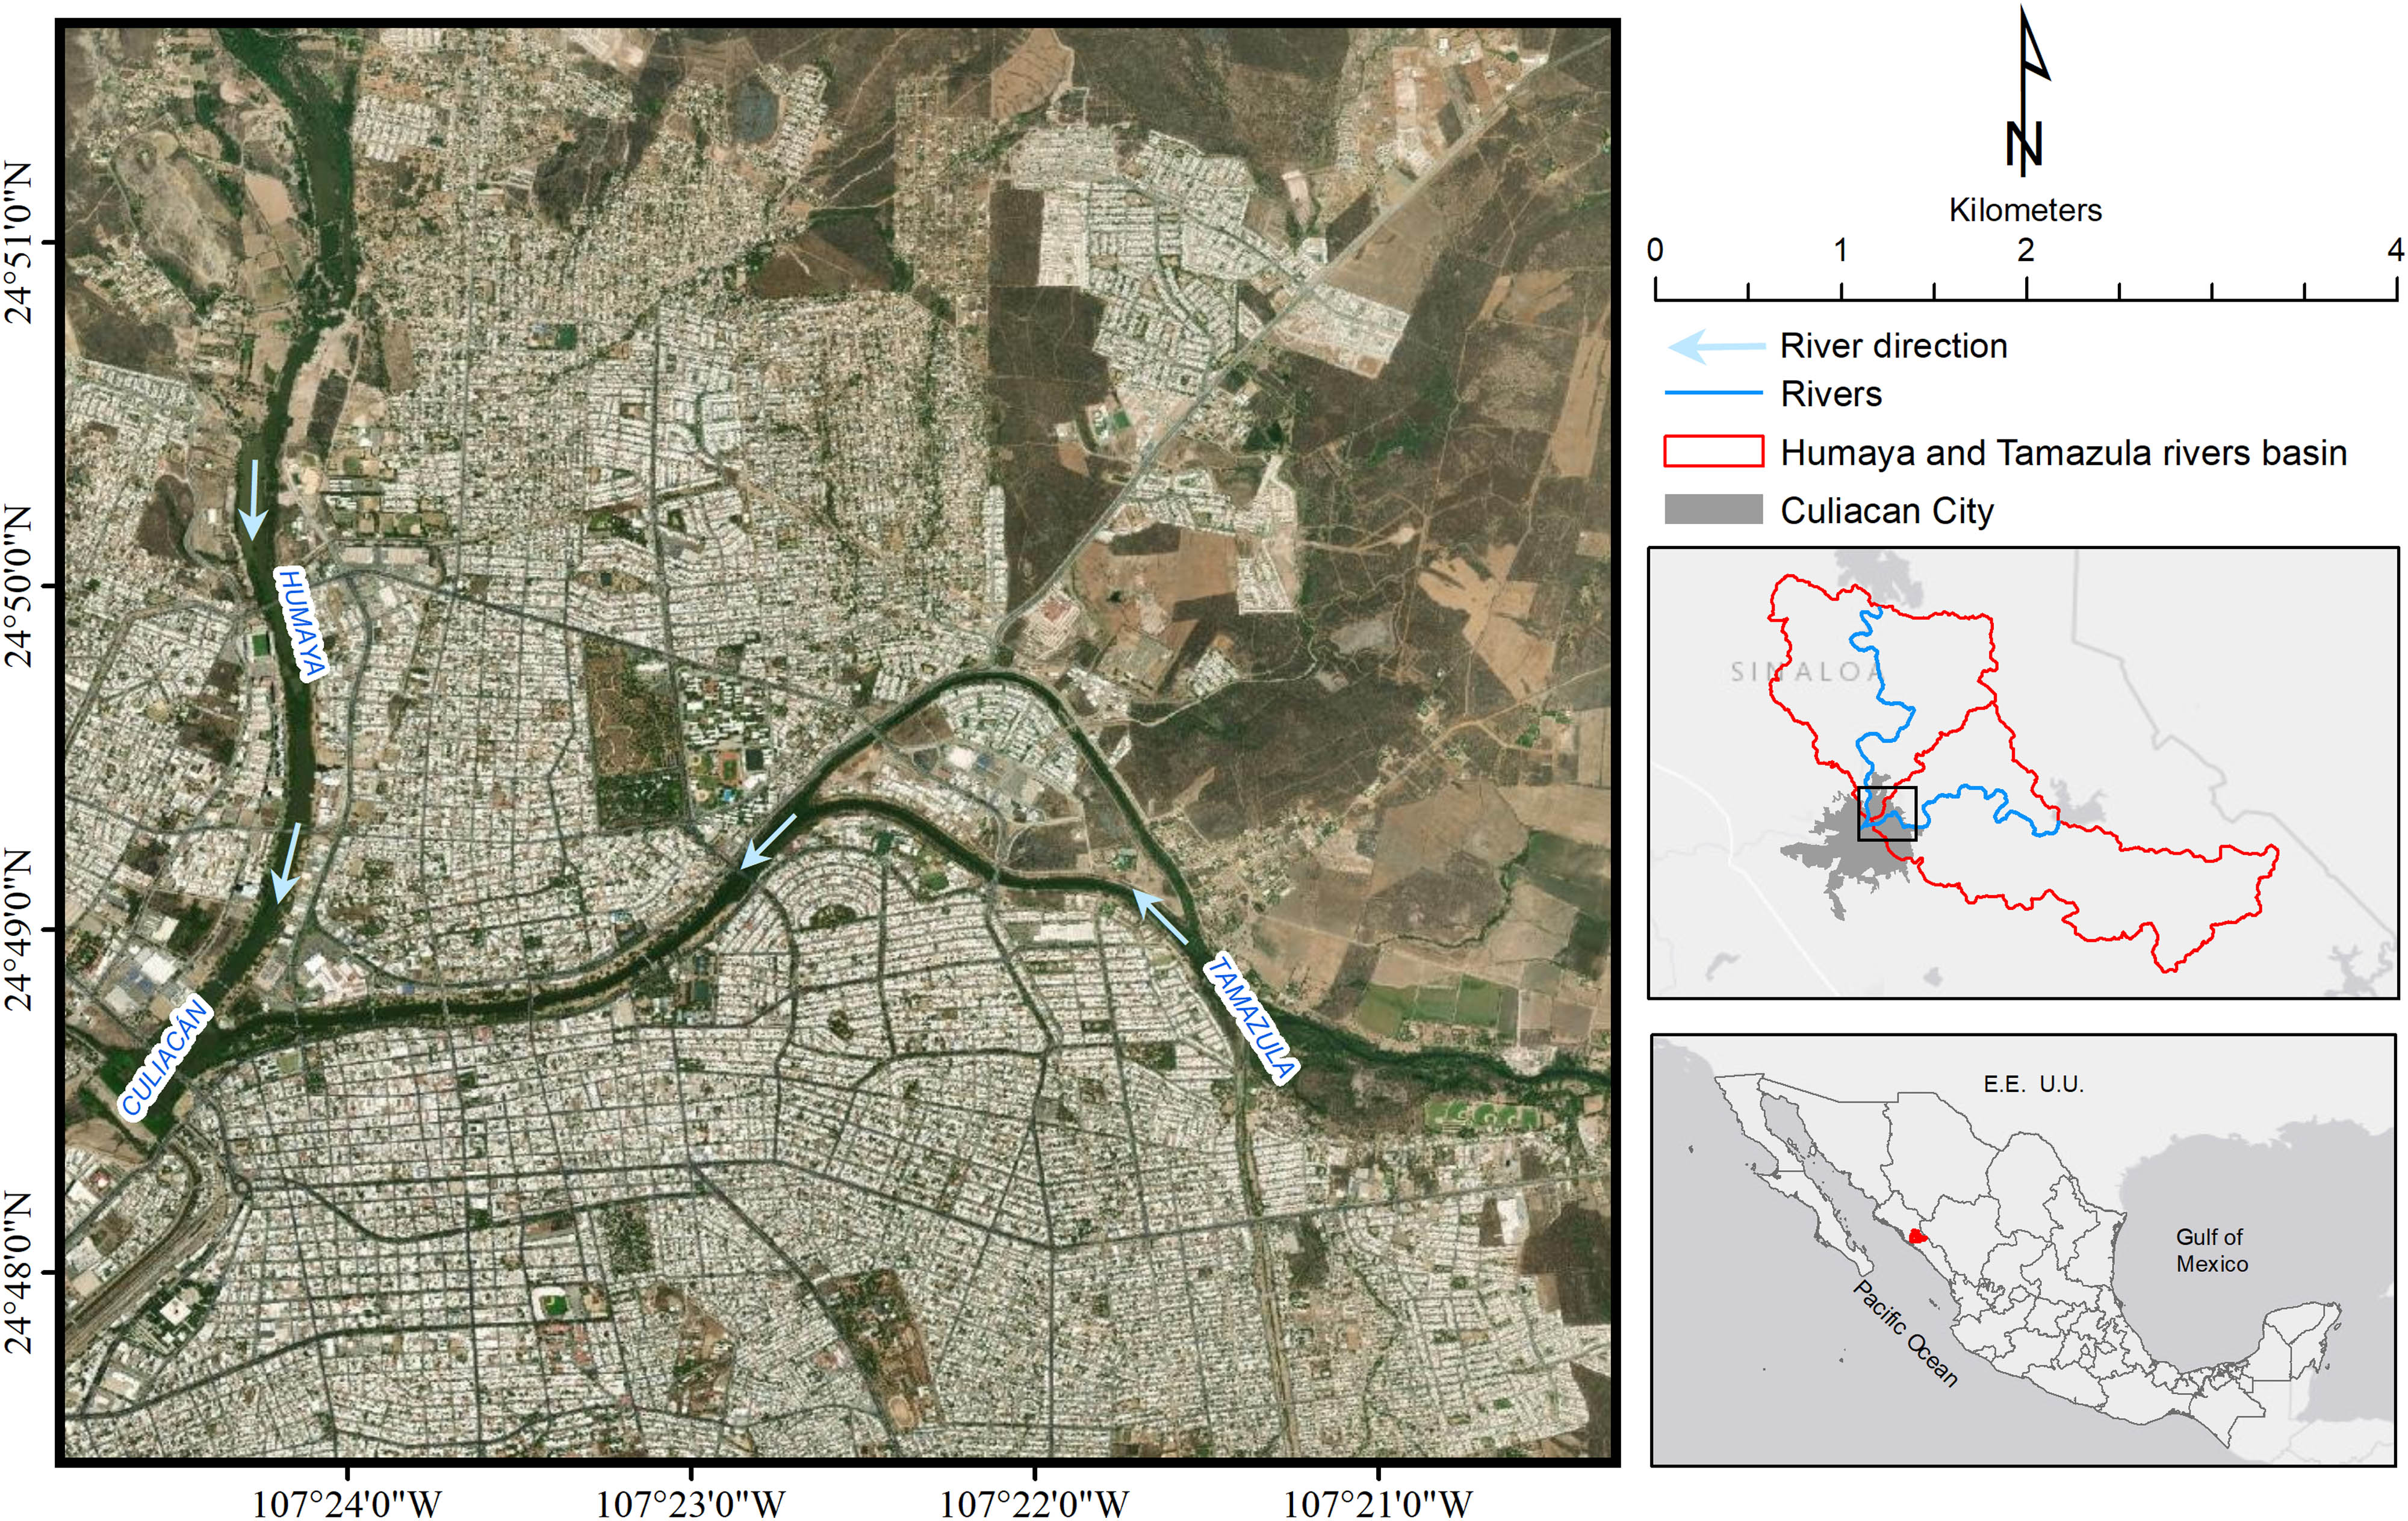
Urban area of the city of Culiacan is a study area for flood simulation.
3 Methods
In this study, four pluviometric stations were used: 25015-Culiacan, 25033-El Varejonal, 10082-Tamazula, and 25081-Sanalona II. These are the only stations that have maintained daily rainfall records without a break from 1961 to 2018. The data for the H-T-R basin and CR, as well as the maximum gauging values from a station in Culiacan City, were provided by the National Meteorological Service and the National Water Commission. Table 1 presents the data used as inputs for flood modeling.
Variables used as input data for flood modeling
| Variable | Quantity | Resolution | Resource |
|---|---|---|---|
| Rainfall stations | 4 | 24 h (1961–2018) | [19] |
| Flow gauging station | 1 | 24 h (1961–1989) | [20] |
| DEM | 163 | 1:10,000 | [21] |
| Edaphological maps | 1 | 1:250,000 | [22] |
| Land use/land cover maps | 1 | 1:250,000 | [23] |
The model predicts rainfall for return periods of 2, 5, 10, 25, 50, and 100 years, with the intensity determined for each design storm. Subsequently, the SCS, Snyder, and Temez synthetic unit hydrographs were used to calculate runoff for the H-T-R tributaries, followed by HEC-RAS 1D flow simulation. The simulation was validated through probabilistic analysis of the CR gauging, as shown in Figure 2.
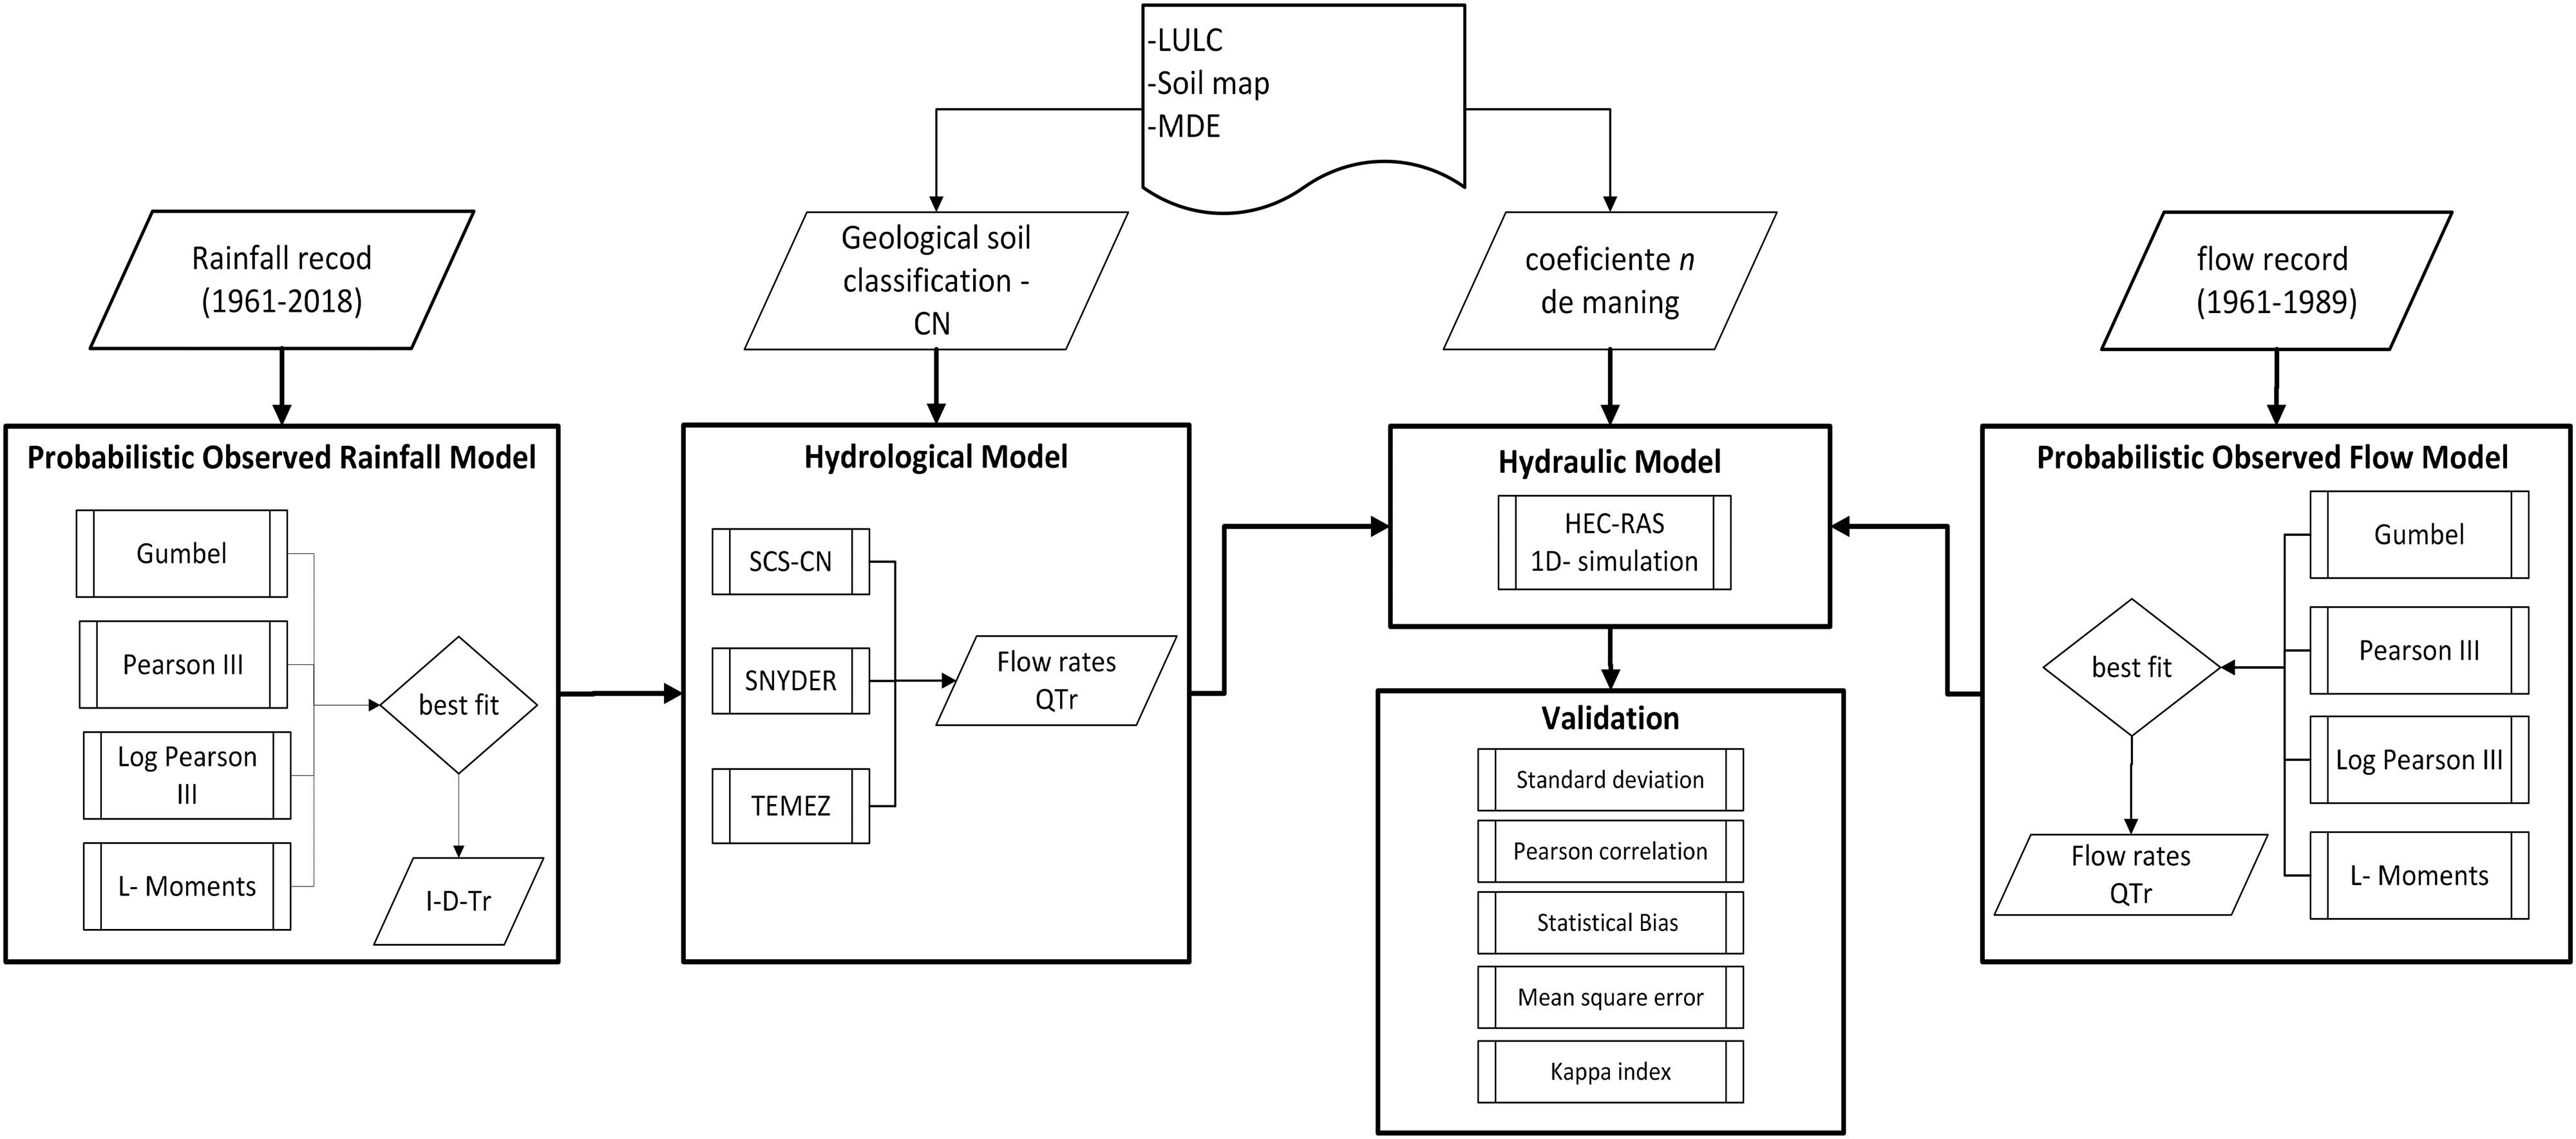
Methods.
3.1 Field data preparation
The topographic configuration of the terrain and delimitation of the H-T-R watershed was determined using 163 LiDAR scenes with a scale of 1:10,000. A DEM mosaic was generated by combining these scenes for the delimitation of the watershed. The LiDAR data with a horizontal resolution of 5 m and a vertical resolution of 1 cm were obtained from the INEGI portal (www.inegi.org.mx/app/mapas). The data covered the period from 2017 to 2021. Each DEM scene had dimensions of 1,214 × 1,472 columns and rows in the bil format. These scenes were then merged to create a mosaic with dimensions of 19,294 × 19,577 columns and rows.
3.2 Estimation of the probability of precipitation and return period
Hydrological–hydraulic models are used to determine the frequency of extreme events, typically measured in years. This frequency represents the likelihood of an event of equal or greater magnitude of occurrence [24]. The magnitude of the phenomenon is inversely related to its frequency of occurrence [25]. In this study, annual maximum series statistics were used to estimate the 24-h rainfall values for various return periods, including 2, 5, 10, 25, 50, and 100 years.
The pluviometry stations provided continuous daily records spanning the period from 1961 to 2018. The time series was divided into two parts: 1961 to 1989 and 1990 to 2018 for calibration and validation purposes. The Hydrognomon tool was used to analyze the historical series from each station using different distributions, such as Normal, Gumbel, Pearson III, and log-Pearson III. Subsequently, the Kolmogorov–Smirnov test was conducted to assess the goodness of fit between the observed data and the theoretical distributions. The D max coefficient was used as a comparison metric to identify the best fit between the observed and theoretical distributions. The theoretical distribution with the lowest D max coefficient indicates the closest match to the observed data.
3.3 Average precipitation and runoff constants
The delimitation of the watershed was performed using HEC-HMS for the H-T-R basins, which coincided with the intersection of watersheds from INEGI and CONAGUA that it was performed to calculate the average precipitation using Thiessen polygons in ArcGIS [26]. Additionally, the diversion dam in Culiacan can be seen in Figure A1 and extends from the upper watershed to the reservoir curtains.
To further enhance the analysis, soil type classification, estimation of the curve number (CN) coefficient, and land use/land cover data from the VII series of INEGI were integrated to align with traditional CN tables [27].
3.4 Synthetic unit hydrograph
The synthetic unit hydrograph (HUS) is a graphical representation of the direct runoff generated at the outlet of a watershed in response to an effective precipitation event. It is derived based on pluviometric (precipitation) and hydrometric (streamflow) records specific to the watershed of interest [28]. The primary objective of the HUS is to estimate the hydrological response of the watershed for different return periods associated with rainfall events.
The HUS is typically developed using empirical formulas that consider the morphometric characteristics of the basin, such as its surface area, slope, and channel length. These formulas provide an estimation of the hydrograph or peak flow. The peak discharge (Q p) of the hydrograph is calculated by multiplying the effective precipitation height (P e) by the discharge of a unit hydrograph (q p). The unit hydrograph represents the direct runoff response of the watershed to a unit of effective rainfall [28].
The United States SCS developed a widely used method for synthetic hydrograph estimation, known as the CN method (7) in equation (1). This method consists of two main parts: (i) estimating the runoff volume from the precipitation and (ii) calculating the distribution of runoff over time, including the peak flow rate [29]. The SCS method has been applied to a wide range of watershed sizes (ranging from 0.25 to 1,000 km2) and various climatic zones, including both humid and desert regions, in rural watersheds across the United States.
Using the HUS and empirical formulations like the CN method, hydrologists and engineers can estimate the direct runoff and peak flow characteristics of a watershed in response to different rainfall events. These estimations are valuable for flood forecasting, water resources management, and design of hydraulic structures:
where Q p is the peak flow of the hydrograph. A is a watershed area in km2. P is the maximum precipitation designated by the time of concentration and design storm intensity for each return period. CN is the curve number coefficient; t c is a time of concentration and the design storm intensity for each return period.
On the other hand, Snyder introduced the synthetic unit hydrograph in 1938, the concept of synthetic unit hydrograph by analyzing runoff conditions in numerous watersheds. This procedure allows the analysis of watersheds with areas ranging from 10 to 10,000 km2 where records are not available or reliable [30].
Snyder defined standard HU as the one where the rainfall duration t r is related to watershed delay t p. According to units of equation (9), it is necessary to divide by ten to express values introduced in equation (2) in m3 s−1. However, prior to execution of that equation, a series of calculations must be followed to obtain the peak flow per area q p (equation (3)), type time t p (equation (4)), delay time t r (equation (5)), and regularized peak time t pR (equation (6)). The maximum regularized flow per SUH drainage unit q pR in equation (7). The base time t b in equation (8); the effective precipitation P e in equation (9), and the width in hours of the hydrograph at a flow rate equal to 50 or 75% of the maximum flow rate W50 and W75 in equations (10) and (11), respectively.
where A is the watershed area in km2; S is the channel slope in m/m; L is the main channel length from the watershed to the point of interest in km; L c is the distance between the outlet station and the watershed gravity center in km; peak flow is q p expressed in m3 s−1 mm−1; C p is the dimensionless coefficient, established by Linsley (varies between 0.56 and 0.69), which indicates the lower the slope, the lower the value of the coefficient; P e is the effective precipitation; t p is the peak time in hours; t b is the base time in hours; q pR is a regularized peak flow per drainage unit of the synthetic unit hydrograph; t pR is a regularized peak time in hours; P is the maximum precipitation designated by concentration time and design storm intensity for each return period; and N is the CN coefficient.
The Temez triangular hydrograph (equation (12)) is similar to that of the SCS. The main difference is the appreciation of delay time from concentration time. Its validity has been tested in different climatic environments in Spain and in a basin smaller than 2,000 km2. This requires the calculation development of delay time t r (equation (13)), peak time t p (equation (14)), and base time t b (equation (15)):
The main criteria for the selection of these unit hydrographs are watershed size, climate, and slope. In this study, watersheds have a medium-sized surface area of 634.08 and 817.32 km2 and slight slopes of 0.11 and 3.57% for Humaya and Tamazula watersheds, respectively, with mainly agricultural land.
3.5 Flood simulation
The HEC-RAS is a hydraulic modeling software developed by the U.S. Army Corps of Engineers [31]. The program solves the St Venant equations for 1D and 2D as the diffuse wave equations by finite volume [32].
The simulation used geometric data from the DEM of Culiacan. Manning’s roughness coefficient was calculated using a digital mapping of land use and vegetation. The flow data required by HEC-RAS were the Q p values of the three empirical hydrological models, for return periods 2, 5, 10, 25, 50, and 100 for the H-T-R basins.
HEC-RAS 6.0.3 and HEC-geoRAS tools were used to perform a 1D hydraulic simulation of the H-T-R. The sum of individually simulated contributions for H-T-R calculates the free fragment of the CR. A 3 kilometer-wide marginal strip was assigned to cover the floodplain zone of the three rivers. The floodplain zone of the three rivers covered a 3 kilometer-wide marginal strip, a separation between cross sections of 500 m distance between cross-section for H-T-R and 100 m in the CR.
3.6 Validation
Uncertainty hydrological models in flood simulation evaluated their ability to represent reality [33]. Model validation evaluates its predictive capacity by comparing the actual and predicted values [34]. Standard deviation (σ) estimates the variation generated from a hydrological simulation. The correlation coefficient (R 2) measures how well the model fits the hydrometric station data [35,36]. The root-mean-square error (RMSE) in equation (16) measures the magnitude of average error in modeled values. While the Nash–Sutcliffe efficiency (NSE) index in (equation (17)) evaluates the reproductive power of the hydrological models [37,38]. In addition, the kappa index evaluated the spatial concordance of the flood maps [39,40] in equation (18).
where n is the sample number, f
n
is the simulated flow rate; r
n
is the observed flow rate from a hydrometric station;
where r is th number of rows of the matrix, a nn is the number of observations in row n and column n. a n+ , a +n represents the marginal total in row n and column n, respectively, and m represents the total observations.
4 Results and discussion
Figure 3 shows the historical behavior of maximum annual rainfall in stations 25015-Culiacan, 25033-El Varejonal, 10082-Tamazula, and 25081-Sanalona II. Between 1962 and 1964, heavy rainfall events occurred in Culiacan, resulting in a historic flood that isolated the city. The initial peak of precipitation coincided with the rains on December 10, 1963, which led to increased river flow [41].
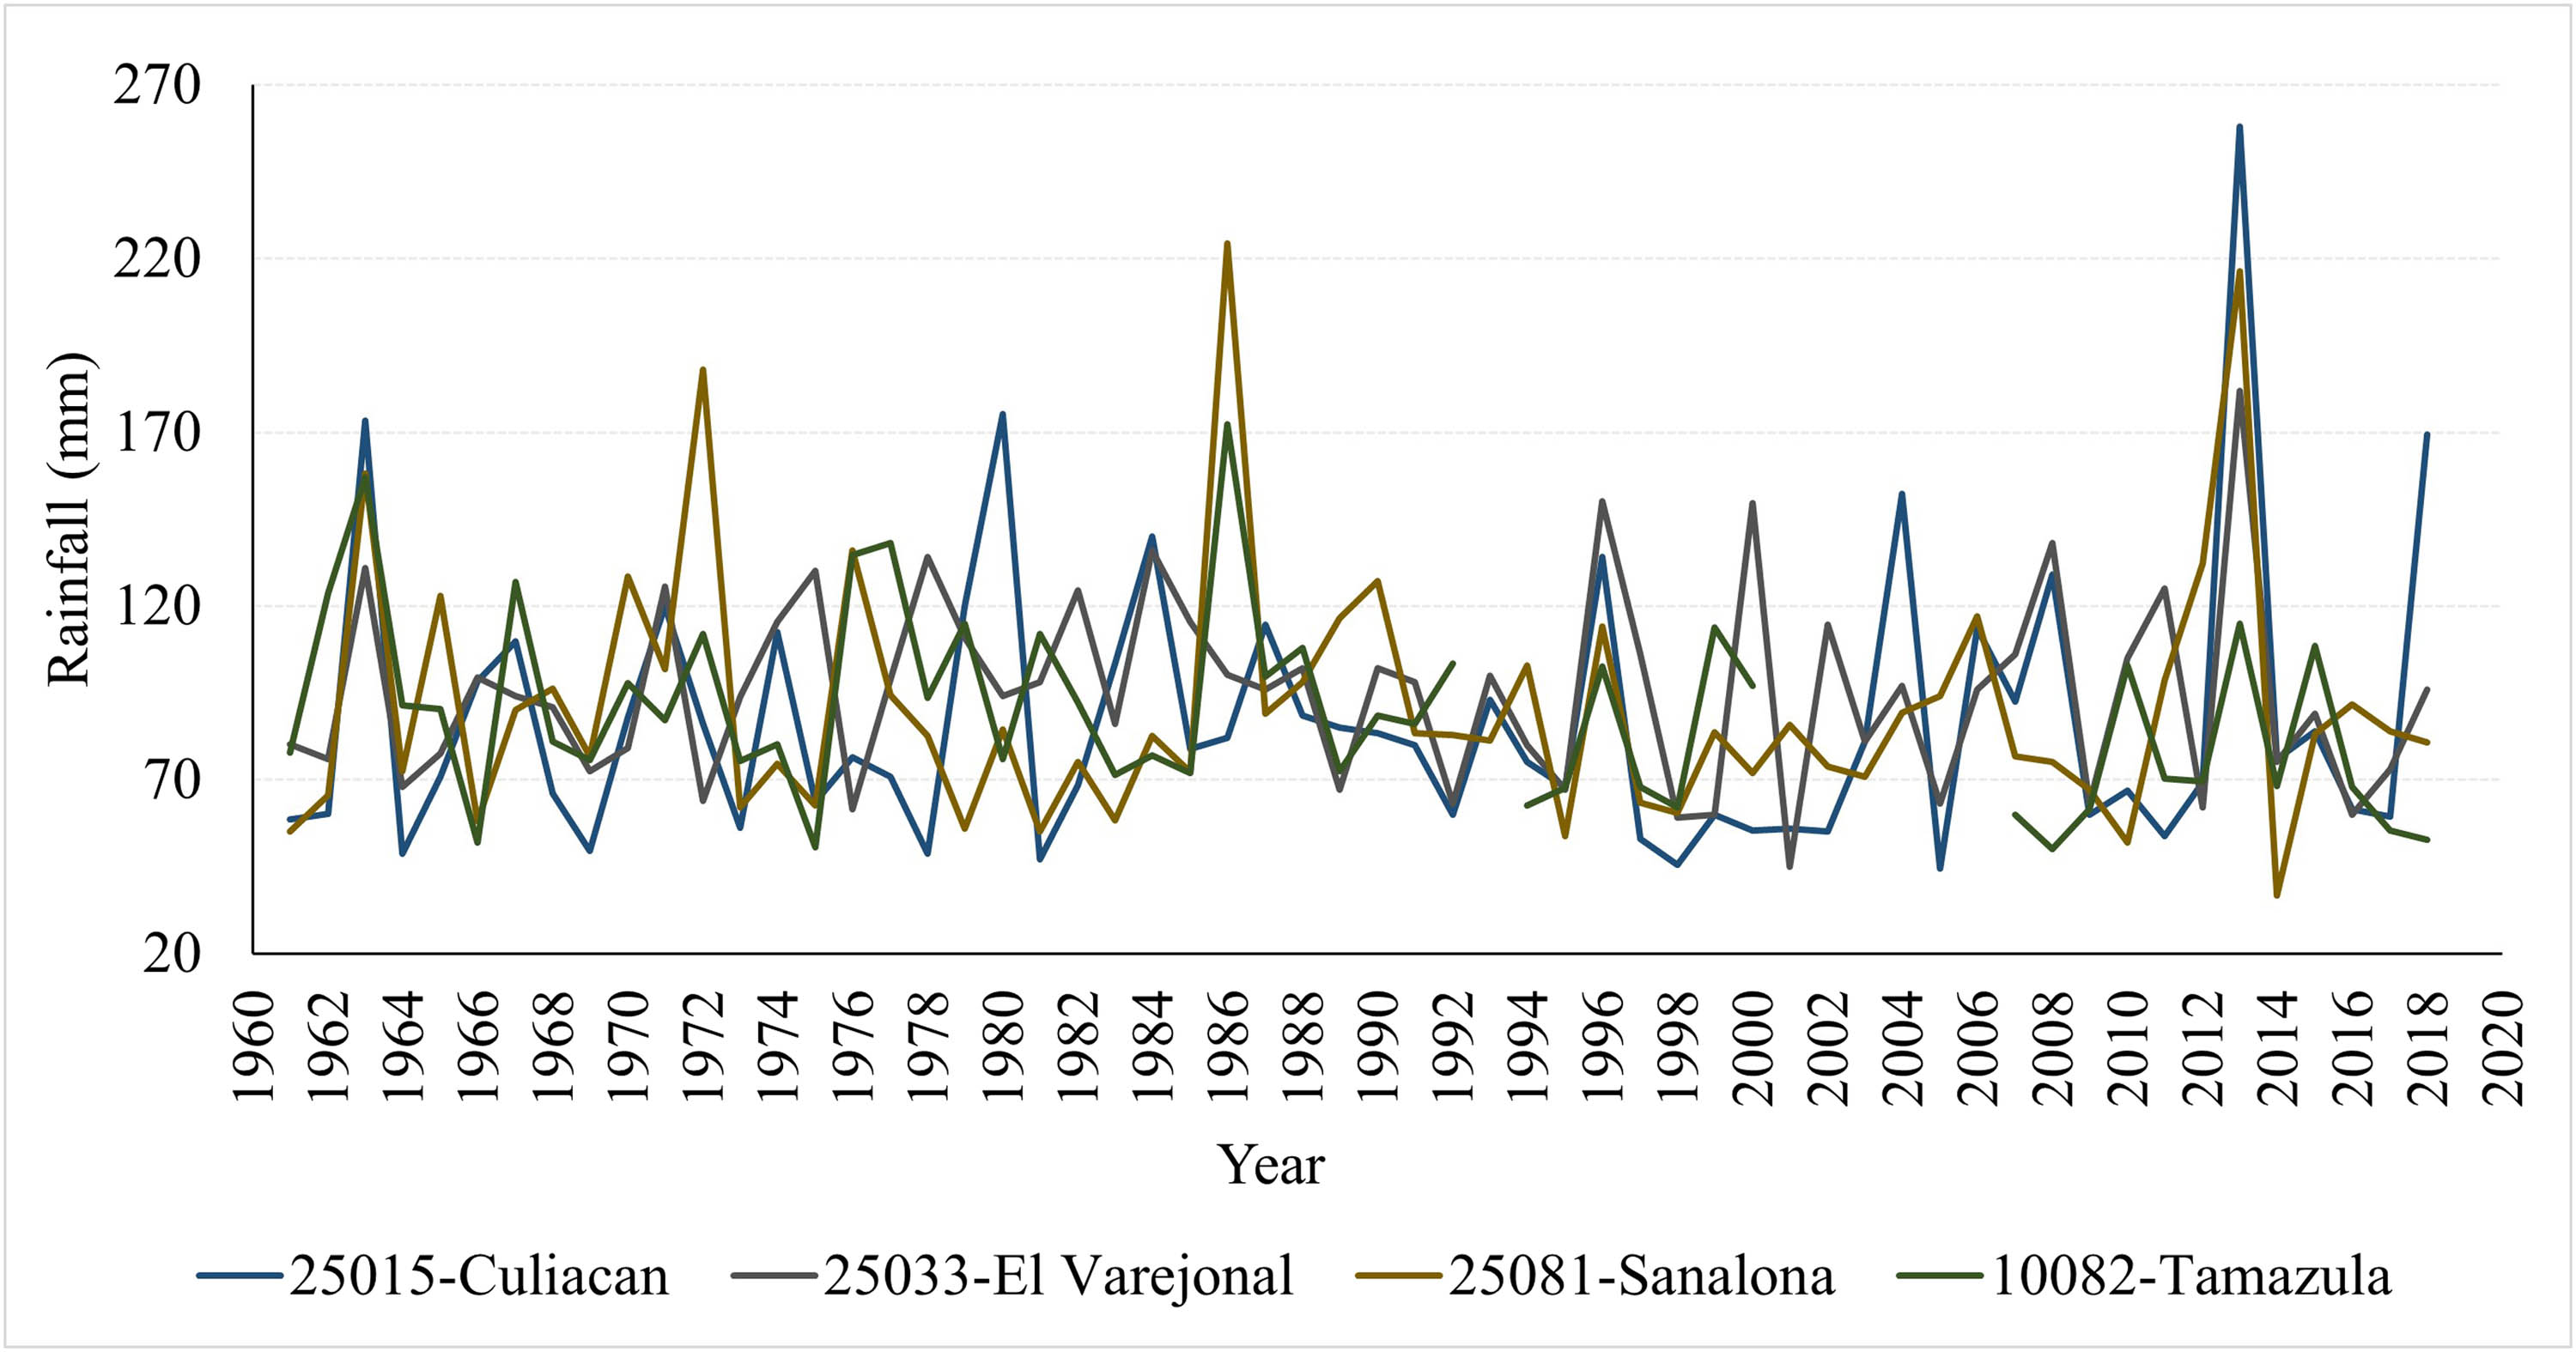
Historical series of maximum annual rainfall.
Another significant rainfall event took place between 2012 and 2014 when Hurricane Manuel hit the Mexican Pacific coast. The effects of the hurricane were also felt on the coasts of Sinaloa, including Culiacan, between September 18 and 20, 2013. The rainfall contribution during this event was recorded as 258 mm at the Culiacan station [42].
To evaluate precipitation patterns, theoretical distributions such as Gumbel, Pearson III, and log-Pearson III were applied. The Kolmogorov–Smirnov and chi-square tests were used to assess the goodness of fit for each station (as shown in Table 2). The results indicated that the Pearson III distribution provided the best fit for most stations, while the log-Pearson III distribution was the best fit for all stations.
Evaluation of the fit of theoretical distributions to precipitation series
| Station | Kolmogorov–Smirnov | x 2 | ||||
|---|---|---|---|---|---|---|
| Pearson III | Log-Pearson III | Gumbel | Pearson III | Log-Pearson III | Gumbel | |
| Culiacan | 0.041 | 0.061 | 0.095 | 2.59 | 1.62 | 12.97 |
| El Varejonal | 0.081 | 0.093 | 0.106 | 4.28 | 6.93 | 15.14 |
| Sanalona II | 0.107 | 0.069 | 0.097 | 4.76 | 2.59 | 7.17 |
| Tamazula | 0.056 | 0.052 | 0.057 | 3.19 | 3.73 | 3.46 |
The CN coefficient, which is used to estimate runoff, was determined by intersecting the soil type and land use/land cover maps. The maps were aligned with the hydrological soil group (GSH) established by the SCS and incorporated into the CN calculations (see Table A1). Both the H-T-R and CR basins had CN values close to imperviousness due to the presence of water bodies, urban areas, and predominantly agricultural soils.
The synthetic unit hydrograph equations were solved using the SCS, Snyder, and Temez methods, as seen in Table 3. The results for the H-T-R basins and the combined flows of the two tributaries for Culiacan (CR) are shown in Table 3. The simulated flows for the CR varied across the three models: SCS (1430.2–2983.8 m3 s−1), Snyder (631–1348.8 m3 s−1), and Temez (2541.7–5309.4 m3 s−1).
Peak flows for H-T-R and CR basins, calculated by SCS, Snyder, and Temez methods at different return periods and observed flow in m3 s−1
| Tr | Humaya | Tamazula | Culiacan | Flow Observed | ||||||
|---|---|---|---|---|---|---|---|---|---|---|
| SCS | Snyder | Temez | SCS | Snyder | Temez | SCS | Snyder | Temez | ||
| 2 | 645.7 | 243.6 | 1139.0 | 784.5 | 387.4 | 1402.7 | 1430.2 | 631.0 | 2541.7 | 783.58 |
| 5 | 727.3 | 274.4 | 1282.8 | 968.8 | 478.4 | 1732.3 | 1696.1 | 752.8 | 3015.1 | 944.80 |
| 10 | 795.6 | 300.1 | 1403.2 | 1135.4 | 560.7 | 2030.2 | 1931.0 | 860.8 | 3433.4 | 1034.16 |
| 25 | 895.4 | 337.8 | 1579.3 | 1398.8 | 690.8 | 2501.0 | 2294.2 | 1028.6 | 4080.3 | 1133.39 |
| 50 | 978.9 | 369.3 | 1726.6 | 1636.6 | 808.2 | 2926.4 | 2615.5 | 1177.5 | 4653.0 | 1199.68 |
| 100 | 1069.9 | 403.6 | 1887.2 | 1913.9 | 945.2 | 3422.2 | 2983.8 | 1348.8 | 5309.4 | 1260.79 |
The models used in the study were compared and validated against field measurements obtained from the hydrometric station located at the confluence of the H-T-R. This station had data available from 1961 to 1989. Figure 4 illustrates that both the SCS and Temez models tend to overestimate the flow at the confluence of the CR, with Temez showing higher magnitudes.
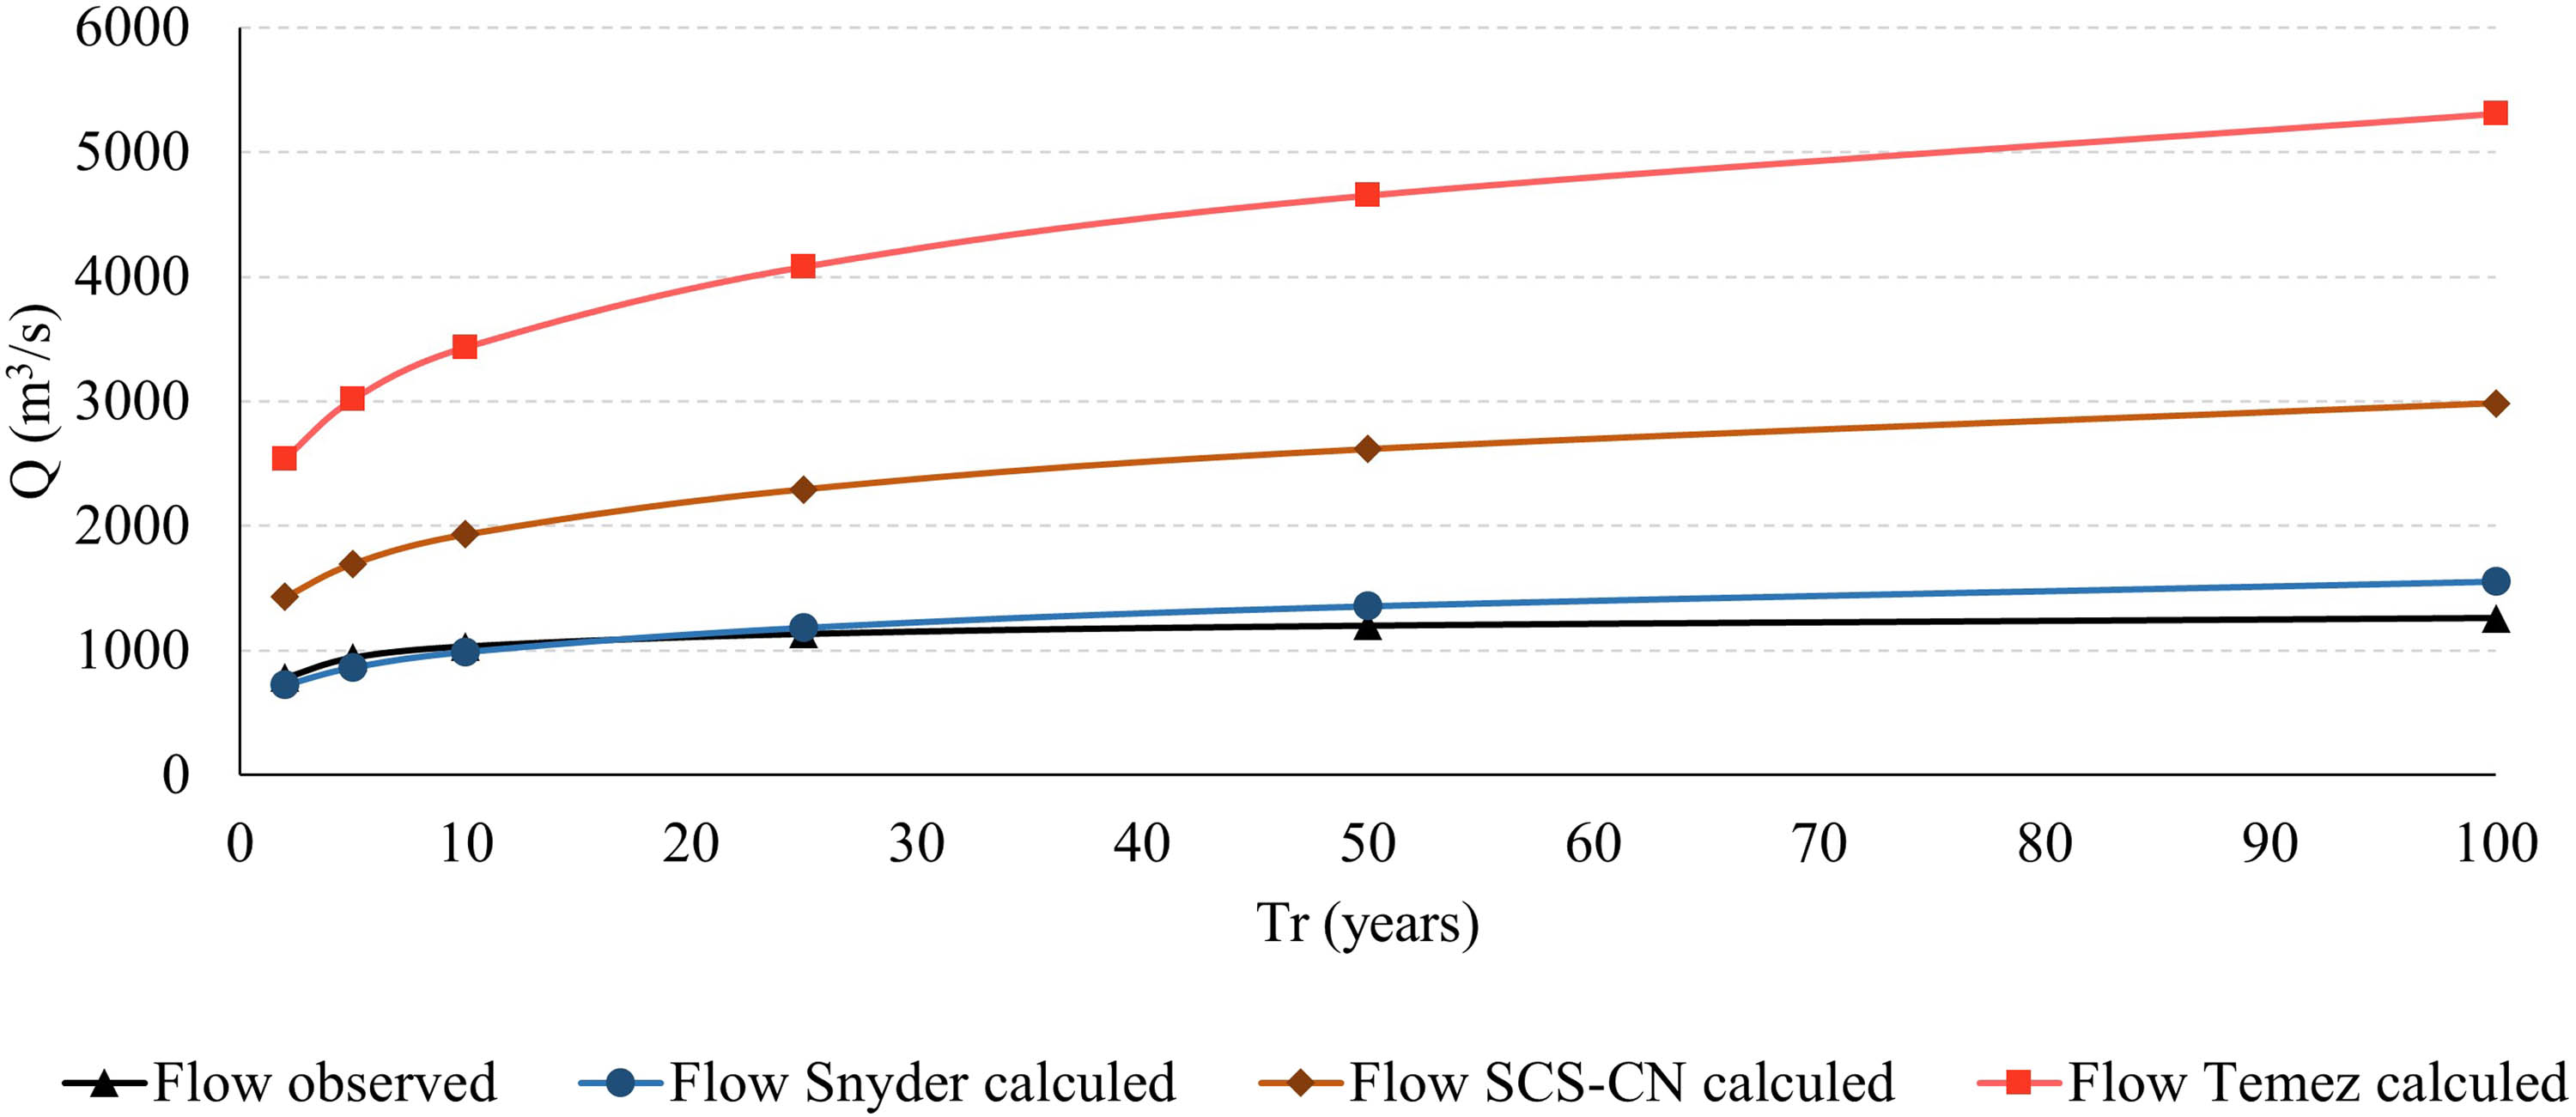
Observed and simulated flows by Snyder, SCS, and Temez during return periods.
Figure 5 displays the scenarios for return periods of 2, 10, 25, 50, and 100 years using the three models. In the SCS model, flood zones are observed as the return period increases, with flooding occurring over the Musala Island area. These results can be attributed to the urban development project TRUD, which involved bifurcation and dredging works in the Tamazula River [43]. For return periods of 50 and 100 years, flood zones are observed upstream of the H-T-R confluence.
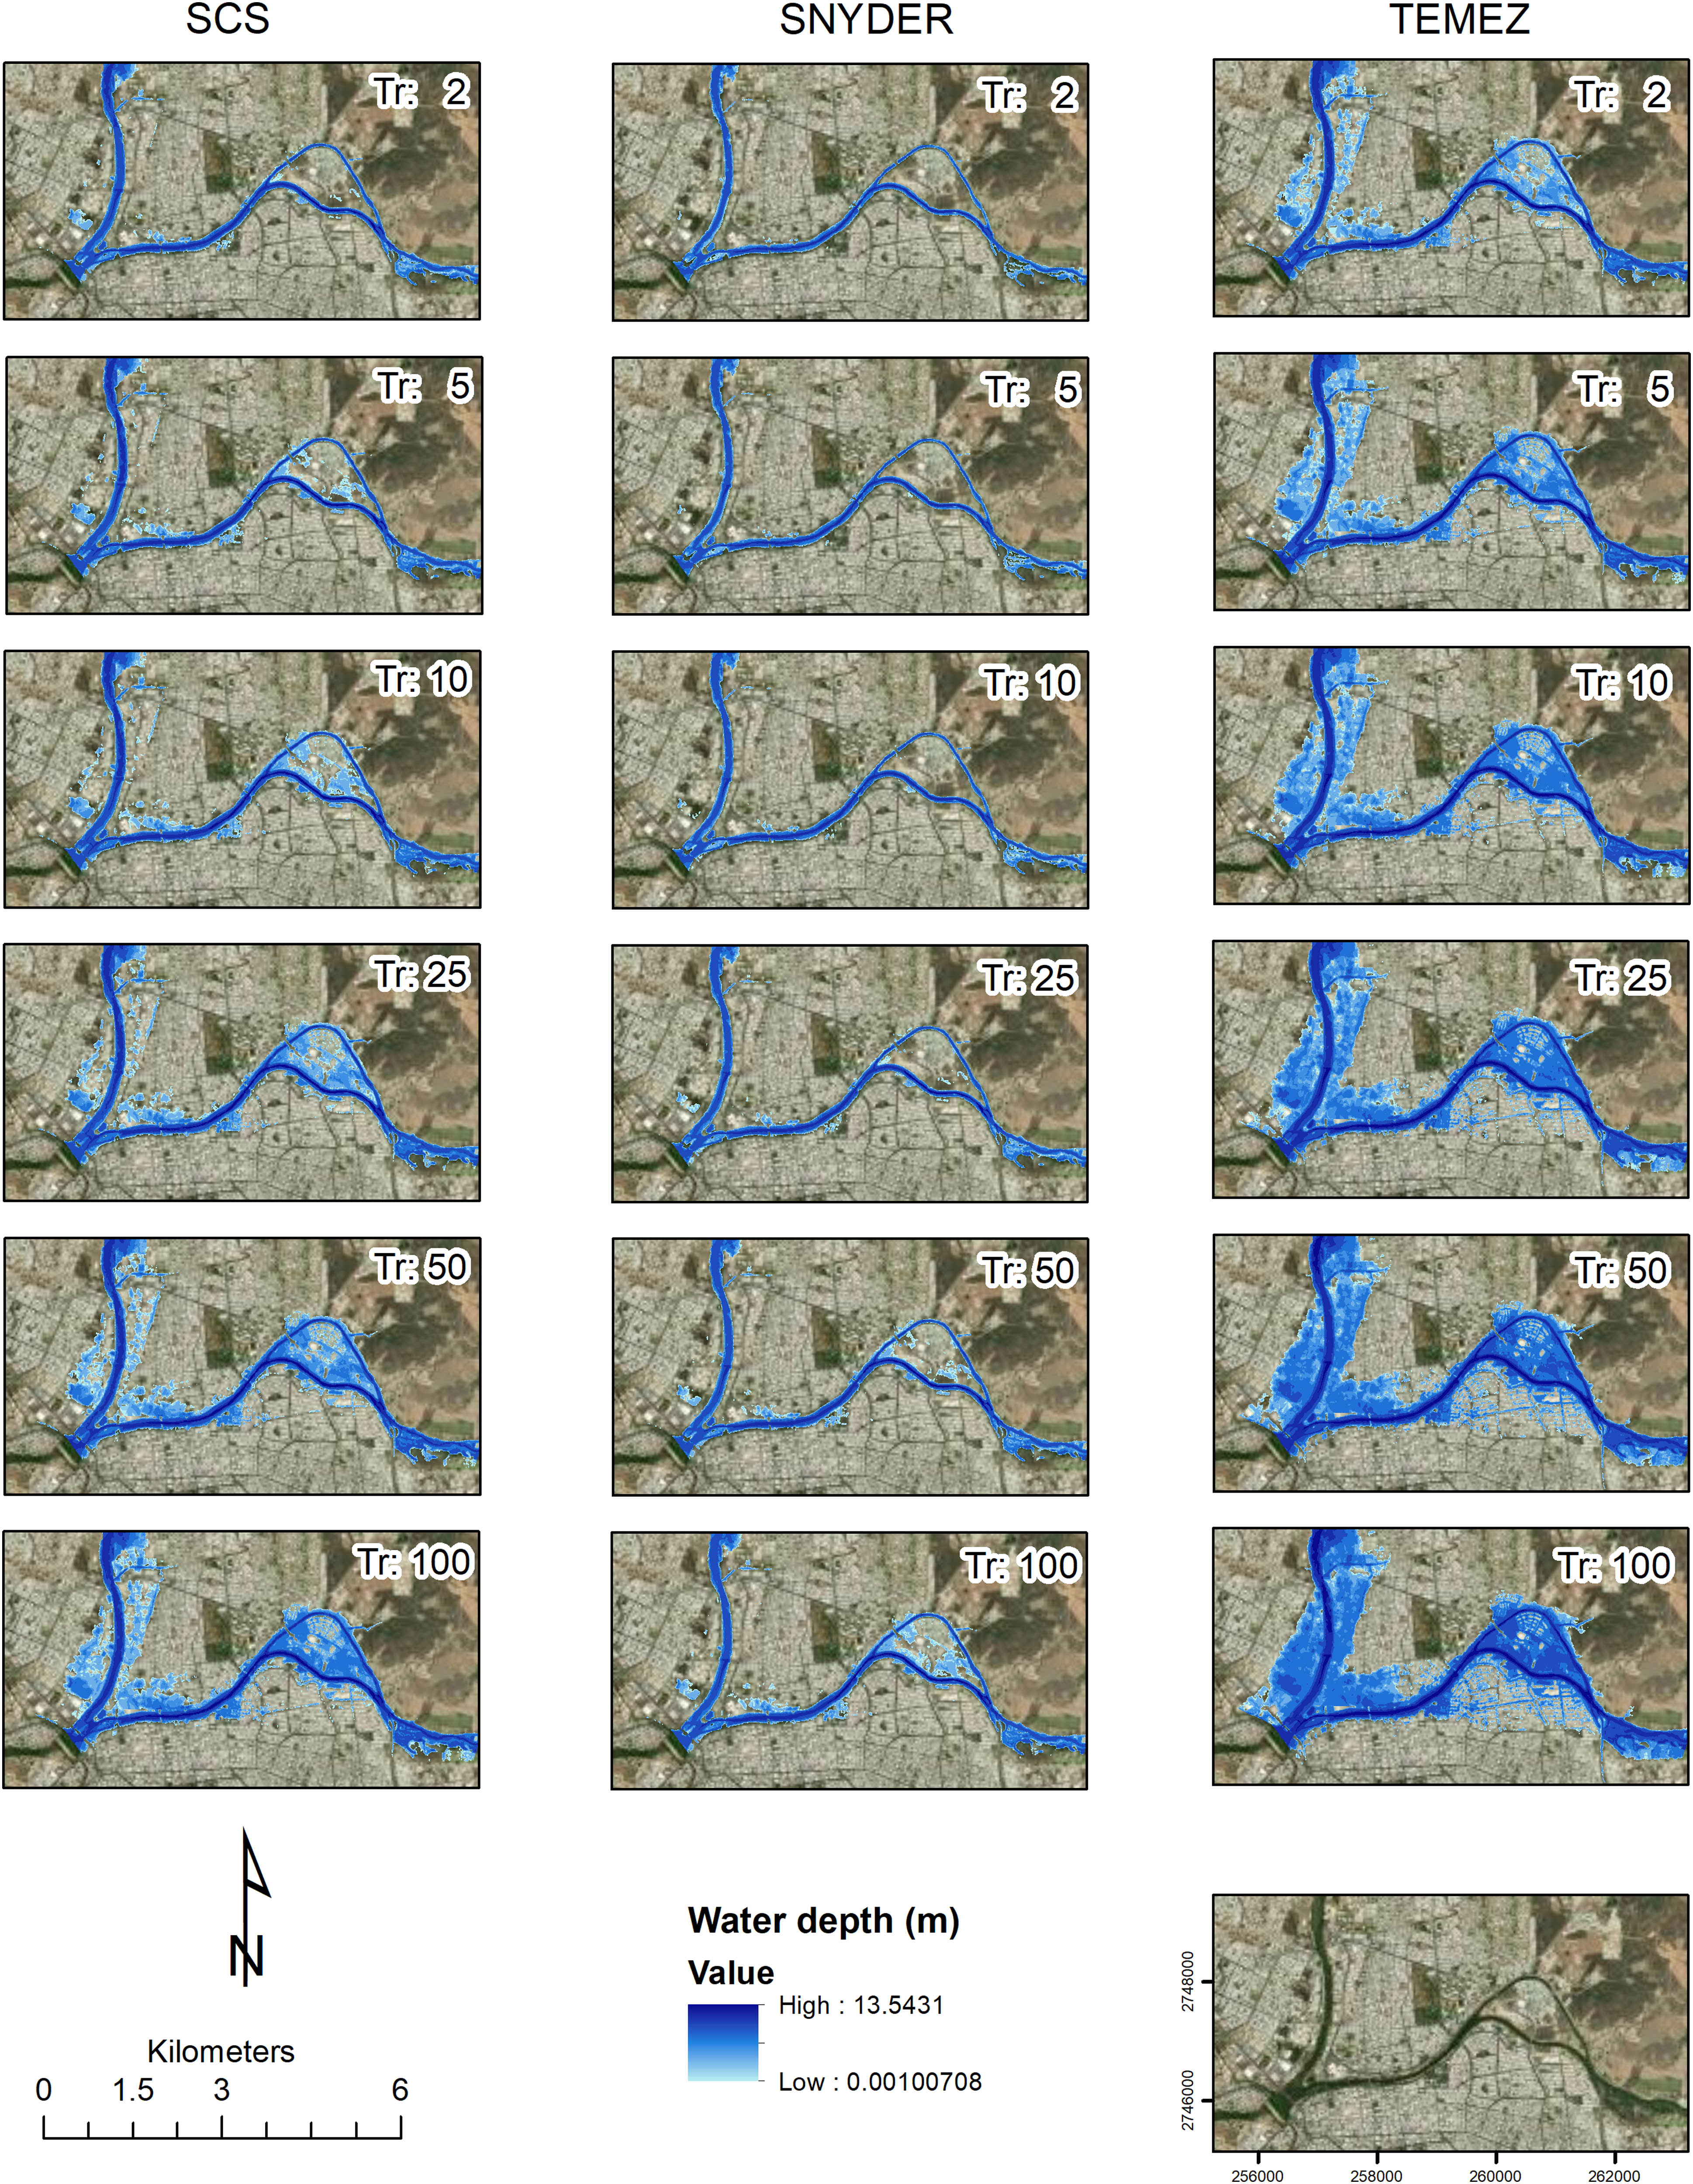
One-D flood scenario in HEC-RAS at return periods of 2, 5, 10, 25, 50 and 100 years for SCS, Snyder, and Temez models.
The Snyder model shows optimal flood hazard scenarios, with overflowing of the Tamazula River observed in the island area. However, on the other hand, the Temez model exhibits catastrophic scenarios even for return periods as low as 2 years. The minimum flood depth in the urban area is set at 1 mm. Simulated flood depths are deeper in the upstream areas, particularly upstream from the Musala Island bifurcation on the Tamazula River, with values of 11.82 m for SCS, 9.76 m for Snyder, and 13.5 m for Temez.
Flood scenarios were then simulated for both the H-T-R basins and the CR up to the diversion dam. Table 4 shows the inundation area for the three models at each return period from Tr 2 years to 100 years. The SCS model observes an increase in ratio of approximately 83%. However, for the Snyder model, the approximate accretion ratio was 90%. On the other hand, the Temez model showed an average increase of 83% in the flooded area.
Area in km2 of the floodplain of the SCS, Snyder, and Temez models for each hydrological model
| Flood area in km2 per model | |||
|---|---|---|---|
| TR | SCS | SNYDER | TEMEZ |
| 2 | 2.415 | 1.693 | 4.864 |
| 5 | 2.894 | 1.814 | 5.913 |
| 10 | 3.453 | 1.915 | 6.603 |
| 25 | 4.313 | 2.091 | 7.487 |
| 50 | 5.095 | 2.278 | 8.142 |
| 100 | 5.897 | 2.579 | 8.767 |
The performance of simulated models was evaluated from metrics σ, R 2, MAE, and RMSE. They were validated quantitatively and spatially using NSE and Kappa index, respectively. The observed flow belongs to a gauging point located upstream of the dam, at “The black bridge.” However, the readings ceased to be recorded in 1989, which allows us to evaluate the models with 1961–1989 validation data, which are presented in Table 3.
Table 5 shows the behavior of the models. The calculated results are more dispersed in the Temez model, followed by SCS, while the Snyder model presents results closer to each other. The correlation between the calculated and simulated flow shows a higher correlation with the SCS model, over the Snyder and Temez models.
Validation metrics of the evaluated models
| Model | ||||
|---|---|---|---|---|
| SCS | Snyder | Temez | ||
| Index error | σ | 583.85 | 312.40 | 1040.10 |
| R 2 | 0.97 | 0.94 | 0.94 | |
| NSE | −51.12 | 0.19 | −321.28 | |
| Kappa | 0.8534 | 0.9895 | 0.7155 | |
| MAE | 1099.06 | 114.30 | 2779.40 | |
| RMSE | 1162.44 | 144.76 | 2890.60 | |
| Accuracy | MAE % | 63.17 | 92.65 | 47.65 |
| RMSE % | 61.04 | 90.69 | 45.56 | |
The NSE shows that the Snyder model presents better predictive power over the SCS and Temez models, where its negative results suggest average as the best predictor. The Kappa index specifically, for the 100 year simulations, shows better agreement of the area flooded by the Snyder (kappa = 0.9895), SCS (kappa = 0.8534), and Temez (kappa = 0.7155) models. This reinforces the results by NSE that designate that the Snyder model is the best fit for the flood simulations in H-T and Culiacán Rivers.
Similarly, the absolute error (MAE) and RMSE are lower for the Snyder model, followed by SCS and Temez. In addition, MAE accuracy shows higher precision (92.65) for Snyder, in contrast to 63.17 and 47.65% for SCS and Temez, respectively. A similar case for RME accuracy (90.69%) for Snyder compared to 61.04 and 45.56% for SCS and Temez, respectively.
Figure 6 illustrates the geospatial validation between the Snyder model simulation and the observed flows for return periods of 2, 5, 10, 25, 50, and 100 years. The comparison demonstrates the spatial similarity between the measured precipitation values and gauging data from 1961 to 1989.
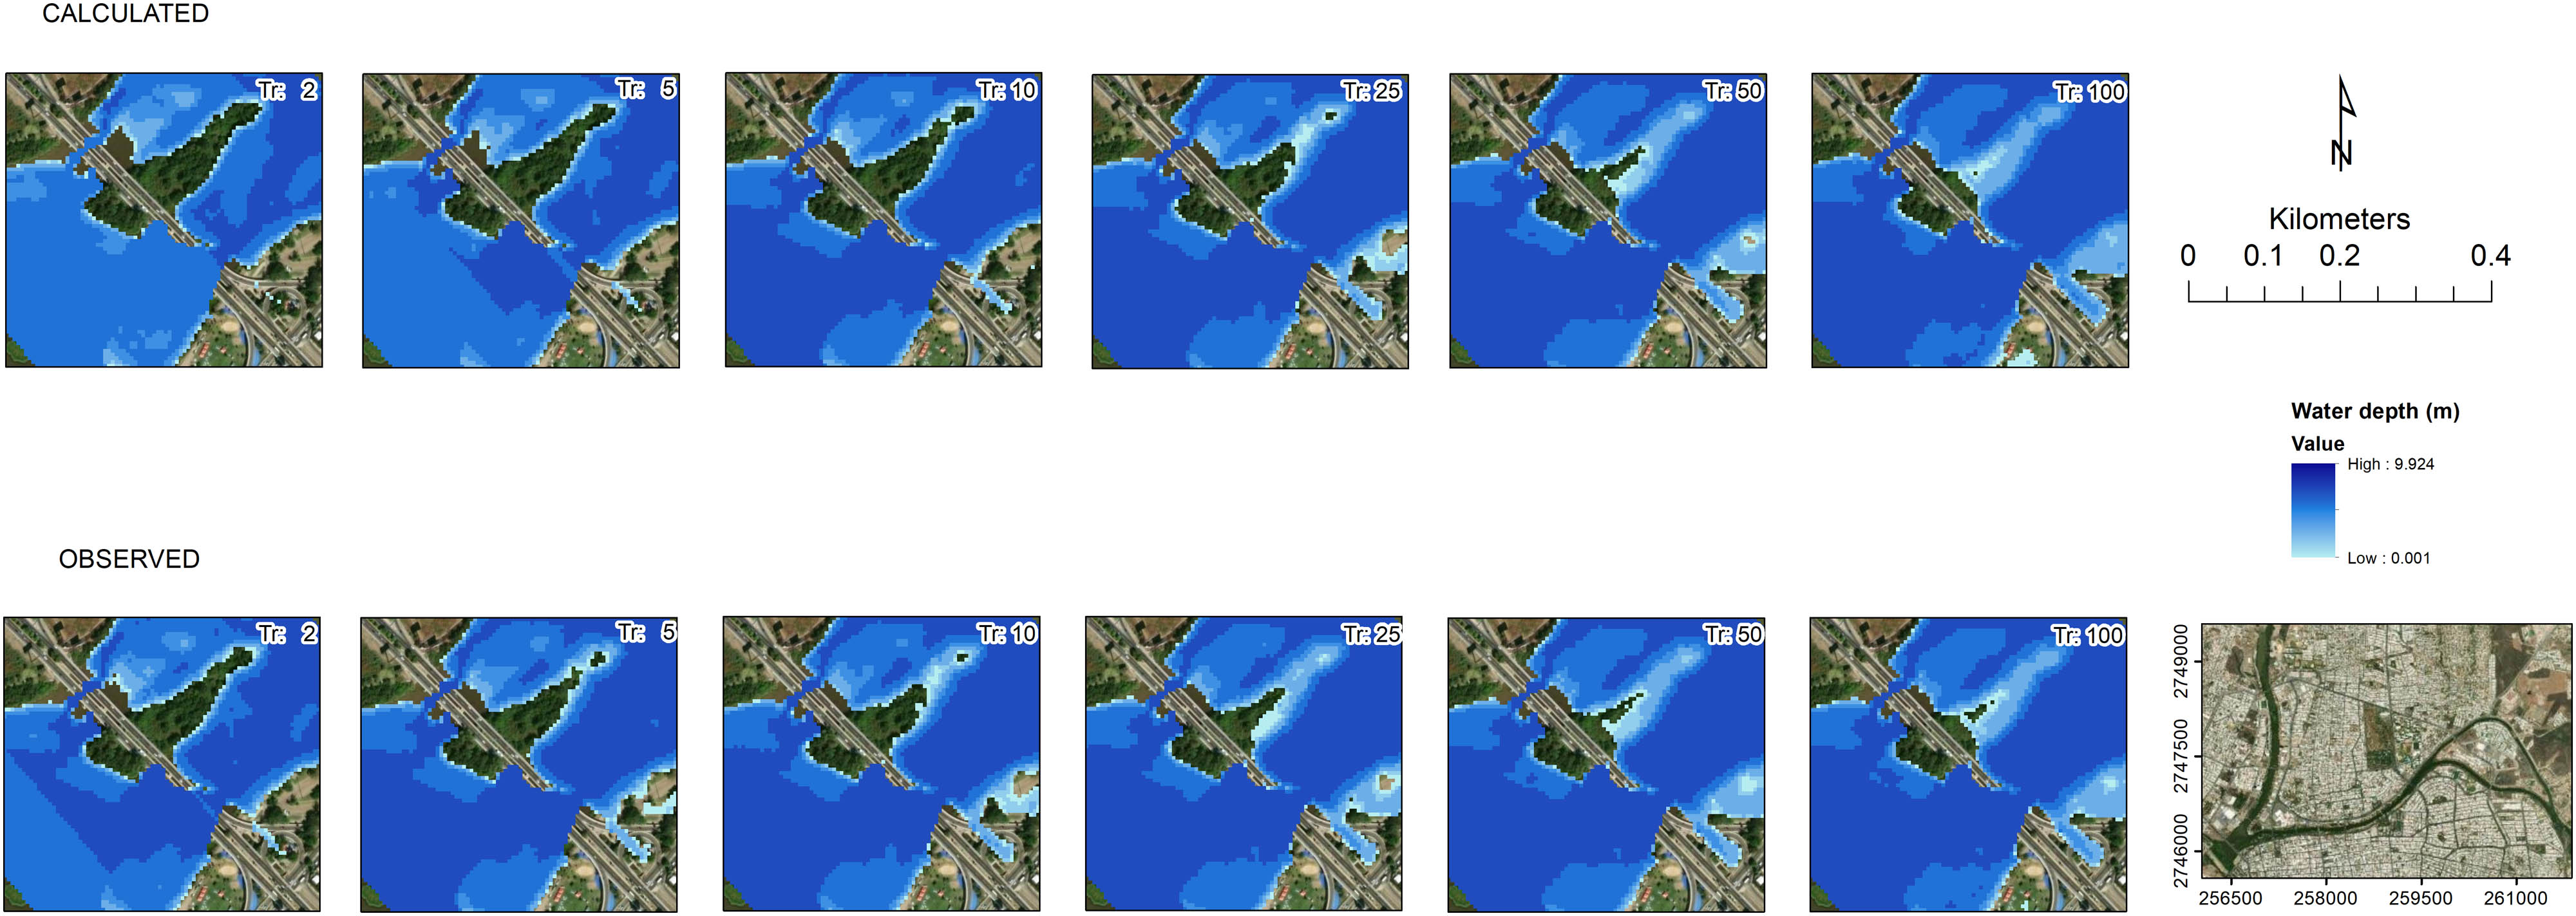
Geospatial validation between the Snyder model calculated and flow observed in 1961–1989.
The Snyder hydrograph presents a better predictive compartment of the calculated model regarding actual flow data. Table 6 shows the flow simulated by the Snyder hydrograph at return periods from precipitation values from 1961 to 1989 and from 1990 to 2018. The simulations of both precipitation sets show a correlation R 2 = 0.9998, RMSE = 122.58, and NSE = 0.947.
Flow simulation by Snyder hydrograph since 1961–1989 and 1990–2018 rain data
| TR | Flow simulates the Snyder model | |
|---|---|---|
| 1961–1989 | 1990–2018 | |
| 2 | 723.95 | 590.10 |
| 5 | 864.79 | 727.03 |
| 10 | 989.75 | 850.50 |
| 25 | 1183.92 | 1045.30 |
| 50 | 1356.53 | 1220.91 |
| 100 | 1555.14 | 1425.27 |
The predictive power of flooding was evaluated for the three models. A synthetic unit hydrographs are empirical models. The main difference between either results is the physical condition of H-T basin in comparison with the physical condition of the basins with which the models were validated.
The SCS model resembled greater similarity input characteristics to the H-T basins’ physical properties. However, it was a big area basin that accounted for the resulting overestimation of runoff for this model. Similarly, for the Temez hydrograph model, the overestimation of runoff is attributed, as well as the area, to the H-T basin’s gentle slopes, because it is the lower part of the total watershed. On the other hand, the Snyder hydrograph model was built to solve for large catchments and thus has performed better when validated with observed flow. This may indicate variations between models.
5 Conclusion
The geospatial evaluation of three hydrological models for river overflow simulation in Culiacan led to the following conclusions.
The study analyzed the temporal and spatial behavior of the hydrological models using data from the pluviometry stations 25015-Culiacan, 25033-El Varejonal, 10082-Tamazula, and 25081-Sanalona II. These stations were the only ones with continuous records, and it was enough to provide essential information for understanding the rainfall patterns in the region. Due to the behavior being similar, geospatial and temporality were among them.
The Kolmogorov–Smirnov fit evaluation indicated that the Pearson III distribution provided the best fit for the rainfall data. This distribution was found to be suitable due to the seasonal nature of precipitation, particularly during the summer season.
Three hydrological models, namely, SCS, Snyder, and Temez, were tested in the H-T-R basin. The Snyder model demonstrated a better fit in terms of statistical metrics such as σ, RMSE, NSE, and the kappa index. On the other hand, the SCS model showed the best fit in terms of R 2, while the Temez model exhibited higher overestimation for flood simulations in Culiacan City.
Flows calculated from precipitation data by HU models SCS, Snyder, and Temez presented R 2 of 0.97, 0.94, and 0.94, respectively. In addition, the NSE values of −51.12 for SCS; 0.19 for Snyder; and −312.28 for Temez. Thus suggested that Snyder hydrograph was the best runoff transformation model for large, gently sloping watersheds.
The validation of the hydraulic simulation of flooding in HEC-RAS presents the Kappa index of 0.8534, 0.9895, and 0.7155 for SCSC, Snyder, and Temez, respectively. The geospatial validation reinforces arithmetical validations, where Snyder presents a better fit.
The Hec-Ras simulation highlighted the areas of overflow in the Tamazula River, particularly near its confluence with the Humaya River and the island formed by bifurcation. These overflow zones were observed for the 100 year return period, indicating the potential flood risks in these areas.
Overall, the study provided valuable insights into the behavior of the hydrological models and their performance in simulating river overflow in Culiacan, emphasizing the importance of selecting appropriate models for accurate flood prediction and management.
Acknowledgements
The authors thank One-Stop-Shop of the General Coordination of the SMN of CONAGUA for the daily precipitation records. Facultad de Ciencias de la Tierra y del Espacio de la Universidad Autónoma de Sinaloa and CONAHCYT for grant number 701830.
-
Funding information: This research has not received external funding.
-
Author contributions: Conceptualization: E.A.A., W.P.R., and S.A.M.A. Methodology: E.A.A and W.P.R. Validation: E.A.A, W.P.R., S.A.M.A., and Y.G.Z.M. Formal analysis: E.A.A, W.P.R., and S.A.M.A. Investigation: E.A.A, W.P.R, and S.A.M.A. Resources: E.A.A, W.P.R., and S.A.M.A. Data processing: E.A.A, W.P.R, S.A.M.A., and Y.G.Z.M. Writing: E.A.A, W.P.R., and S.A.M.A. Review and editing of the draft: E.A.A, W.P.R, S.A.M.A., and Y.G.Z.M. Visualization: W.P.R., S.A.M.A., and E.A.A. Supervision: S.A.M.A. and W.P.R. All authors have read and accepted the published version of this manuscript. The authors applied the SDC approach for the sequence of authors.
-
Conflict of interest: Authors state no conflict of interest.
-
Data availability statement: The data and new data created in this study are available on request.
Appendix
Basin delimitation for the hydrological model and Thiessen polygons.
Edaphological soil and land use/land cover for the assignment of the curve number coefficient
| Land use/land cover | Humaya | Tamazula | ||||
|---|---|---|---|---|---|---|
| Soil type | GSH | CN | Soil type | GSH | CN | |
| Annual irrigated agriculture | Hh | C | 73 | Hh | C | 91 |
| Vc | C-D | 73 | ||||
| Annual seasonal agriculture | Hh | C | 85 | Hh | C | 83 |
| IC | C | 83 | IC | C | 83 | |
| Re | B | 75 | Re | B | 83 | |
| Vc | C-D | 85 | Vc | C-D | 83 | |
| Human settlements | Hh | C | 90 | Hh | C | 90 |
| IC | C | 90 | IC | C | 90 | |
| Re | B | 82 | Vc | C-D | 90 | |
| Vc | C-D | 92 | Be | C | 90 | |
| Oak forest | Re | B | 83 | |||
| Water body | IC | C | 99 | IC | C | 99 |
| Re | B | 99 | Re | B | 99 | |
| Hh | C | 99 | ||||
| Induced grassland | Hh | C | 79 | Hh | C | 79 |
| Vc | C-D | 84 | Vc | C-D | 84 | |
| Re | B | 69 | ||||
| Low caducifolious forest | IC | C | 70 | IC | C | 70 |
| Re | B | 70 | Re | B | 70 | |
| Vc | C-D | 70 | Vc | C-D | 70 | |
| Hh | C | 70 | ||||
| Be | C | 70 | ||||
| Medium subcaducifolious rainforest | Re | B | 70 | Re | B | 70 |
| No apparent vegetation | Hh | C | 94 | |||
| Re | B | 94 | ||||
| Shrubby secondary vegetation of low caducifolious forest | Hh | C | 70 | Hh | C | 70 |
| IC | C | 70 | IC | C | 70 | |
| Re | B | 70 | Re | B | 70 | |
| Vc | C-D | 70 | Vc | C-D | 70 | |
| Be | C | 70 | ||||
References
[1] López-Pérez A, Colín-García G, Martínez-Cruz TE, Manuel-Andrés YJ. Mapeo del índice de estabilidad y de saturación del suelo en la cuenca del río Huehuetán, Chiapas, mediante el modelo SINMAP. Investigaciones Geográficas. Oct. 2022;109:1–19. 10.14350/rig.60586.Suche in Google Scholar
[2] Şengül S, İspirli MN. Predicting snowmelt runoff at the source of the mountainous euphrates river basin in Turkey for water supply and flood control issues using HEC-HMS modeling. Water. 2022;14(3):1–22. 10.3390/w14030284.Suche in Google Scholar
[3] Tegos A, Ziogas A, Bellos V, Tzimas A. Forensic hydrology: A complete reconstruction of an extreme flood event in data-scarce area. Hydrology. 2022;9(5):1–19. 10.3390/hydrology9050093.Suche in Google Scholar
[4] Natarajan S, Radhakrishnan N. Flood hazard delineation in an ungauged catchment by coupling hydrologic and hydraulic models with geospatial techniques – a case study of Koraiyar basin, Tiruchirappalli City, Tamil Nadu, India. Environ Monit Assess. 2020;192(689):1–26. 10.1007/s10661-020-08650-2.Suche in Google Scholar PubMed
[5] Zotou I, Bellos V, Gkouma A, Karathanassi V, Tsihrintzis VA. Using Sentinel-1 imagery to assess predictive performance of a hydraulic model. Water Resour Manag. 2020;34(14):4415–30. 10.1007/s11269-020-02592-7.Suche in Google Scholar
[6] Abdessamed D, Abderrazak B. Coupling HEC-RAS and HEC-HMS in rainfall–runoff modeling and evaluating floodplain inundation maps in arid environments: case study of Ain Sefra city, Ksour Mountain. SW of Algeria. Environ Earth Sci. 2019;78:19. 10.1007/s12665-019-8604-6.Suche in Google Scholar
[7] Alp H, Demirel MC, Aşıkoğlu ÖL. Effect of model structure and calibration algorithm on discharge simulation in the Acisu basin, Turkey. Climate. 2022;10(12):196. 10.3390/cli10120196.Suche in Google Scholar
[8] Muñoz-Castro E, Mendoza PA. “Identificabilidad de parámetros en modelos hidrológicos GR4J: ¿somos consistentes?” en Rutas Hidrológicas Recordando a un Colega por los Senderos de la Hidrología. Chile: University of Chile; 2021. p. 33–45.Suche in Google Scholar
[9] Ávila L, Silveira R, Campos A, Rogiski N, Gonçalves J, Scortegagna A, et al. Comparative evaluation of five hydrological models in a large-scale and tropical river basin. Water. sep. 2022;14(19)):3013. 10.3390/w14193013.Suche in Google Scholar
[10] Oñate-Valdivieso F, Bosque-Sendra J, Sastre-Merlin A, Ponce VM. Calibración, validación y evaluación de un modelo hidrológico concentrado en un área montañosa al sur del Ecuador. Agrociencia. 2016;50(8):945–63. Consultado: el 24 de enero de 2023 [En línea]. http://www.scielo.org.mx/scielo.php?script=sci_arttext&pid=S1405-31952016000800945&lng=en&tlng=es.Suche in Google Scholar
[11] Salas-Martínez R, Ibáñez-Castillo LA, Arteaga-Ramírez R, Martínez-Menes MR, Fernández-Reynoso DS. Modelado hidrológico de la cuenca del Río Mixteco en el Estado de Oaxaca, México. Agrociencia. 2014;481:1–15.Suche in Google Scholar
[12] Pereira DR, Uliana EM, Martinez MA, Silva DD. Desempenho de um modelo hidrológico concentrado e de um semidistribuído na predição de vazões diárias. R_I. Jun 2018;21(2):409. 10.15809/irriga.2016v21n2p409-424.Suche in Google Scholar
[13] Vargas A, Monroy JC. Estudio del comportamiento de modelos hidrológicos bajo un análisis de sensibilidad e incertidumbre. Ingeniería de Recur Naturales y del Ambiente. 2011;10:65–77.Suche in Google Scholar
[14] Pizarro-Tapia R, Balocchi-Contreras F, Andrade-Vilaró F, Sangüesa-Pool C, Vargas-Baecheler J, Morales-Calderón C, et al. Comparative analysis of three synthetic unit hydrographs in two Mediterranean watersheds in the Maule region of Chile. rchscfa. abr 2014;20(1):5–20. 10.5154/r.rchscfa.2012.09.054.Suche in Google Scholar
[15] Quiroga VM, Kurea S, Udoa K, Manoa A. Application of 2D numerical simulation for the analysis of the February 2014 Bolivian Amazonia flood: Application of the new HEC-RAS version 5. Ribagua. 2016;3(1):25–33. 10.1016/j.riba.2015.12.001 Suche in Google Scholar
[16] Ongdas N, Akiyanova F, Karakulov Y, Muratbayeva A, Zinabdin N. Application of hec-ras (2d) for flood hazard maps generation for Yesil (Ishim) river in Kazakhstan. Water (Switz). 2020;12(10):1–20. 10.3390/w12102672 Suche in Google Scholar
[17] Elkhrachy I, Pham QB, Costache R, Mohajane M, Rahman KU, Shahabi H, et al. Sentinel-1 remote sensing data and Hydrologic Engineering Centres River Analysis System two-dimensional integration for flash flood detection and modelling in New Cairo City, Egypt. J Flood Risk Manag. 2021;14(2):e12692. 10.1111/jfr3.12692 Suche in Google Scholar
[18] Íñiguez-Ayón YP, Peña-Salmón CÁ, Sicairos-Avitia SE. Ecosistema fluvial urbano: evaluación ecológica y visual del río Tamazula en la ciudad de Culiacán, Sinaloa. Quivera Rev de Estudios Territoriales. 2015;17(1):75–97.Suche in Google Scholar
[19] (CONAGUA) Comisión Nacional del Agua, “Información Estadística Climatológica”. el 14 de diciembre de 2018. [En línea]. Disponible en: https://smn.conagua.gob.mx/es/climatologia/informacion-climatologica/informacion-estadistica-climatologica.Suche in Google Scholar
[20] (CONAGUA) Comisión Nacional del Agua, “Banco Nacional de Datos de Aguas Superficiales (BANDAS).” el 25 de abril de 2017. [En línea]. Disponible en: https://app.conagua.gob.mx/bandas/.Suche in Google Scholar
[21] (INEGI) Instituto Nacional de Estadística y Geografía, “Modelo digital de elevación tipo superficie con 5m de resolución derivado de datos de sensores remotos satelitales y aerotransportados”, 2017. [En línea]. Disponible en: https://www.inegi.org.mx/app/biblioteca/ficha.html?upc=889463621195.Suche in Google Scholar
[22] (INEGI) Instituto Nacional de Estadística y Geografía, “Conjunto de datos vectorial edafológico (Serie II).” Instituto Nacional de Estadística y Geografía, 2006. [En línea]. Disponible en: https://www.inegi.org.mx/temas/edafologia/.Suche in Google Scholar
[23] (INEGI) Instituto Nacional de Estadística y Geografía, “Conjunto Nacional de Información de Uso del Suelo y Vegetación (Serie VII),” Instituto Nacional de Estadística y Geografía, 2020. [En línea]. Disponible en: https://www.inegi.org.mx/temas/usosuelo/.Suche in Google Scholar
[24] Gutiérrez Lozano J, Vargas Tristán V, Romero Rodríguez M, Plácido de la Cruz JM, Aguirre Bortoni MD, Silva Espinoza HT. Periodos de retorno de lluvias torrenciales para el estado de Tamaulipas, México. Investigaciones geográficas. 2011;76:20–33.10.14350/rig.29871Suche in Google Scholar
[25] Hidalgo-Mayo A, Hernández-Orozco N, Perigó-Román E. Períodos de retorno para las inundaciones costeras y los eventos extremos de viento y oleaje en la costa nororiental de Cuba. Rev Cubana de Meteorología. 2019;25(2):191–202.Suche in Google Scholar
[26] Rentería-Guevara SA, Rangel-Peraza JG, Rodríguez-Mata AE, Amábilis-Sosa LE, Sanhouse-García AJ, Uriarte-Aceves PM. Effect of agricultural and urban infrastructure on river basin delineation and surface water availability: Case of the Culiacan River Basin. Hydrology. 2019;6(3):58. 10.3390/HYDROLOGY6030058 Suche in Google Scholar
[27] Uribe-Alcántara EM, Montes-León MAL, García-Celis E. Mapa Nacional de Índice de Inundación. Tecnología y Cienc del agua. 2010;1(2):73–85.Suche in Google Scholar
[28] Chow V, Maidment D, Mays L, Hidrología aplicada; 1994. [En línea]. Disponible en: http://bases.bireme.br/cgi-bin/wxislind.exe/iah/online/?IsisScript=iah/iah.xis&src=google&base=REPIDISCA&lang=p&nextAction=lnk&exprSearch=158911&indexSearch=ID%5Cnhttp://www.sidalc.net/cgi-bin/wxis.exe/?IsisScript=BINAI.xis&method=post&formato=2&cantidad =.Suche in Google Scholar
[29] Vargas Garay L, Torres Goyeneche OD, Carrillo Soto GA. Evaluation of SCS - unit hydrograph model to estimate peak flows in watersheds of Norte de Santander. Respuestas. 2019;24(1):6–15. 10.22463/0122820X.1743.Suche in Google Scholar
[30] Rincón JC. Análisis del ajuste, sensibilidad e incertidumbre de los parámetros del modelo del SCS. Bogotá, Colombia: Pontifica Universidad Javeriana; 2010. p. 157.Suche in Google Scholar
[31] Namara WG, Damisse TA, Tufa FG. Application of HEC-RAS and HEC-GeoRAS model for Flood Inundation Mapping, the case of Awash Bello Flood Plain, Upper Awash River Basin, Oromiya Regional State, Ethiopia. Model Earth Syst Env. Jun 2022;8(2):1449–60. 10.1007/s40808-021-01166-9.Suche in Google Scholar
[32] Shustikova I, Domeneghetti A, Neal JC, Bates P, Castellarin A. Comparing 2D capabilities of HEC-RAS and LISFLOOD-FP on complex topography. Hydrological Sci J. 2019;64(14):1769–82. 10.1080/02626667.2019.1671982.Suche in Google Scholar
[33] Barón HI, Bedoya SJ, Mejía G. Métodos de estimación y análisis de incertidumbre en inundaciones: Una revisión sistemática de la literatura publicada entre 1985 y 2016. en Desarrollo e innovación en ingeniería. 2nd edn. Medellín-Antioquia: Editorial Instituto Antioqueño de Investigac; 2017.Suche in Google Scholar
[34] Núñez López D, Treviño Garza EJ, Reyes Gómez VM, Muñoz Robles CA, Aguirre Calderón OA, Jiménez Pérez J. Uso de modelos de regresión para interpolar espacialmente la precipitación media mensual en la cuenca del río Conchos. Rev Mexicana de Cienc Agrícolas. 2014;5(2):201–13.10.29312/remexca.v5i2.960Suche in Google Scholar
[35] Walpole RE, Myers RH, Myers SL, Ye K. Probability & statistics for engineers & scientists. Vol. 9. Pearson: United States of America; 2012. p. 813.Suche in Google Scholar
[36] Wang X, Ding Y, Zhao C, Wang J. Validation of TRMM 3B42V7 rainfall product under complex topographic and climatic conditions over Hexi region in the Northwest Arid Region of China. Water (Switz). 2018;10:8. 10.3390/w10081006.Suche in Google Scholar
[37] Coaquira Y. Análisis comparativo de precipitaciones medias mensuales, utilizando datos de satélite TRMM y estaciones meteorológicas en la cuenca Huancané-Puno. Perú: Universidad Nacional del altiplano; 2018. p. 254.Suche in Google Scholar
[38] Coy-Muricia LC. Ajuste y validación del modelo precipitación – escorrentía GR2M maplicado a la subcuenca nevado. En línea: Universidad de Santo Tomás; 2017. p. 11.Suche in Google Scholar
[39] Rojas Briceño NB, Barboza Castillo E, Maicelo Quintana JL, Oliva Cruz SM, Salas López R. Deforestación en la Amazonía peruana: índices de cambios de cobertura y uso del suelo basado en SIG. BAGE. 2019;81:1–34. 10.21138/bage.2538a.Suche in Google Scholar
[40] Painho M, Caeiro S. Assessment of map similarity of categorical maps using kappa statistics. ISEGI. 2002.Suche in Google Scholar
[41] Aispuro Angulo A, Cordero Domínguez JD. La vulnerabilidad del desarrollo urbano de Culiacán, Sinaloa, México. Proyección. 2013;7(15):135–57.Suche in Google Scholar
[42] Rodríguez Esteves JM. Los desastres recurrentes en México: El huracán Pauline y la tormenta Manuel en Acapulco, Guerrero. Disertaciones. Jun 2017;10(2):133. 10.12804/revistas.urosario.edu.co/disertaciones/a.4778.Suche in Google Scholar
[43] (SEMARNAT) Secretaría de Medio Ambiente, “Recursos Naturales, Resumen de Manifestación de Impacto Ambiental. Proyecto de Mantenimiento hidráulico de los Ríos: Humaya, Tamazula y Culiacán. Desarrollo Urbano Tres Ríos. Culiacán Sinaloa; 2006. [En línea]. Disponible en: http://sinat.semarnat.gob.mx/dgiraDocs/documentos/sin/resumenes/2006/25SI2006HD063.pdf.Suche in Google Scholar
© 2023 the author(s), published by De Gruyter
This work is licensed under the Creative Commons Attribution 4.0 International License.
Artikel in diesem Heft
- Regular Articles
- Diagenesis and evolution of deep tight reservoirs: A case study of the fourth member of Shahejie Formation (cg: 50.4-42 Ma) in Bozhong Sag
- Petrography and mineralogy of the Oligocene flysch in Ionian Zone, Albania: Implications for the evolution of sediment provenance and paleoenvironment
- Biostratigraphy of the Late Campanian–Maastrichtian of the Duwi Basin, Red Sea, Egypt
- Structural deformation and its implication for hydrocarbon accumulation in the Wuxia fault belt, northwestern Junggar basin, China
- Carbonate texture identification using multi-layer perceptron neural network
- Metallogenic model of the Hongqiling Cu–Ni sulfide intrusions, Central Asian Orogenic Belt: Insight from long-period magnetotellurics
- Assessments of recent Global Geopotential Models based on GPS/levelling and gravity data along coastal zones of Egypt
- Accuracy assessment and improvement of SRTM, ASTER, FABDEM, and MERIT DEMs by polynomial and optimization algorithm: A case study (Khuzestan Province, Iran)
- Uncertainty assessment of 3D geological models based on spatial diffusion and merging model
- Evaluation of dynamic behavior of varved clays from the Warsaw ice-dammed lake, Poland
- Impact of AMSU-A and MHS radiances assimilation on Typhoon Megi (2016) forecasting
- Contribution to the building of a weather information service for solar panel cleaning operations at Diass plant (Senegal, Western Sahel)
- Measuring spatiotemporal accessibility to healthcare with multimodal transport modes in the dynamic traffic environment
- Mathematical model for conversion of groundwater flow from confined to unconfined aquifers with power law processes
- NSP variation on SWAT with high-resolution data: A case study
- Reconstruction of paleoglacial equilibrium-line altitudes during the Last Glacial Maximum in the Diancang Massif, Northwest Yunnan Province, China
- A prediction model for Xiangyang Neolithic sites based on a random forest algorithm
- Determining the long-term impact area of coastal thermal discharge based on a harmonic model of sea surface temperature
- Origin of block accumulations based on the near-surface geophysics
- Investigating the limestone quarries as geoheritage sites: Case of Mardin ancient quarry
- Population genetics and pedigree geography of Trionychia japonica in the four mountains of Henan Province and the Taihang Mountains
- Performance audit evaluation of marine development projects based on SPA and BP neural network model
- Study on the Early Cretaceous fluvial-desert sedimentary paleogeography in the Northwest of Ordos Basin
- Detecting window line using an improved stacked hourglass network based on new real-world building façade dataset
- Automated identification and mapping of geological folds in cross sections
- Silicate and carbonate mixed shelf formation and its controlling factors, a case study from the Cambrian Canglangpu formation in Sichuan basin, China
- Ground penetrating radar and magnetic gradient distribution approach for subsurface investigation of solution pipes in post-glacial settings
- Research on pore structures of fine-grained carbonate reservoirs and their influence on waterflood development
- Risk assessment of rain-induced debris flow in the lower reaches of Yajiang River based on GIS and CF coupling models
- Multifractal analysis of temporal and spatial characteristics of earthquakes in Eurasian seismic belt
- Surface deformation and damage of 2022 (M 6.8) Luding earthquake in China and its tectonic implications
- Differential analysis of landscape patterns of land cover products in tropical marine climate zones – A case study in Malaysia
- DEM-based analysis of tectonic geomorphologic characteristics and tectonic activity intensity of the Dabanghe River Basin in South China Karst
- Distribution, pollution levels, and health risk assessment of heavy metals in groundwater in the main pepper production area of China
- Study on soil quality effect of reconstructing by Pisha sandstone and sand soil
- Understanding the characteristics of loess strata and quaternary climate changes in Luochuan, Shaanxi Province, China, through core analysis
- Dynamic variation of groundwater level and its influencing factors in typical oasis irrigated areas in Northwest China
- Creating digital maps for geotechnical characteristics of soil based on GIS technology and remote sensing
- Changes in the course of constant loading consolidation in soil with modeled granulometric composition contaminated with petroleum substances
- Correlation between the deformation of mineral crystal structures and fault activity: A case study of the Yingxiu-Beichuan fault and the Milin fault
- Cognitive characteristics of the Qiang religious culture and its influencing factors in Southwest China
- Spatiotemporal variation characteristics analysis of infrastructure iron stock in China based on nighttime light data
- Interpretation of aeromagnetic and remote sensing data of Auchi and Idah sheets of the Benin-arm Anambra basin: Implication of mineral resources
- Building element recognition with MTL-AINet considering view perspectives
- Characteristics of the present crustal deformation in the Tibetan Plateau and its relationship with strong earthquakes
- Influence of fractures in tight sandstone oil reservoir on hydrocarbon accumulation: A case study of Yanchang Formation in southeastern Ordos Basin
- Nutrient assessment and land reclamation in the Loess hills and Gulch region in the context of gully control
- Handling imbalanced data in supervised machine learning for lithological mapping using remote sensing and airborne geophysical data
- Spatial variation of soil nutrients and evaluation of cultivated land quality based on field scale
- Lignin analysis of sediments from around 2,000 to 1,000 years ago (Jiulong River estuary, southeast China)
- Assessing OpenStreetMap roads fitness-for-use for disaster risk assessment in developing countries: The case of Burundi
- Transforming text into knowledge graph: Extracting and structuring information from spatial development plans
- A symmetrical exponential model of soil temperature in temperate steppe regions of China
- A landslide susceptibility assessment method based on auto-encoder improved deep belief network
- Numerical simulation analysis of ecological monitoring of small reservoir dam based on maximum entropy algorithm
- Morphometry of the cold-climate Bory Stobrawskie Dune Field (SW Poland): Evidence for multi-phase Lateglacial aeolian activity within the European Sand Belt
- Adopting a new approach for finding missing people using GIS techniques: A case study in Saudi Arabia’s desert area
- Geological earthquake simulations generated by kinematic heterogeneous energy-based method: Self-arrested ruptures and asperity criterion
- Semi-automated classification of layered rock slopes using digital elevation model and geological map
- Geochemical characteristics of arc fractionated I-type granitoids of eastern Tak Batholith, Thailand
- Lithology classification of igneous rocks using C-band and L-band dual-polarization SAR data
- Analysis of artificial intelligence approaches to predict the wall deflection induced by deep excavation
- Evaluation of the current in situ stress in the middle Permian Maokou Formation in the Longnüsi area of the central Sichuan Basin, China
- Utilizing microresistivity image logs to recognize conglomeratic channel architectural elements of Baikouquan Formation in slope of Mahu Sag
- Resistivity cutoff of low-resistivity and low-contrast pays in sandstone reservoirs from conventional well logs: A case of Paleogene Enping Formation in A-Oilfield, Pearl River Mouth Basin, South China Sea
- Examining the evacuation routes of the sister village program by using the ant colony optimization algorithm
- Spatial objects classification using machine learning and spatial walk algorithm
- Study on the stabilization mechanism of aeolian sandy soil formation by adding a natural soft rock
- Bump feature detection of the road surface based on the Bi-LSTM
- The origin and evolution of the ore-forming fluids at the Manondo-Choma gold prospect, Kirk range, southern Malawi
- A retrieval model of surface geochemistry composition based on remotely sensed data
- Exploring the spatial dynamics of cultural facilities based on multi-source data: A case study of Nanjing’s art institutions
- Study of pore-throat structure characteristics and fluid mobility of Chang 7 tight sandstone reservoir in Jiyuan area, Ordos Basin
- Study of fracturing fluid re-discharge based on percolation experiments and sampling tests – An example of Fuling shale gas Jiangdong block, China
- Impacts of marine cloud brightening scheme on climatic extremes in the Tibetan Plateau
- Ecological protection on the West Coast of Taiwan Strait under economic zone construction: A case study of land use in Yueqing
- The time-dependent deformation and damage constitutive model of rock based on dynamic disturbance tests
- Evaluation of spatial form of rural ecological landscape and vulnerability of water ecological environment based on analytic hierarchy process
- Fingerprint of magma mixture in the leucogranites: Spectroscopic and petrochemical approach, Kalebalta-Central Anatolia, Türkiye
- Principles of self-calibration and visual effects for digital camera distortion
- UAV-based doline mapping in Brazilian karst: A cave heritage protection reconnaissance
- Evaluation and low carbon ecological urban–rural planning and construction based on energy planning mechanism
- Modified non-local means: A novel denoising approach to process gravity field data
- A novel travel route planning method based on an ant colony optimization algorithm
- Effect of time-variant NDVI on landside susceptibility: A case study in Quang Ngai province, Vietnam
- Regional tectonic uplift indicated by geomorphological parameters in the Bahe River Basin, central China
- Computer information technology-based green excavation of tunnels in complex strata and technical decision of deformation control
- Spatial evolution of coastal environmental enterprises: An exploration of driving factors in Jiangsu Province
- A comparative assessment and geospatial simulation of three hydrological models in urban basins
- Aquaculture industry under the blue transformation in Jiangsu, China: Structure evolution and spatial agglomeration
- Quantitative and qualitative interpretation of community partitions by map overlaying and calculating the distribution of related geographical features
- Numerical investigation of gravity-grouted soil-nail pullout capacity in sand
- Analysis of heavy pollution weather in Shenyang City and numerical simulation of main pollutants
- Road cut slope stability analysis for static and dynamic (pseudo-static analysis) loading conditions
- Forest biomass assessment combining field inventorying and remote sensing data
- Late Jurassic Haobugao granites from the southern Great Xing’an Range, NE China: Implications for postcollision extension of the Mongol–Okhotsk Ocean
- Petrogenesis of the Sukadana Basalt based on petrology and whole rock geochemistry, Lampung, Indonesia: Geodynamic significances
- Numerical study on the group wall effect of nodular diaphragm wall foundation in high-rise buildings
- Water resources utilization and tourism environment assessment based on water footprint
- Geochemical evaluation of the carbonaceous shale associated with the Permian Mikambeni Formation of the Tuli Basin for potential gas generation, South Africa
- Detection and characterization of lineaments using gravity data in the south-west Cameroon zone: Hydrogeological implications
- Study on spatial pattern of tourism landscape resources in county cities of Yangtze River Economic Belt
- The effect of weathering on drillability of dolomites
- Noise masking of near-surface scattering (heterogeneities) on subsurface seismic reflectivity
- Query optimization-oriented lateral expansion method of distributed geological borehole database
- Petrogenesis of the Morobe Granodiorite and their shoshonitic mafic microgranular enclaves in Maramuni arc, Papua New Guinea
- Environmental health risk assessment of urban water sources based on fuzzy set theory
- Spatial distribution of urban basic education resources in Shanghai: Accessibility and supply-demand matching evaluation
- Spatiotemporal changes in land use and residential satisfaction in the Huai River-Gaoyou Lake Rim area
- Walkaway vertical seismic profiling first-arrival traveltime tomography with velocity structure constraints
- Study on the evaluation system and risk factor traceability of receiving water body
- Predicting copper-polymetallic deposits in Kalatag using the weight of evidence model and novel data sources
- Temporal dynamics of green urban areas in Romania. A comparison between spatial and statistical data
- Passenger flow forecast of tourist attraction based on MACBL in LBS big data environment
- Varying particle size selectivity of soil erosion along a cultivated catena
- Relationship between annual soil erosion and surface runoff in Wadi Hanifa sub-basins
- Influence of nappe structure on the Carboniferous volcanic reservoir in the middle of the Hongche Fault Zone, Junggar Basin, China
- Dynamic analysis of MSE wall subjected to surface vibration loading
- Pre-collisional architecture of the European distal margin: Inferences from the high-pressure continental units of central Corsica (France)
- The interrelation of natural diversity with tourism in Kosovo
- Assessment of geosites as a basis for geotourism development: A case study of the Toplica District, Serbia
- IG-YOLOv5-based underwater biological recognition and detection for marine protection
- Monitoring drought dynamics using remote sensing-based combined drought index in Ergene Basin, Türkiye
- Review Articles
- The actual state of the geodetic and cartographic resources and legislation in Poland
- Evaluation studies of the new mining projects
- Comparison and significance of grain size parameters of the Menyuan loess calculated using different methods
- Scientometric analysis of flood forecasting for Asia region and discussion on machine learning methods
- Rainfall-induced transportation embankment failure: A review
- Rapid Communication
- Branch fault discovered in Tangshan fault zone on the Kaiping-Guye boundary, North China
- Technical Note
- Introducing an intelligent multi-level retrieval method for mineral resource potential evaluation result data
- Erratum
- Erratum to “Forest cover assessment using remote-sensing techniques in Crete Island, Greece”
- Addendum
- The relationship between heat flow and seismicity in global tectonically active zones
- Commentary
- Improved entropy weight methods and their comparisons in evaluating the high-quality development of Qinghai, China
- Special Issue: Geoethics 2022 - Part II
- Loess and geotourism potential of the Braničevo District (NE Serbia): From overexploitation to paleoclimate interpretation